-
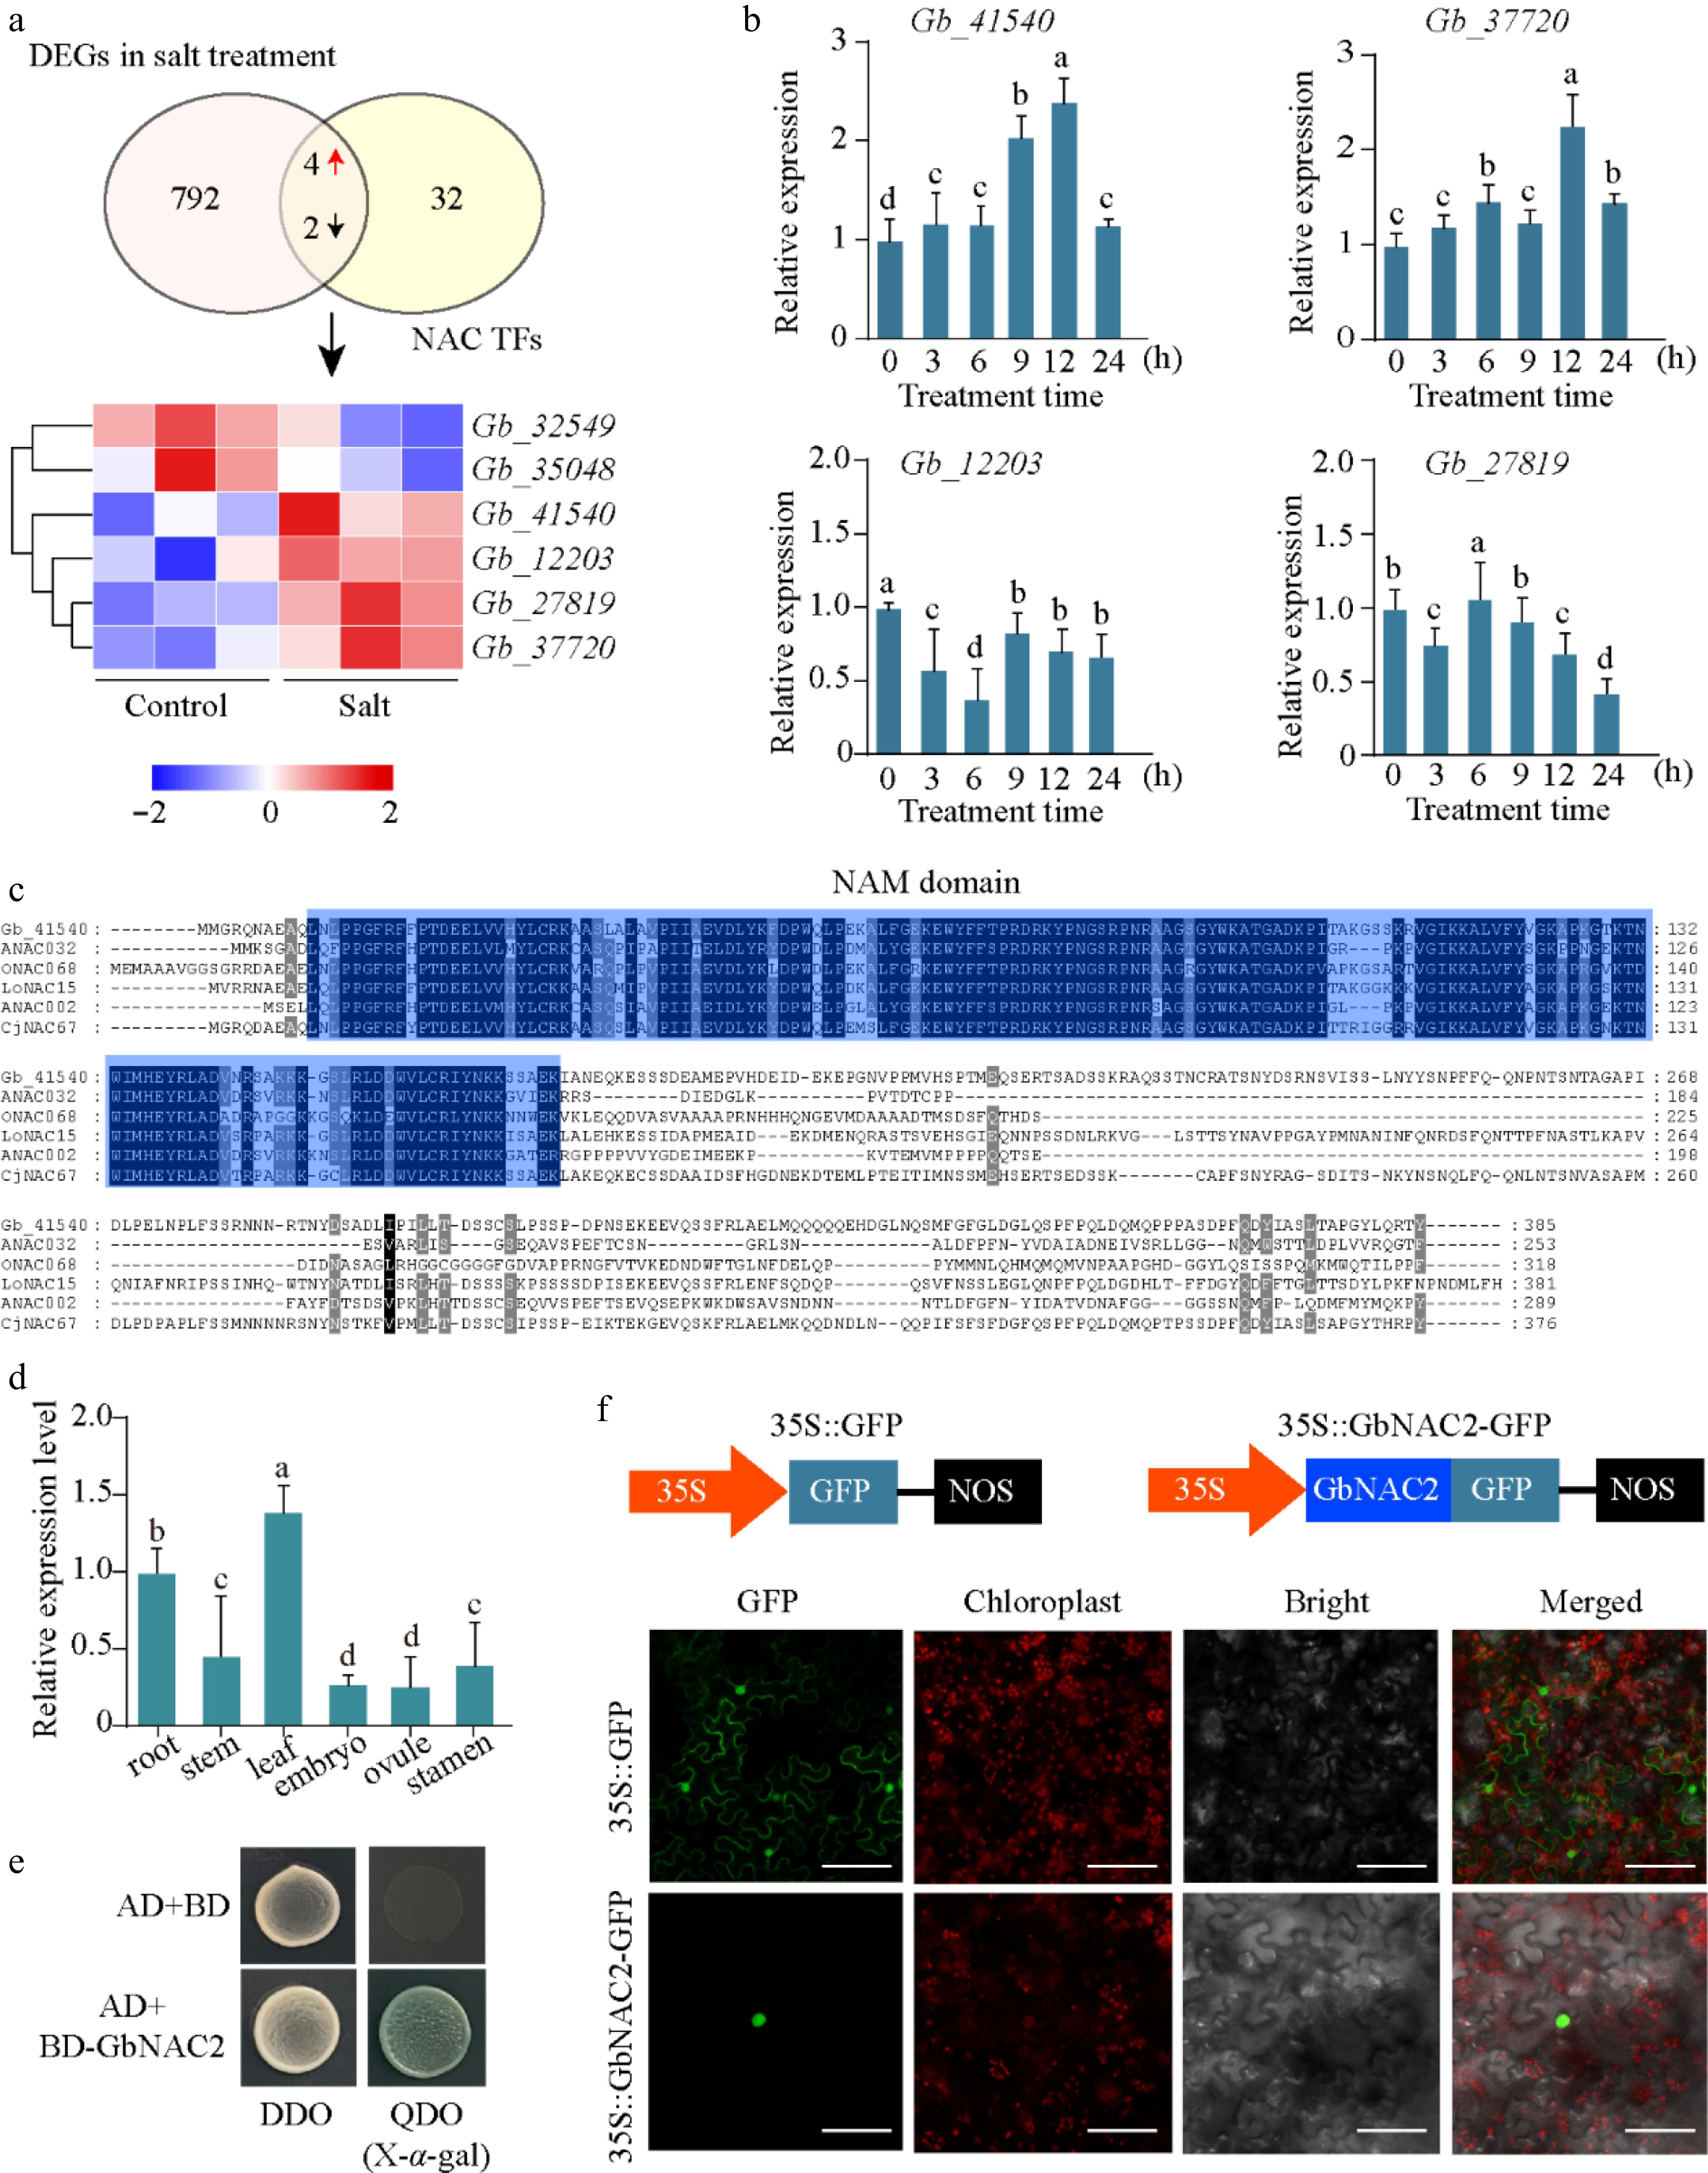
Figure 1.
Identification of key NAC TFs. (a) Overlap analysis of NAC genes in G. biloba and DEGs under salt stress transcriptome. The FPKM value of six key NACs following salt treatment are depicted in a heatmap (red represents upregulated, and blue represents downregulated). (b) The relative expression of four NAC genes at different time points following salt treatment was quantified using qPCR. (c) Sequence analysis of GbNAC2 and other NAC TFs from different plant species. (d) The spatial-temporal expression of GbNAC2 in different issues in ginkgo. (e) Analysis of transcriptional activation activity of GbNAC2. (f) Subcellular localization of the GbNAC2 protein. Scale bar = 10 μm. Different letters indicate significant differences (one-way analysis of variance, p < 0.05).
-
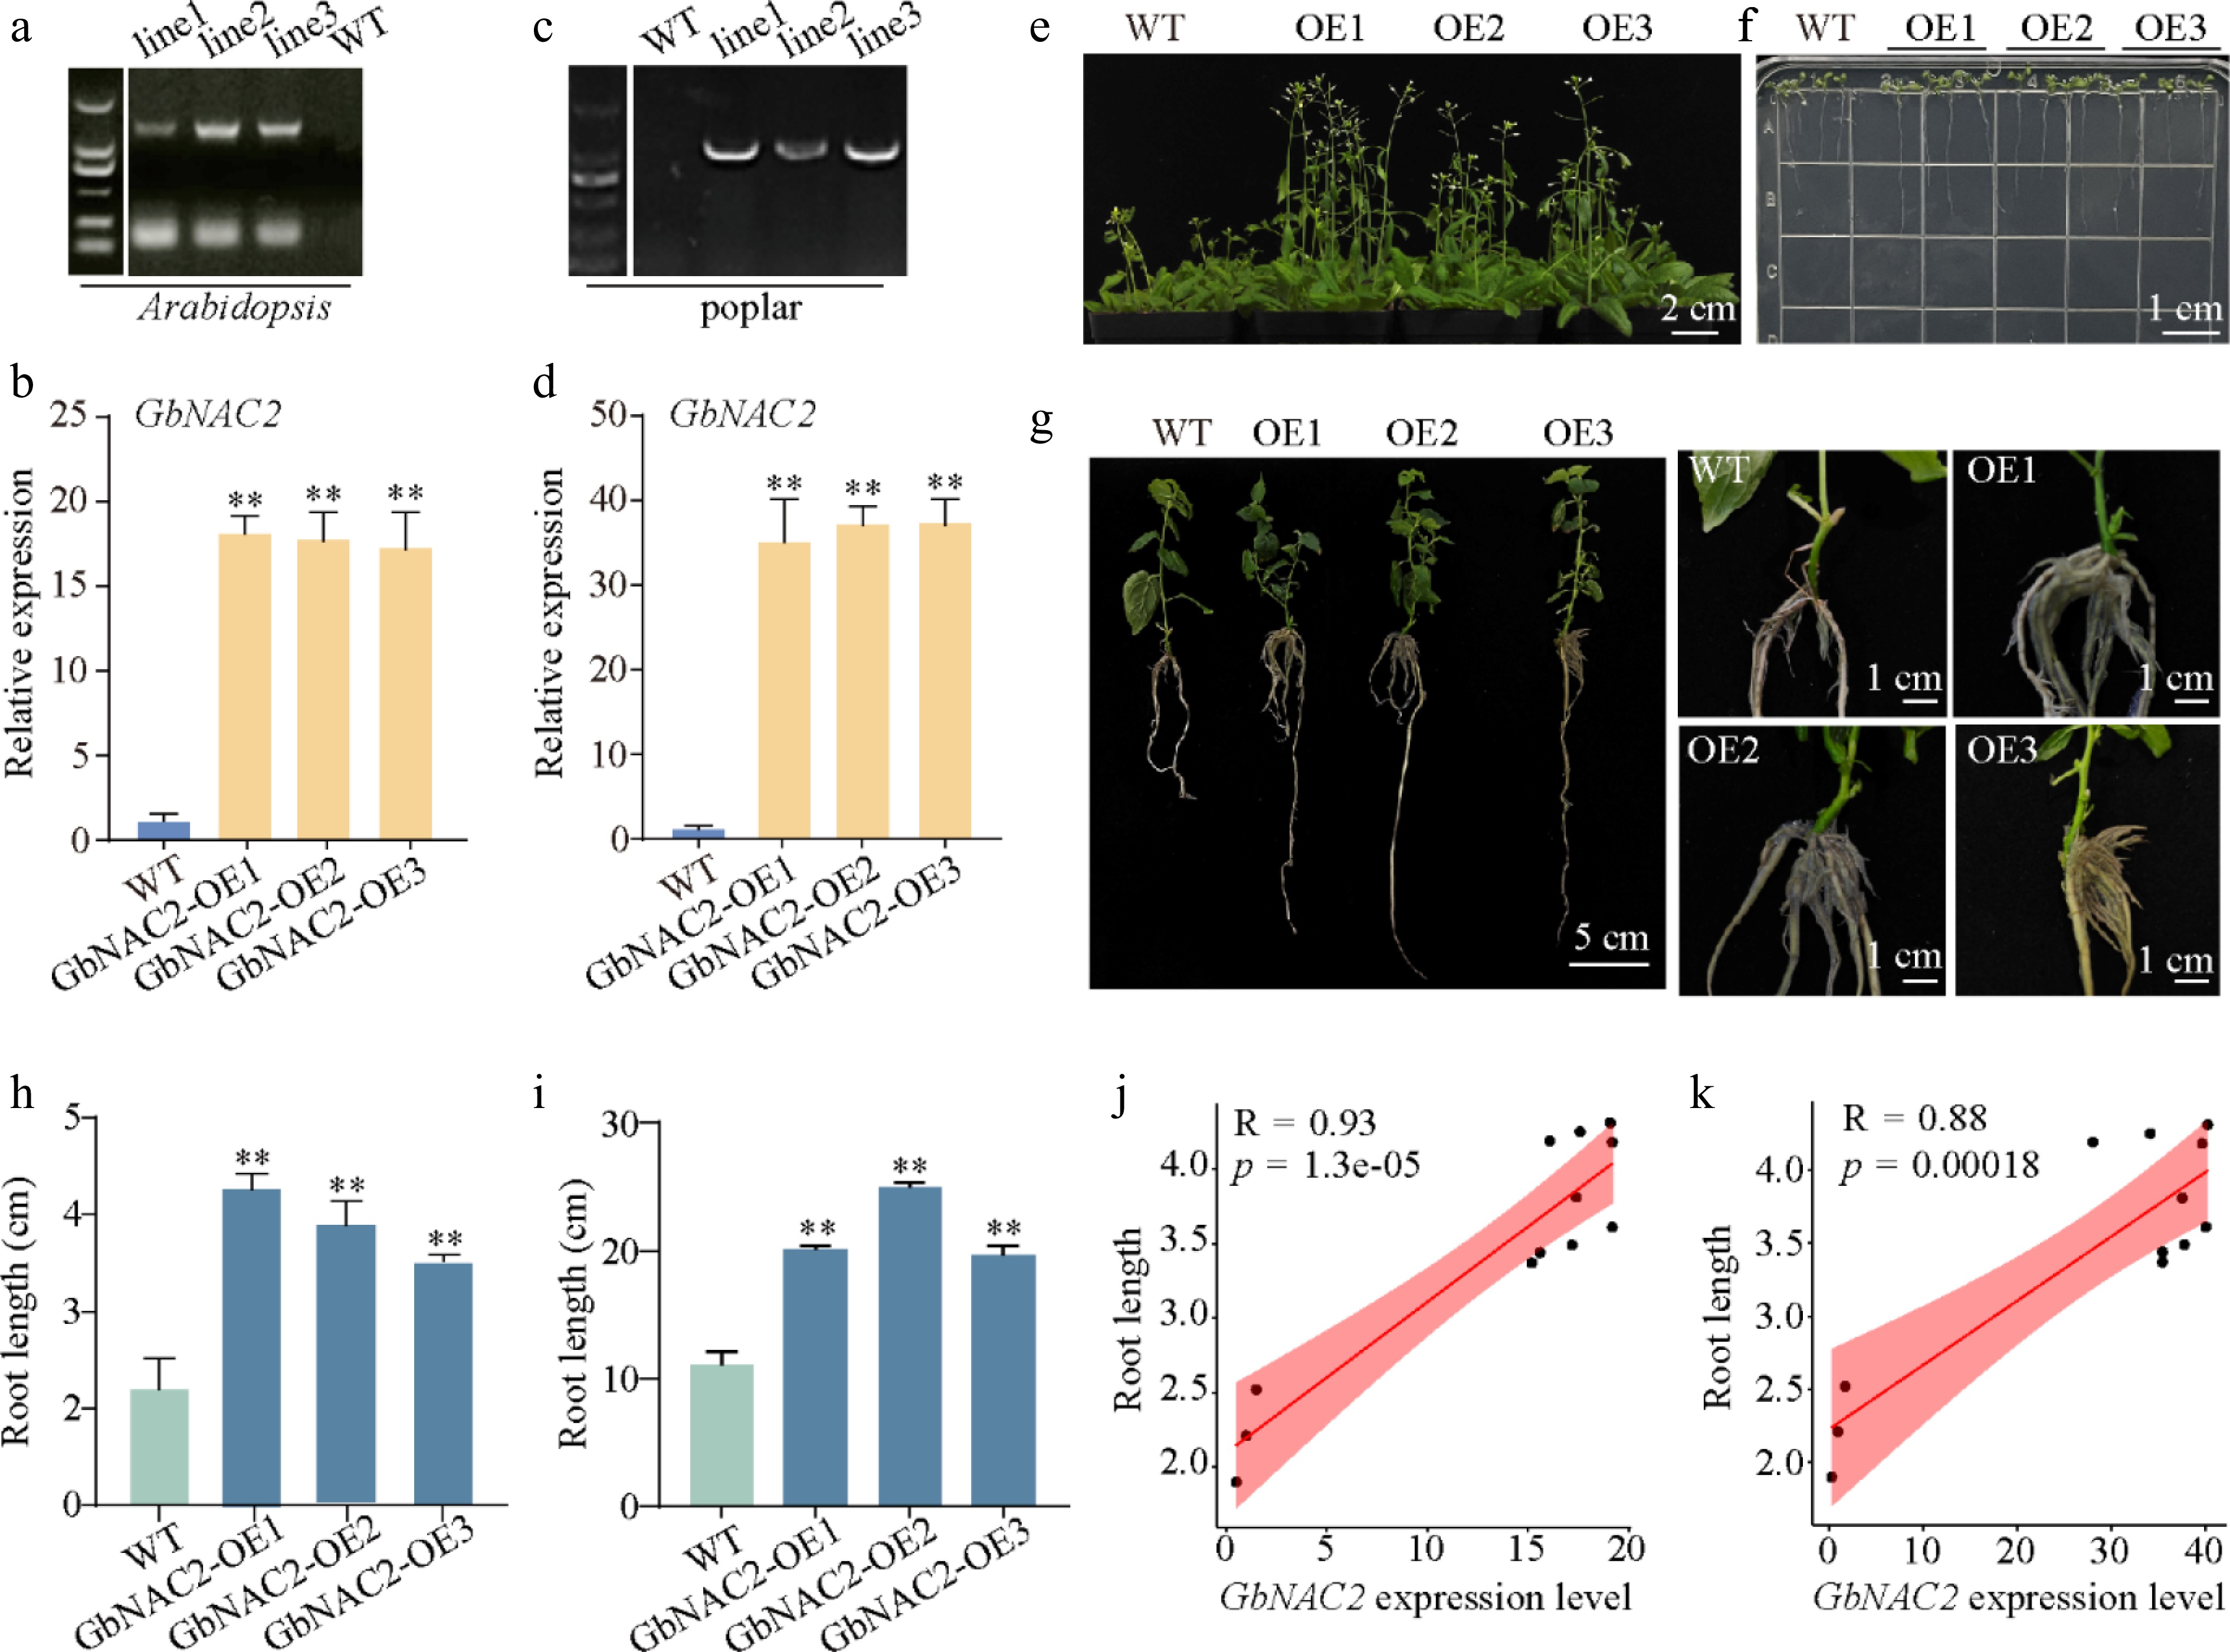
Figure 2.
Phenotypic analysis of overexpressed GbNAC2 in Arabidopsis and poplar. The (a), (c) positive detection and (b), (d) GbNAC2 expression level in transgenic plants. Ectopic expression of GbNAC2 significantly promotes the (e) flowering, and (f) root development of WT Arabidopsis. (g) The ectopic expression of GbNAC2 markedly enhances the development of primary and lateral roots in poplar. A statistical analysis of the root length of (h) transgenic Arabidopsis, and (i) transgenic poplar was conducted. The relationship between GbNAC2 expression and root length in (j) transgenic Arabidopsis, and (k) poplar. ** p < 0.01.
-
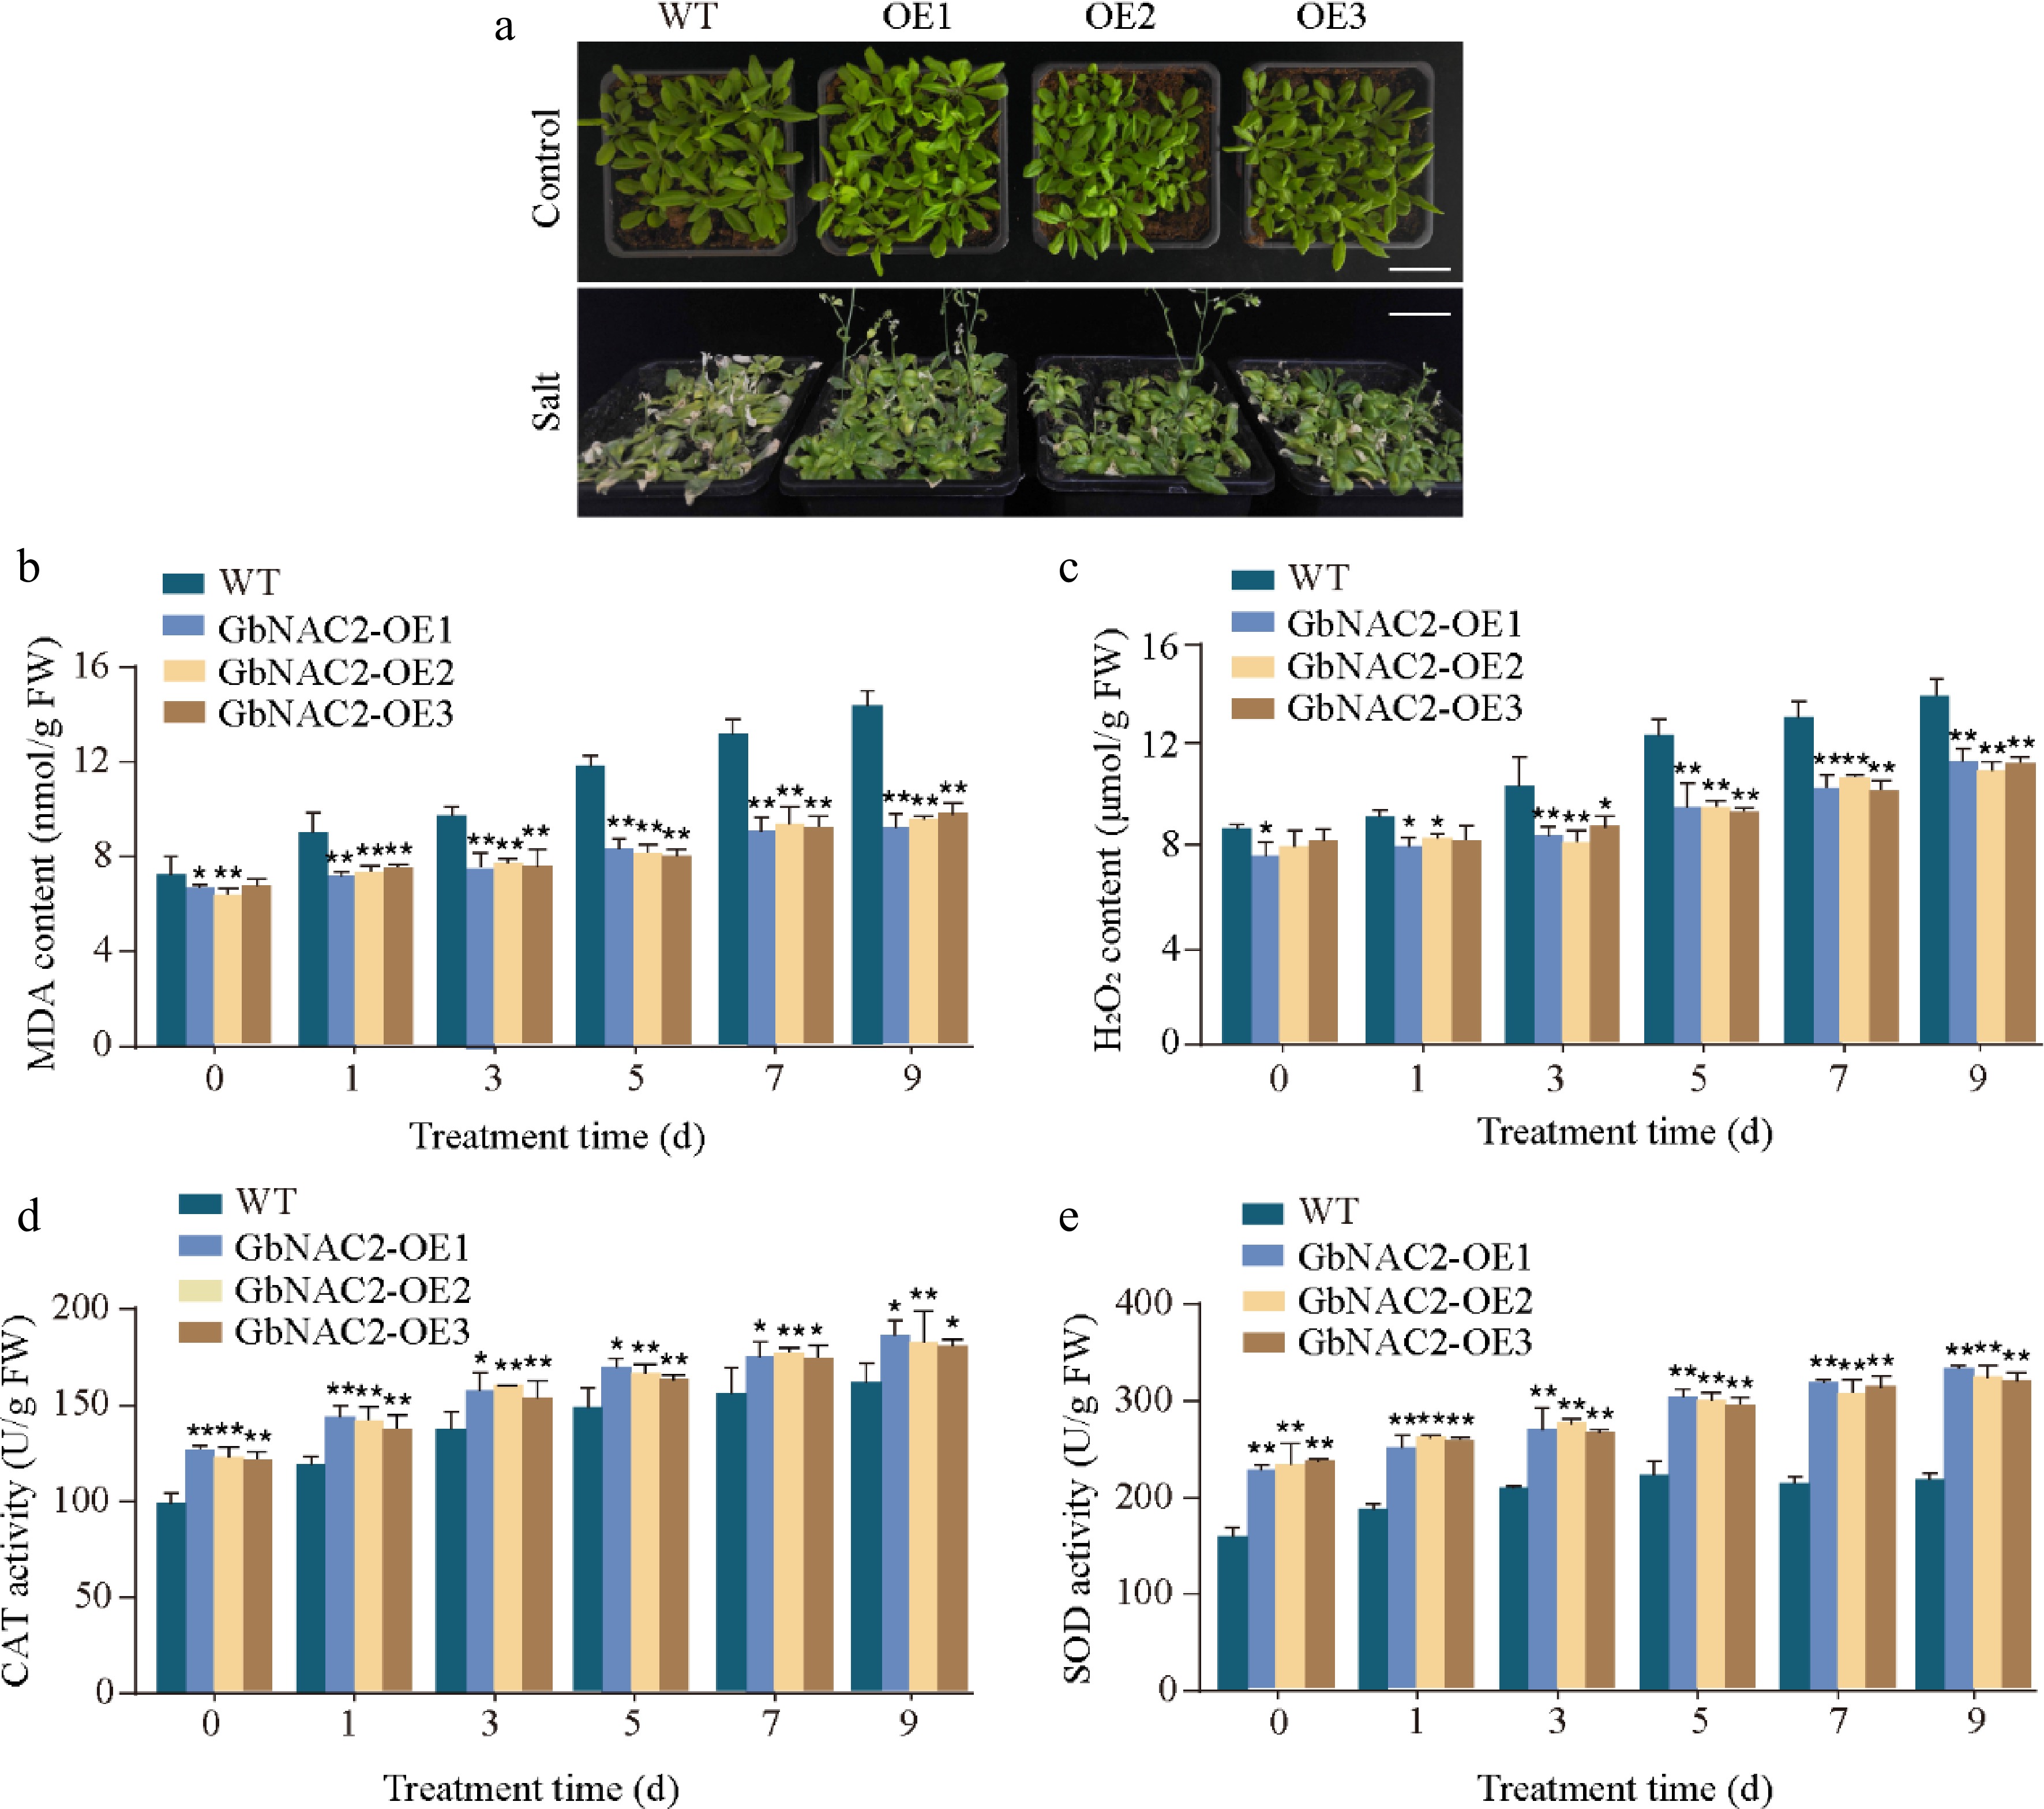
Figure 3.
Overexpression of GbNAC2 enhances the salt tolerance in Arabidopsis. (a) Phenotypic appearance of the plants after 9 d of salt treatment. (b) Levels of MDA in leaves. (c) Levels of H2O2 in leaves. (d) Activities of CAT in leaves. (e) Activities of SOD in leaves. * p < 0.05, ** p < 0.01.
-
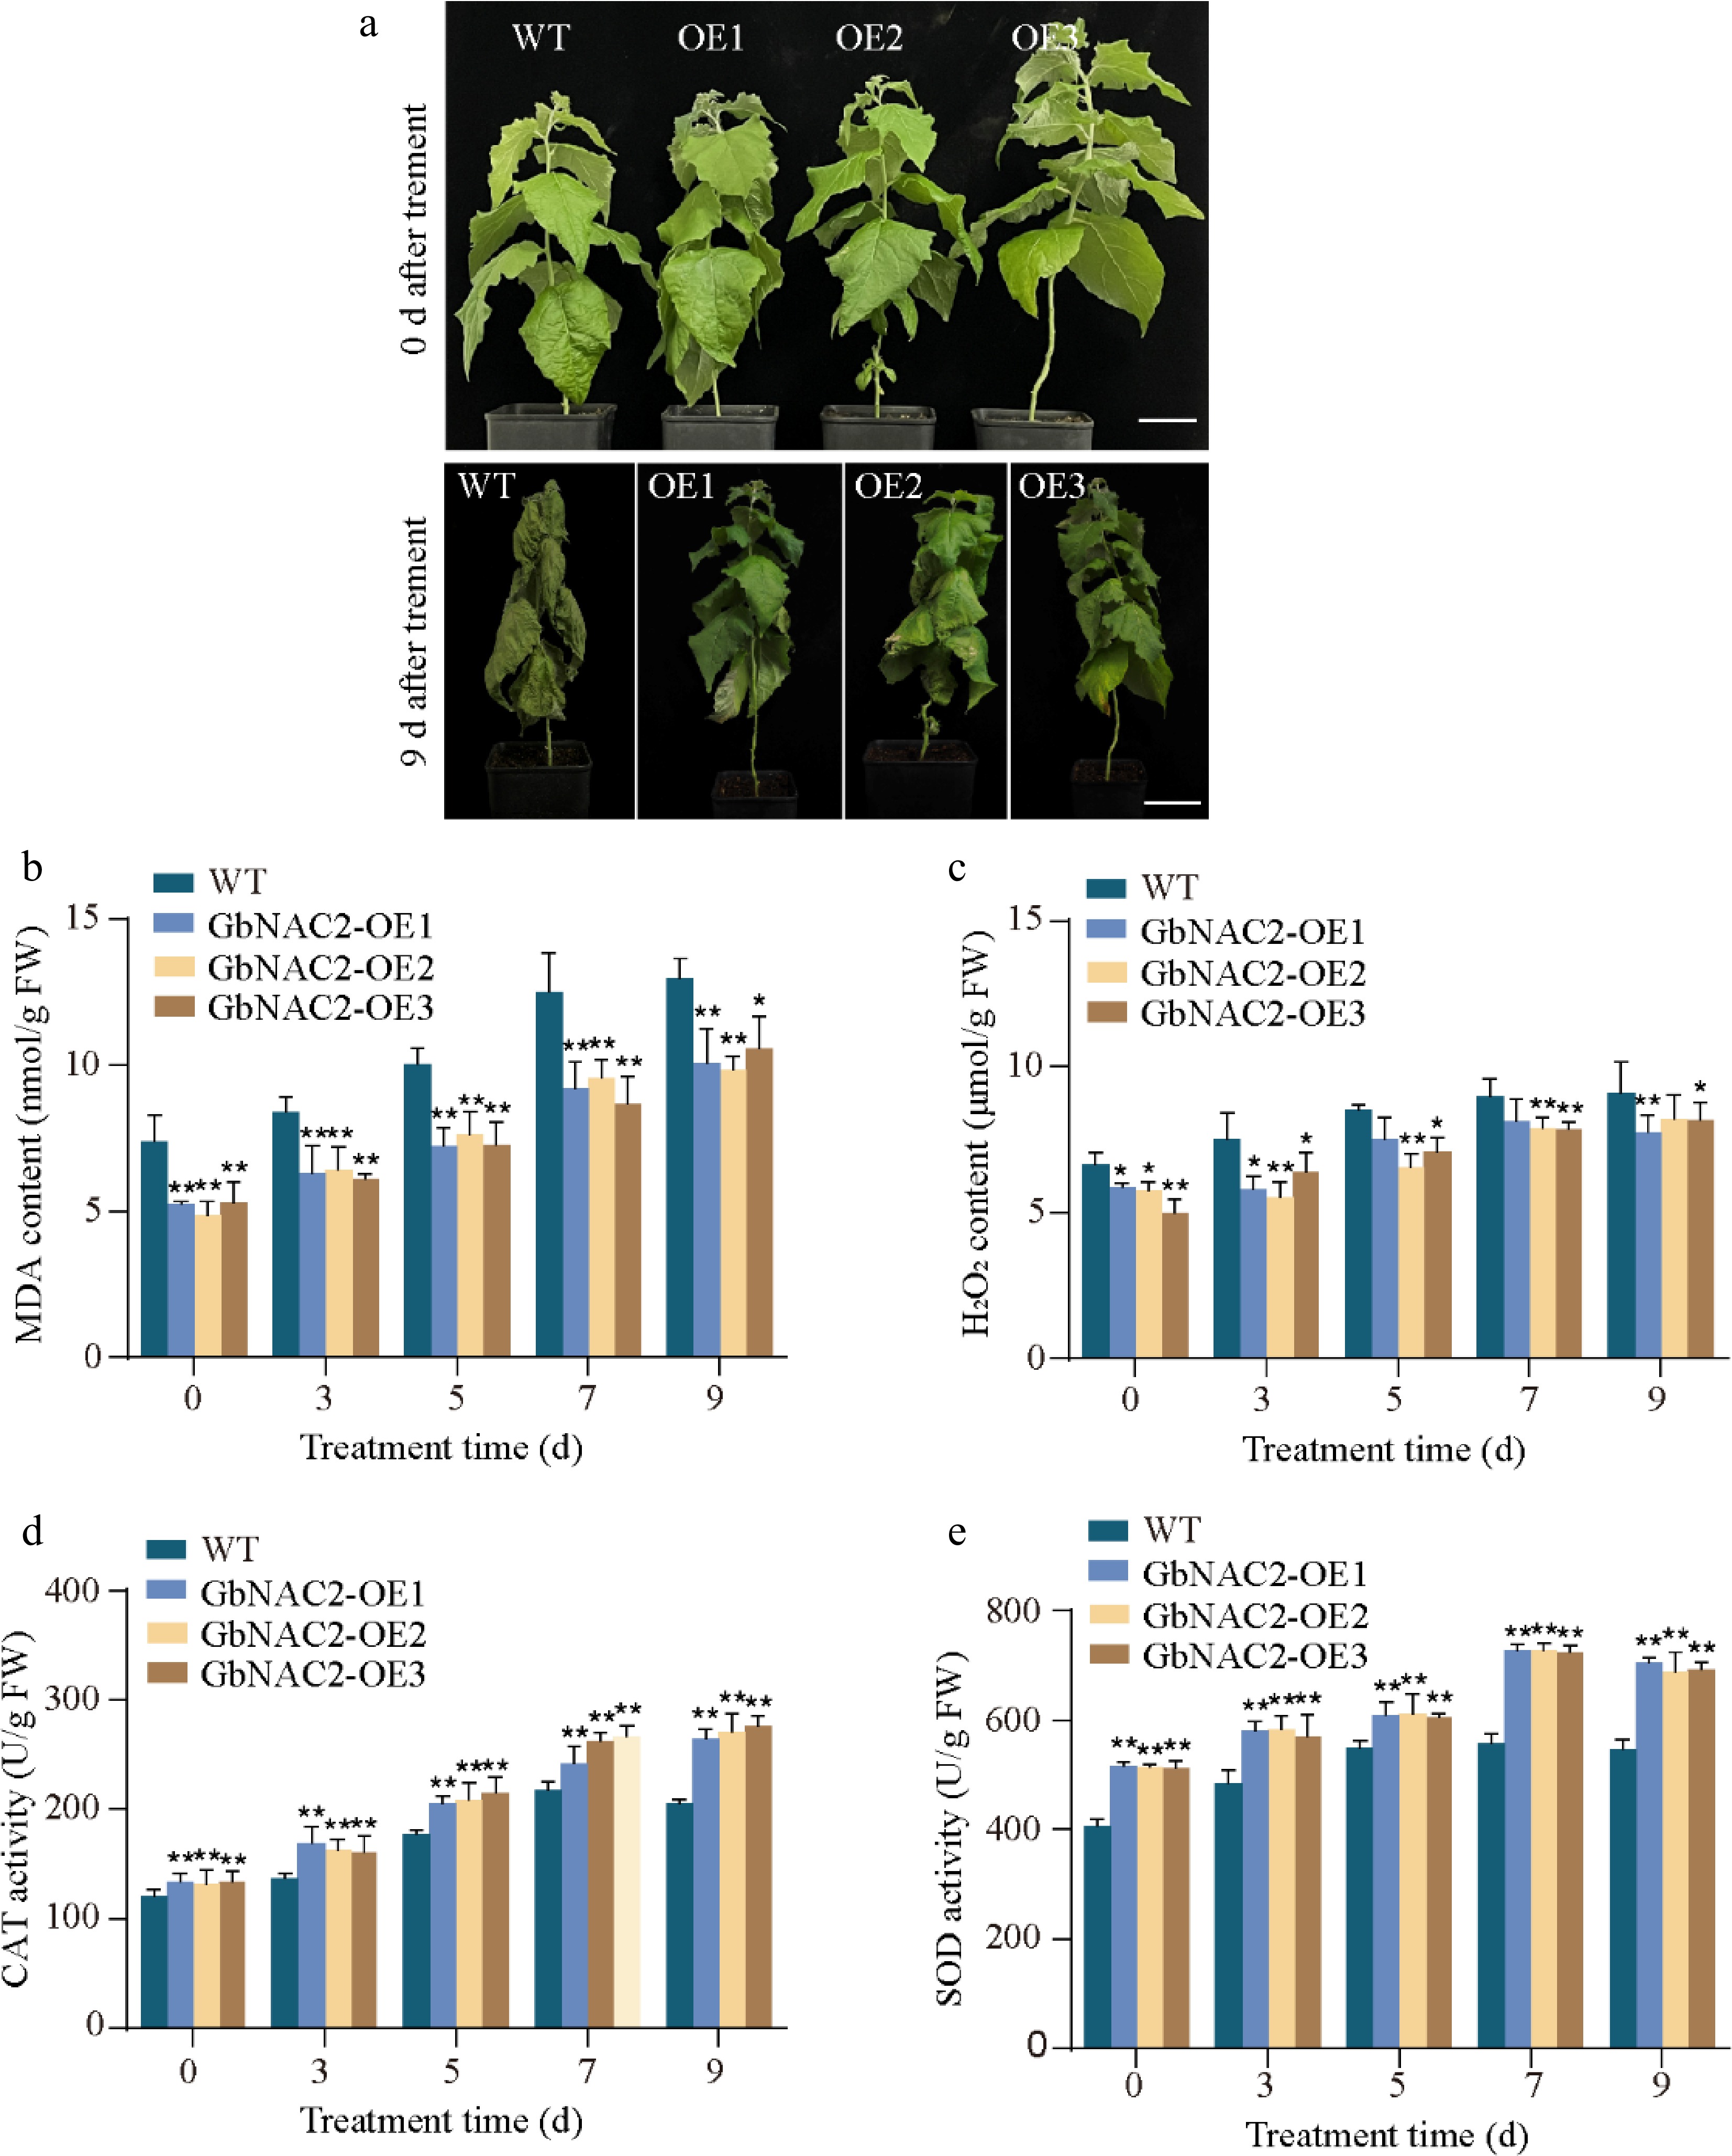
Figure 4.
Overexpression of GbNAC2 enhances the salt tolerance in poplar. (a) Phenotypic appearance of the plants under salt treatment. (b) Levels of MDA in leaves. (c) Levels of H2O2 in leaves. (d) Activities of CAT in leaves. (e) Activities of SOD in leaves. * p < 0.05, ** p < 0.01.
-
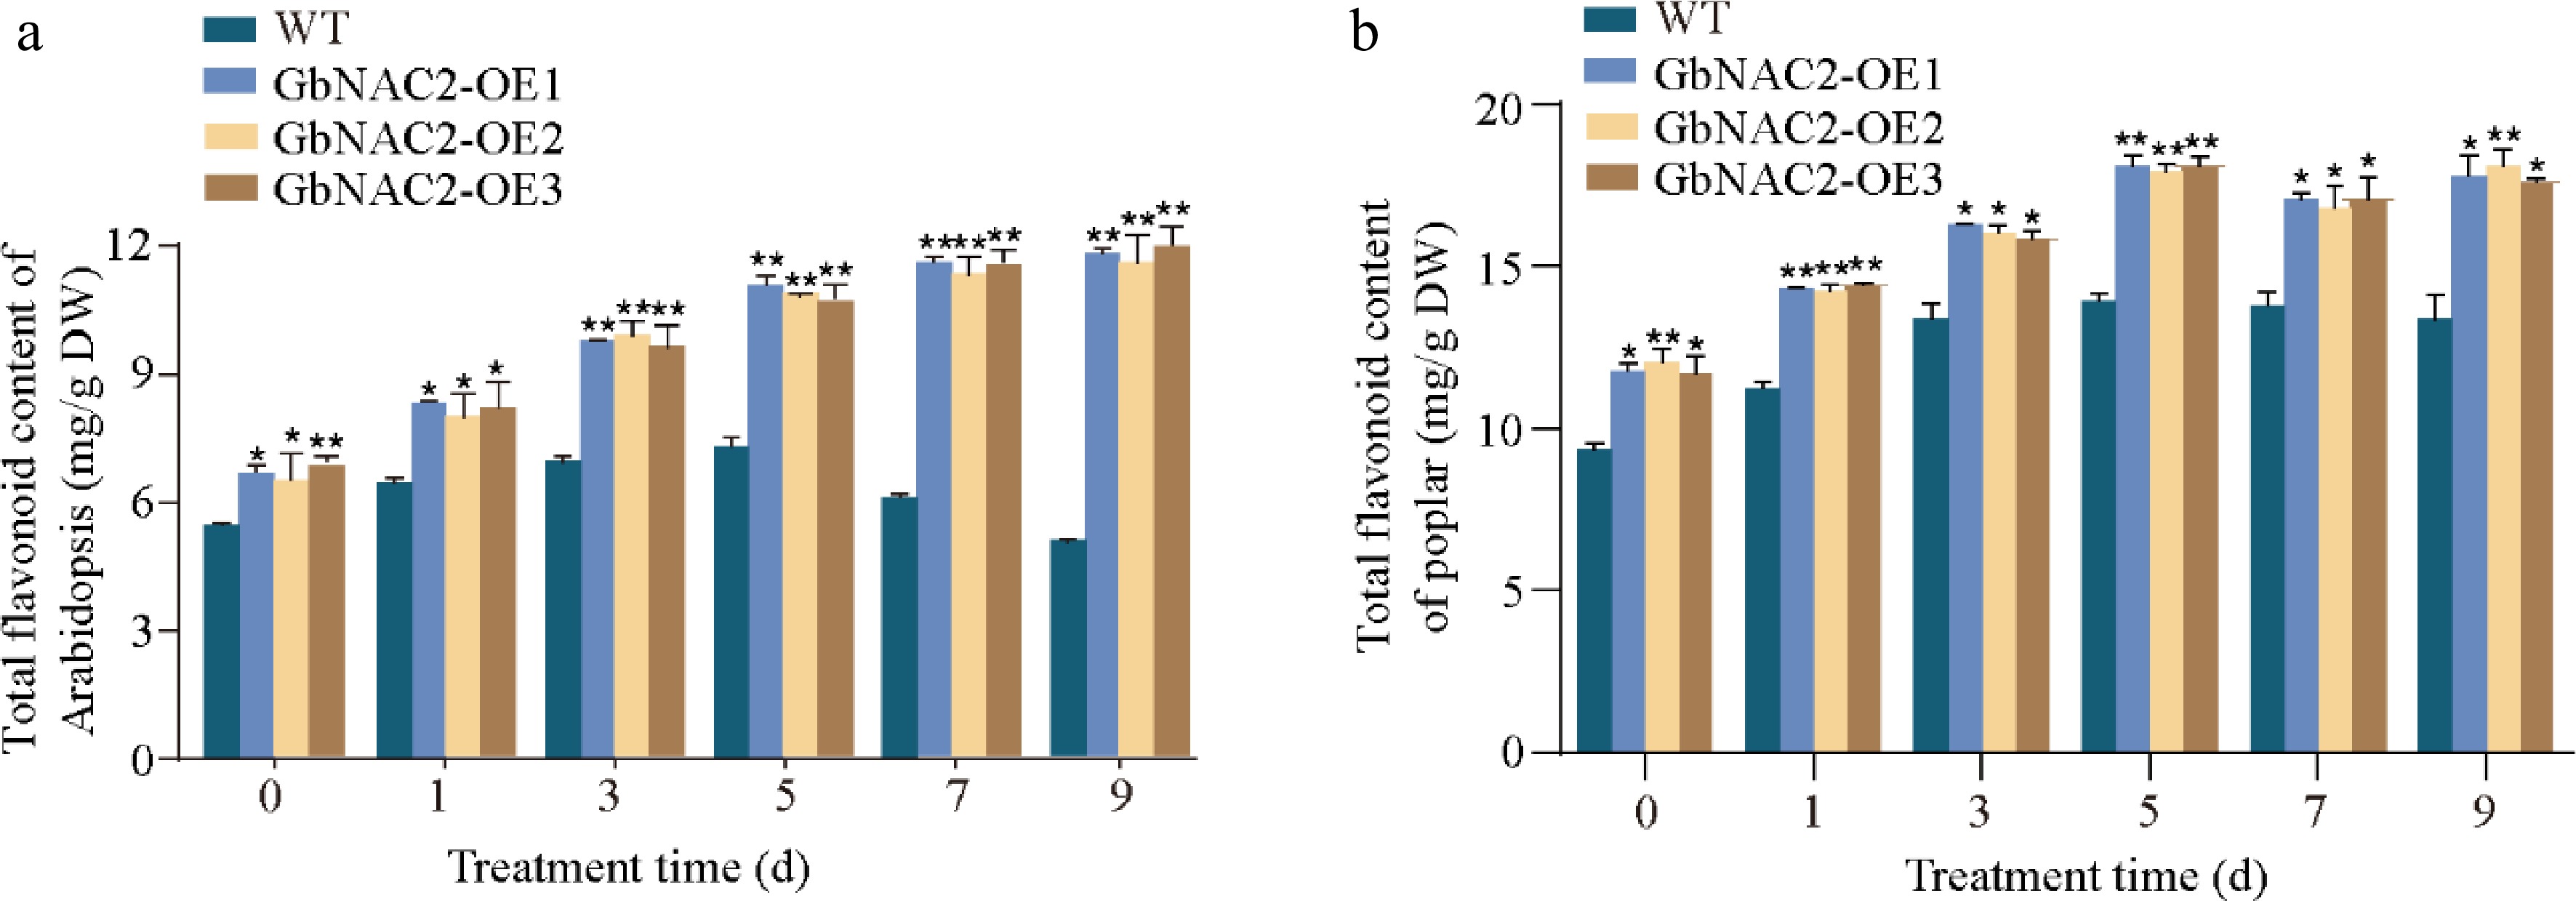
Figure 5.
Determination of flavonoid content at different time points following salt treatment in transgenic (a) Arabidopsis, and (b) transgenic poplar. * p < 0.05, ** p < 0.01.
-

Figure 6.
Transcriptome analysis reveals downstream signaling pathways regulated by GbNAC2. (a) Expression of GbNAC2 in GbNAC2-OE ginkgo calli. (b) Enrichment analysis of DEGs in the KEGG pathways. (c) A heatmap is presented to illustrate the transcriptional changes of genes in the flavonoid pathway between WT and transgenic calli (red represents upregulated, and blue represents downregulated). (d) qPCR analysis of key structural genes. ** p < 0.01.
-
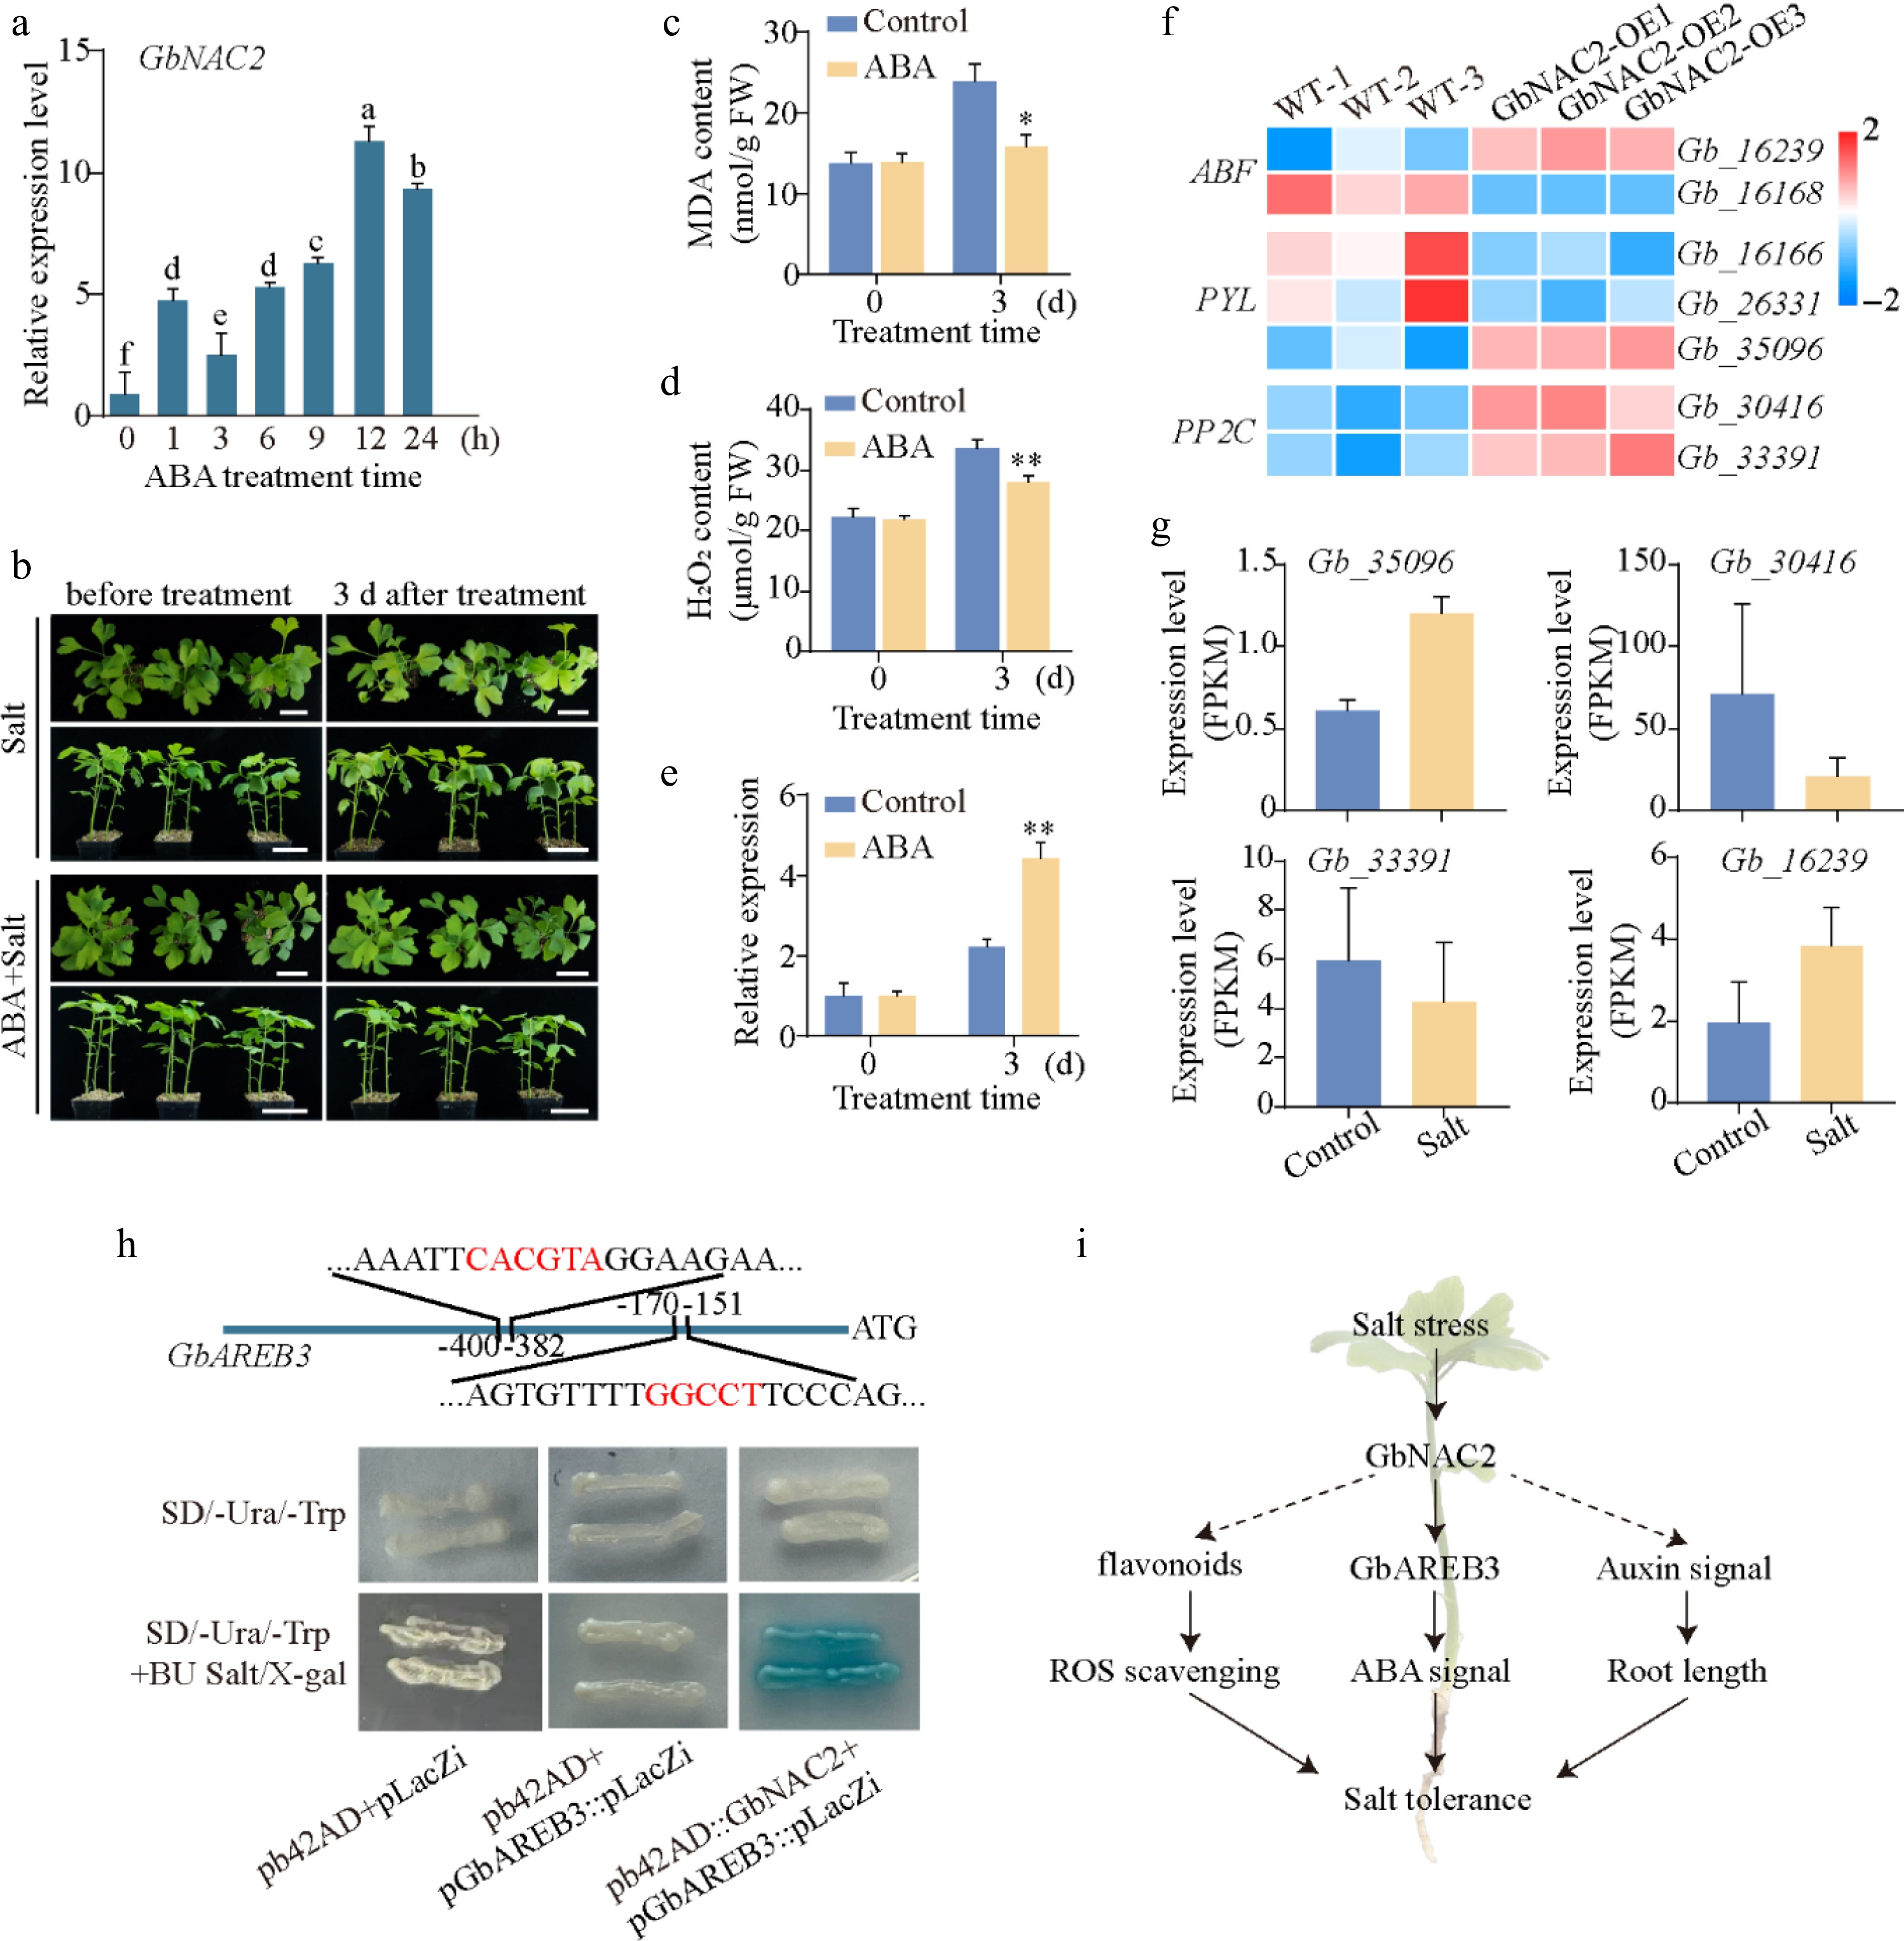
Figure 7.
GbNAC2 participates in ABA signaling by interacting with GbAREB3 promoters. (a) The expression profile of GbNAC2 within 24 h post ABA treatment. Different letters indicate significant differences (one-way analysis of variance, p < 0.05). (b) Phenotypic changes in ginkgo seedlings before and after NaCl and ABA + NaCl treatment. Scale bar = 4 cm. The content of (c) MDA, (d) and H2O2 before and after NaCl and ABA + NaCl treatment. (e) The expression of GbNAC2 before and after treatment. * p < 0.05, ** p < 0.01. (f) Heatmap of significantly differentially expressed ABA pathway-related genes following overexpression of GbNAC2. (g) Expression analysis of four ABA pathway-related genes under salt stress. (h) Verification of the interaction between GbNAC2 and the GbAREB3 promoter through Y1H assay. (i) Schematic diagram illustrating the promotion of salt stress tolerance in ginkgo by GbNAC2.
Figures
(7)
Tables
(0)