-
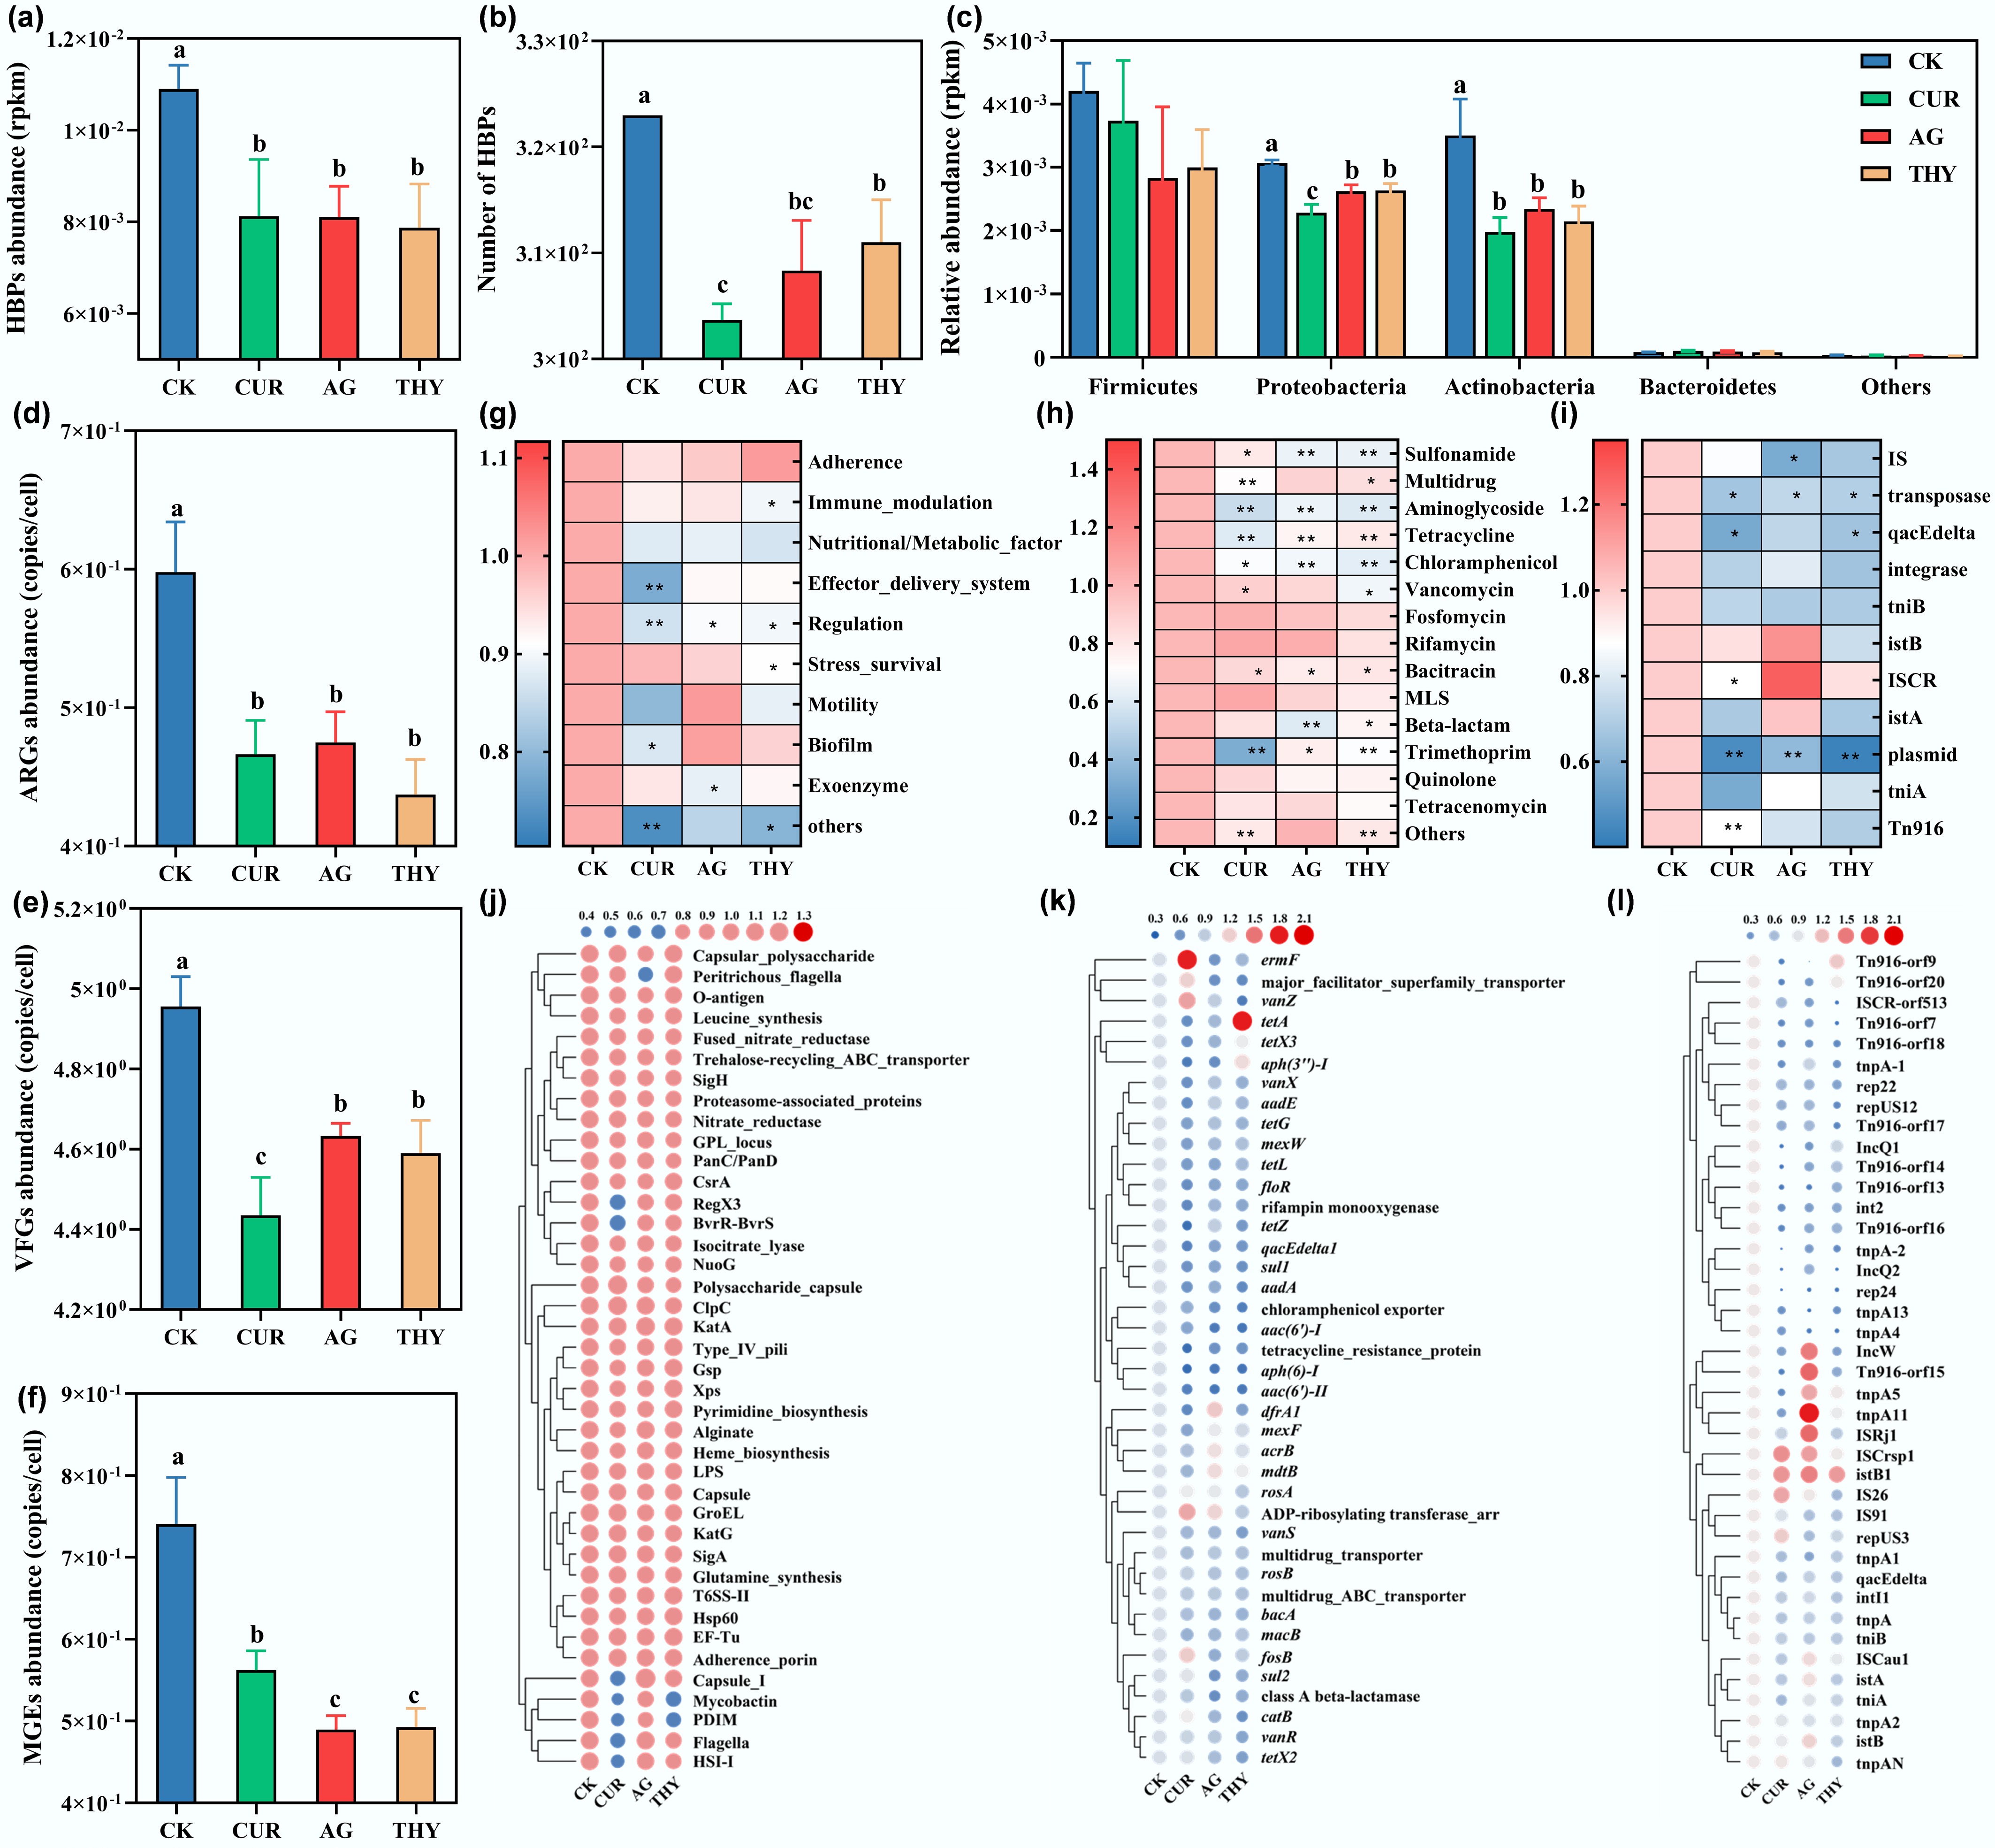
Figure 1.
Effects of plant extracts on the relative abundance and risk of HBPs in soil. (a) Total abundance, and (b) number of HBPs in soil treated with CUR, AG, and THY. (c) Effects of CUR, AG, and THY on the major bacterial phylum of HBPs. The total abundance of (d) ARGs, (e) MGEs, and (f) VFGs in soil treated with plant extracts. Effects of CUR, AG, and THY on the main categories of (g) ARGs, (h) MGEs, and (i) VFGs. The abundance of the top 40 subclasses of (j) ARGs, (k) MGEs, and (l) VFGs in soil treated with plant extracts. Data points with the same letter suggest no significant difference (p > 0.05).
-
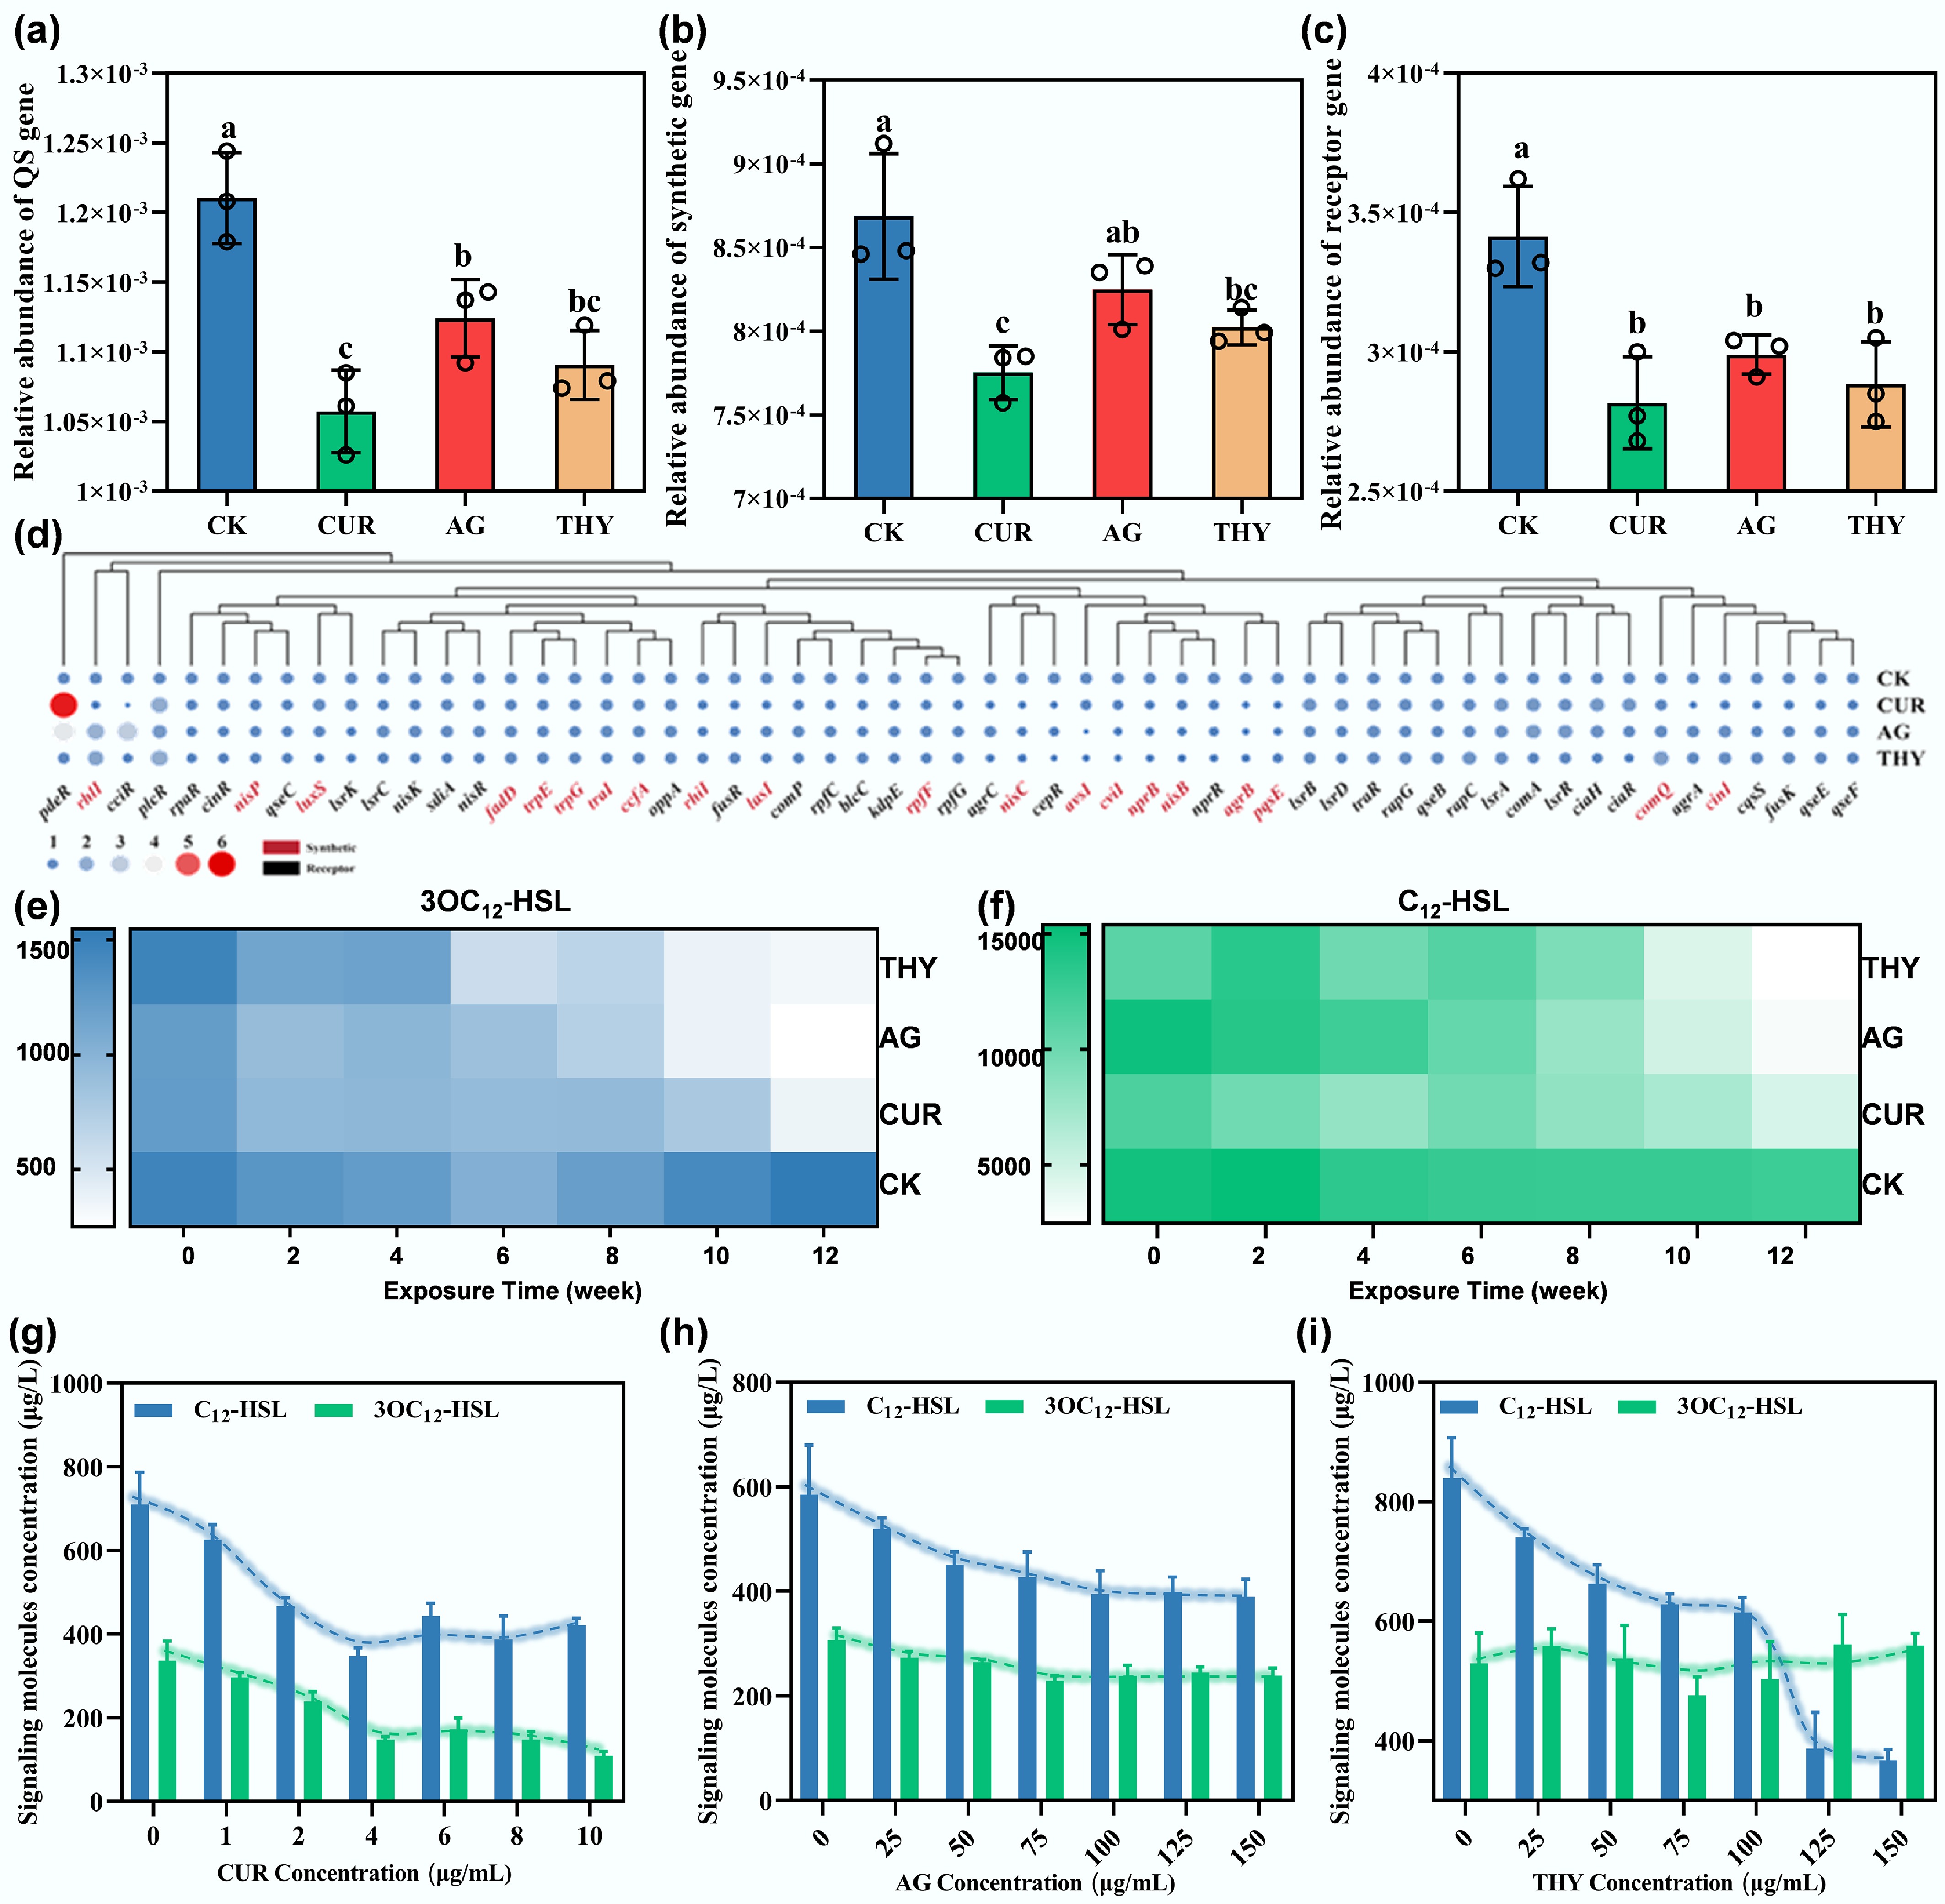
Figure 2.
Effects of plant extracts on the QS of HBPs in soil. Changes in the abundance of (a) total QS genes, (b) QS-related synthetic genes, and (c) QS-related receptor genes in the soil after application of different types of plant extracts. Different lowercase letters indicate significant differences among the treatments at p < 0.05. (d) Effects of plant extracts on soil-specific QS-related genes. Effect of plant extracts on the concentrations of (e) 3OC12-HSL, and (f) C12-HSL in the soil microcosms at different incubation times. Effects of different concentrations of (g) CUR, (h) AG, and (i) THY on the secretion of signaling molecules by PAO1.
-
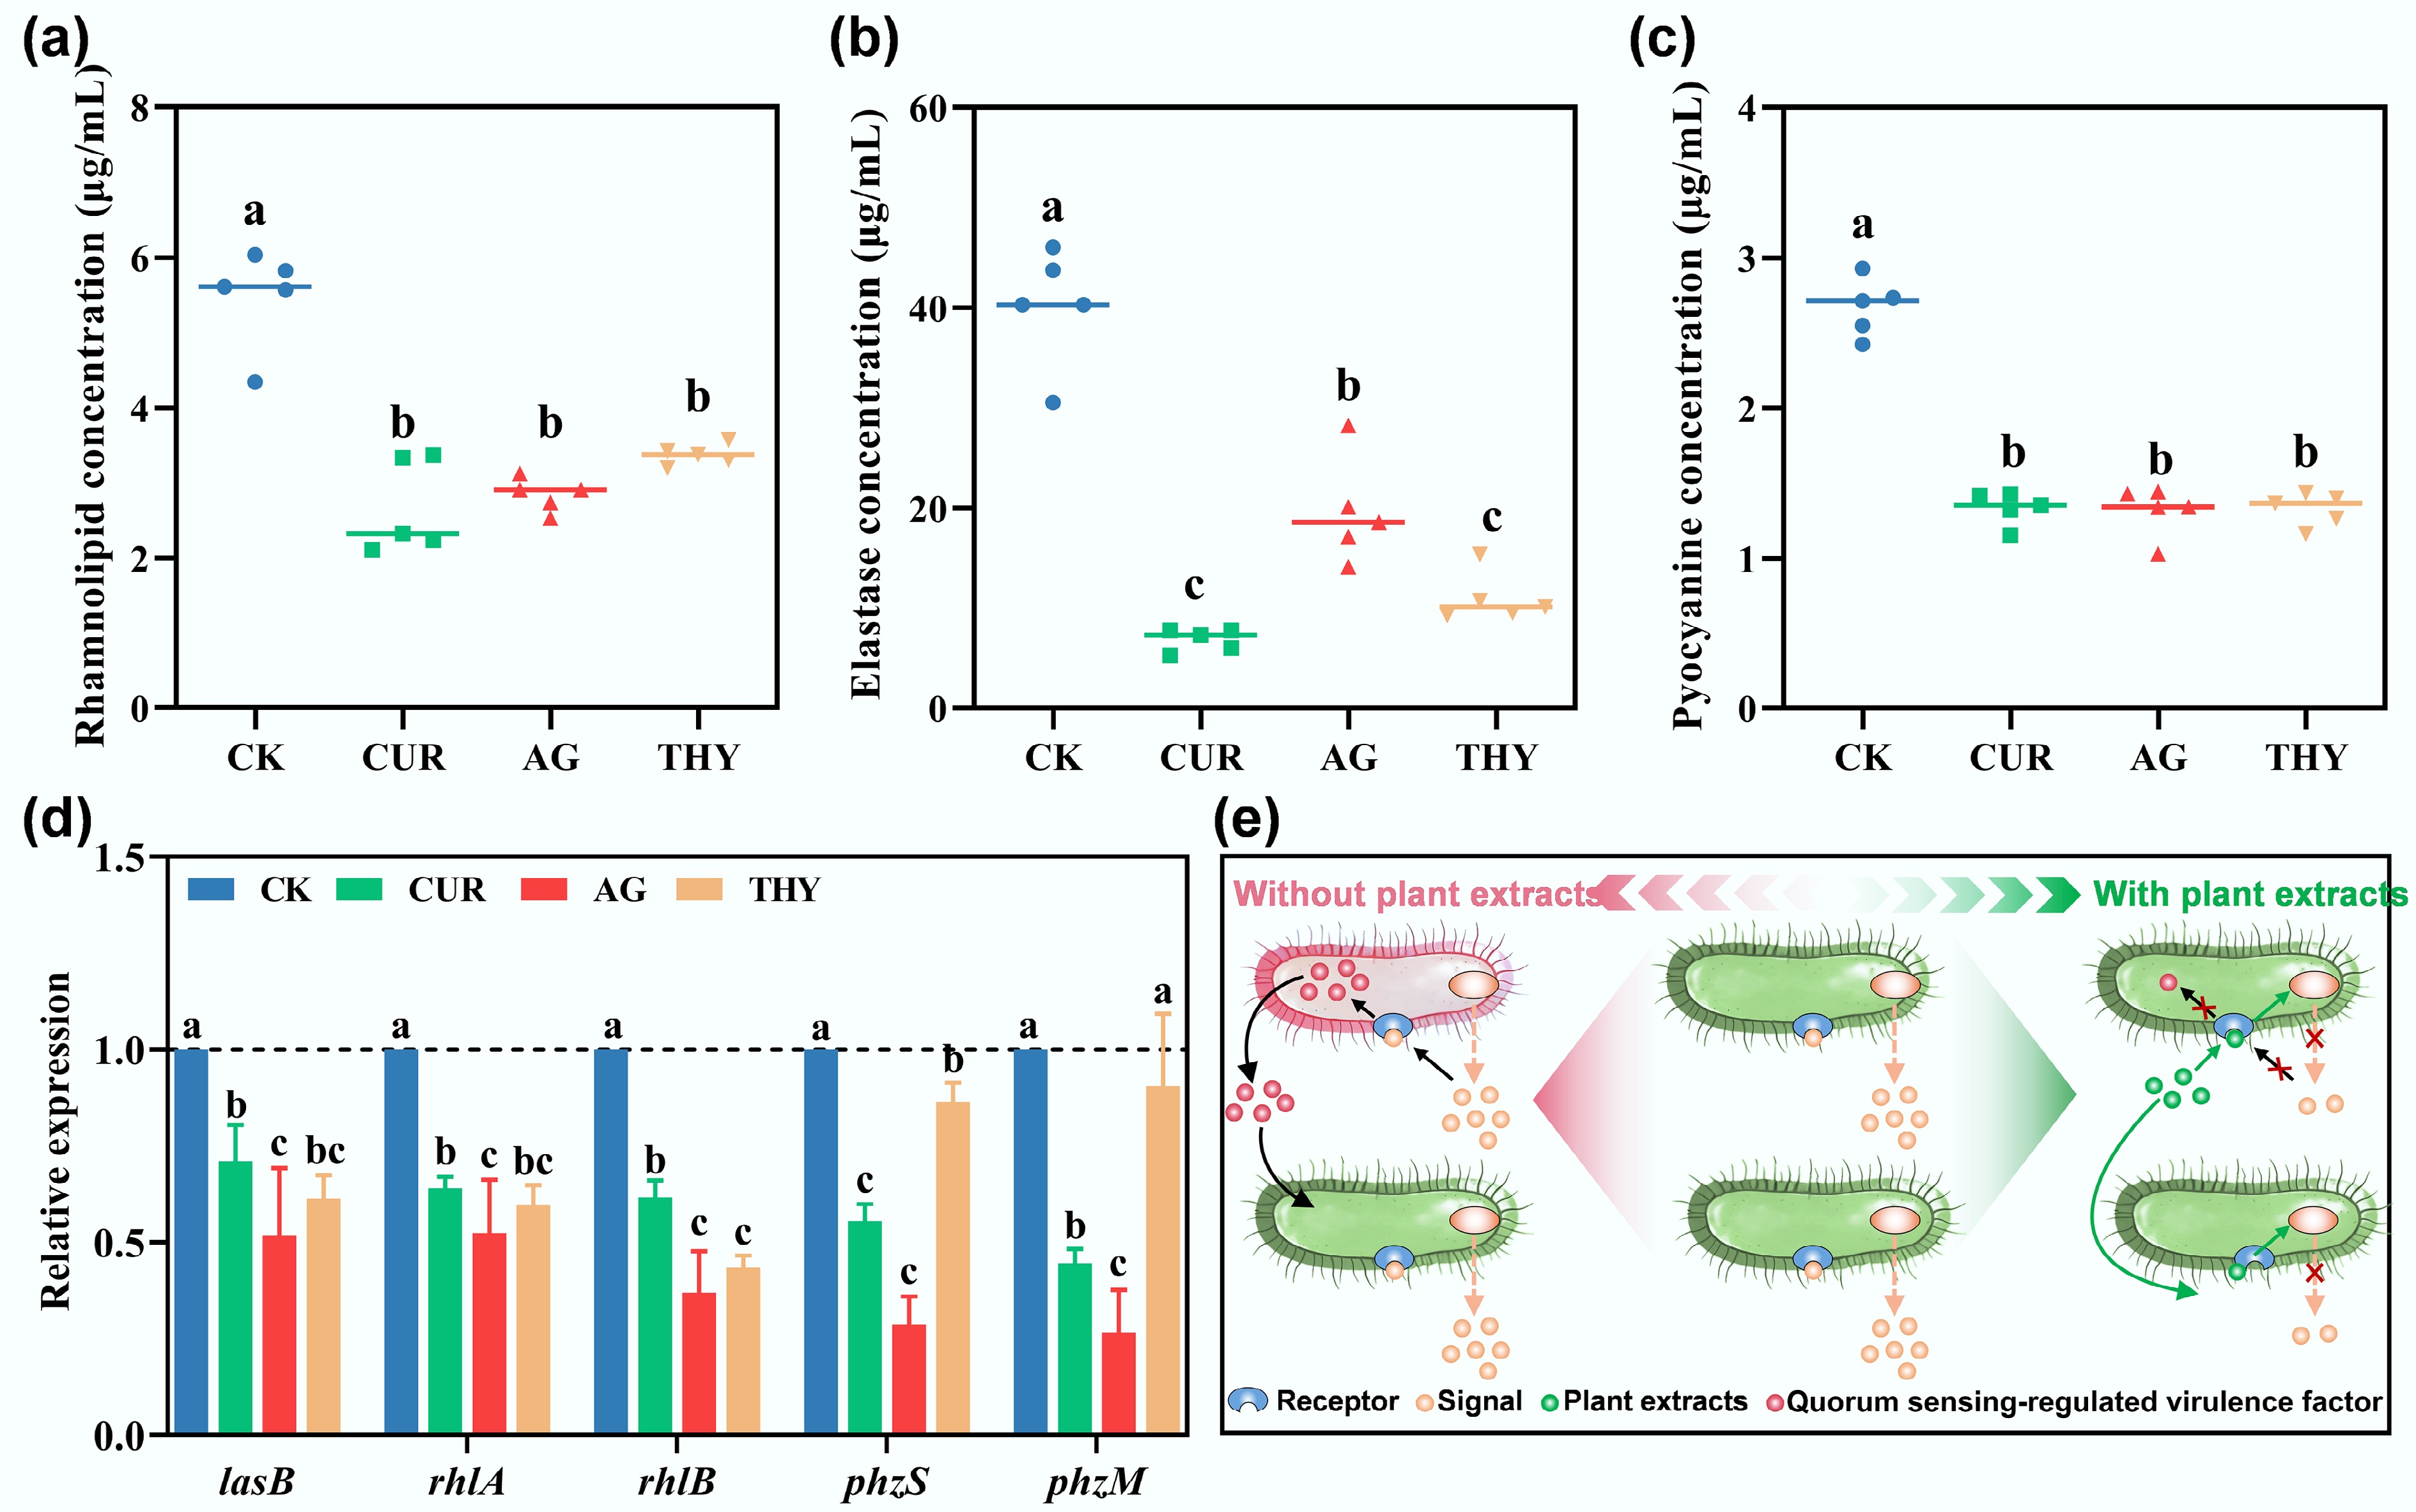
Figure 3.
Effects of different plant extracts on virulence factors (a) rhamnolipid, (b) elastase, and (c) pyocyanin secreted by PAO1. (d) Effects of different plant extracts on virulence factor-related genes of PAO1. (e) Schematic illustration of the reduction of virulence factors of PAO1 via disturbing their QS system mediated by plant extracts. Data points with the same letter indicate no significant difference (p > 0.05).
-
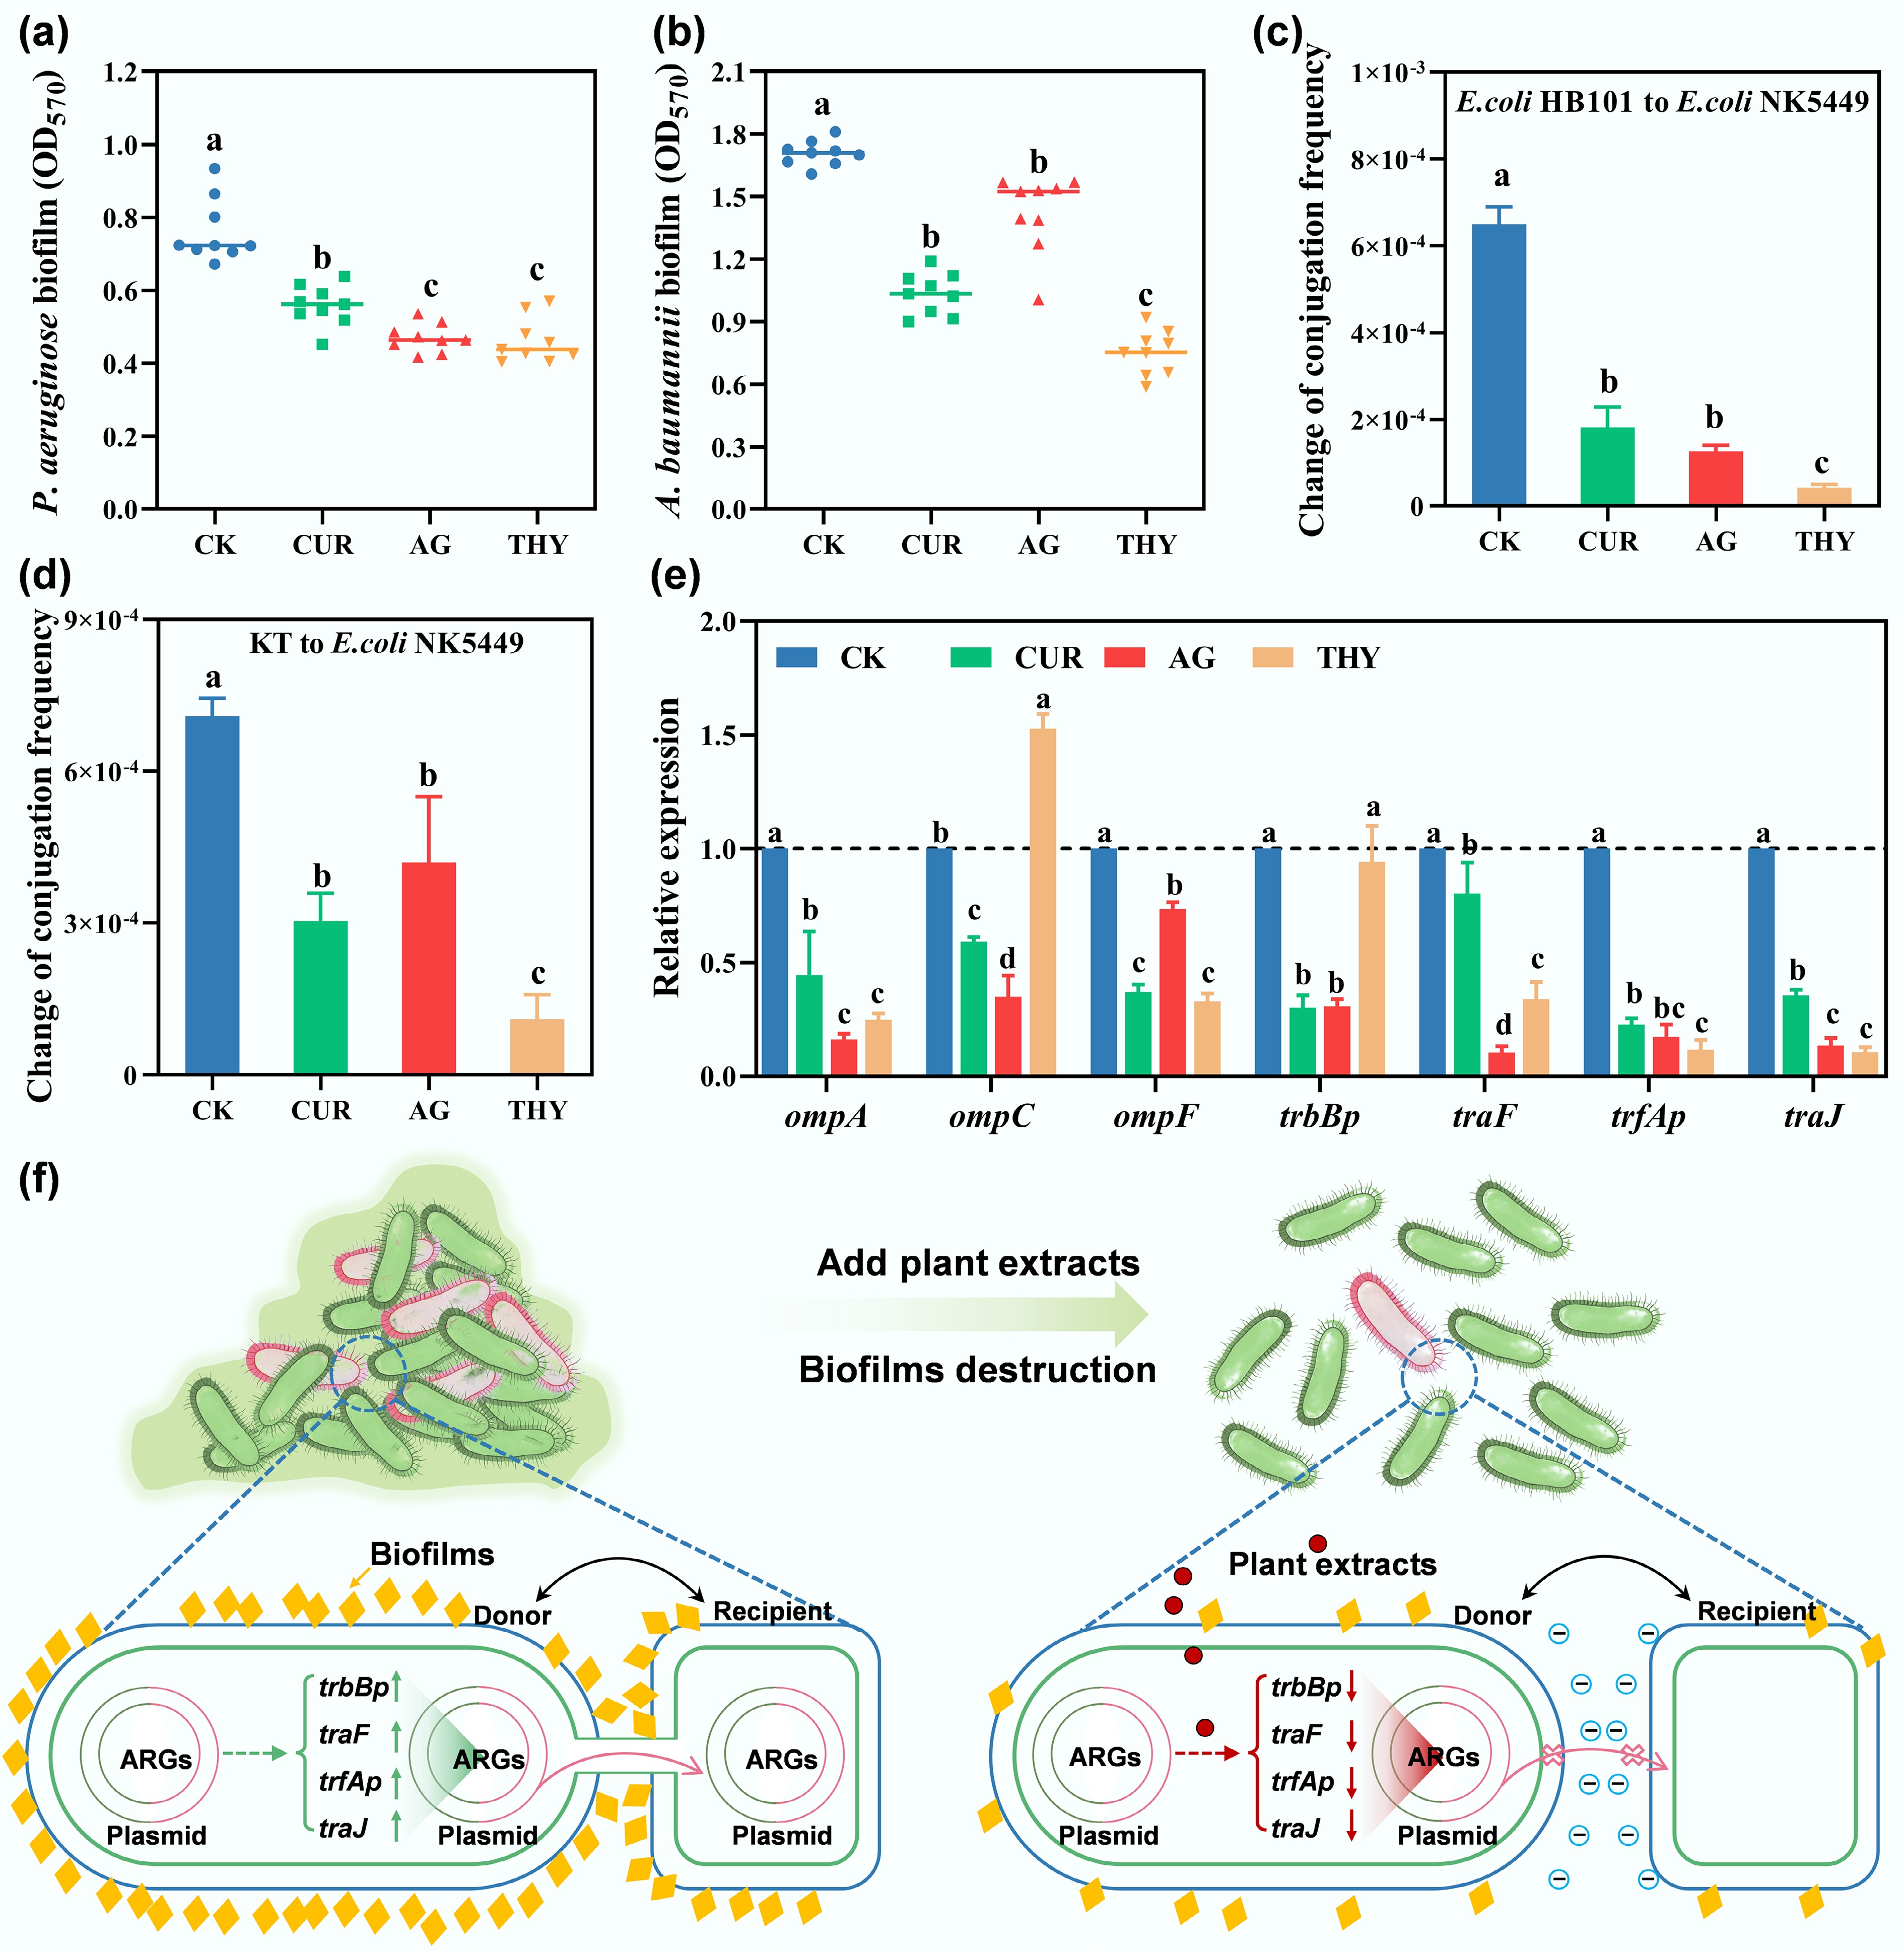
Figure 4.
Effects of different plant extracts on the formation of biofilms of (a) PAO1 and (b) Acinetobacter baumannii (A. baumannii). Effects of plant extracts on (c) the intra-species, (d) inter-species transfer conjugation frequencies, and (e) genes associated with conjugative transfer. Data points with the same letter indicate no significant difference (p > 0.05). (f) Illustrative diagrams for the inhibition of the conjugative transfer of ARGs and VFGs with the addition of plant extracts.
-
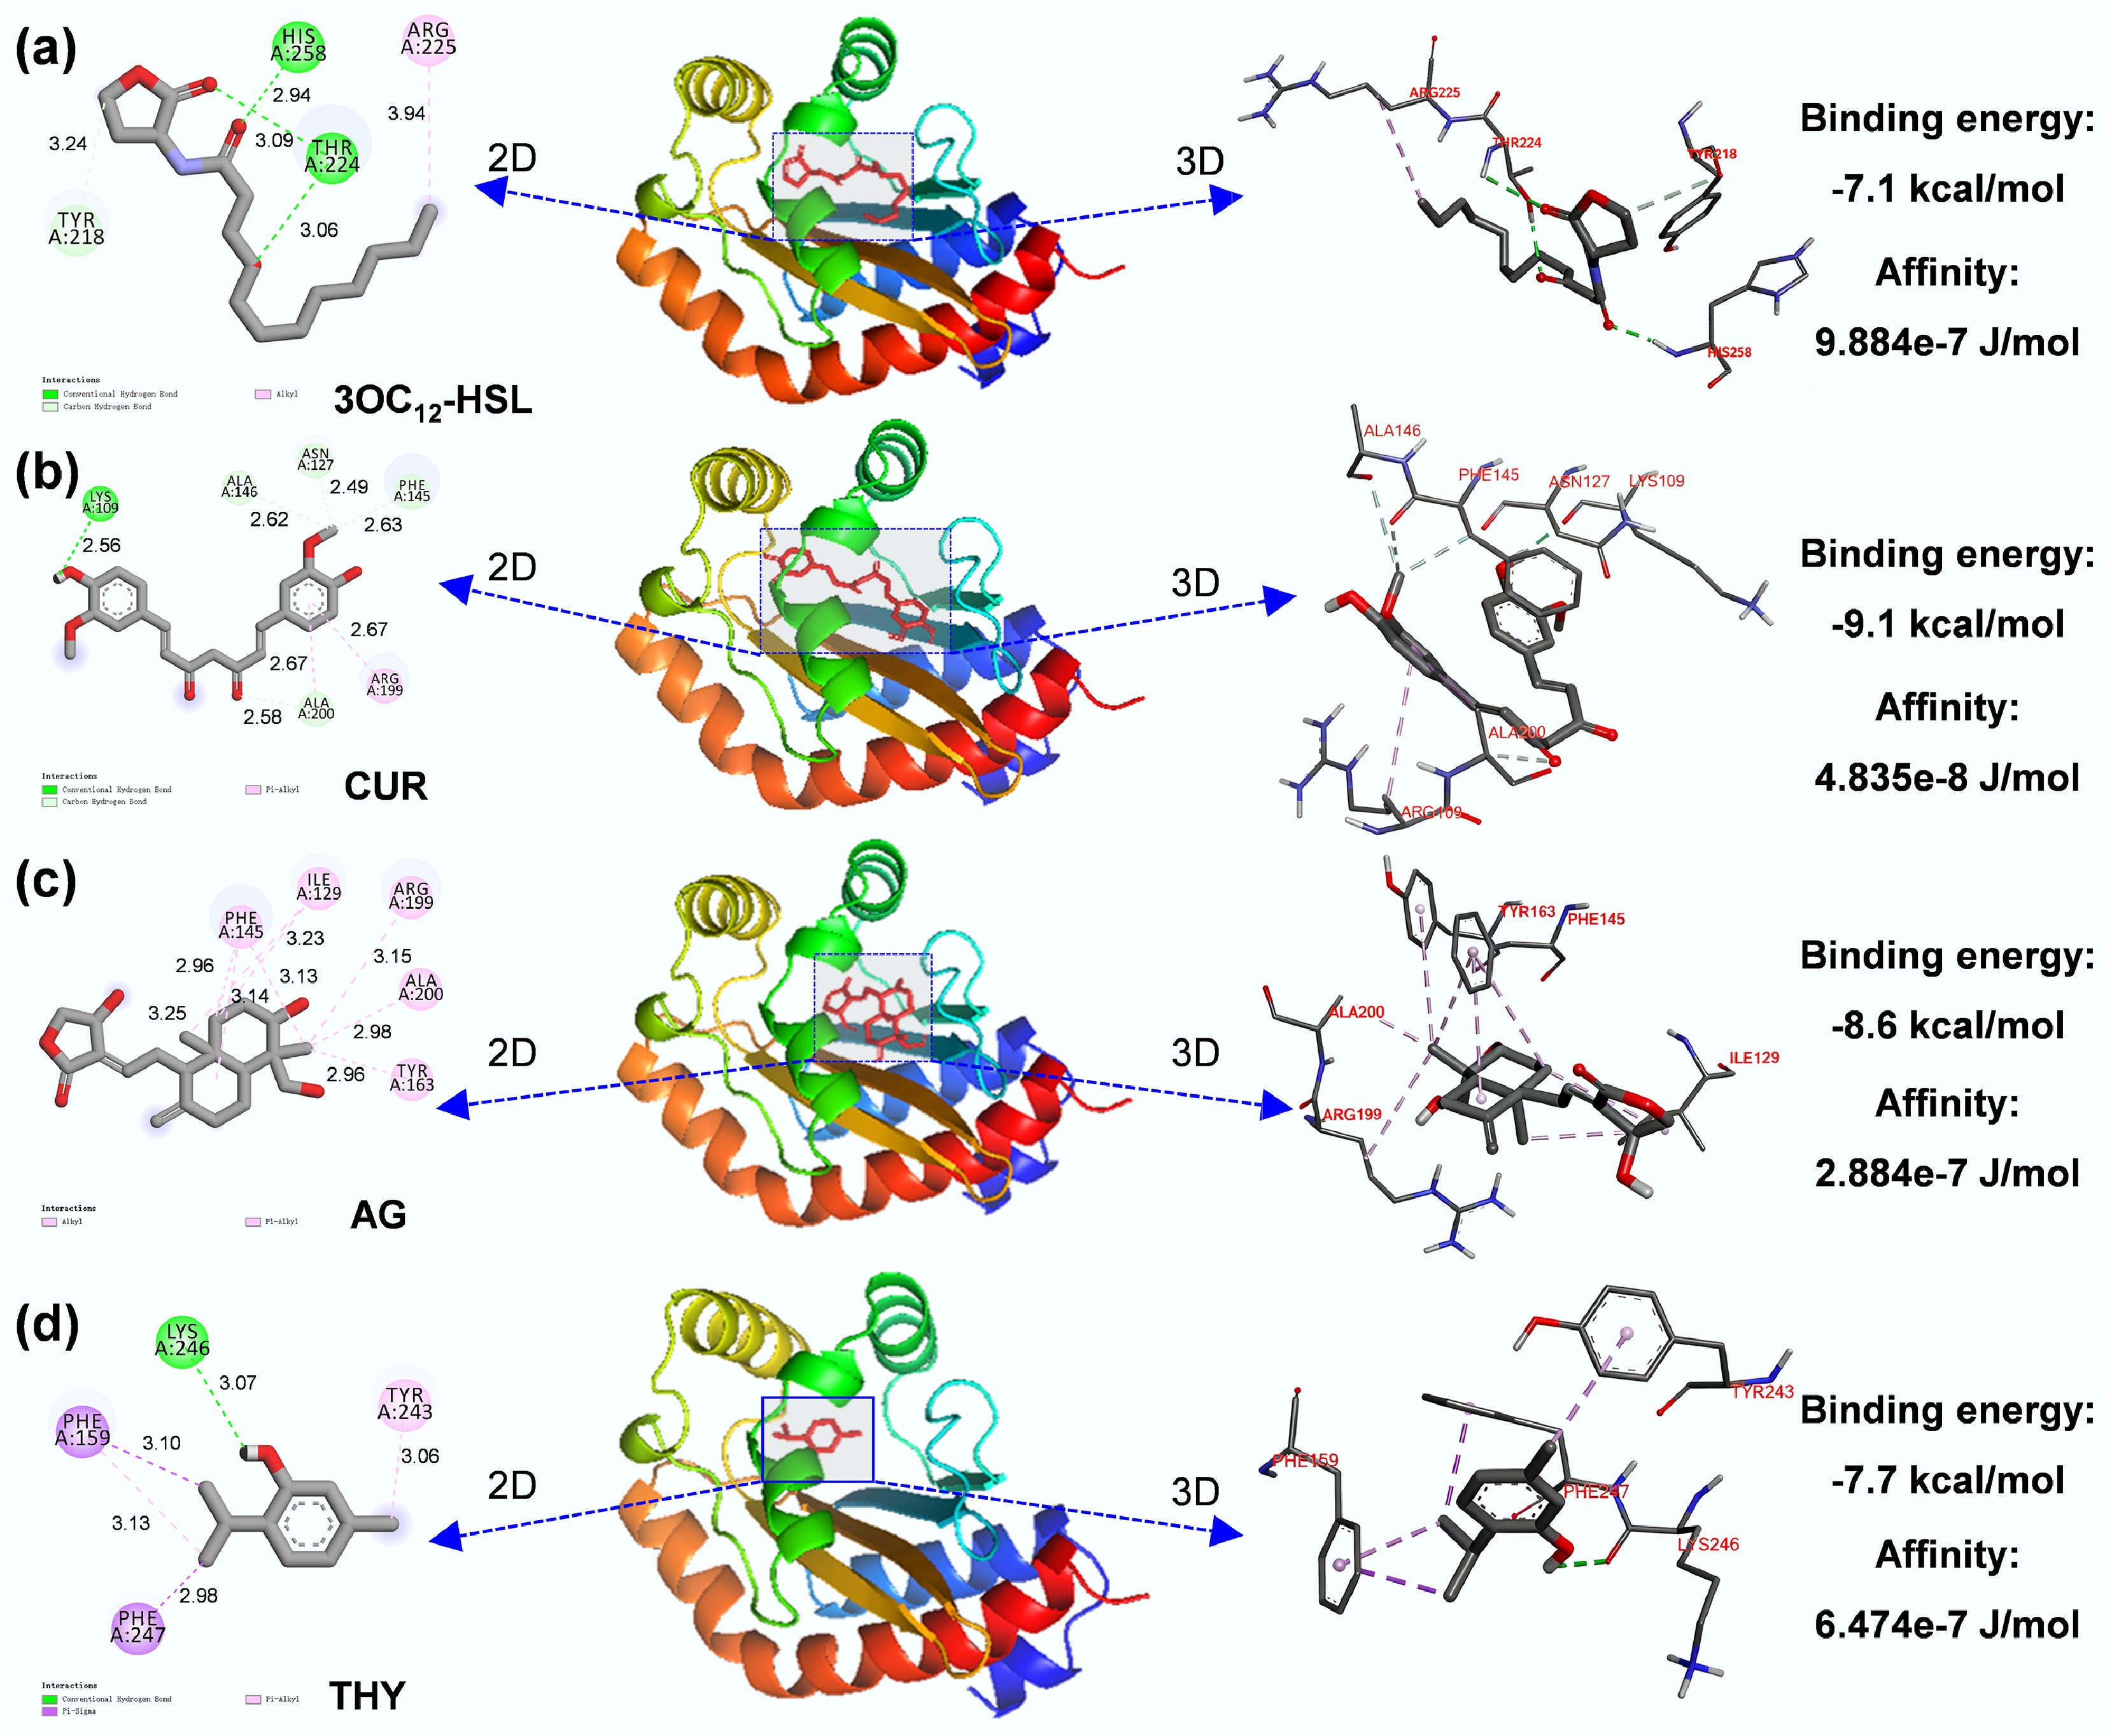
Figure 5.
Molecular docking predicted amino acid sites for the binding of (a) 3OC12-HSL, (b) CUR, (c) AG, and (d) THY and LasR protein.
Figures
(5)
Tables
(0)