-
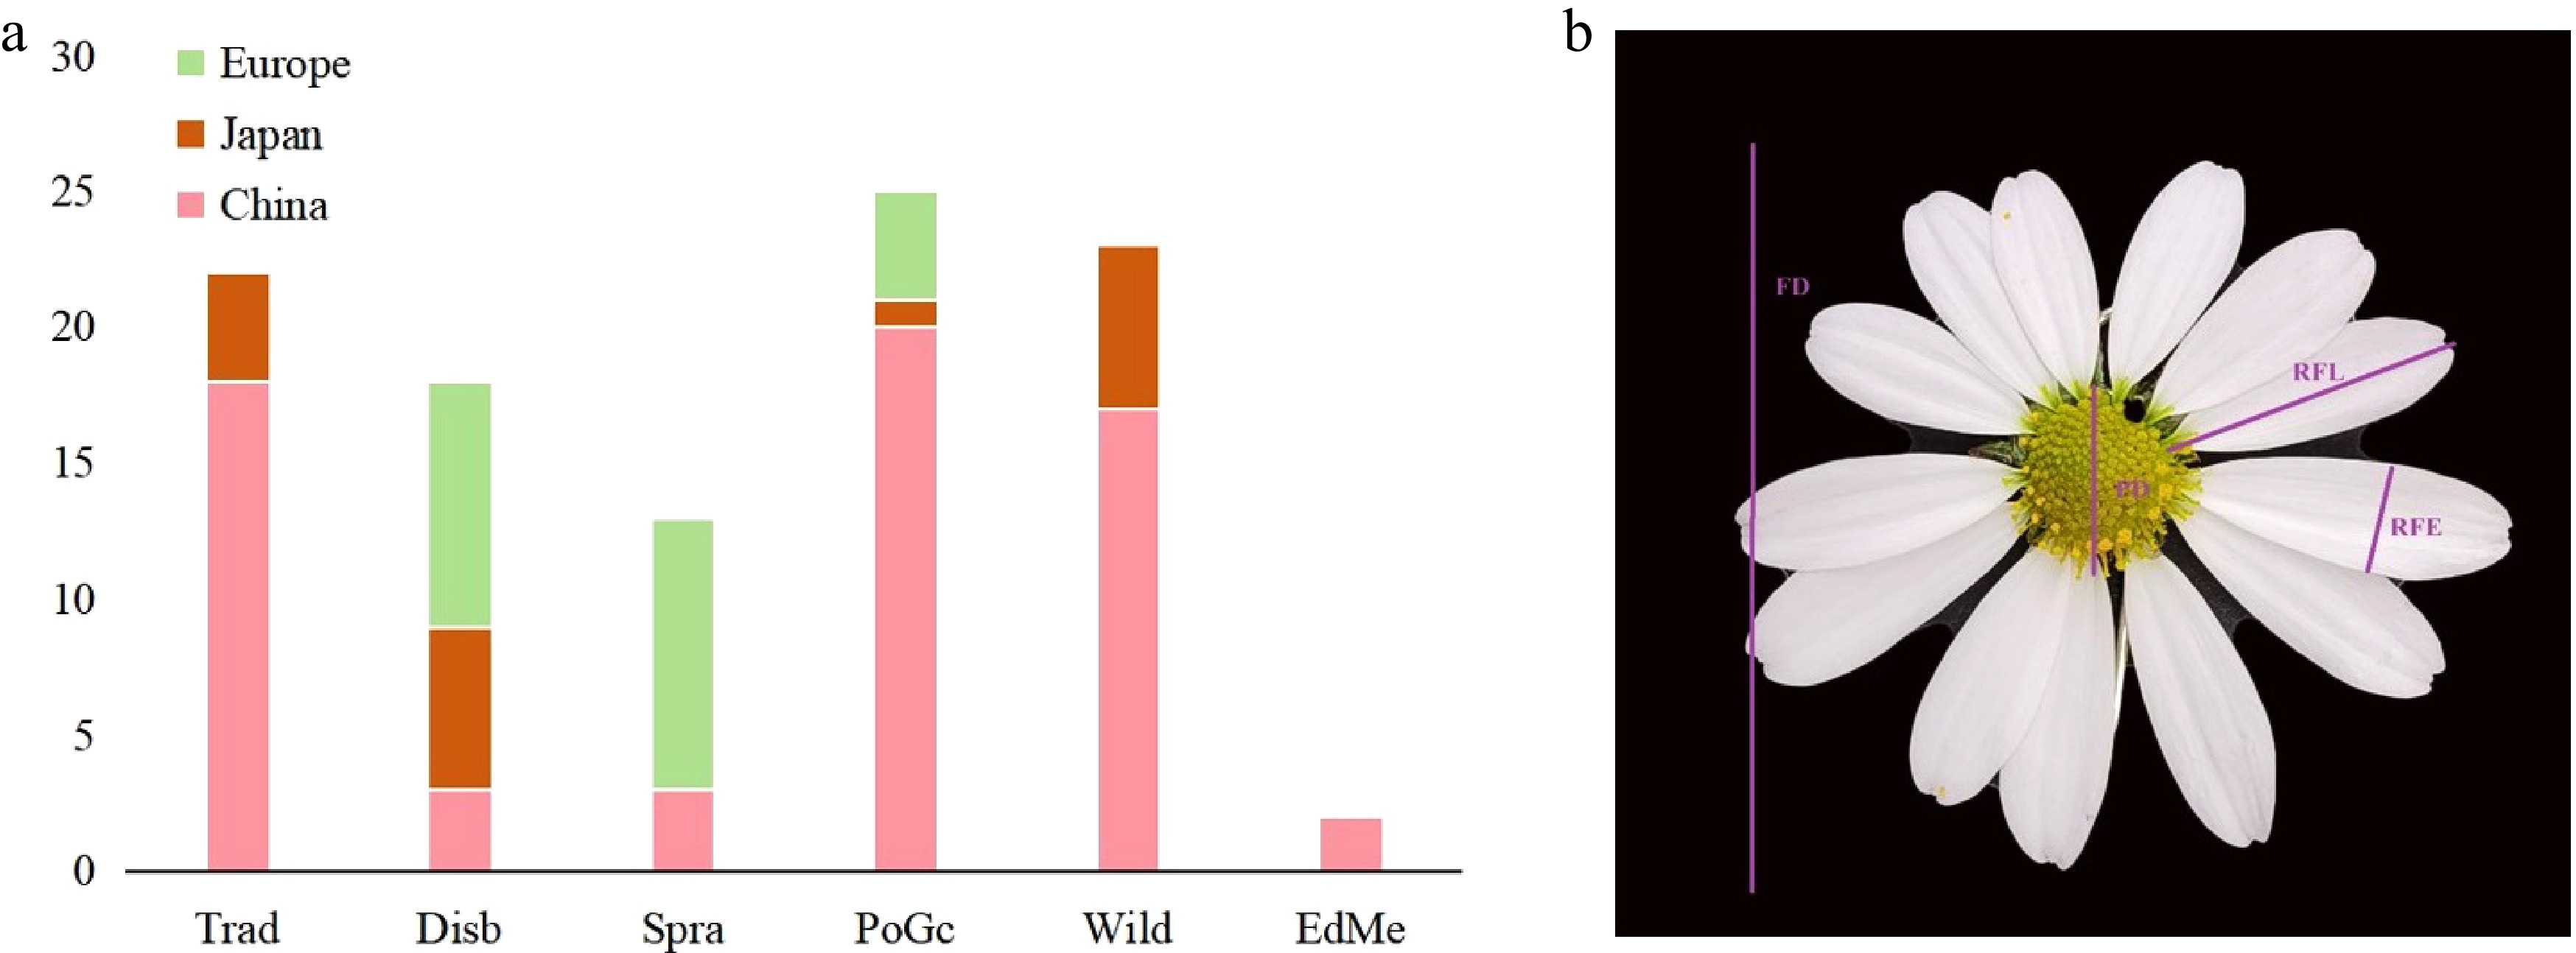
Figure 1.
(a) Distribution map of Chrysanthemum varieties across different regions. (b) Schematic diagram of measurement indicators.
-
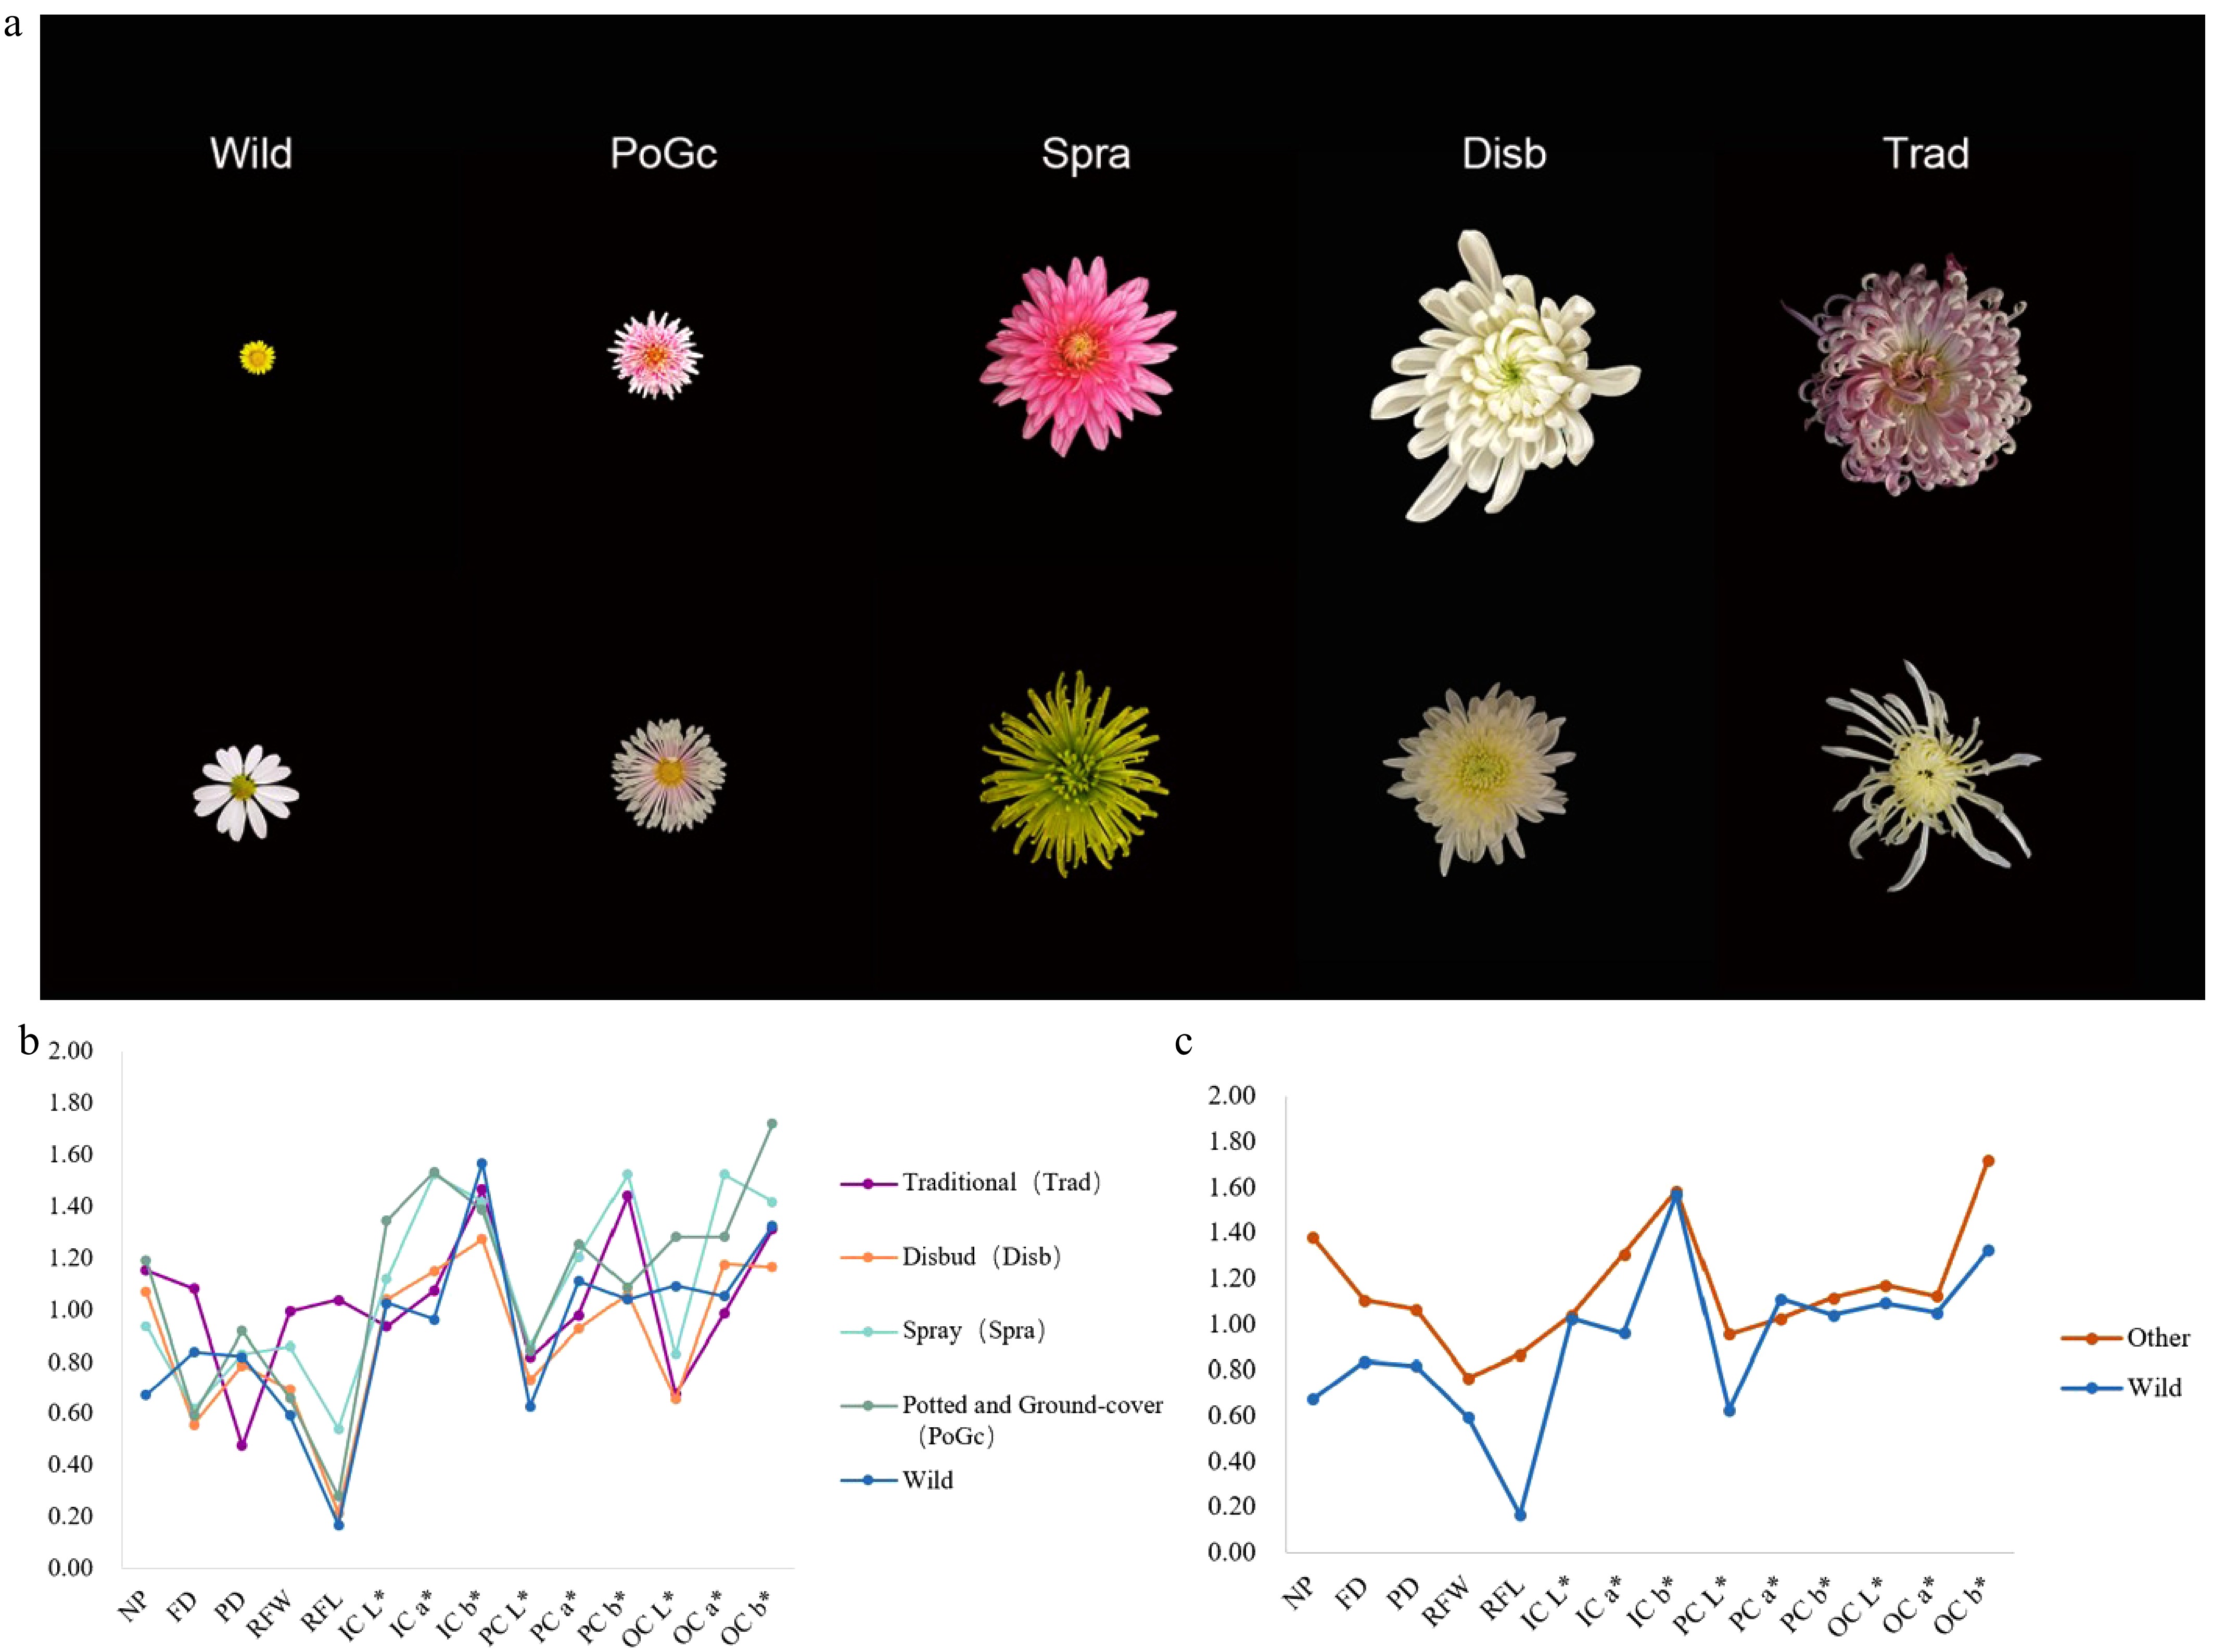
Figure 2.
(a) Different flower types of the chrysanthemum germplasm. (b) Shannon-Wiener of phenotypic traits of different types of chrysanthemum germplasm. (c) Shannon-Wiener of phenotypic traits of wild type and other types of chrysanthemum germplasm.
-
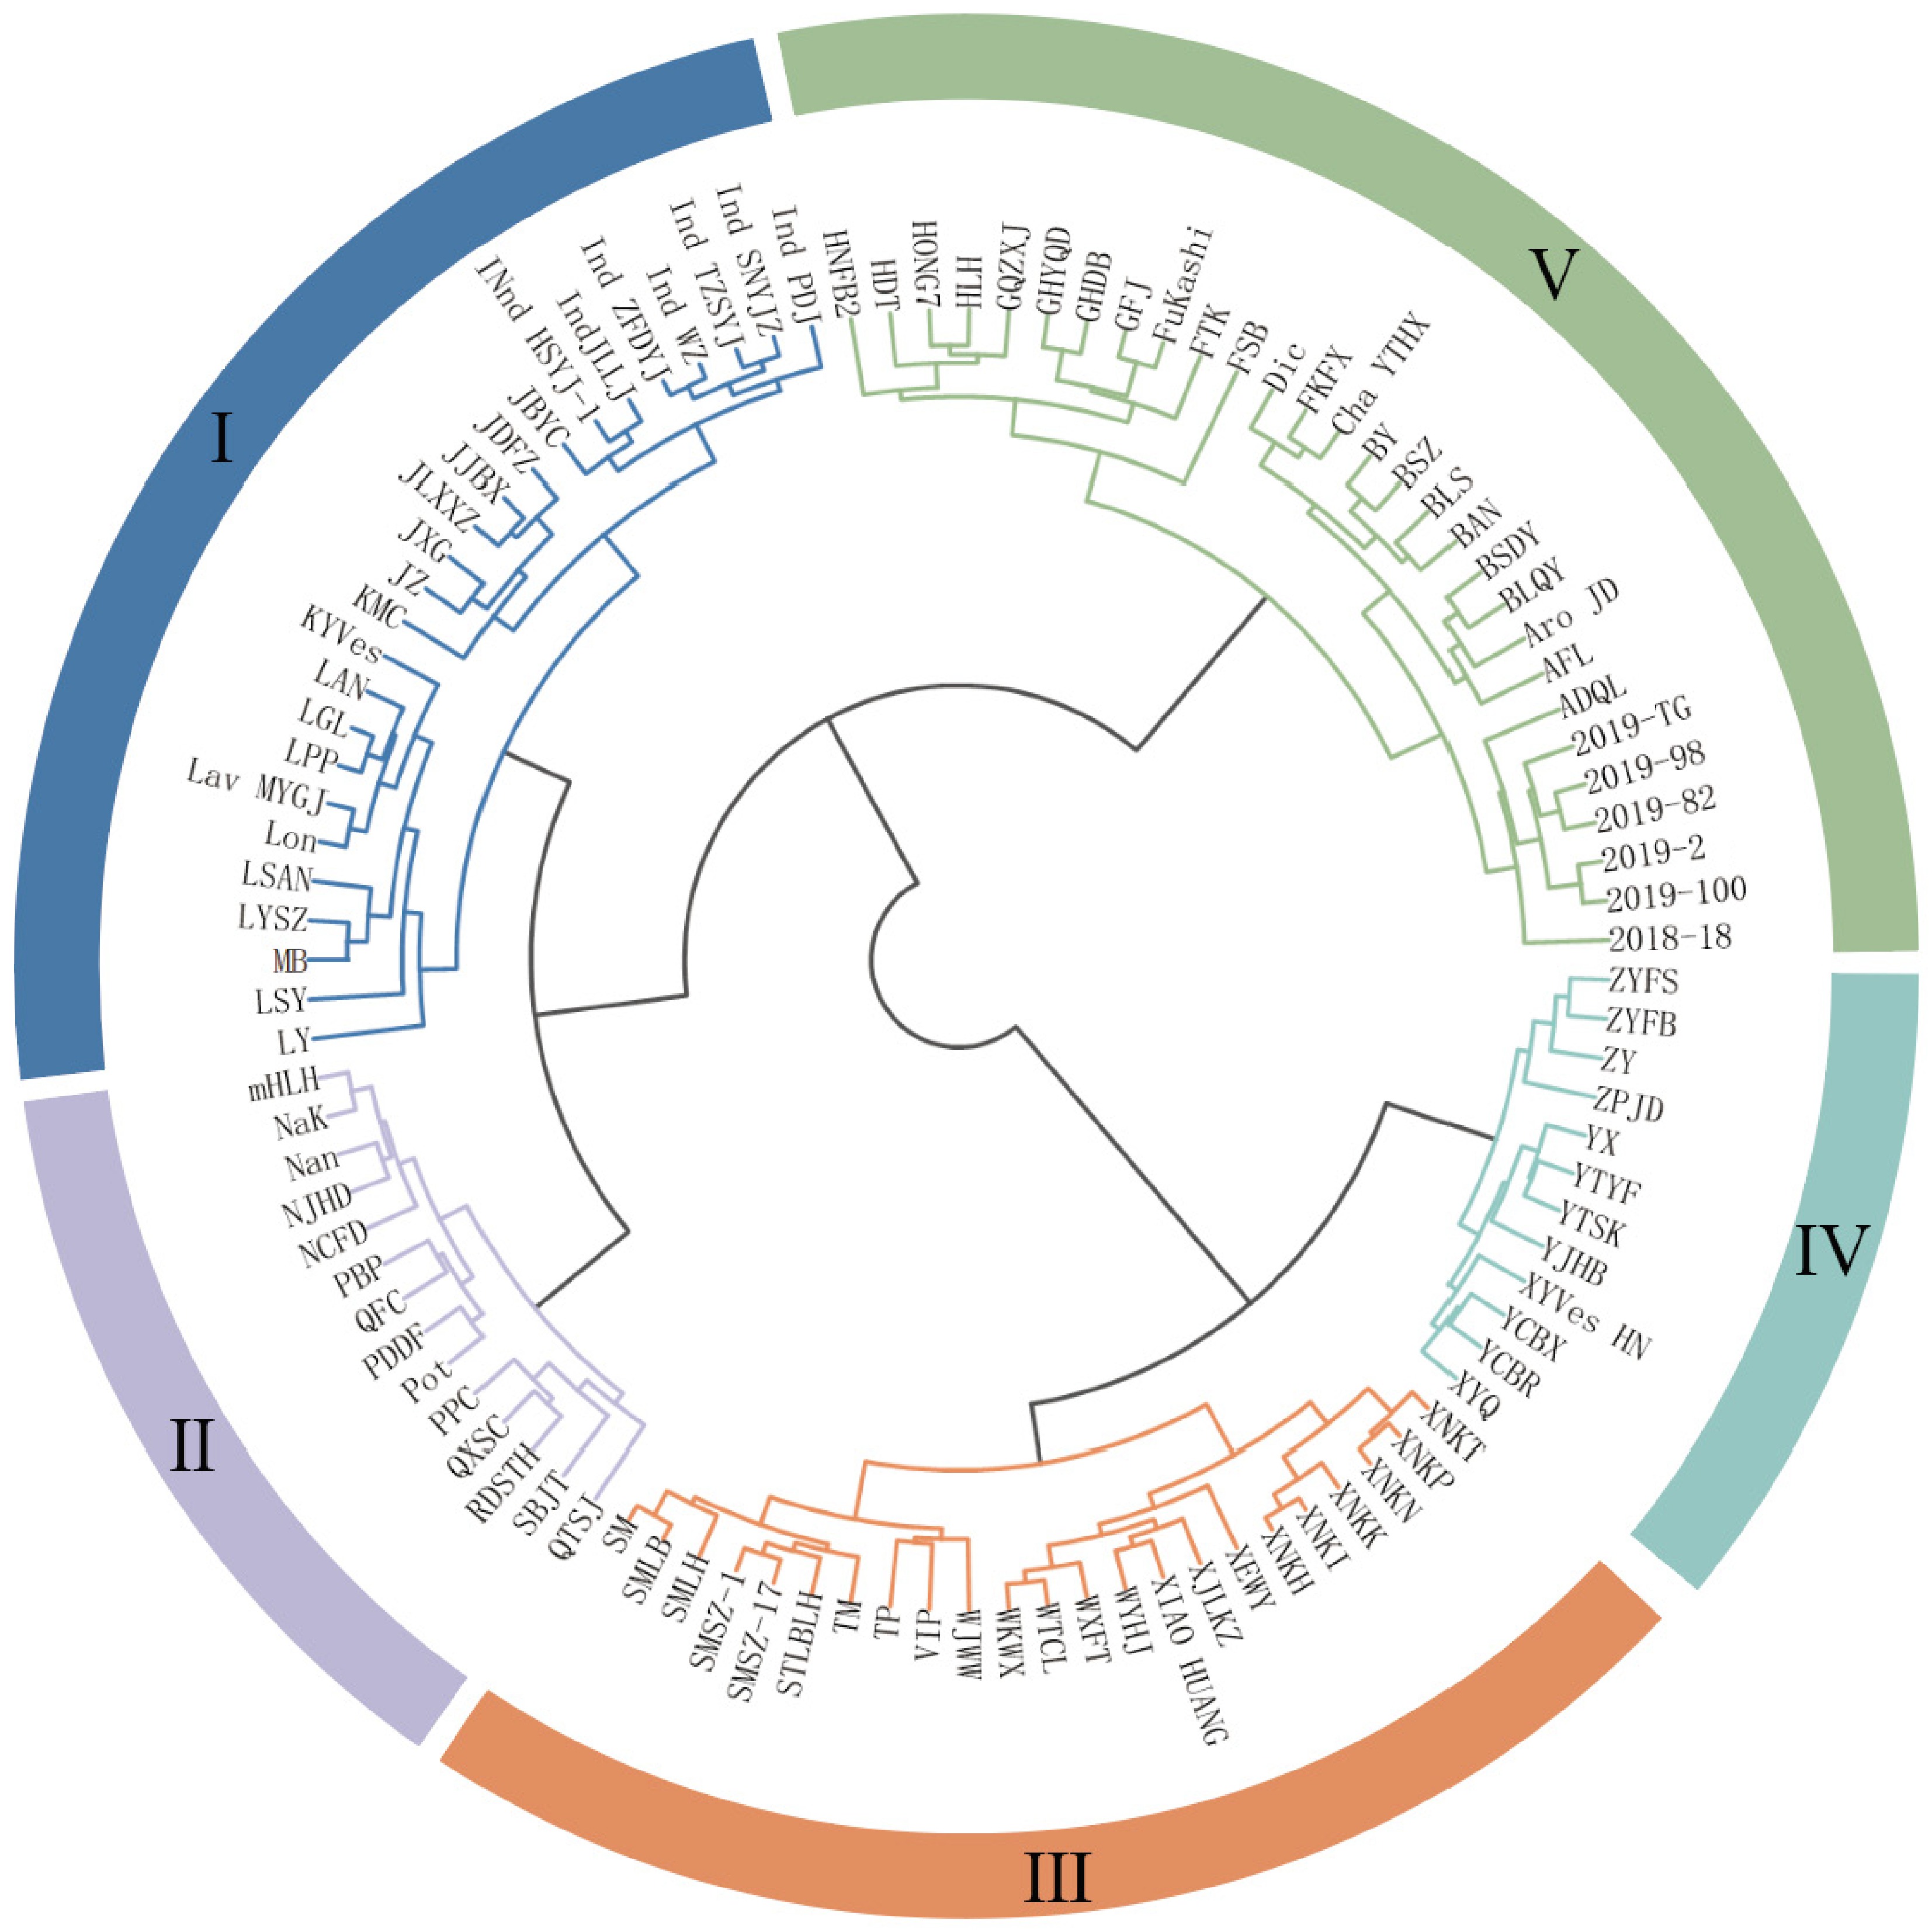
Figure 3.
Cluster analysis of 103 Chrysanthemum germplasm accessions.
-
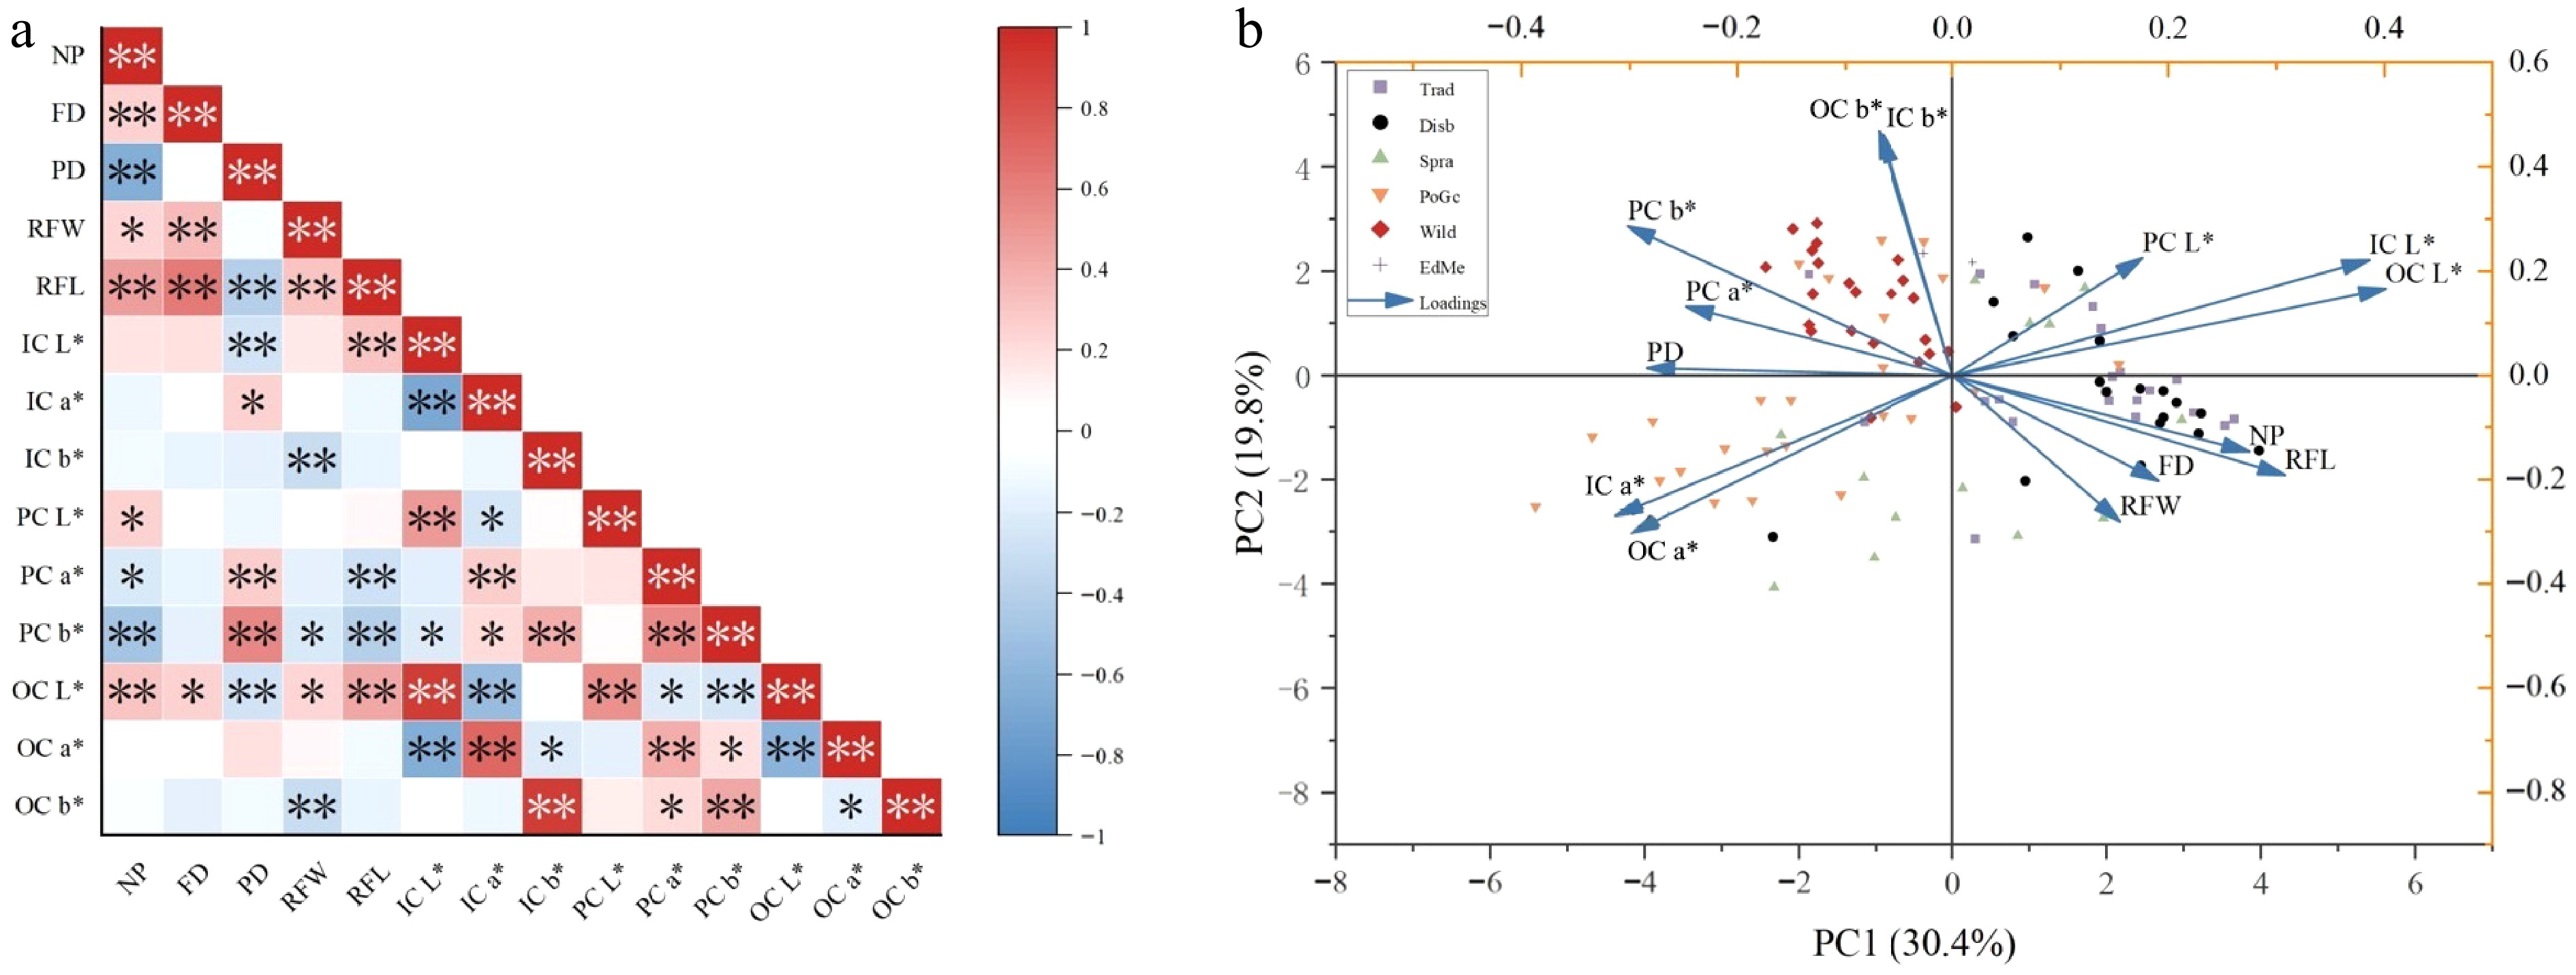
Figure 4.
(a) Heatmap of correlation analysis for 14 traits. (b) Biplot based on the principal component analysis of 103 Chrysanthemum accessions. Note: * means significant difference (p < 0.05); ** means extremely significant difference (p < 0.01).
-
Trait Min. Max. Median Mean Standard difference Coefficient of variation (CV; %) Number of petals (NP) 11.00 528.43 108.22 137.77 111.83 81.17 Flower head diameter (FD; cm) 1.47 53.03 5.44 6.90 6.38 92.48 Pistil diameter (PD; cm) 0.00 2.24 0.53 0.55 0.57 104.79 Ray florets width (RFW; cm) 0.11 1.06 0.36 0.42 0.22 51.78 Ray florets length (RFL; cm) 0.43 8.42 2.05 2.60 1.77 68.06 Table 1.
Analysis of genetic diversity for floral traits of Chrysanthemum.
-
Trait Trad Disb Spra PoGc EdMe Wild F NP 202.82 ± 135.63 229.73 ± 71.94 181.66 ± 79.58 96.13 ± 62.42 174.78 ± 1.26 20.51 ± 5.22 20.27** FD 13.67 ± 10.82 7.57 ± 1.86 6.42 ± 2.08 4.66 ± 1.18 3.58 ± 0.51 2.92 ± 0.98 11.78** PD 0.29 ± 0.70 0.20 ± 0.36 0.32 ± 0.58 0.78 ± 0.45 0.00 ± 0.00 0.94 ± 0.33 8.43** RFW 0.44 ± 0.21 0.50 ± 0.20 0.60 ± 0.24 0.35 ± 0.21 0.27 ± 0.05 0.31 ± 0.14 5.35** RFL 4.98 ± 1.58 3.02 ± 1.17 2.27 ± 1.23 1.75 ± 0.62 1.50 ± 0.27 0.94 ± 0.40 40.18** IC L* 76.40 ± 12.23 77.48 ± 18.70 61.86 ± 15.18 56.18 ± 22.05 74.95 ± 2.19 69.14 ± 11.41 5.41** IC a* 2.97 ± 8.20 0.59 ± 7.16 9.91 ± 13.28 23.15 ± 26.34 6.25 ± 0.49 1.81 ± 2.75 7.73** IC b* 10.78 ± 24.83 4.78 ± 31.46 −0.02 ± 32.37 7.12 ± 30.95 61.30 ± 1.84 23.17 ± 31.99 2.51* PC L* 59.76 ± 10.61 63.48 ± 11.54 51.85 ± 11.64 60.38 ± 11.30 69.64 ± 3.38 57.09 ± 4.16 2.85* PC a* 1.43 ± 7.85 −2.96 ± 2.81 −2.91 ± 8.94 8.67 ± 9.03 1.73 ± 2.04 5.89 ± 3.54 9.21** PC b* 32.61 ± 22.43 12.61 ± 14.93 25.21 ± 19.19 48.76 ± 21.74 58.12 ± 11.76 51.34 ± 14.09 12.68** OC L* 81.01 ± 9.14 83.22 ± 15.08 65.71 ± 15.34 60.78 ± 18.30 72.10 ± 2.12 67.07 ± 11.73 8.26** OC a* 2.48 ± 6.48 0.52 ± 7.60 9.21 ± 13.25 14.70 ± 11.93 4.93 ± 0.01 1.42 ± 2.63 8.80** OC b* 11.21 ± 24.78 0.45 ± 24.70 −2.02 ± 28.10 1.80 ± 24.74 38.30 ± 0.99 18.97 ± 25.62 2.62* * p < 0.05; ** p < 0.01. Table 2.
Comparative analysis of Chrysanthemum populations.
-
Traits Trad Disb Spra PoGc Wild NP 66.87 31.32 43.81 64.93 25.47 FD 79.14 24.53 32.36 25.45 33.54 PD 236.65 180.53 181.28 57.62 34.76 RFW 47.09 39.33 39.52 58.62 46.48 RFL 31.67 38.86 45.47 35.39 42.95 Table 3.
Coefficients of variation of floral traits of the five populations of Chrysanthemum (CV; %).
-
Trait PV1 PV2 PV3 PV4 PV5 NP 0.277 −0.146 0.411 0.154 −0.292 FD 0.196 −0.202 0.027 0.373 0.535 PD −0.278 −0.004 −0.520 0.091 0.248 RFW 0.161 −0.276 −0.091 0.236 0.209 RFL 0.311 −0.189 0.193 0.265 0.272 IC L* 0.383 0.229 −0.276 0.091 −0.037 IC a* −0.307 −0.279 0.155 0.200 −0.055 IC b* −0.076 0.457 0.388 0.054 0.241 PC L* 0.174 0.228 −0.123 0.413 −0.461 PC a* −0.251 0.129 −0.070 0.483 −0.248 PC b* −0.306 0.279 −0.154 0.325 0.182 OC L* 0.401 0.168 −0.230 0.173 −0.052 OC a* −0.291 −0.311 0.166 0.320 −0.183 OC b* −0.079 0.464 0.374 0.104 0.208 E 4.249 2.811 1.638 1.474 1.157 CR % 30.353 20.075 11.698 10.532 8.265 CCR % 30.353 50.428 62.126 72.658 80.923 E: eigenvalues; CR: contribution rate; CCR: cumulative contribution rate. Table 4.
Eigenvector plot of PCA for 14 traits in Chrysanthemum.
-
Trait F Trait F NP 0.472** IC b* 0.359** FD 0.340** PC L* 0.470** PD −0.569** PC a* −0.287** RFW 0.122 PC b* −0.267** RFL 0.538** OC L* 0.794** IC L* 0.782** OC a* −0.656** IC a* −0.670** OC b* 0.361** * p < 0.05; ** p < 0.01. Table 5.
Correlation coefficients (CC) between 14 phenotypic traits and the comprehensive value (F).
Figures
(4)
Tables
(5)