-
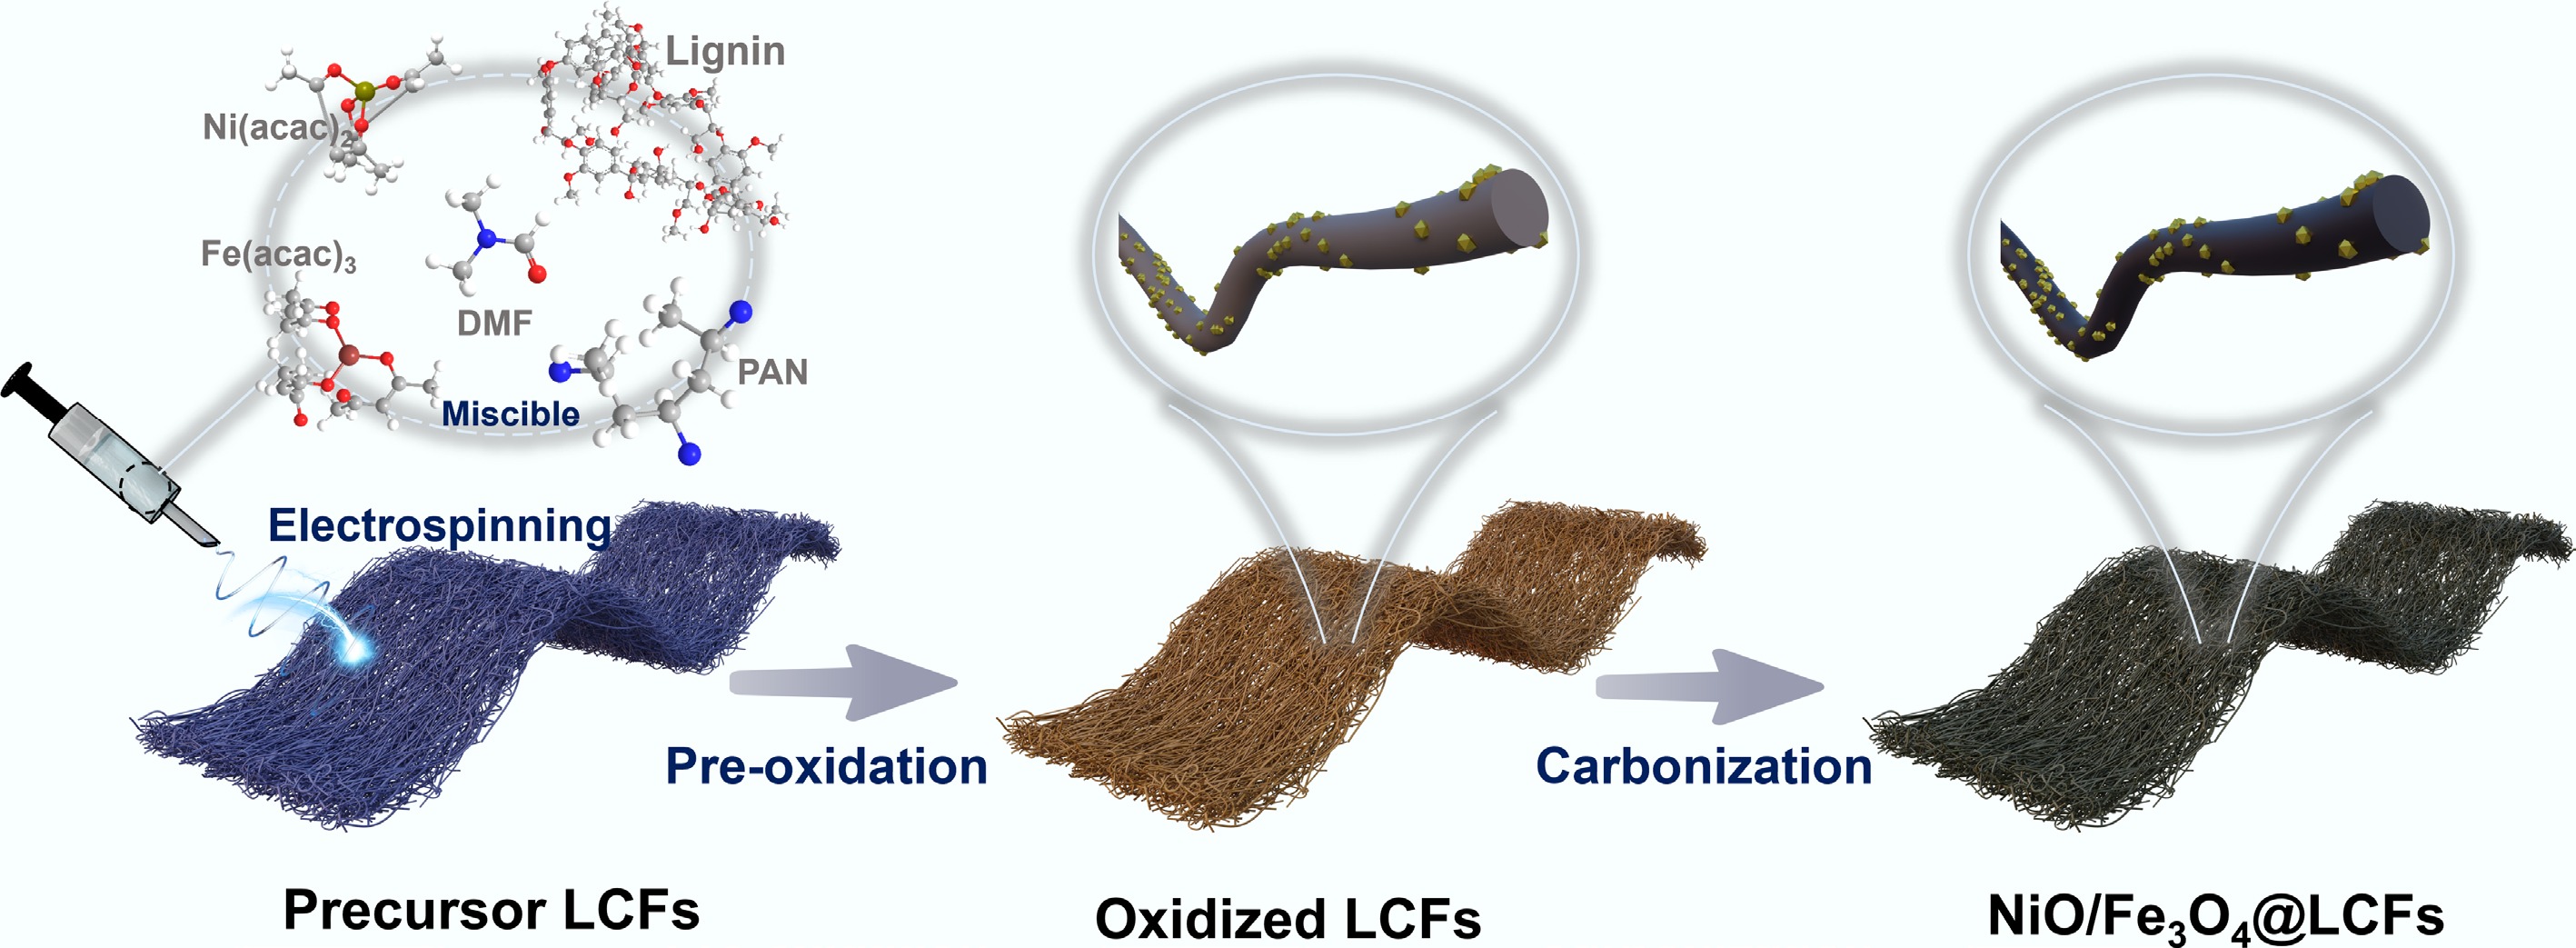
Figure 1.
Schematic diagram of the synthesis of NiO/Fe3O4@LCFs.
-
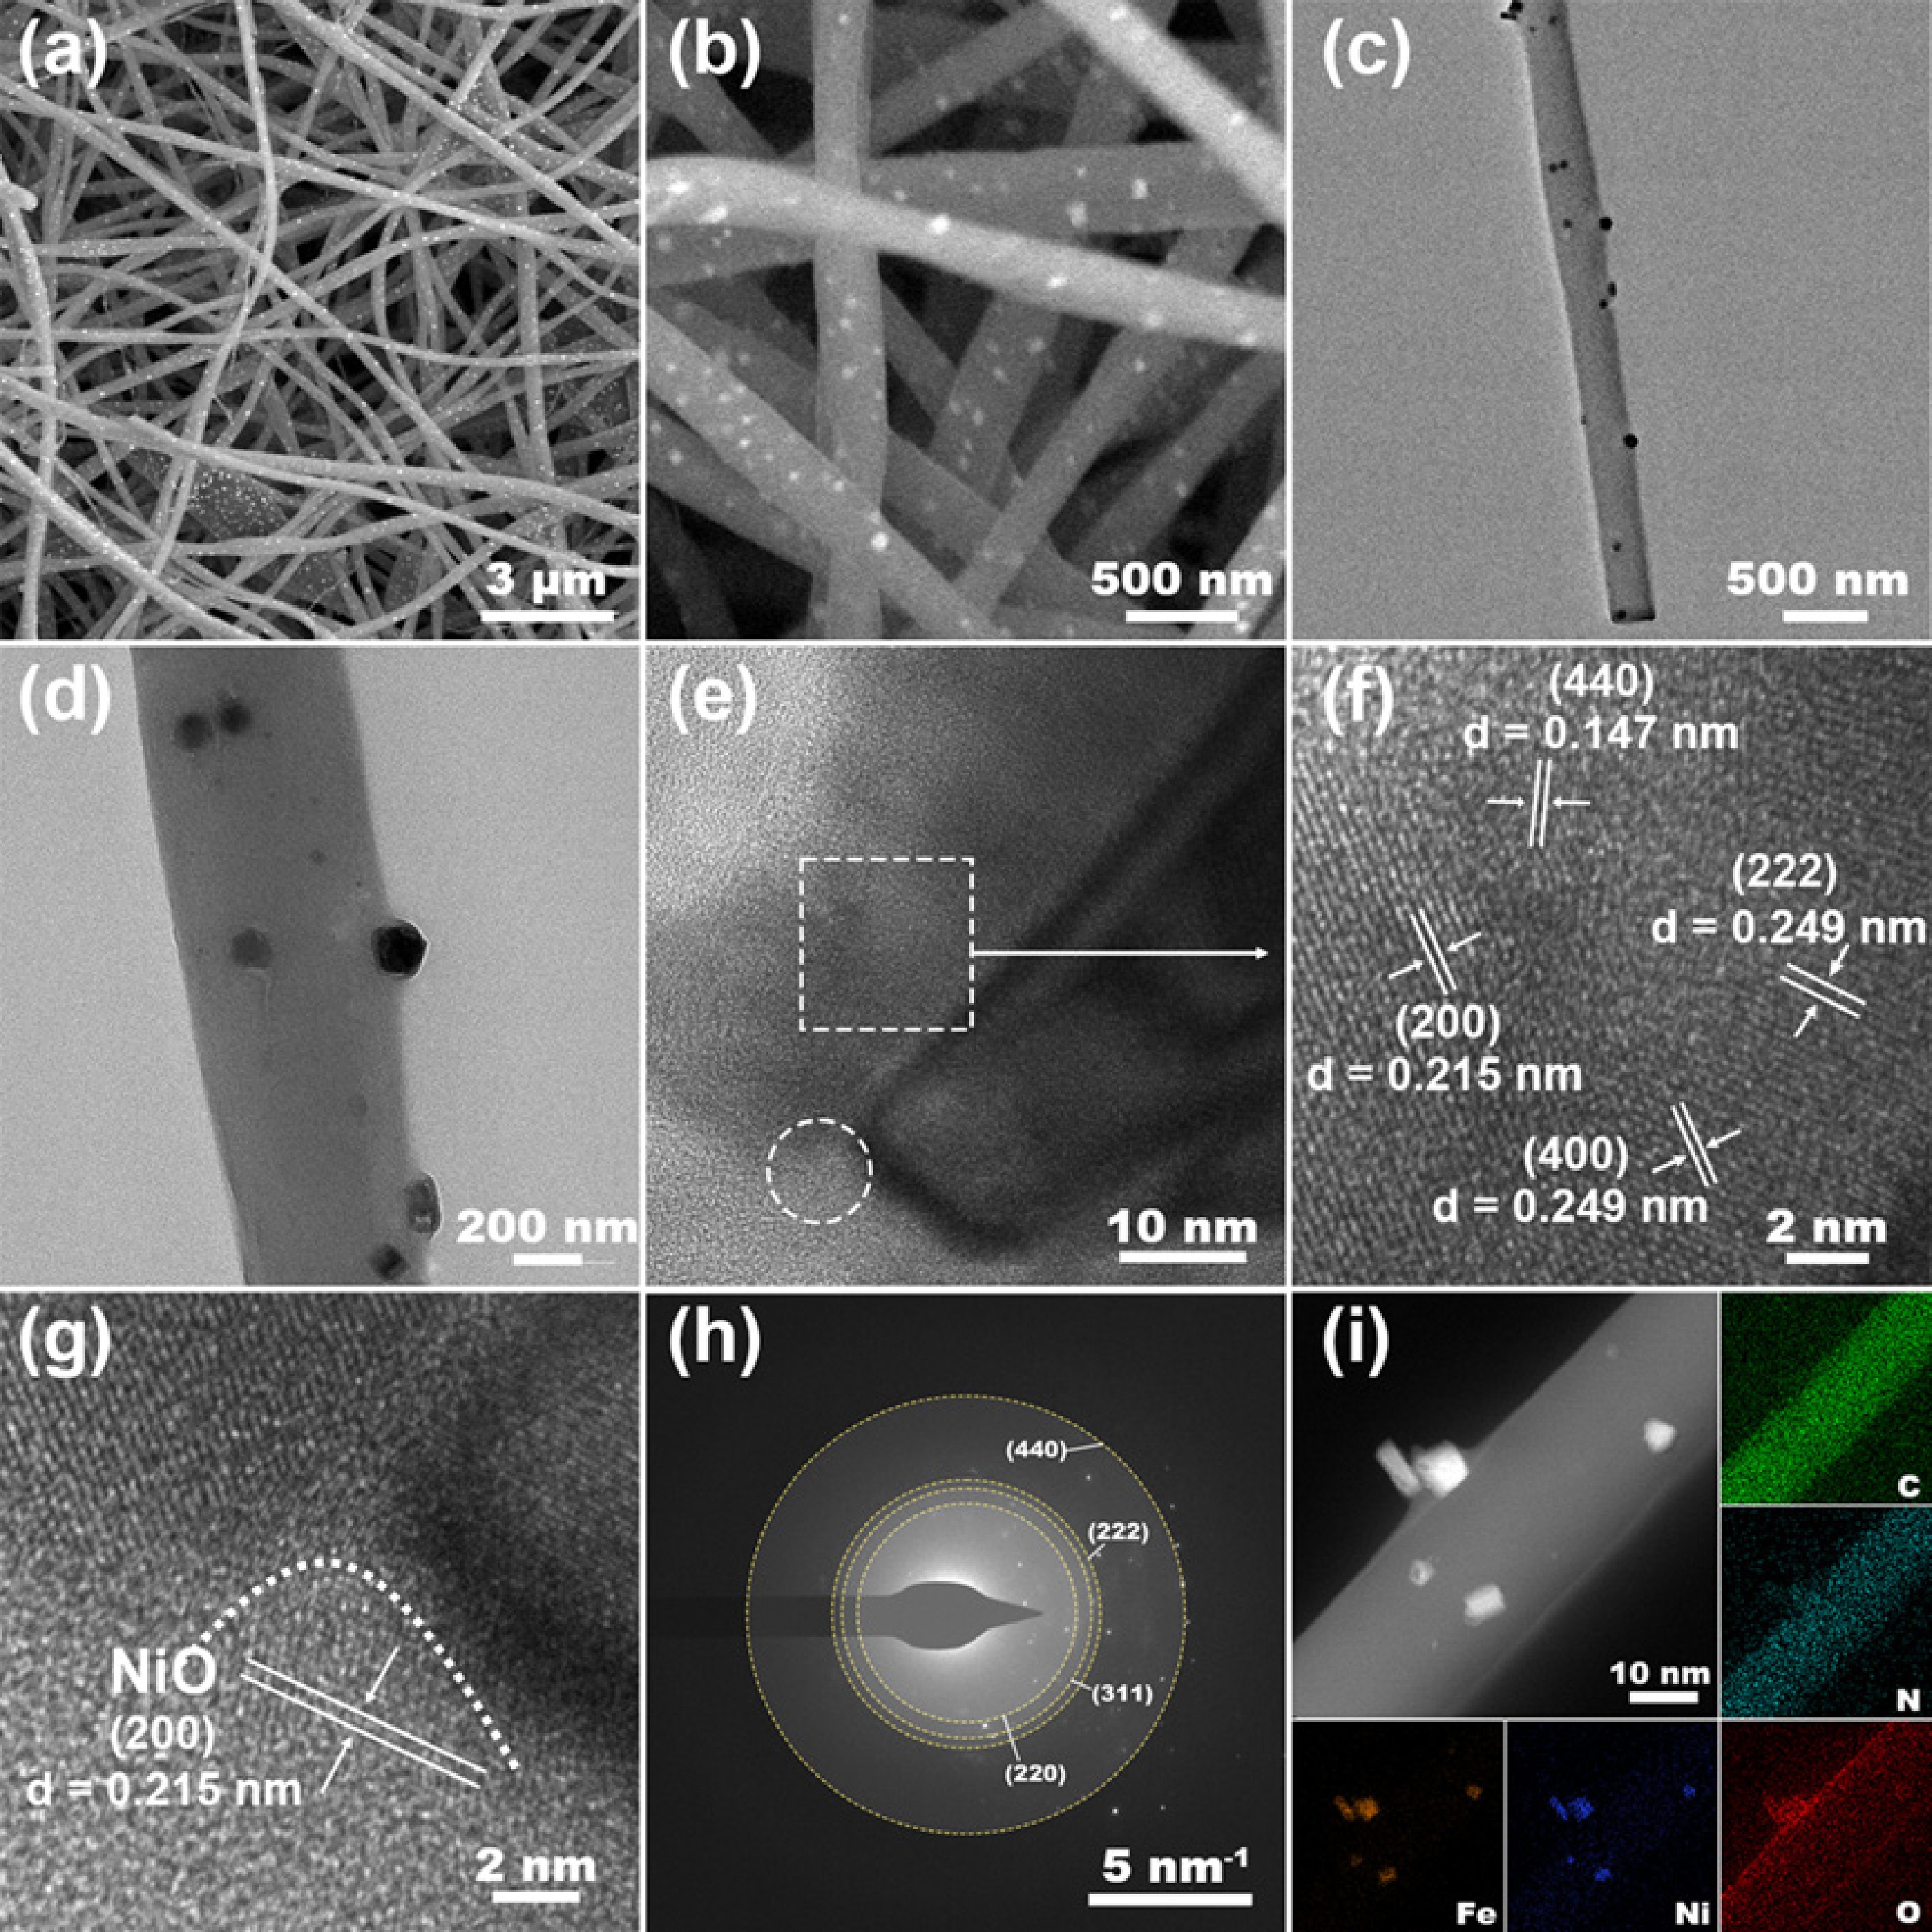
Figure 2.
Structural and elemental characterization of NiO/Fe3O4@LCFs: (a), (b) Low and high magnification SEM images of NiO/Fe3O4@LCFs; (c)–(g) TEM image, HRTEM image of NiO/Fe3O4@LCFs; (h) Electron diffraction pattern of NiO/Fe3O4@LCFs; (i) EDS elemental mapping images of C, N, O, Fe, and Ni elements.
-
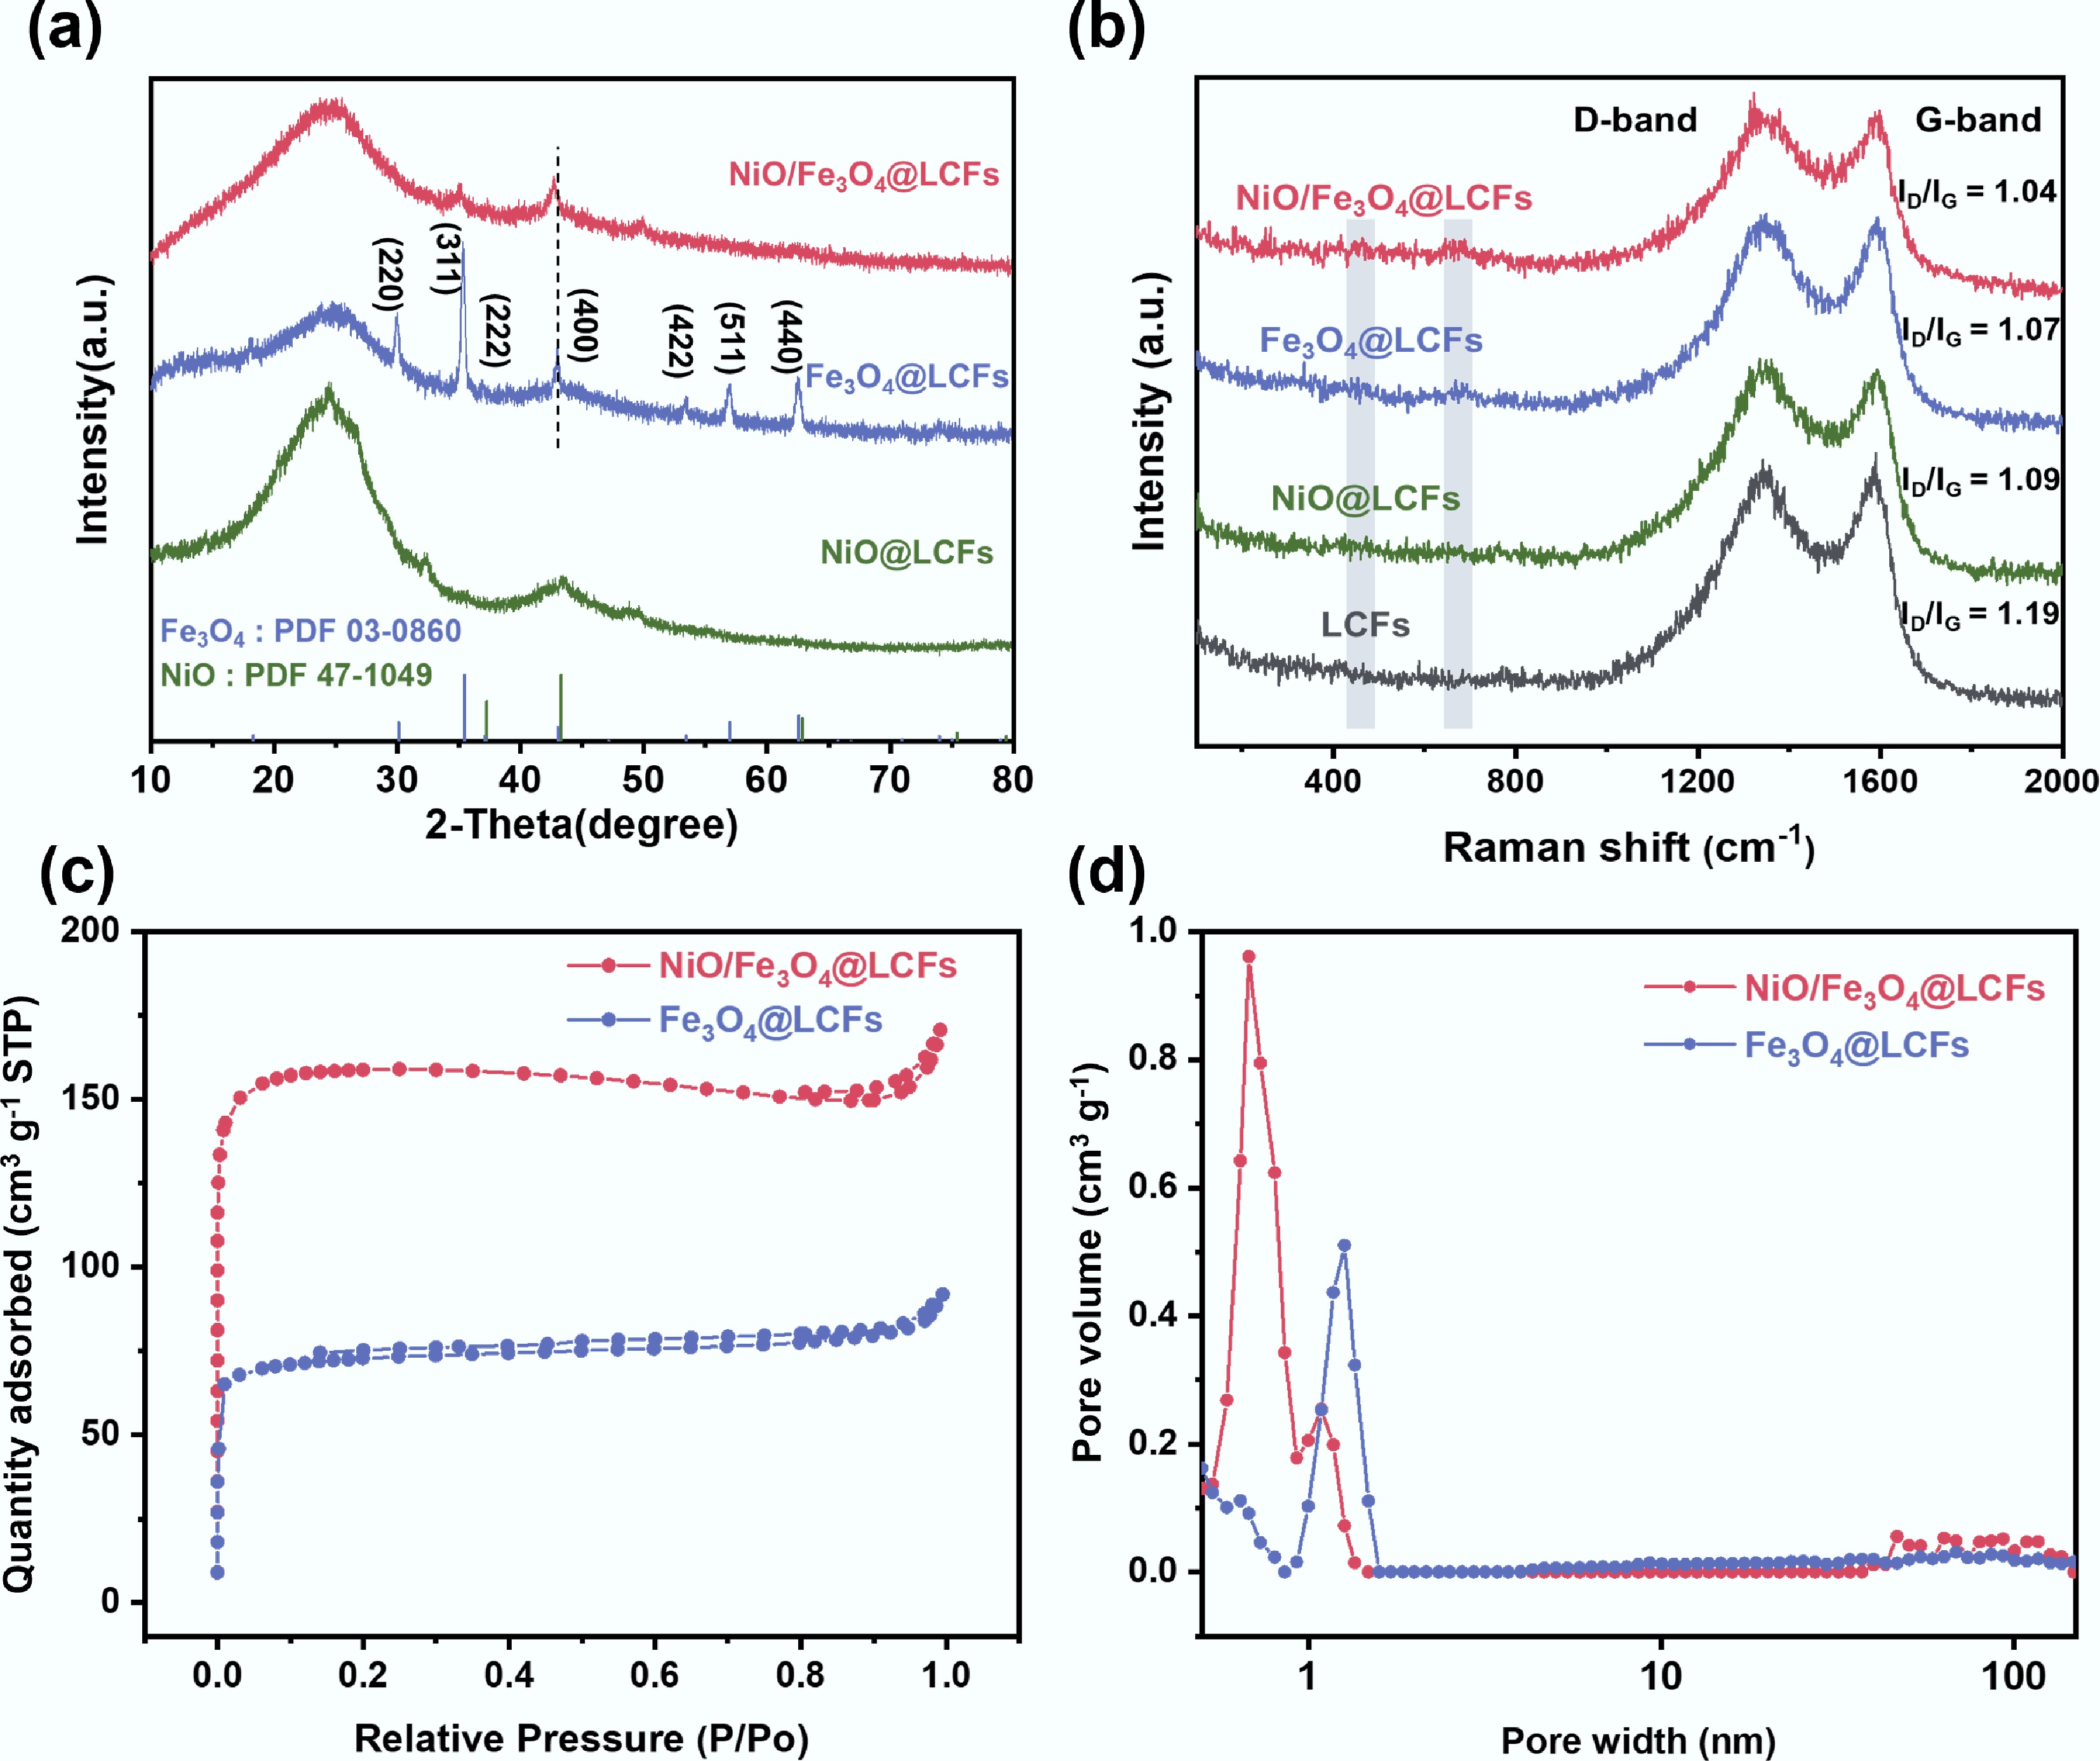
Figure 3.
Structural and physicochemical properties of the catalysts: (a) XRD patterns; (b) Raman spectra; (c) Specific surface area of Fe3O4@LCFs, NiO/Fe3O4@LCFs; (d) Pore size distribution of Fe3O4@LCFs, NiO/Fe3O4@LCFs.
-
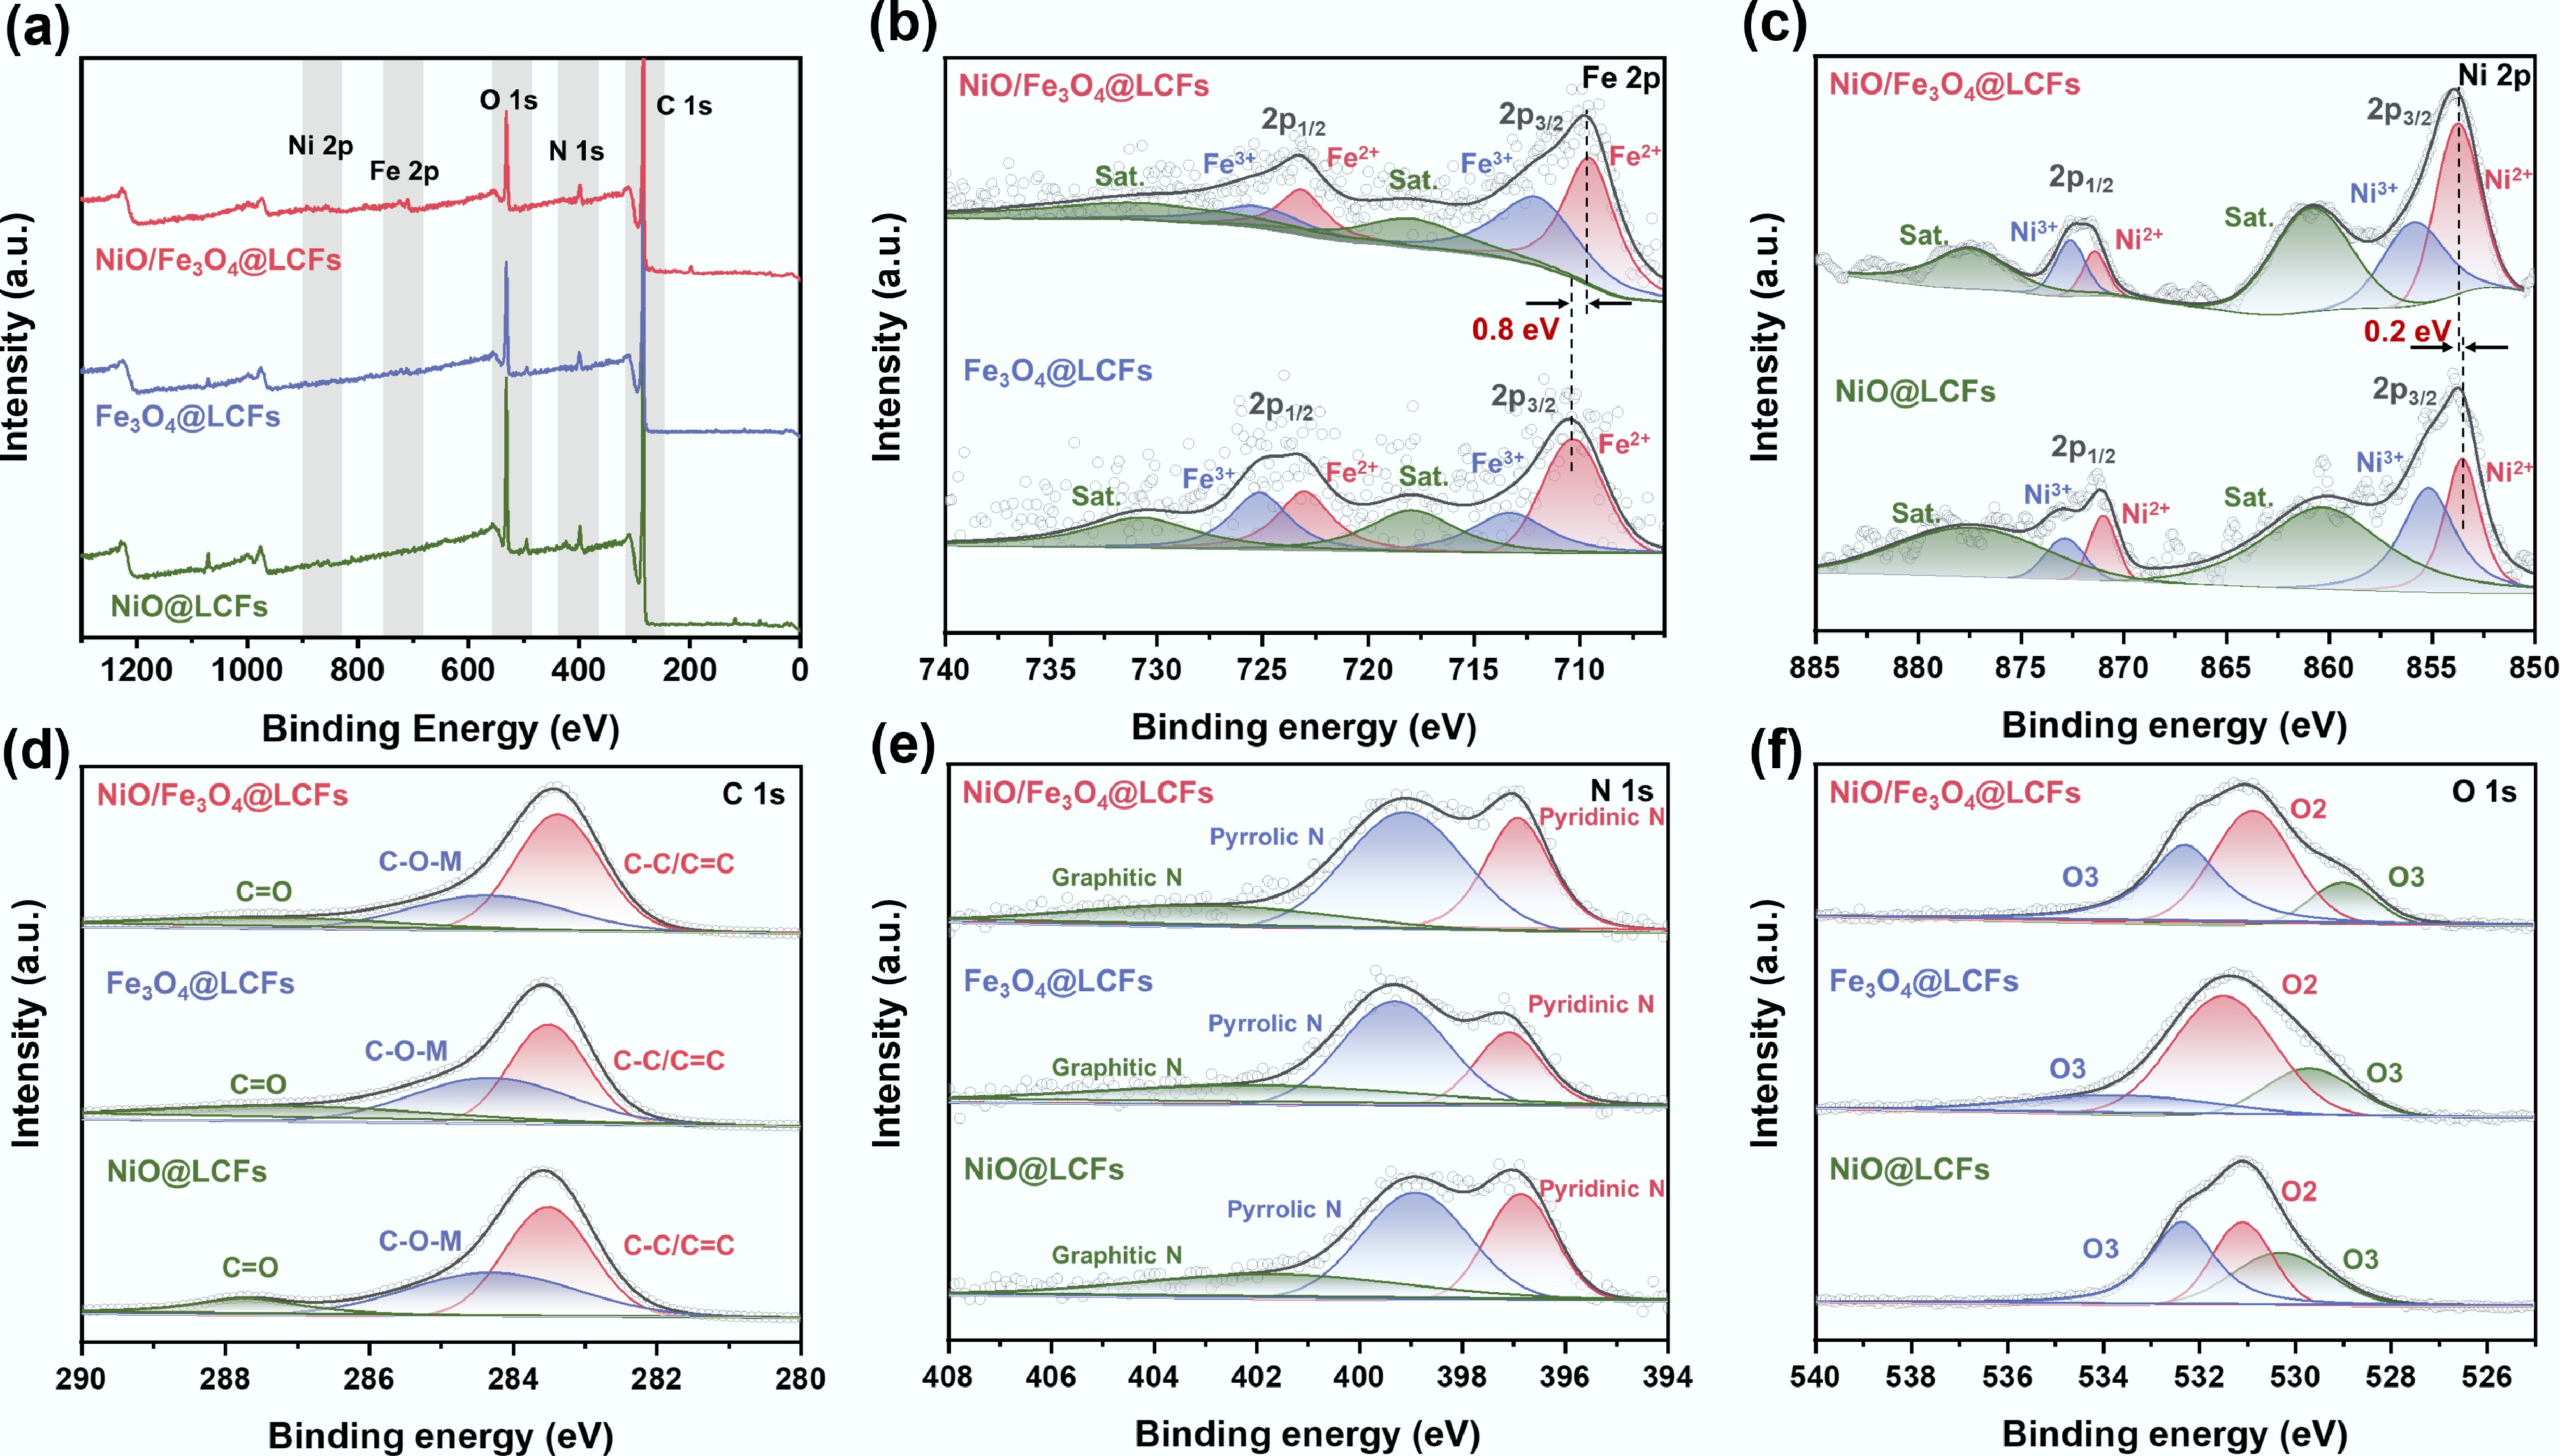
Figure 4.
XPS analysis of the surface composition and chemical states of NiO@LCFs, Fe3O4@LCFs, and NiO/Fe3O4@LCFs: (a) survey scan spectra; (b) Fe 2p; (c) Ni 2p; (d) C 1s; (e) N 1s; (f) O 1s.
-
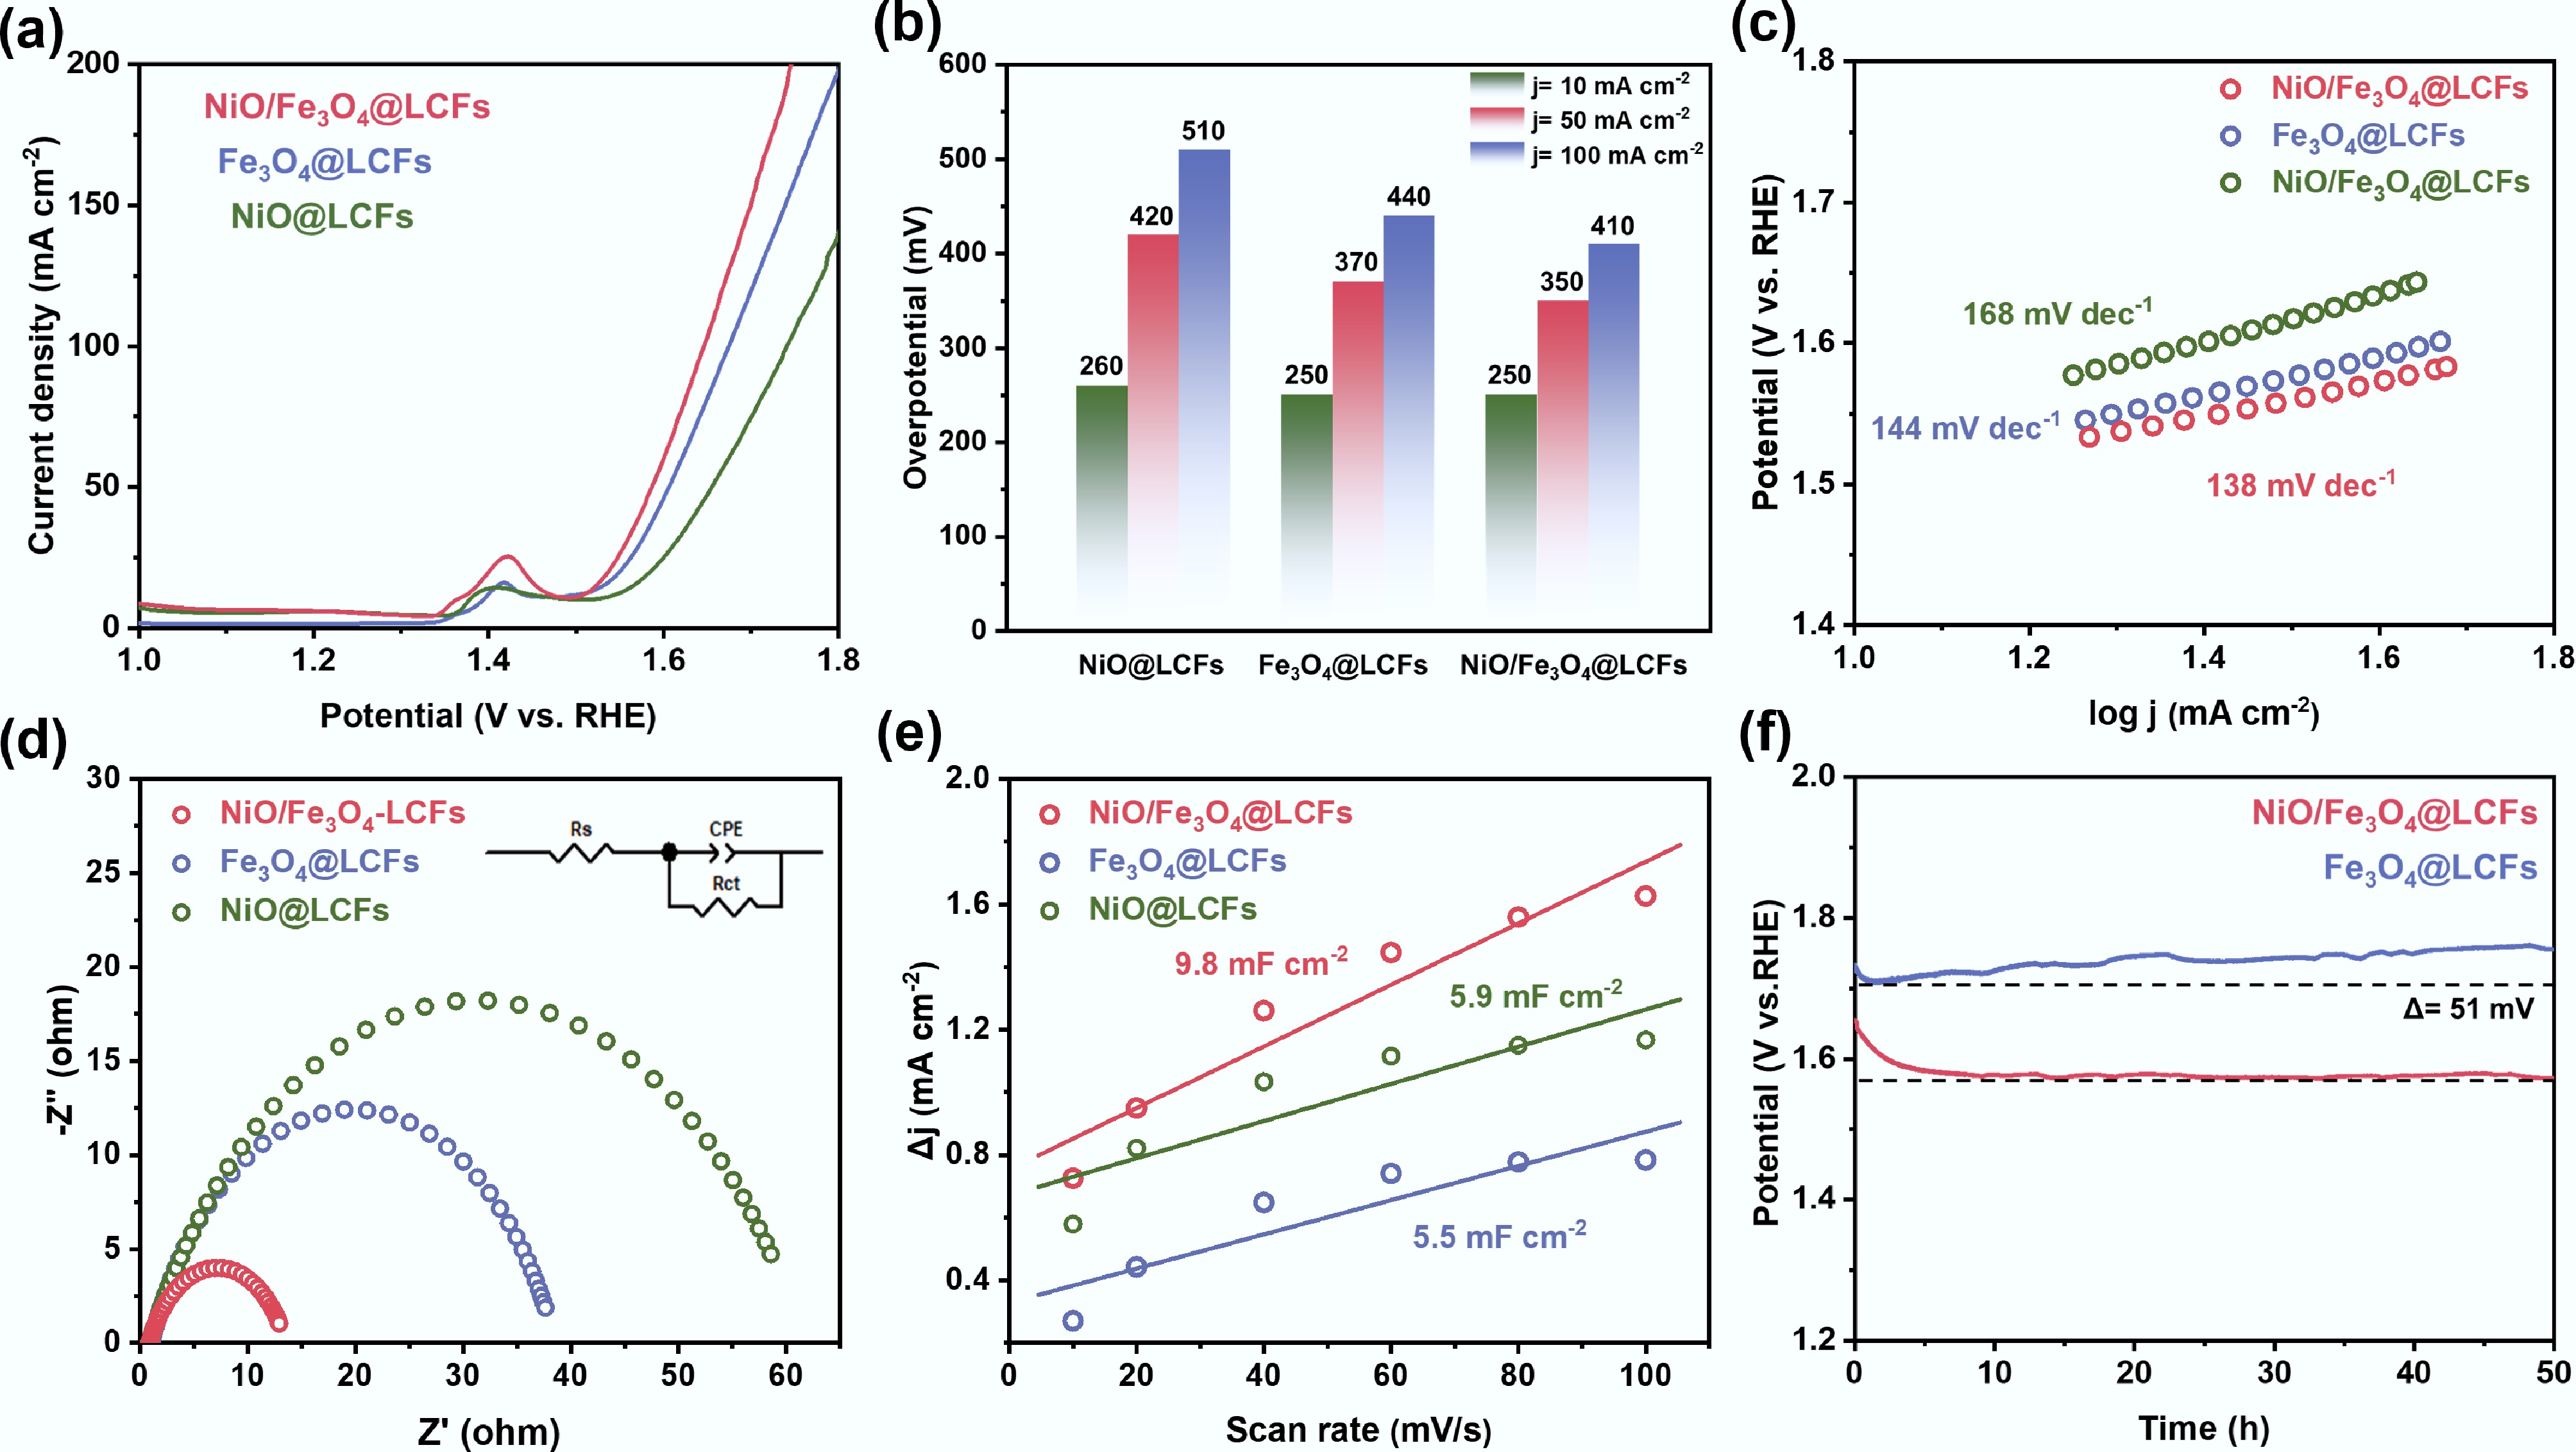
Figure 5.
Electrochemical properties of NiO@LCFs, Fe3O4@LCFs, and NiO/Fe3O4@LCFs: (a) LSV curves; (b) Overpotential required at j = 10, 50, and 100 mA cm−2; (c) Tafel plots; (d) Nyquist plots; (e) Scan rate as a function of ECSA of bilayer capacitance; (f) Stability of Fe3O4@LCFs and NiO/Fe3O4@LCFs at a current density of 100 mA cm−2.
-
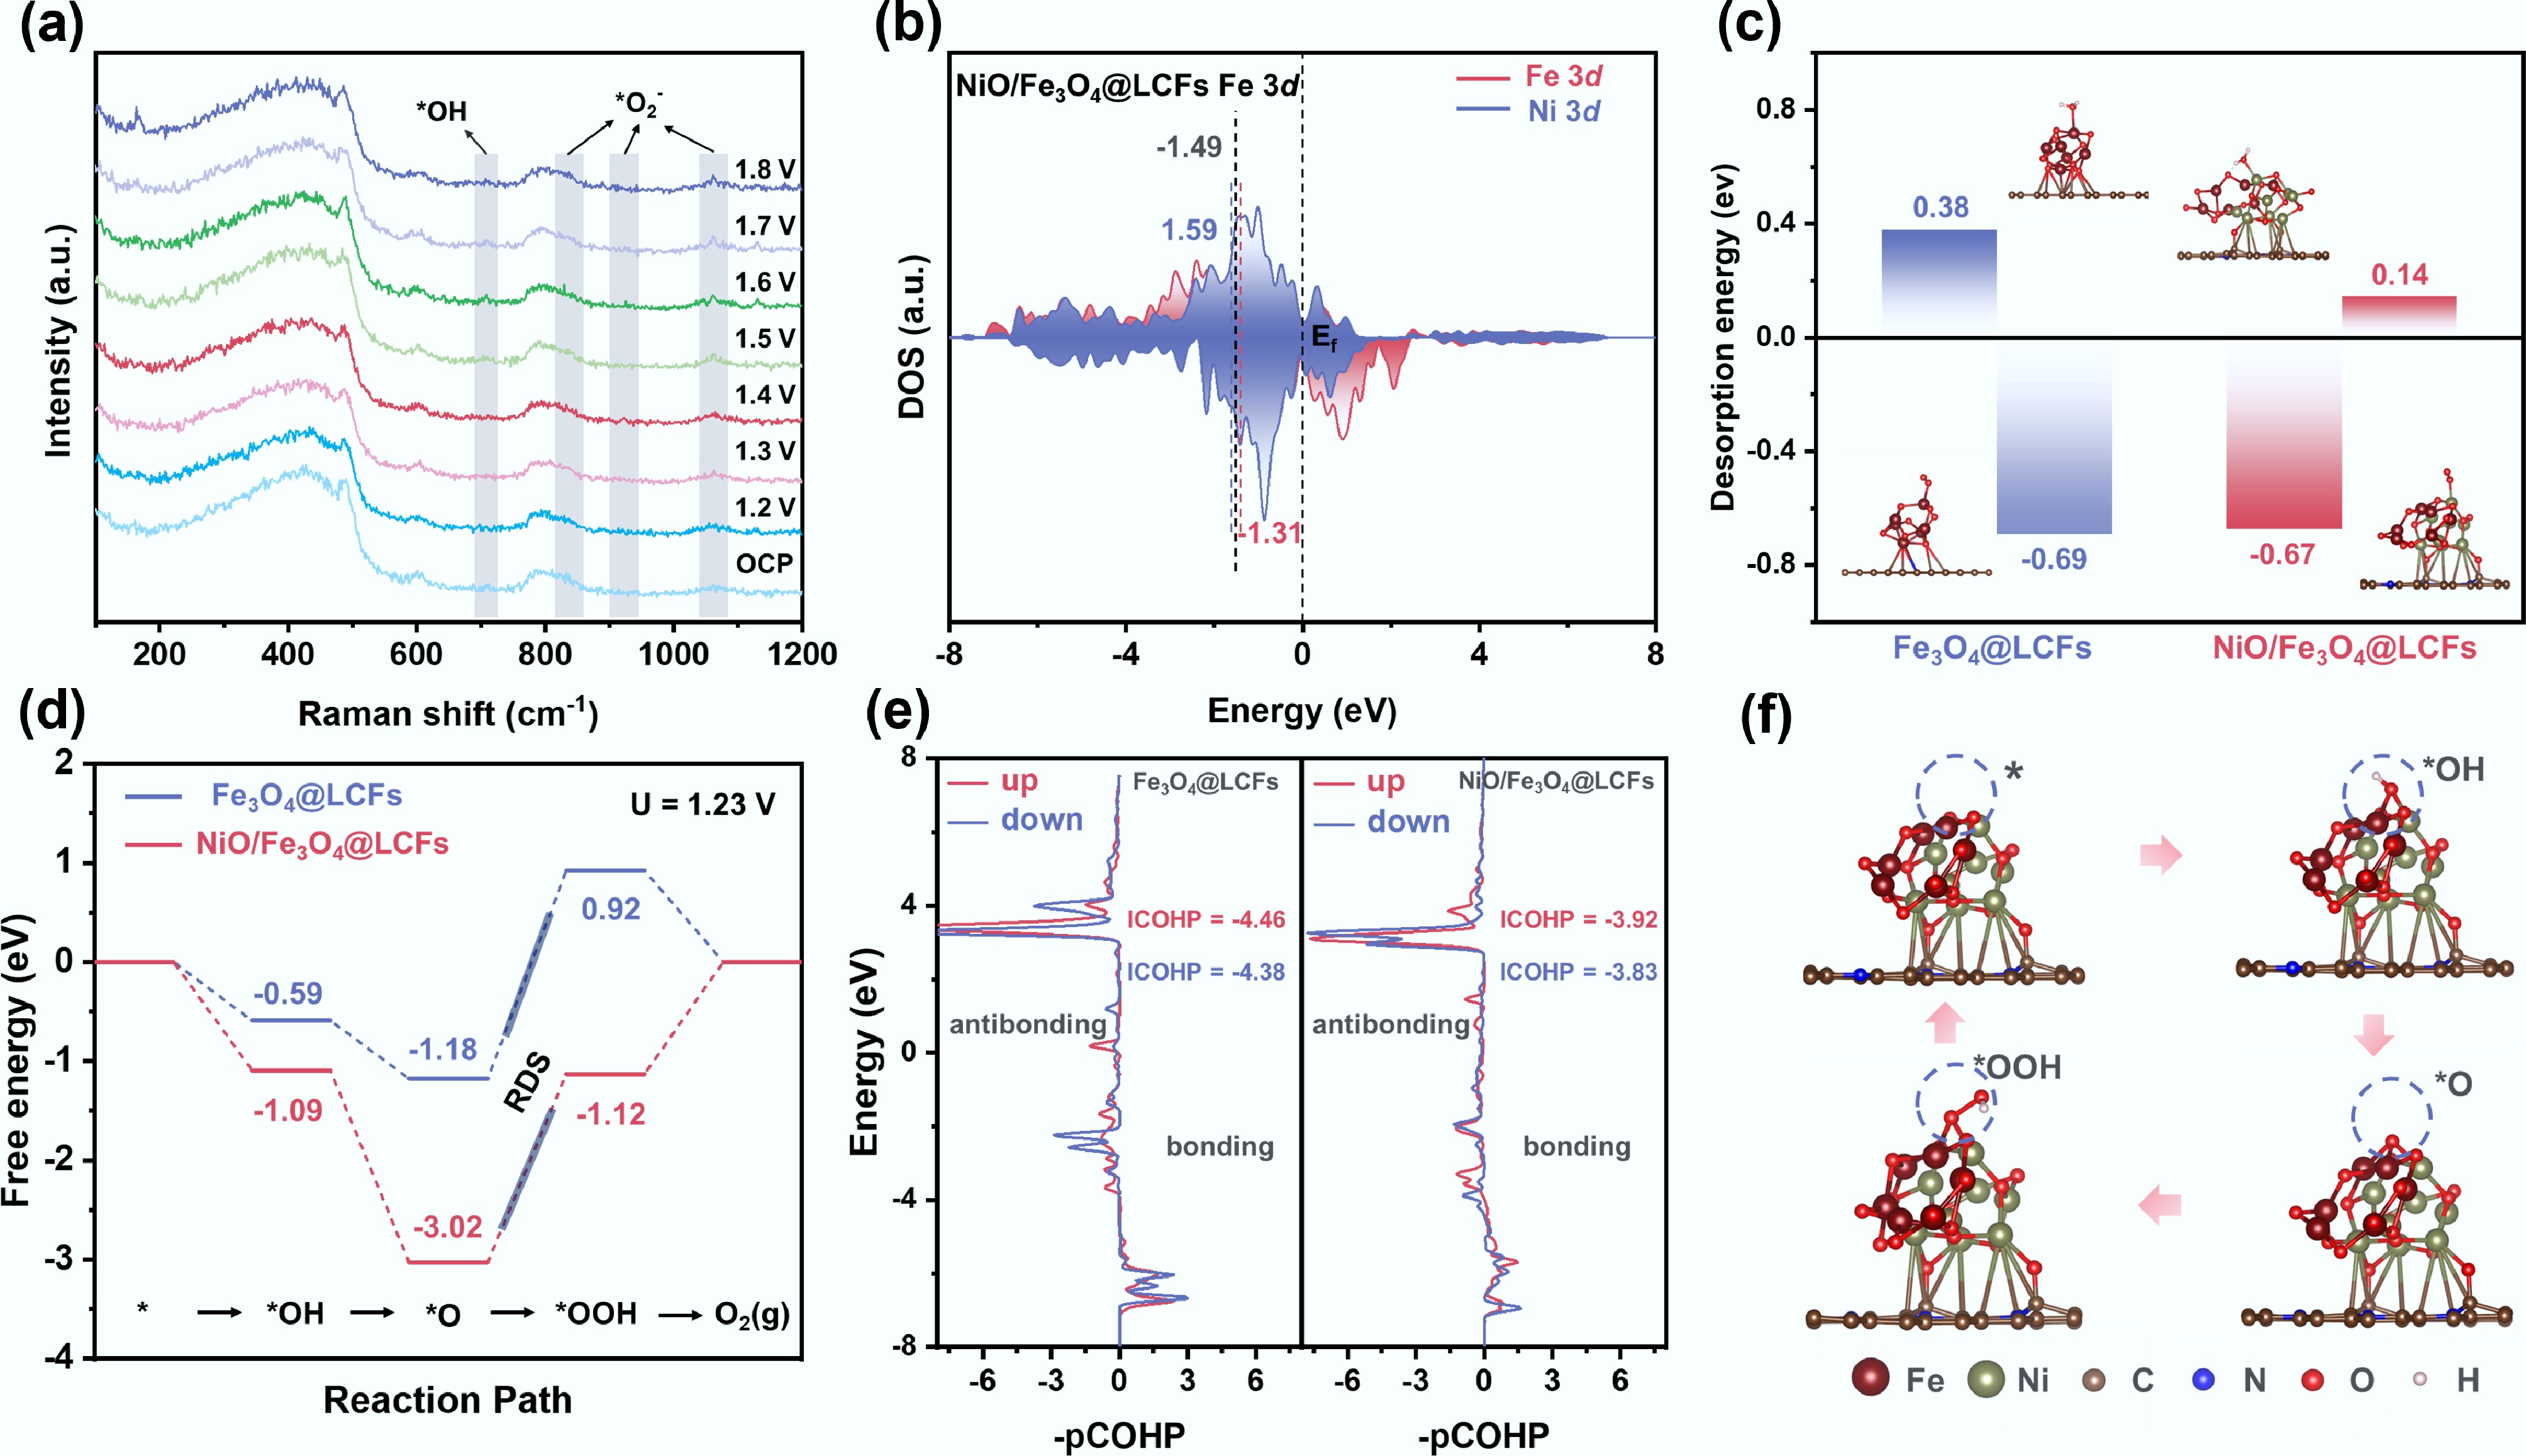
Figure 6.
Mechanistic insights into the enhanced OER activity via in situ spectroscopy and DFT calculations. (a) In situ Raman spectrum of the OER on NiO/Fe3O4@LCFs in 1.0 M KOH; (b) Density of states onto Fe and Ni 3d orbitals for NiO/Fe3O4@LCFs; (c) Adsorption energies of H2O and O2 on Fe3O4@LCFs and NiO/Fe3O4@LCFs; (d) Gibbs free energy change diagram of Fe3O4@LCFs, and NiO/Fe3O4@LCFs during the OER process; (e) The pCOHP plot of the O–OH bond after OOH adsorbs on Fe3O4@LCFs and NiO/Fe3O4@LCFs; (f) Interface configuration of NiO/Fe3O4@LCFs at four different stages during the OER.
Figures
(6)
Tables
(0)