-
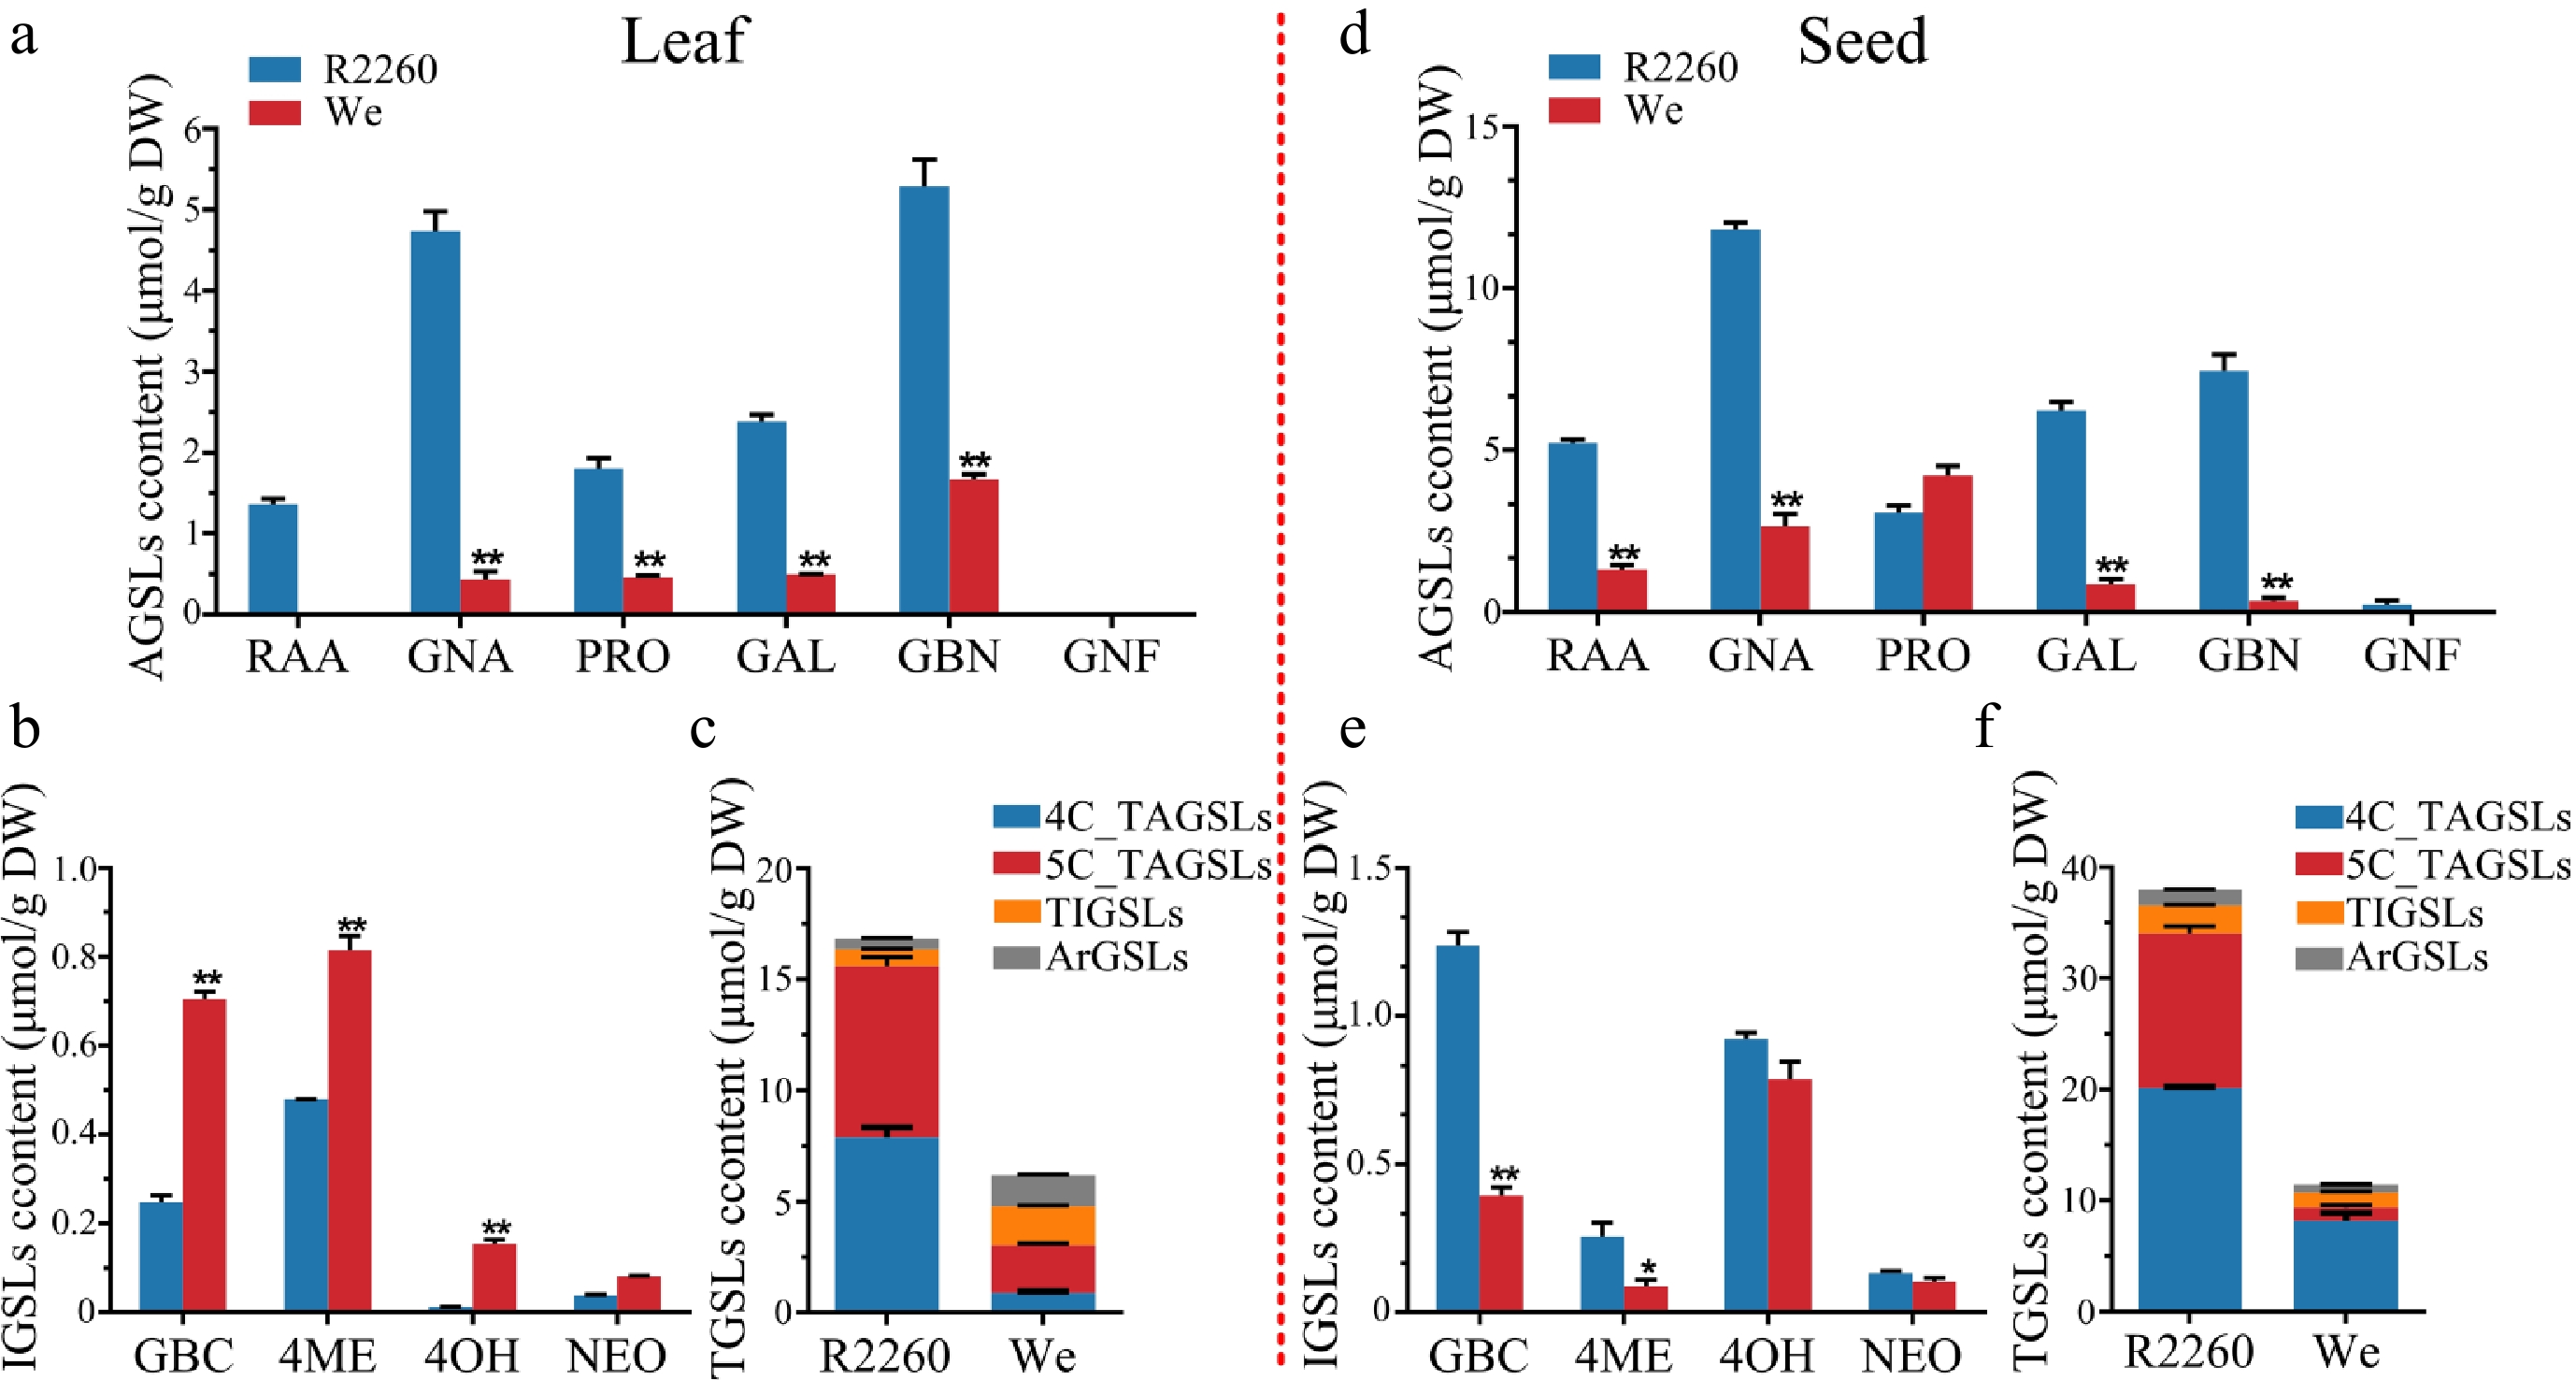
Figure 1.
Content of glucosinolates in R2260 and Westar (We). (a), (d) Aliphatic glucosinolates (AGSLs) content in leaves and seeds; (b), (e) Indolic glucosinolates (IGSLs) content in leaves and seeds; (c), (f) Total glucosinolates (TGSLs) content in leaves and seeds. Each value is the mean of three replicates. The vertical bar indicates the standard error. Asterisks indicate significant differences (** p < 0.01, * p < 0.05).
-
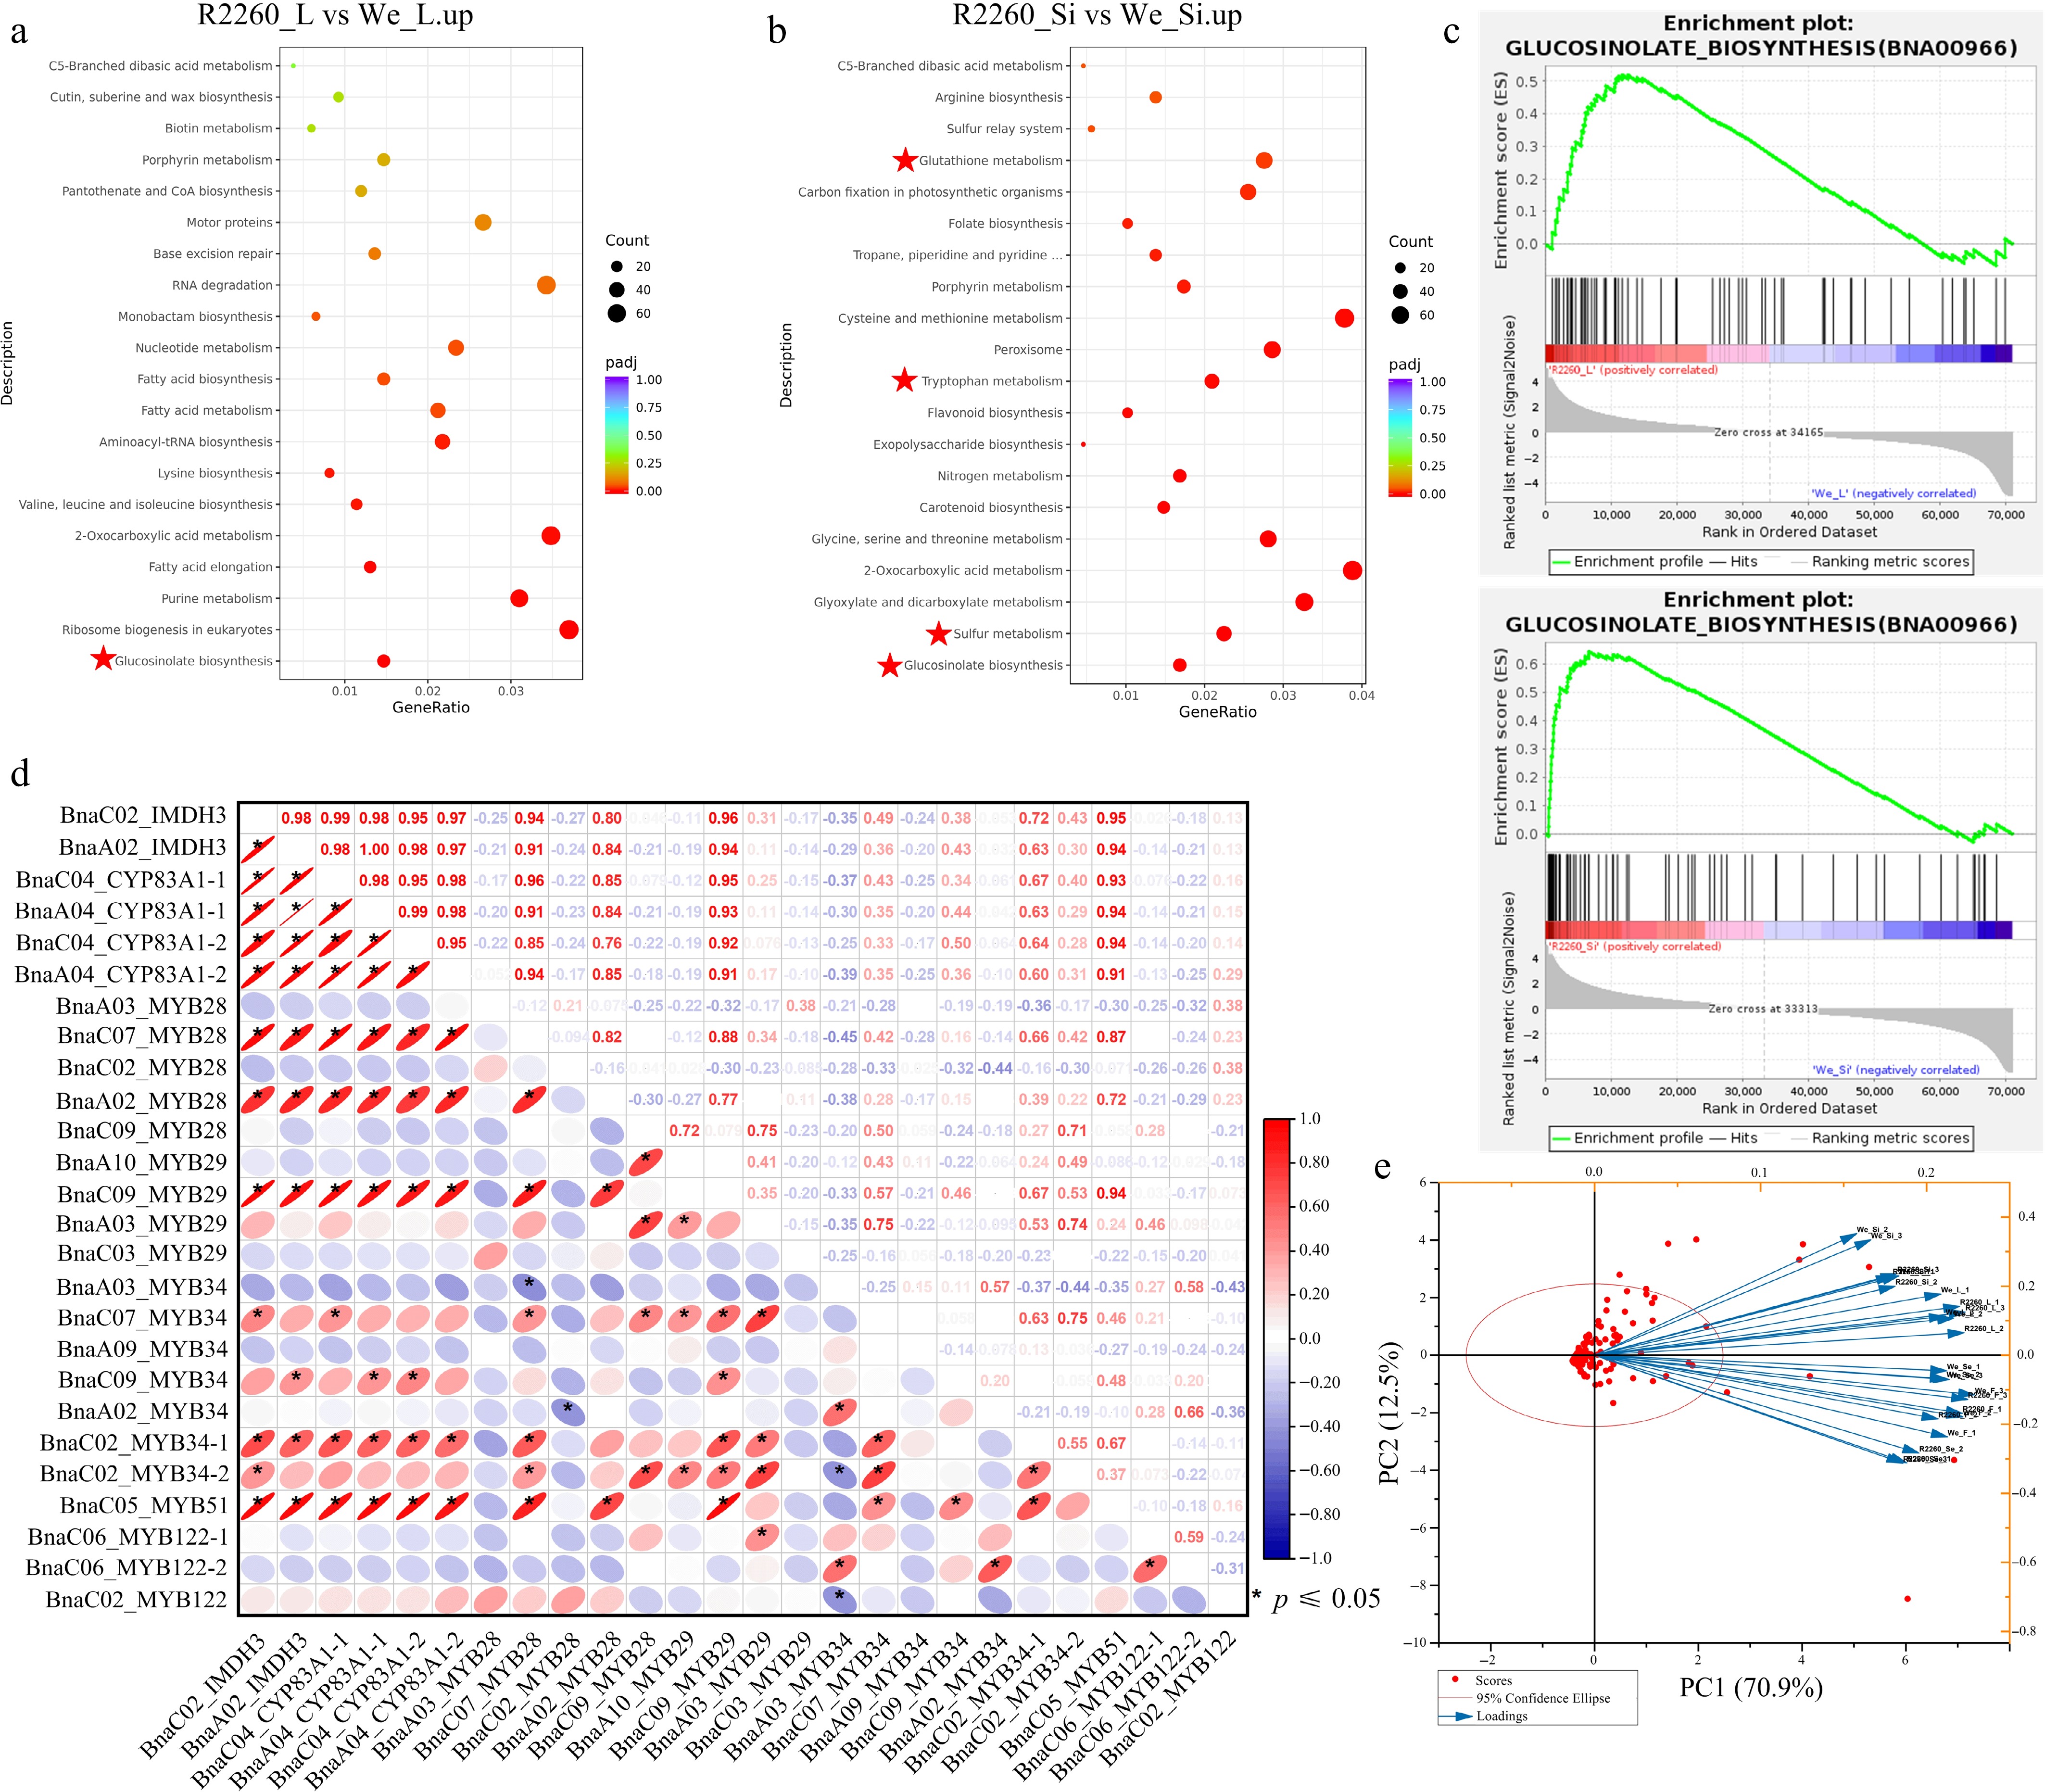
Figure 2.
Transcriptome analysis of R2260 and Westar (We), in leaves (L), flowers (F), silique pericarps (Si), and seeds (Se). (a), (b) KEGG pathway enrichment analysis of differentially expressed genes between R2260-We. (c) Gene Set Enrichment Analysis (GSEA) of differentially expressed genes between R2260-We. (d) Pearson correlation analysis of BnaIMDH3, BnaCYP83A1, and the MYBs which contribute to glucosinolates biosynthesis. (e) Biplot of the principal component analysis of the observed FPKM values of glucosinolates biosynthesis pathway genes in R2260 and We, with leaves (L), flowers (F), silique pericarps (Si), and seeds (Se).
-
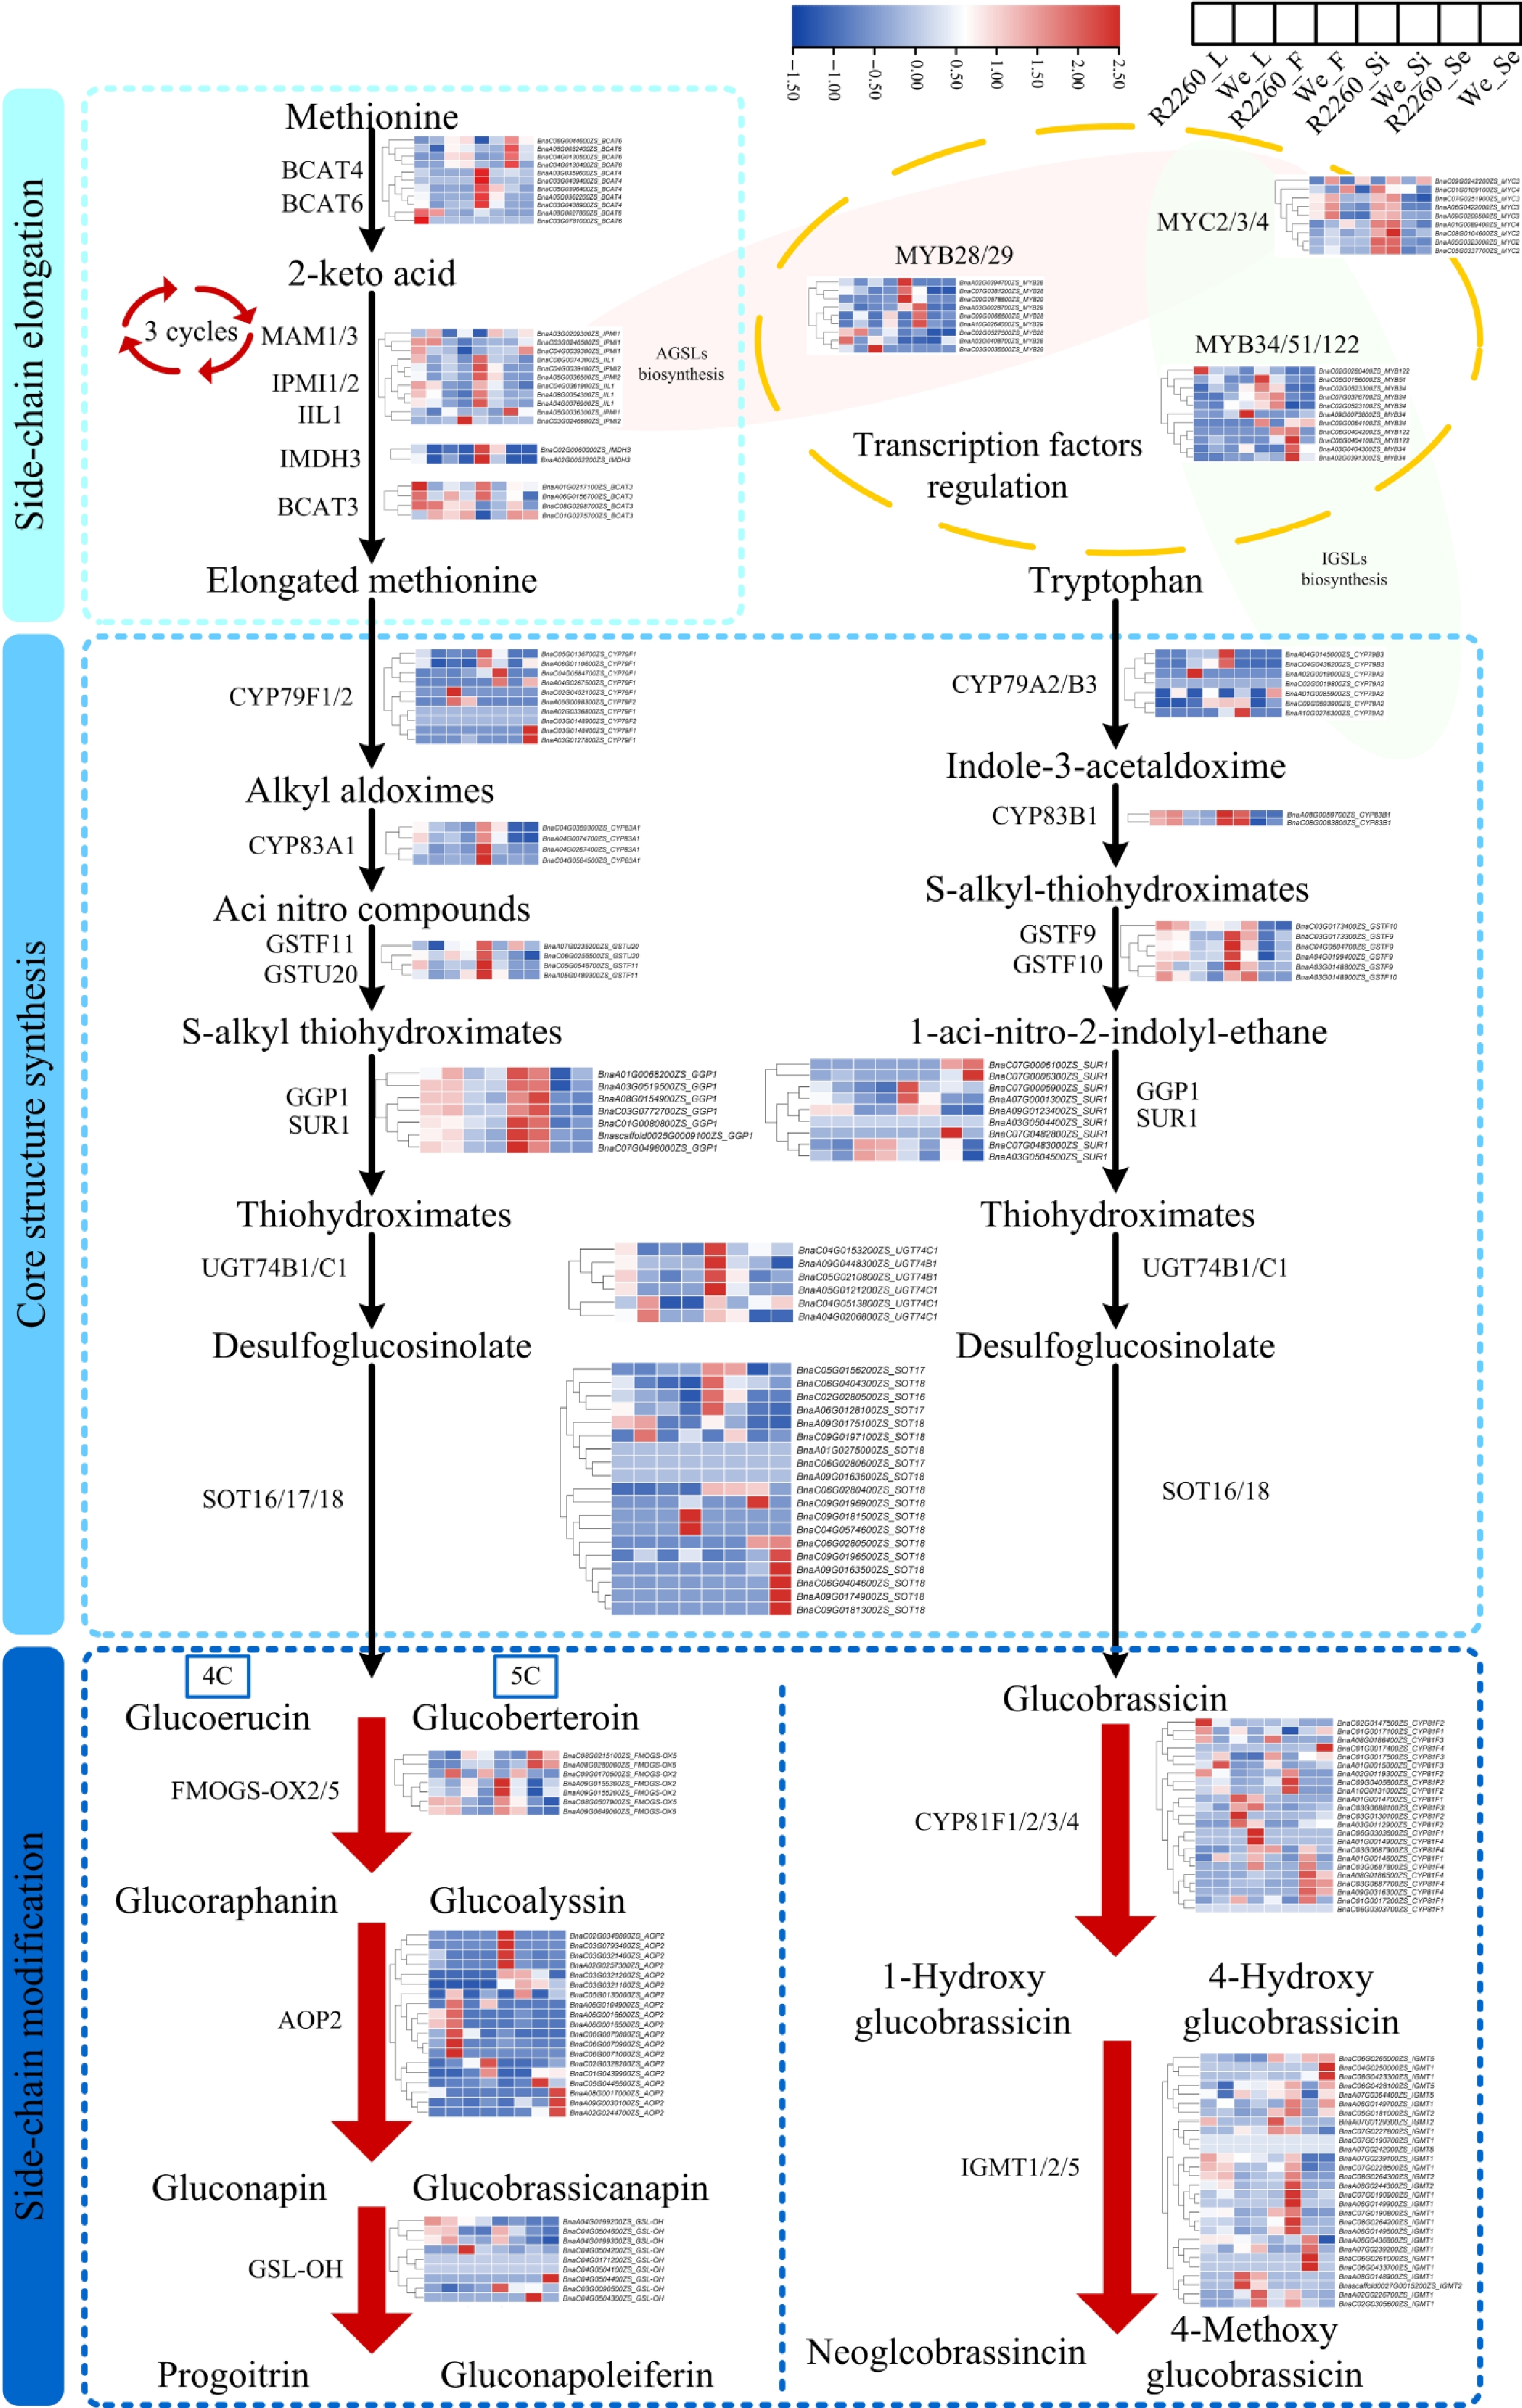
Figure 3.
Expression profile of genes related to glucosinolates biosynthesis in R2260 and Westar (We) of leaves (L), flowers (F), silique pericarps (Si), and seeds (Se), the samples arranged from left to right as R2260_L, We_L, R2260_F, We_F, R2260_Si, We_Si, R2260_Se, We_Se. The FPKM values were used to draw heatmaps, and the red-to-blue gradient in the heatmaps indicates FPKM values from high to low, respectively. Each value is the mean of three replicates.
-
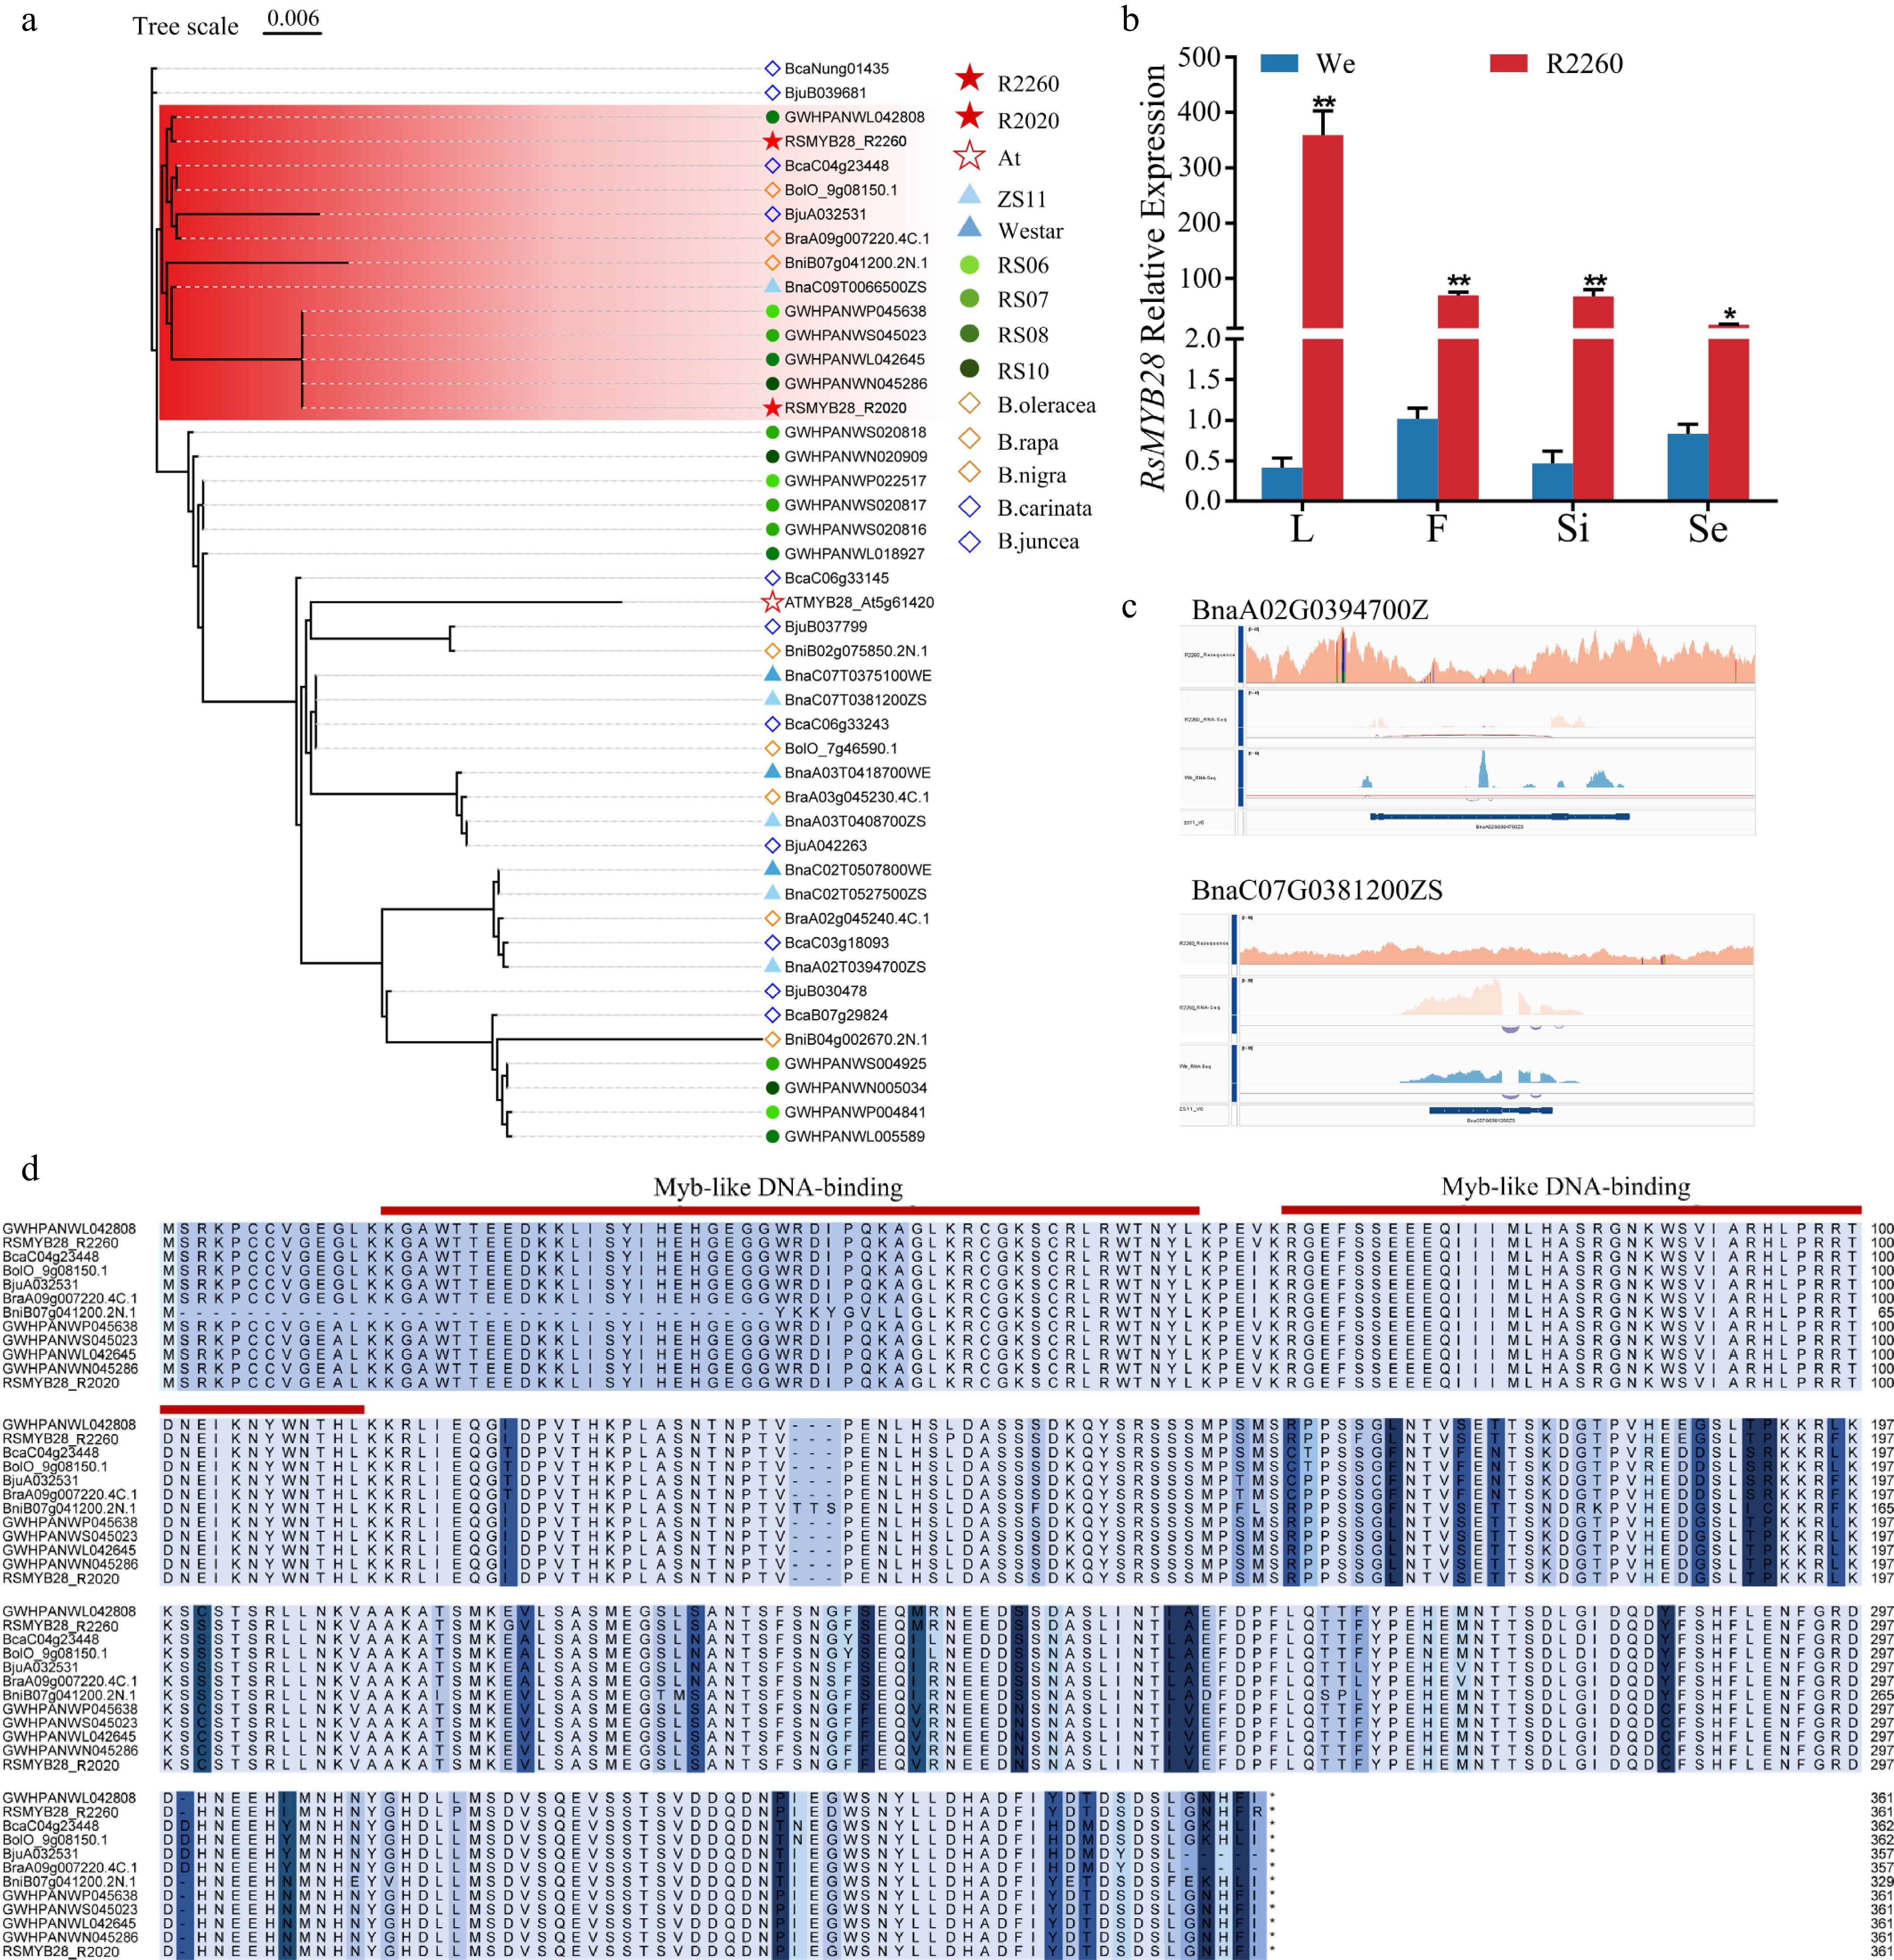
Figure 4.
RsMYB28 identification and the sequences analysis. (a) Phylogenetic analysis of MYB28s from R2260, R2020, Arabidopsis thaliana (At), Brassica napus (ZS11 and Westar), Raphanus sativus (RS06, RS07, RS08, and RS10), B. rapa (chiifu V4), B. oleracea (OX-heart), B. nigra (Ni100_LR-v2.0), B. juncea (Tumida-T84-66-v1.5), and B. carinata (Zd-1-v1.0). (b) Relative expression of RsMYB28 in R2260 and Westar (We) of leaves (L), flowers (F), silique pericarps (Si), and seeds (Se). Each value is the mean of three replicates. The vertical bar indicates the standard error. Asterisks indicate significant differences (** p < 0.01, * p < 0.05). (c) The gene sequences alignment of BnaMYB28s in R2260, We, and ZS11 by IGV. (d) Multiple amino acid sequence alignment of RsMYB28s in Raphanus sativus (RS06, RS07, RS08, and RS10), B. carinata (Zd-1-v1.0), B. oleracea (OX-heart), B. juncea (Tumida-T84-66-v1.5), B. rapa (chiifu V4), and B. nigra (Ni100_LR-v2.0).
-
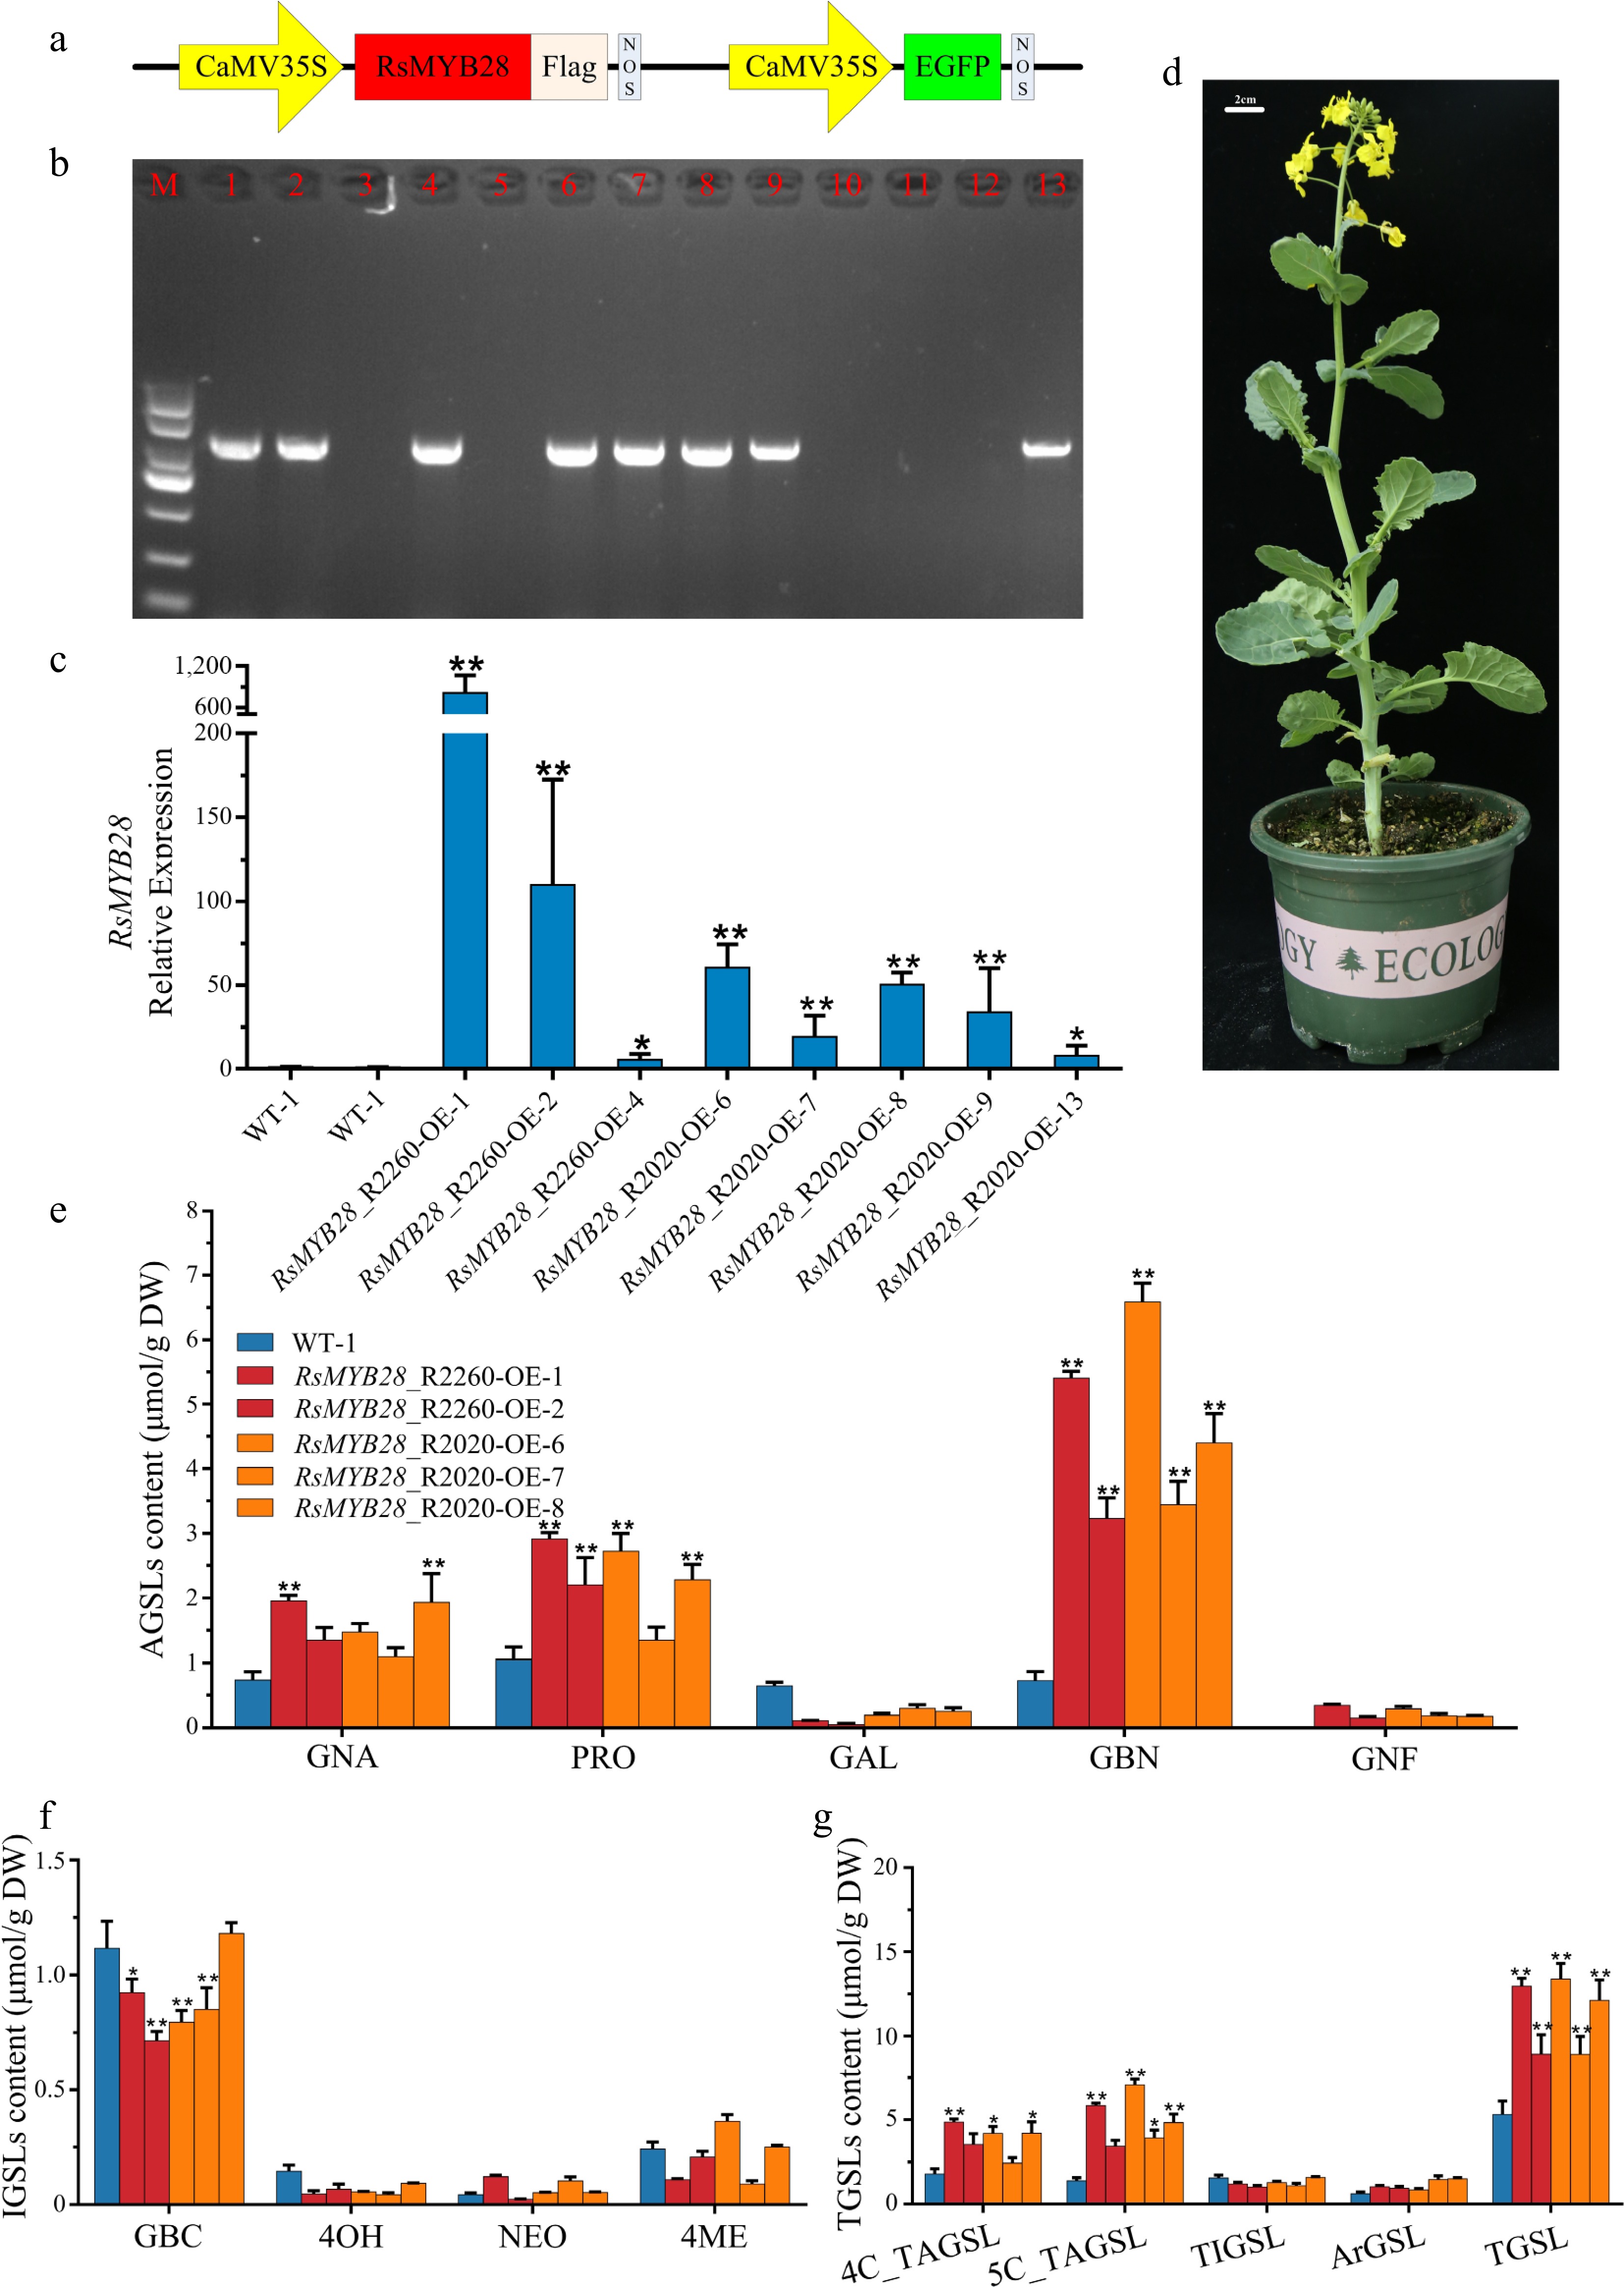
Figure 5.
Biological function identification of RsMYB28. (a) Schematic diagram showing the constructs used for genetic transformation. (b) PCR identification of RsMYB28-overexpressing (RsMYB28-OE) transgenic lines. (c) Relative expression of RsMYB28 in overexpression lines and WT. (d) RsMYB28-OE transgenic plant. (e) The aliphatic glucosinolates (AGSLs) content in RsMYB28-OE lines and wild type (WT). (f) The indolic glucosinolates (IGSLs) content in RsMYB28-OE lines and WT. (g) The total glucosinolates (TGSLs) content in RsMYB28-OE lines and WT. Each value is the mean of three replicates. The vertical bar indicates the standard error. Asterisks indicate significant differences (** p < 0.01, * p < 0.05).
-
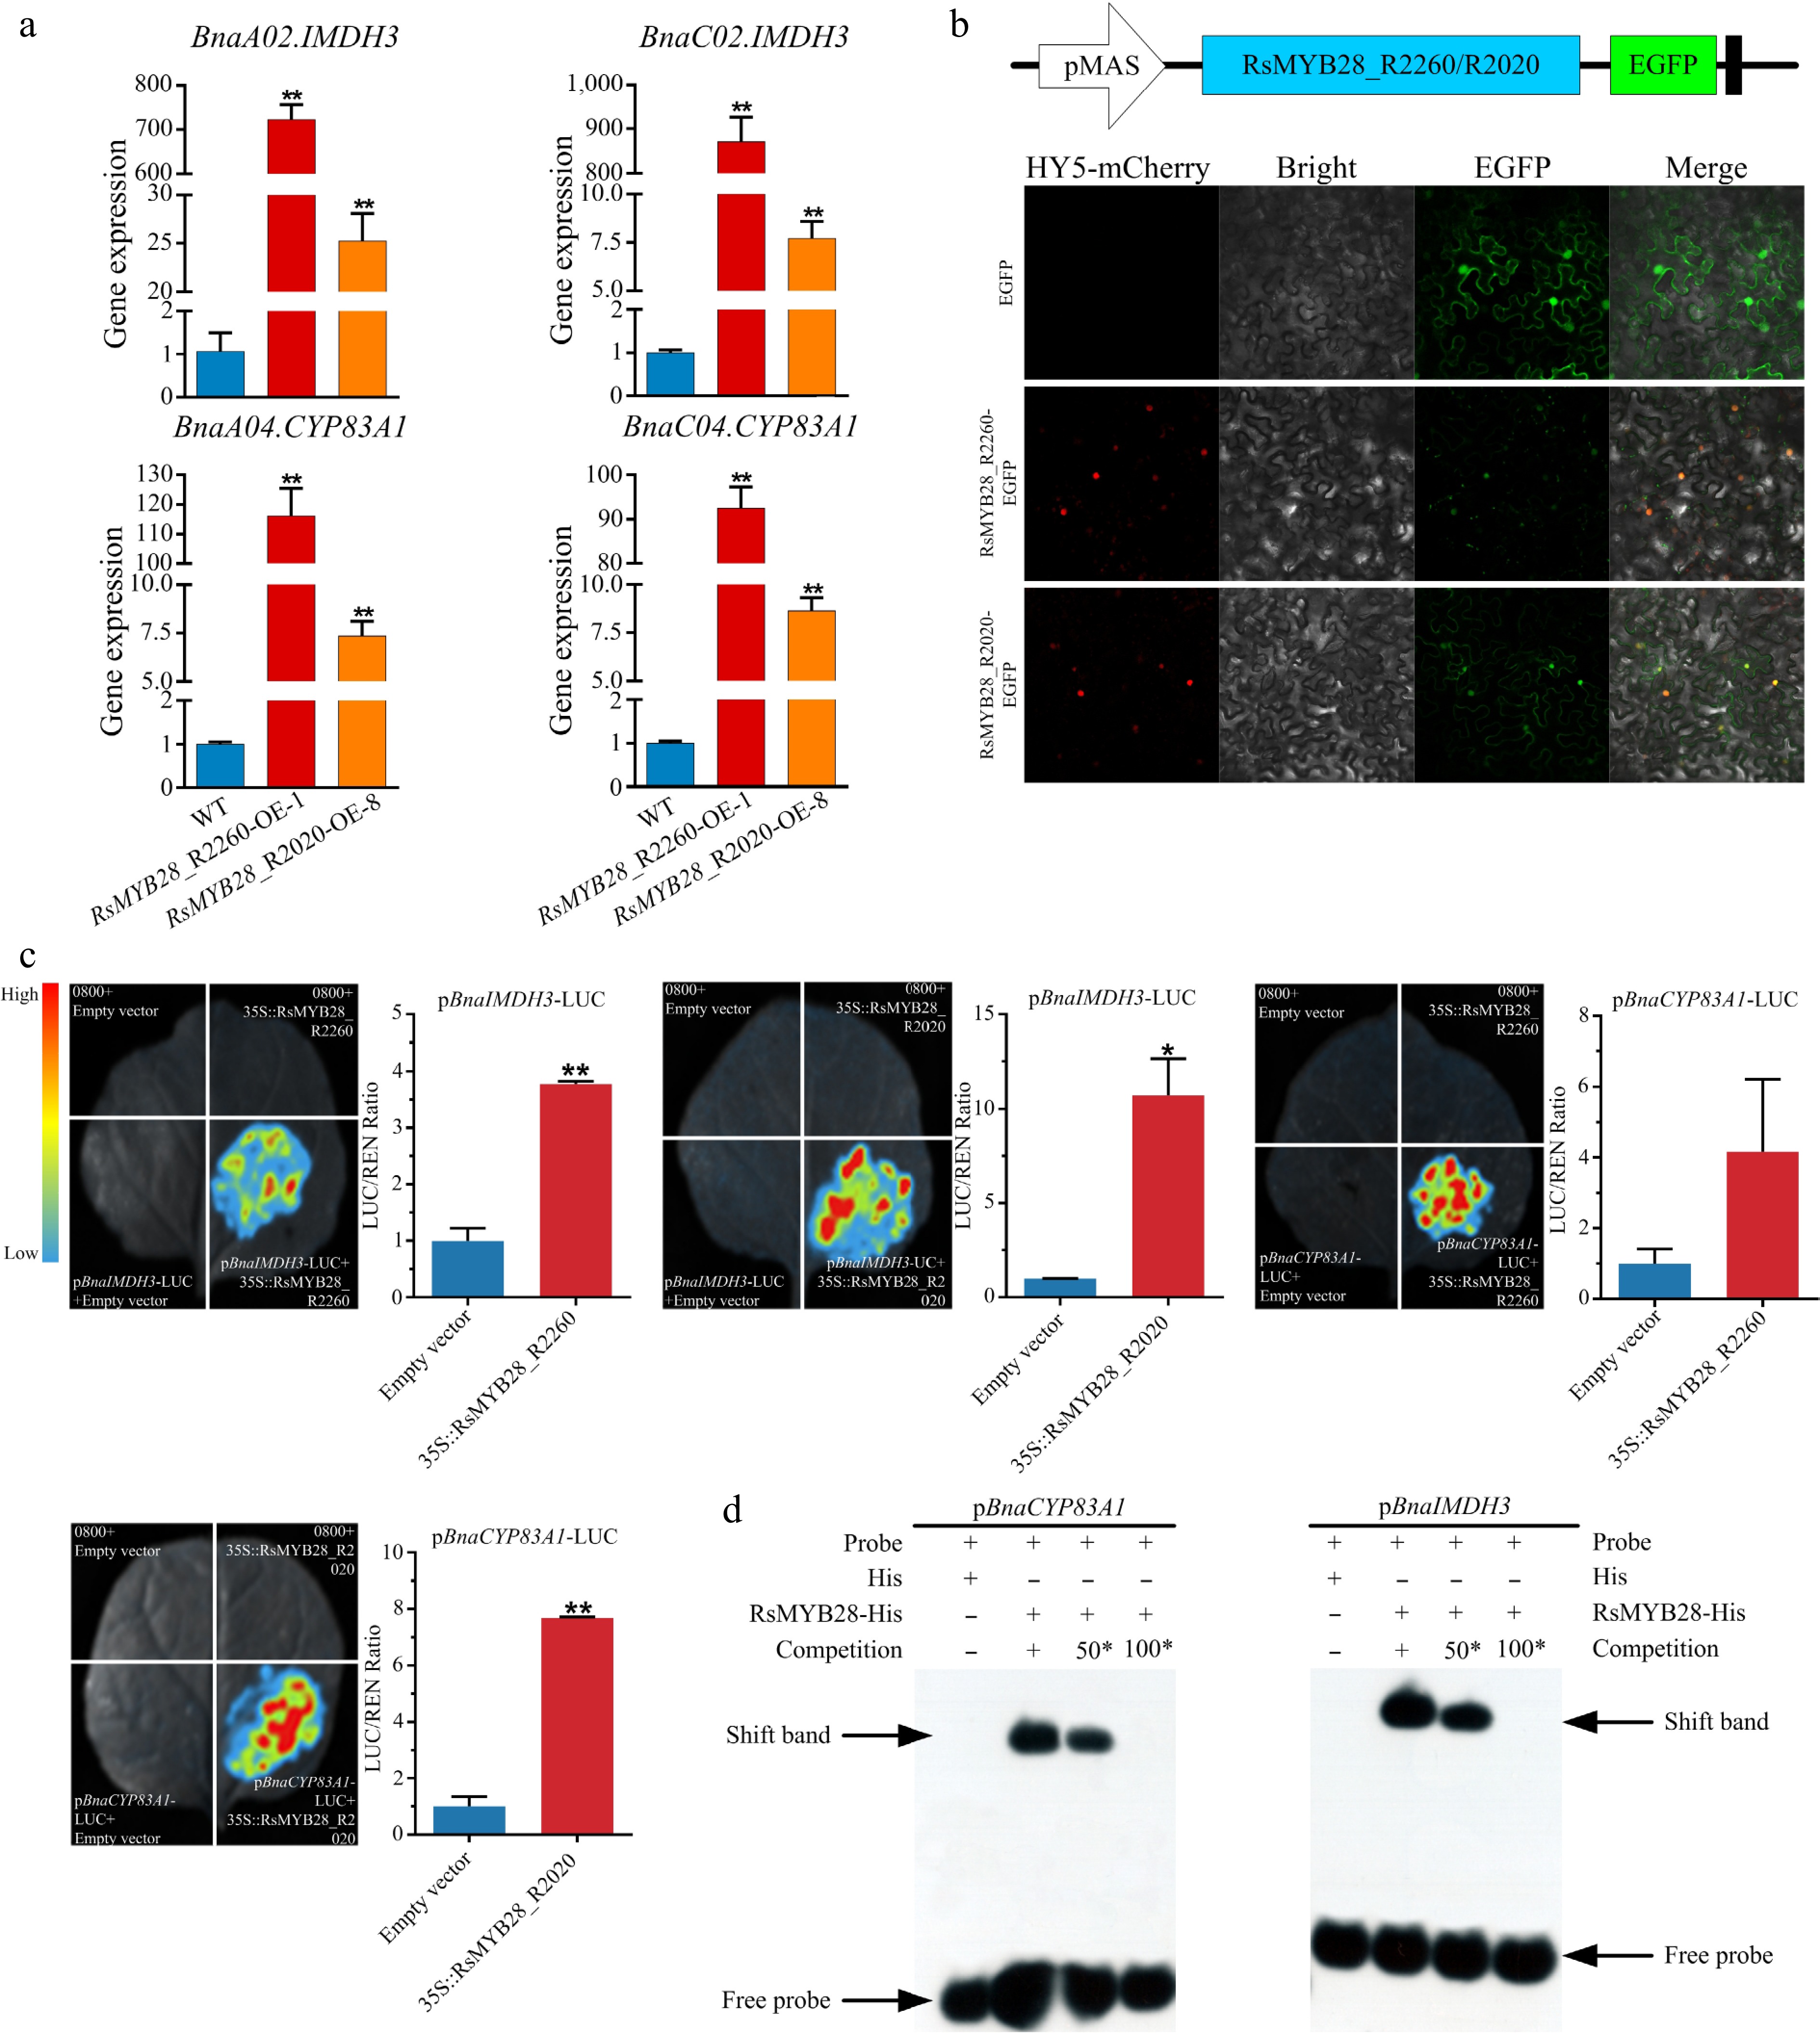
Figure 6.
RsMYB28 directly interact with the promoters of BnaIMDH3 and BnaCYP83A1. (a) Relative expression of BnaIMDH3 and BnaCYP83A1 in RsMYB28-overexpressing (RsMYB28-OE) lines and wild type (WT). (b) Subcellular localization of RsMYB28 transcription factors. (c) Dual-luciferase reporter gene assay of RsMYB28 and promoters of BnaIMDH3 and BnaCYP83A1. (d) Electrophoretic mobility shift assay of RsMYB28, and promoters of BnaIMDH3 and BnaCYP83A1. Each value is the mean of three replicates. The vertical bar indicates the standard error. Asterisks indicate significant differences (** p < 0.01, * p < 0.05).
Figures
(6)
Tables
(0)