-
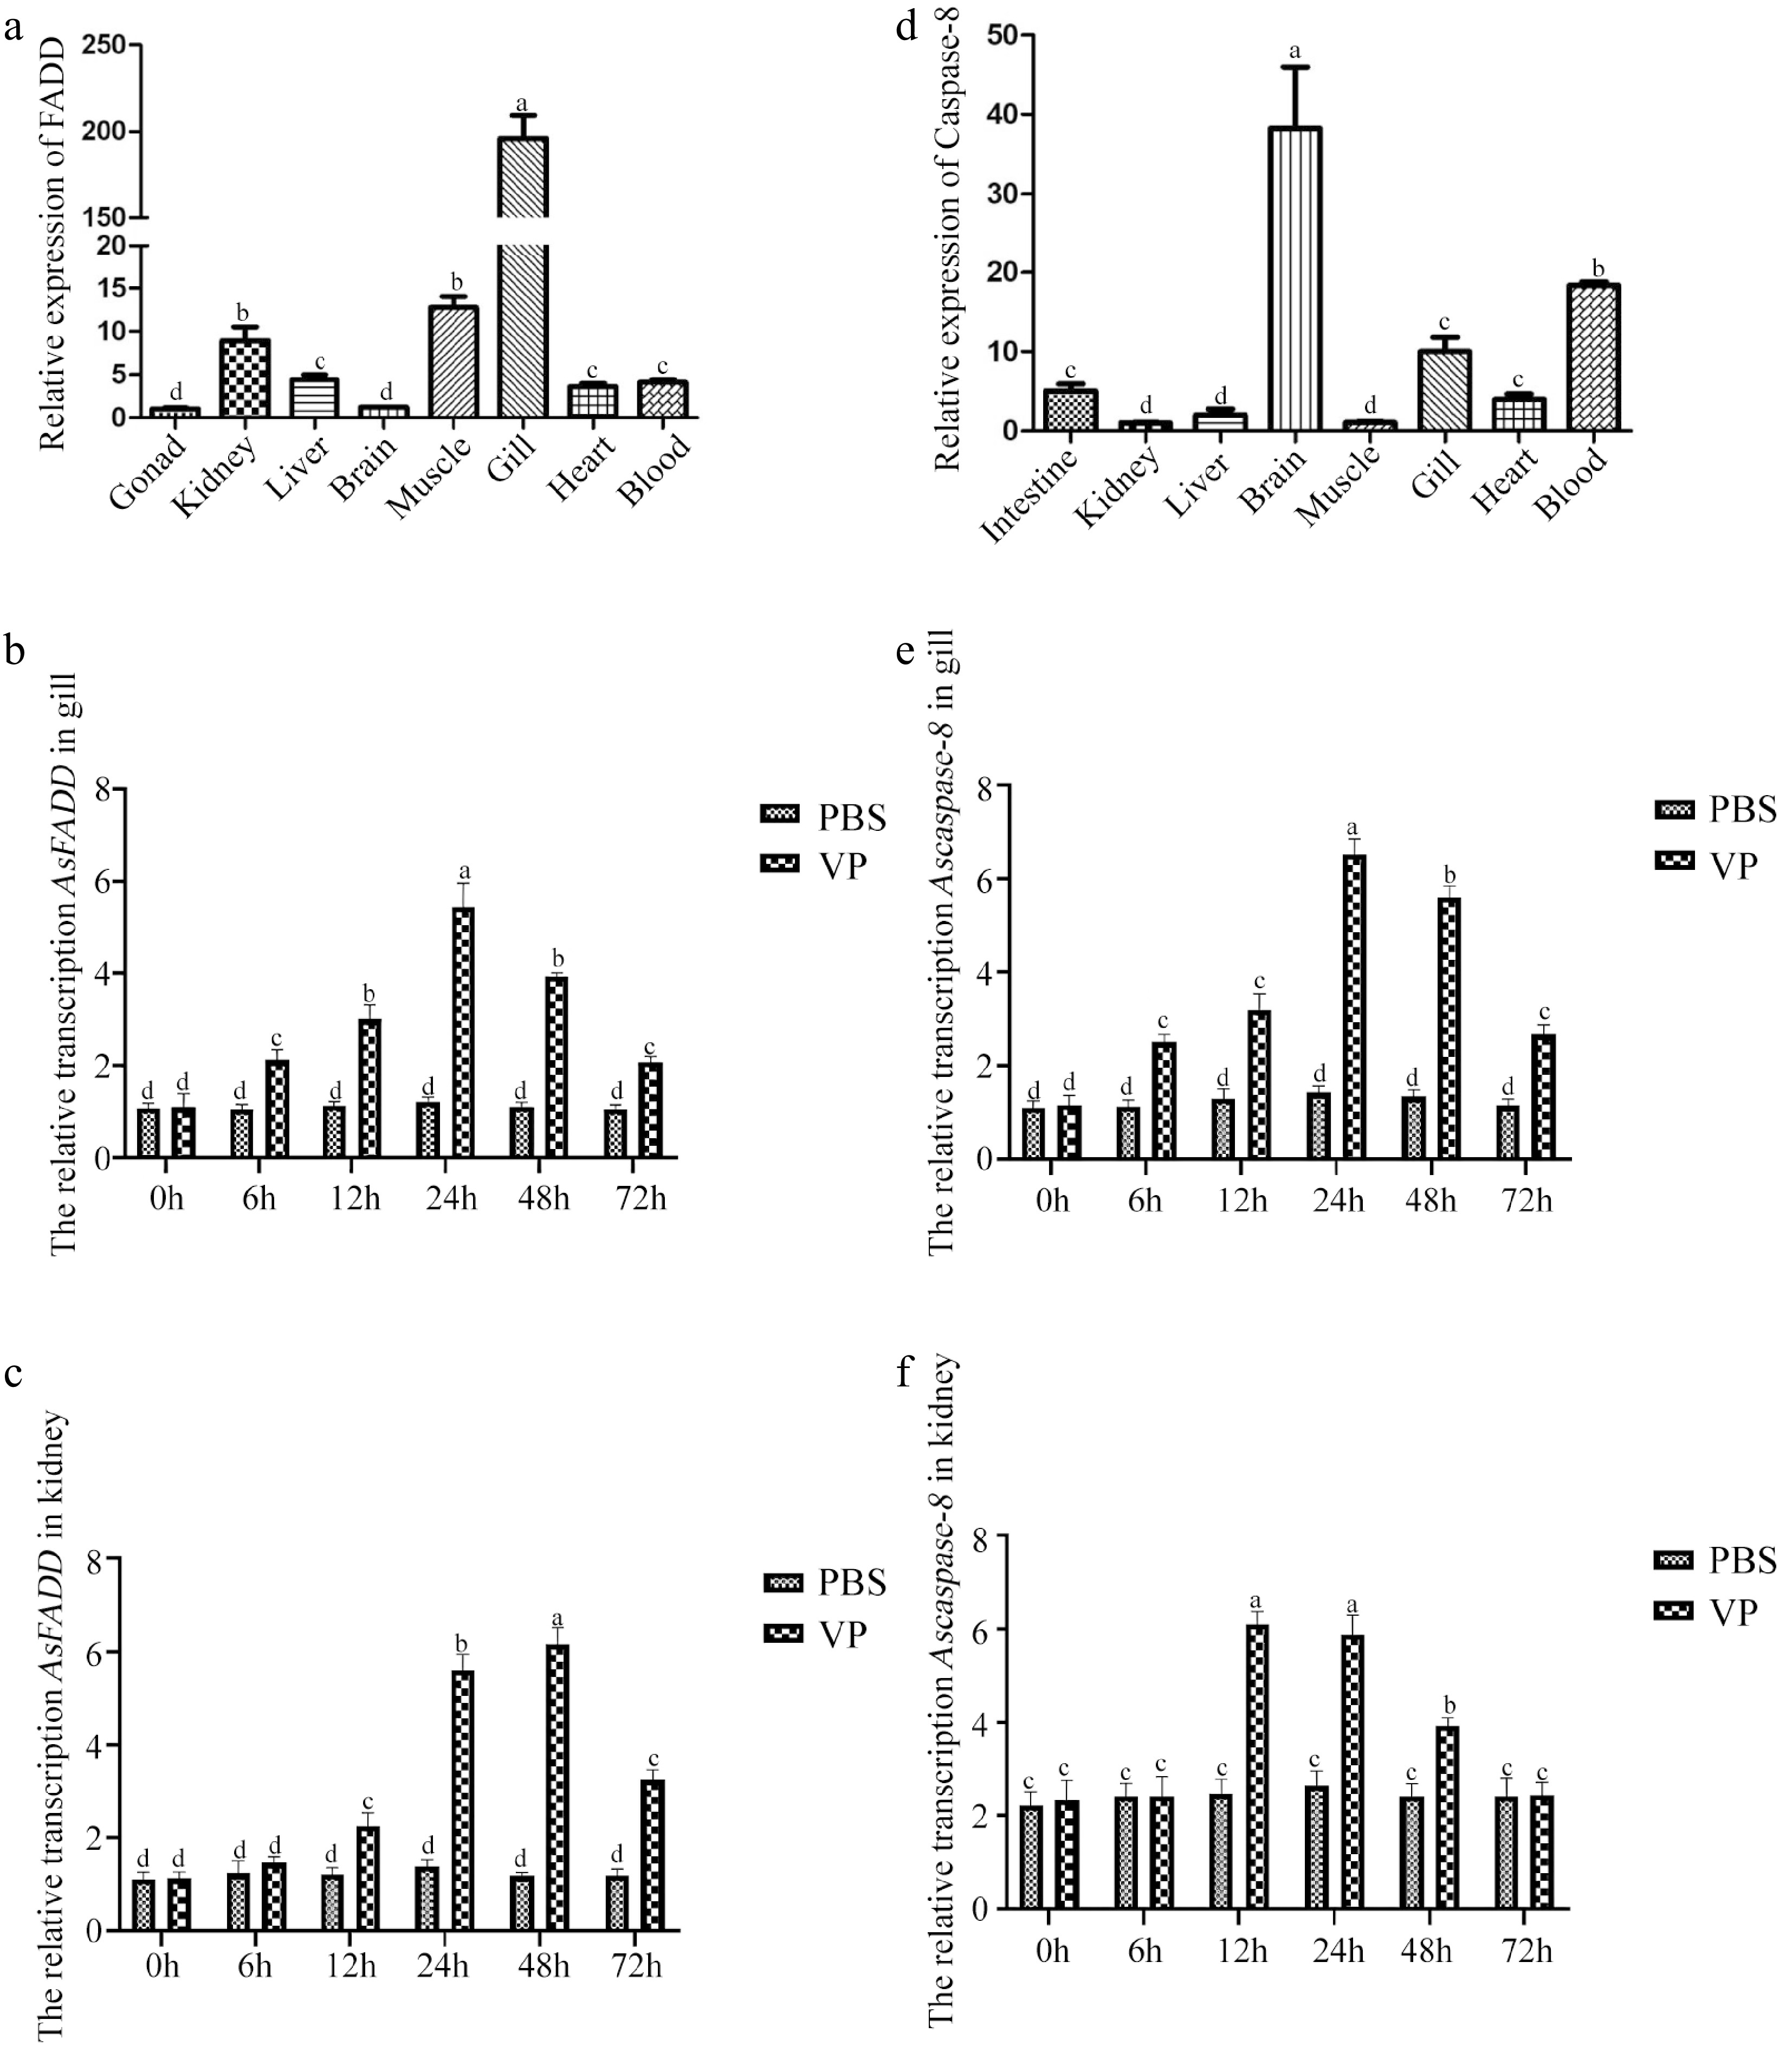
Figure 1.
Distribution of genes in various tissues of A schlegelii and the transcription characteristics of genes in the gills and kidneys of A. schlegelii after V. parahaemolyticus infection. (a) Distribution of AsFADD in various tissues. The transcription characteristics of AsFADD in the gills (b) and kidneys (c) after V. parahaemolyticus infection. (d) Distribution of Ascaspase-8 in various tissues. The transcription characteristics of Ascaspase-8 in the gills (e) and kidneys (f) after V. parahaemolyticus infection. Error bars represent standard deviations (SD). Different letters on the bars represent statistically significant differences at p < 0.05.
-
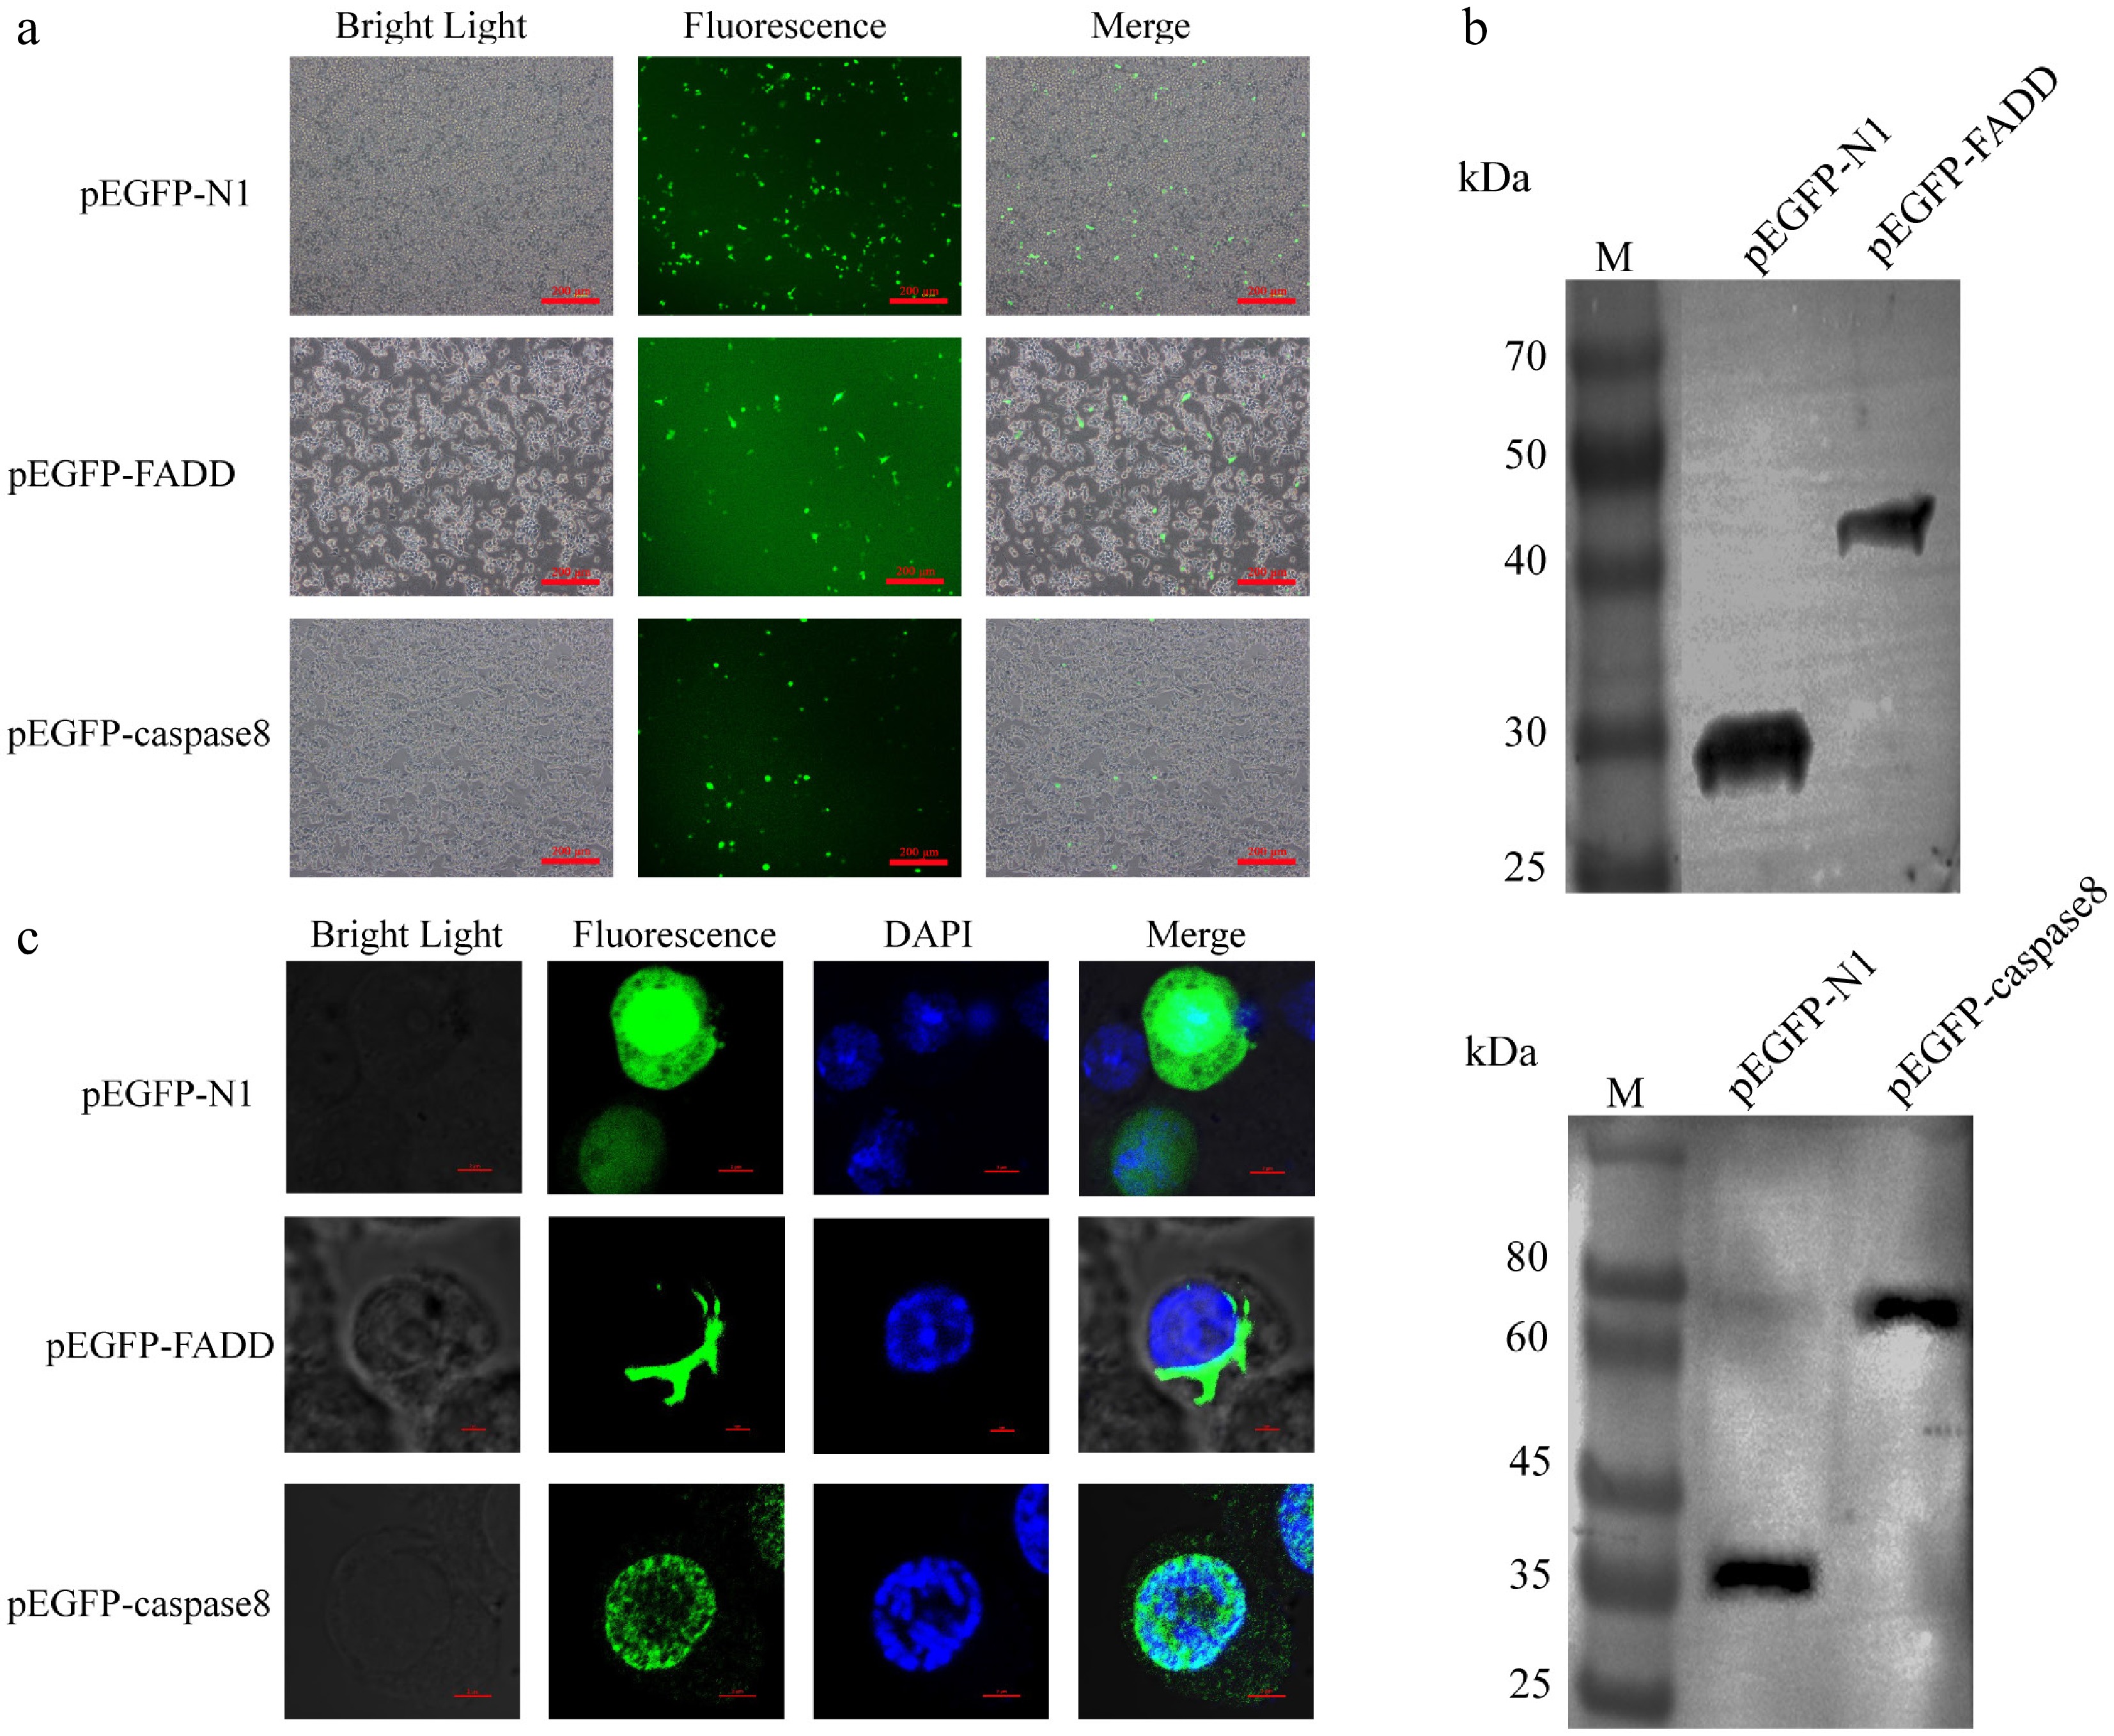
Figure 2.
Overexpression of AsFADD and Ascaspase-8 in RAW264.7 cells. (a) Fluorescence images of expression of the recombinant plasmids pEGFP–FADD and pEGFP–caspase-8, Scale bar, 200 μm. (b) Western blot analysis of pEGFP–FADD and pEGFP–caspase-8. (c) Subcellular localization of pEGFP–FADD and pEGFP–caspase-8 in RAW264.7 cells. Scale bar, 4 μm.
-
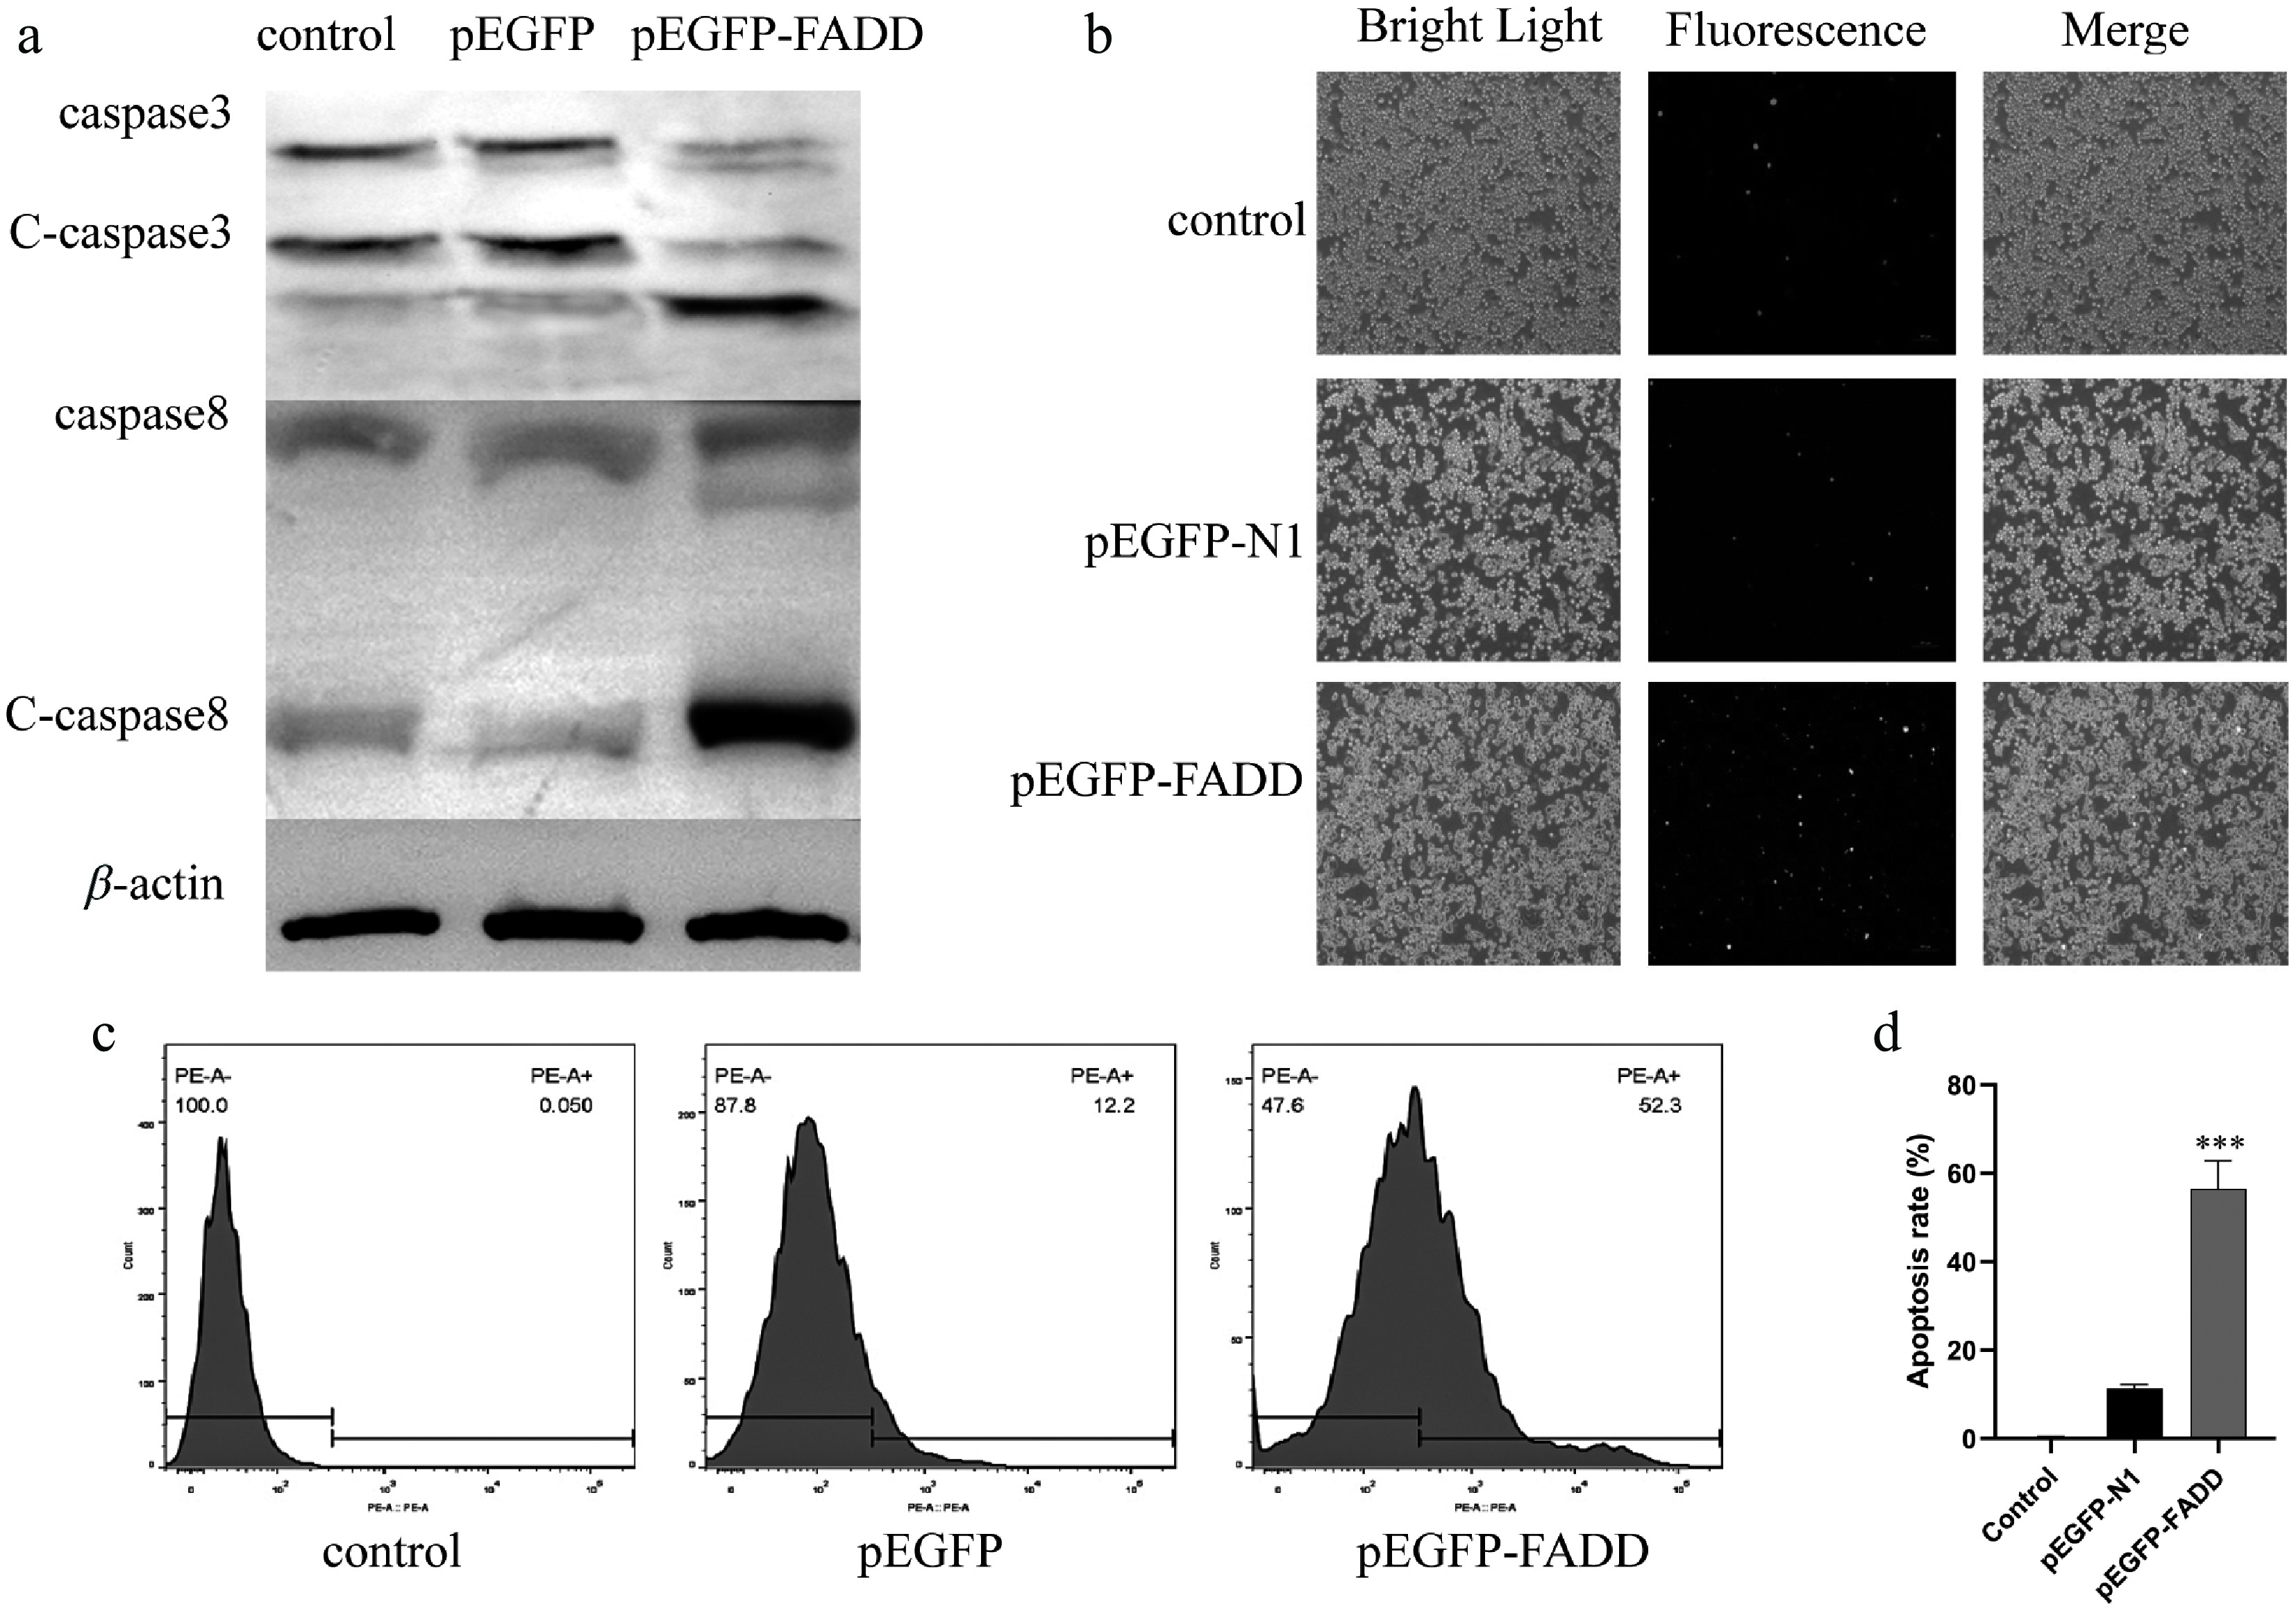
Figure 3.
Effect of overexpression of pEGFP–FADD on apoptosis in RAW264.7 cells. (a) The protein expression levels of c-caspase-3 and c-caspase-8 were detected by Western blot analysis. (b) Apoptosis fluorescence was detected by an inverted fluorescence microscope. Scale bar, 4 μm. (c, d) The percentage of PE-positive cells after pEGFP–FADD overexpression was analyzed by flow cytometry.
-
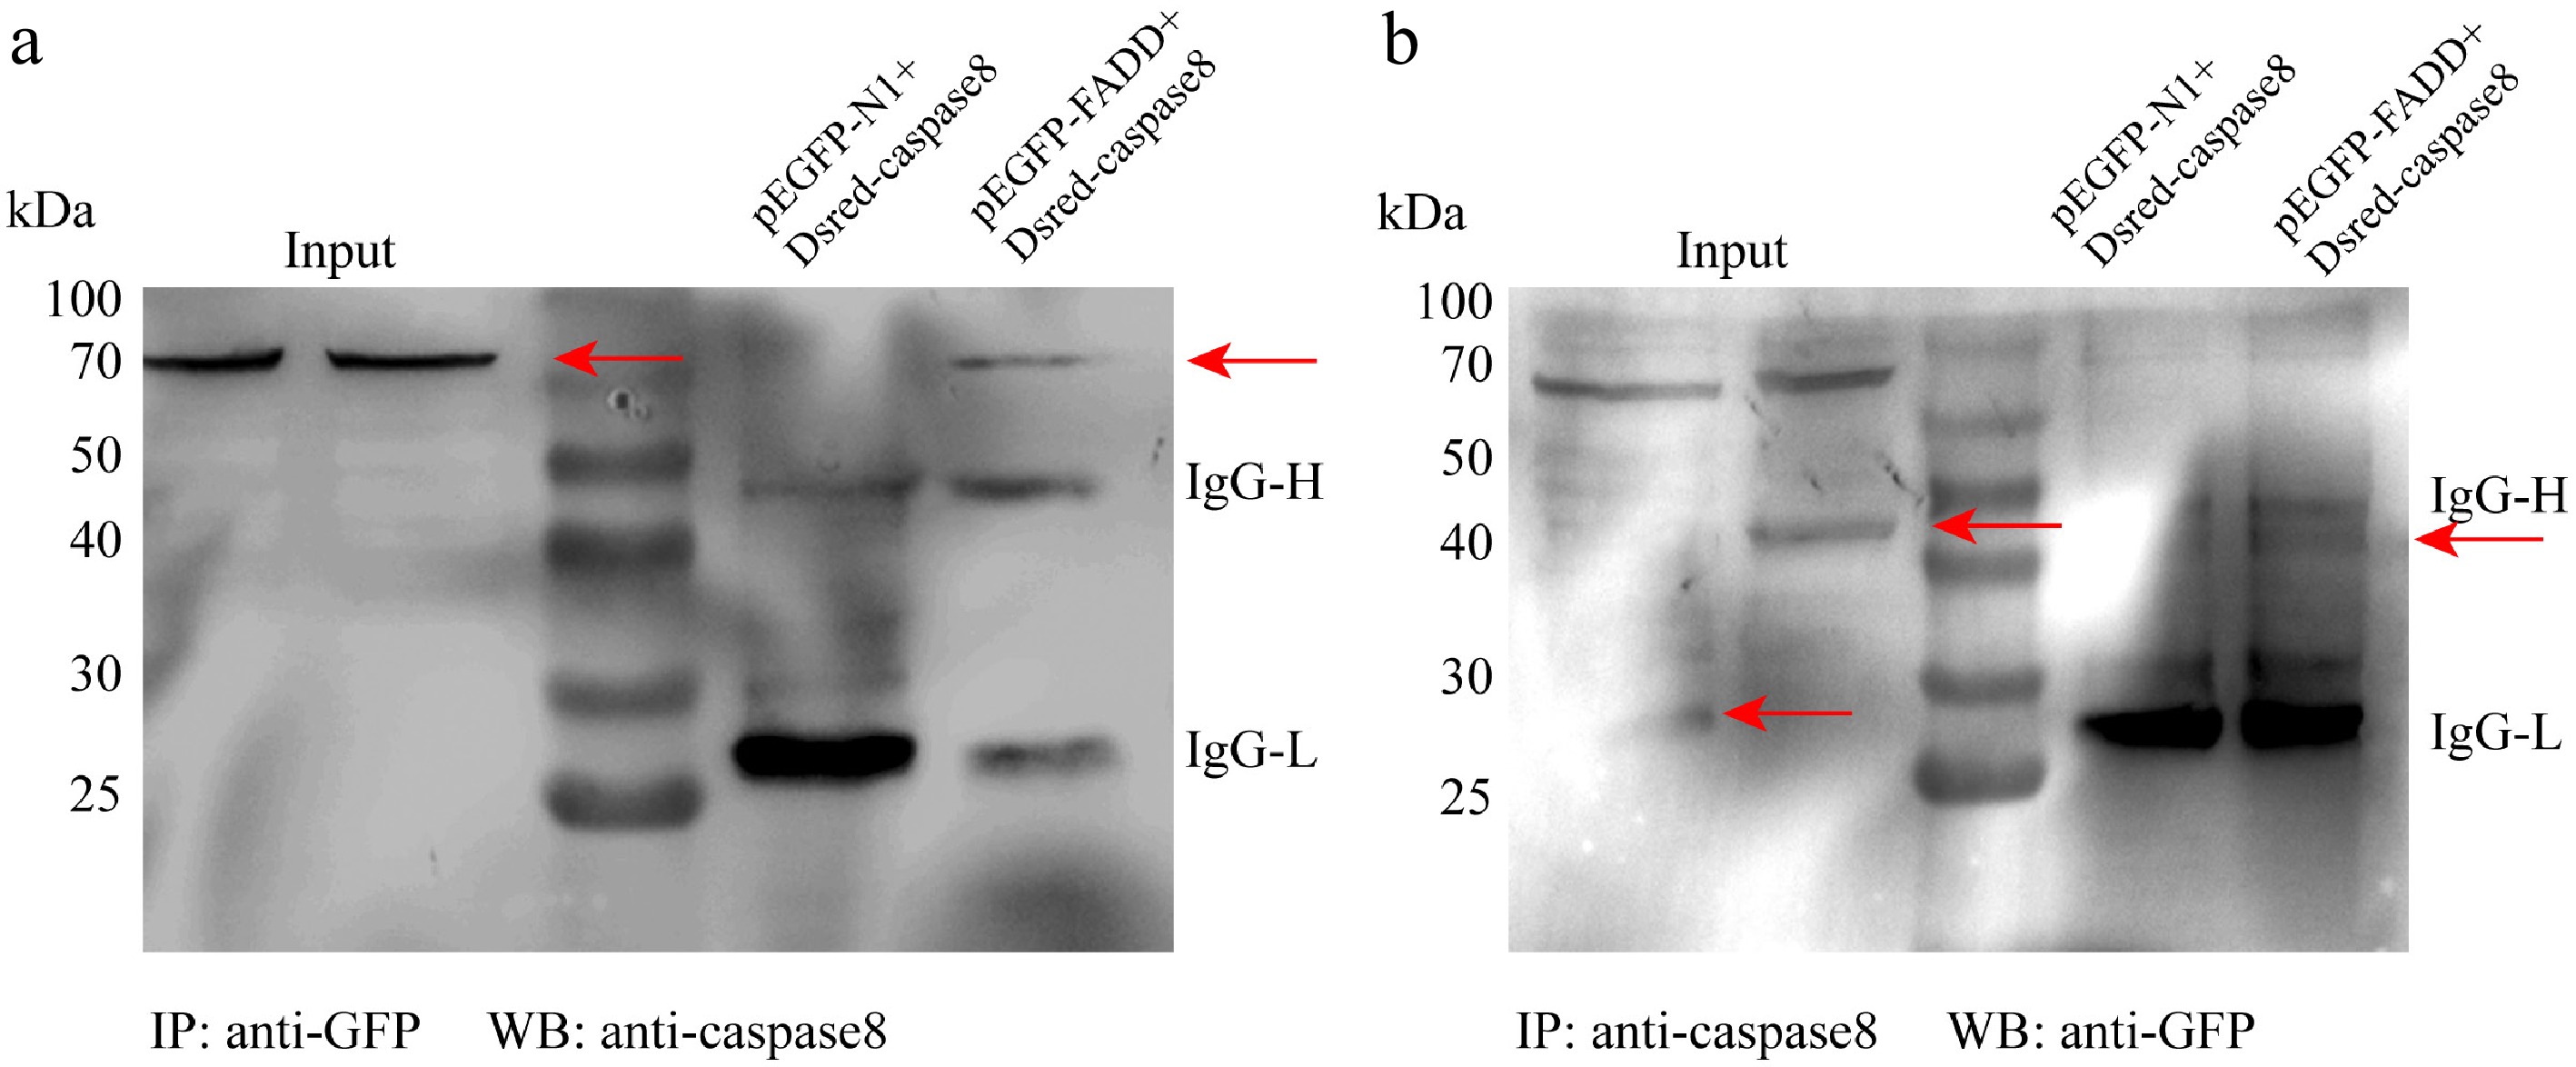
Figure 4.
The interaction between FADD and caspase-8. Raw264.7 cells were transfected with pEGFP-N1 or pEGFP–FADD and DsRED–caspase-8 for 48 h. Co-IP assays were performed using anti-GFP (a) and anti-caspase-8 (b).
-
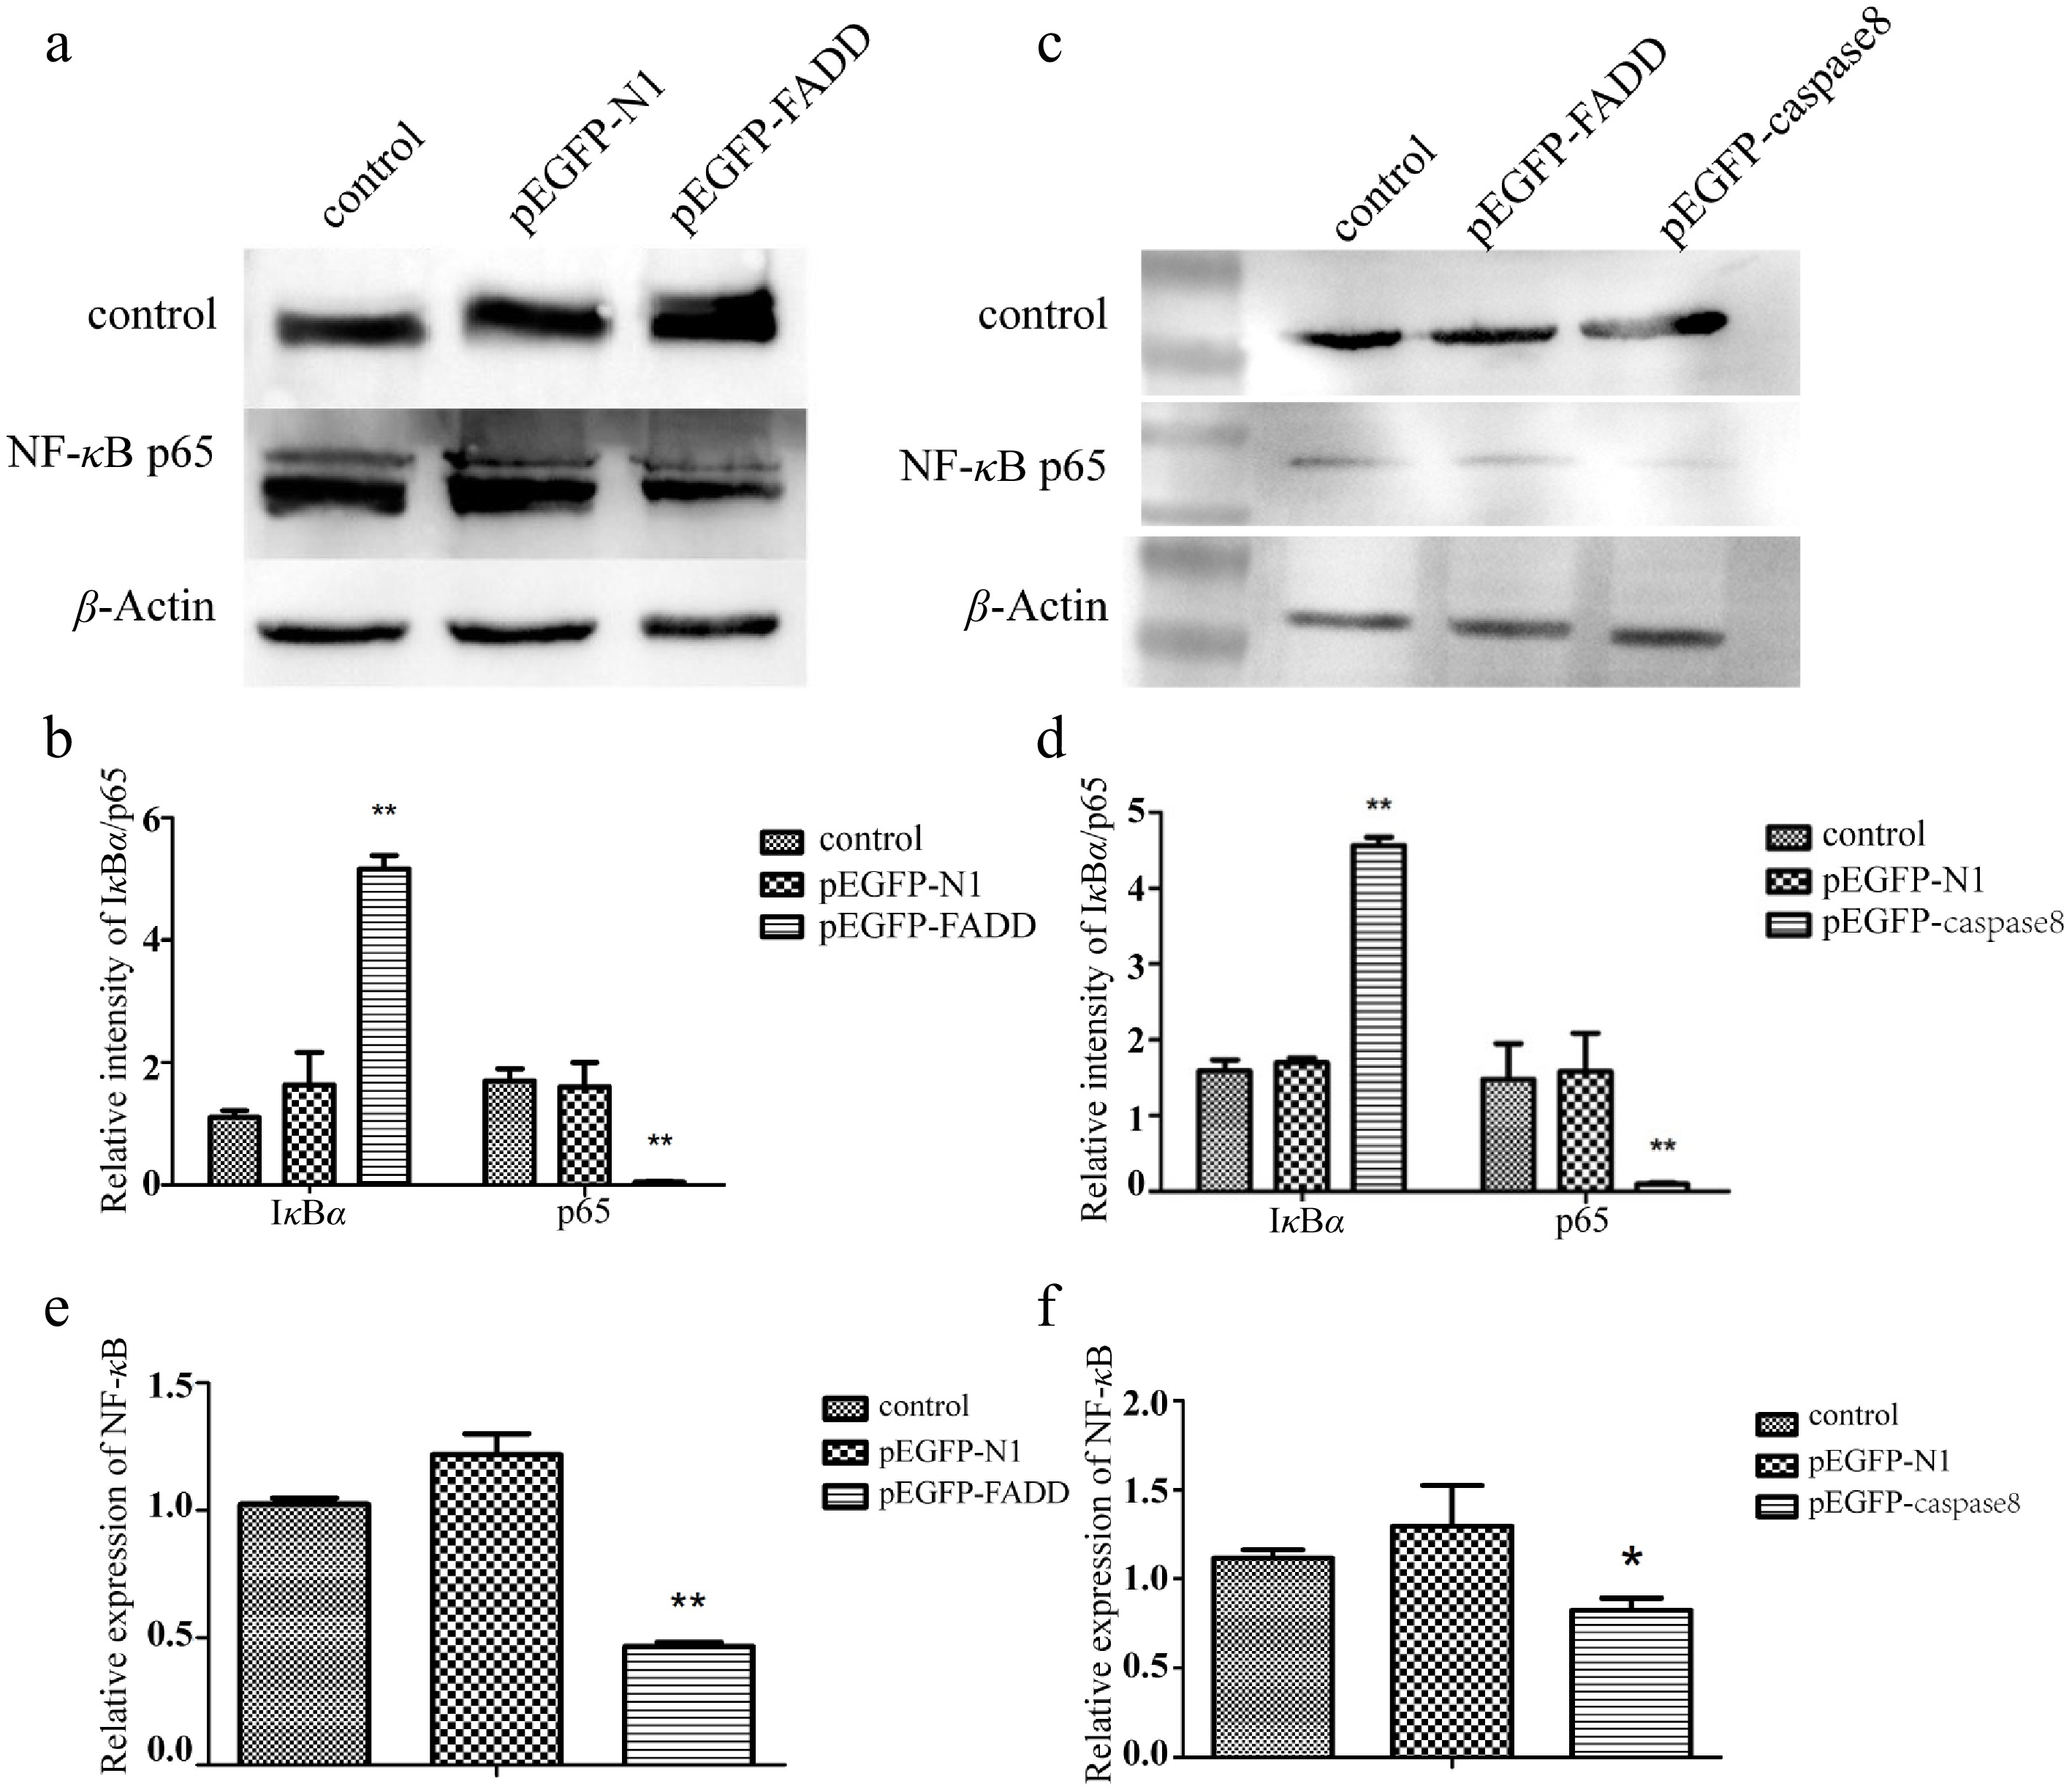
Figure 5.
Effect of the overexpression of pEGFP–FADD and pEGFP–caspase-8 on the NF-κB signaling pathway detected by Western blotting. (a, c) The expression levels of IκBα and p65 were detected by Western blotting. (b, d) The gray value of the strip was quantitatively analyzed with GAPDH as the internal parameter. (e) Effect of the overexpression of pEGFP–FADD on NF-κB transcription detected by qRT-PCR. (f) Effect of the overexpression of pEGFP–caspase-8 on NF-κB transcription levels detected by qRT-PCR, using GAPDH as an endogenous control. Vertical bars represent the mean ± standard error (SE) (n = 3), and significant differences are marked with asterisks (* p < 0.05, ** p < 0.01).
-
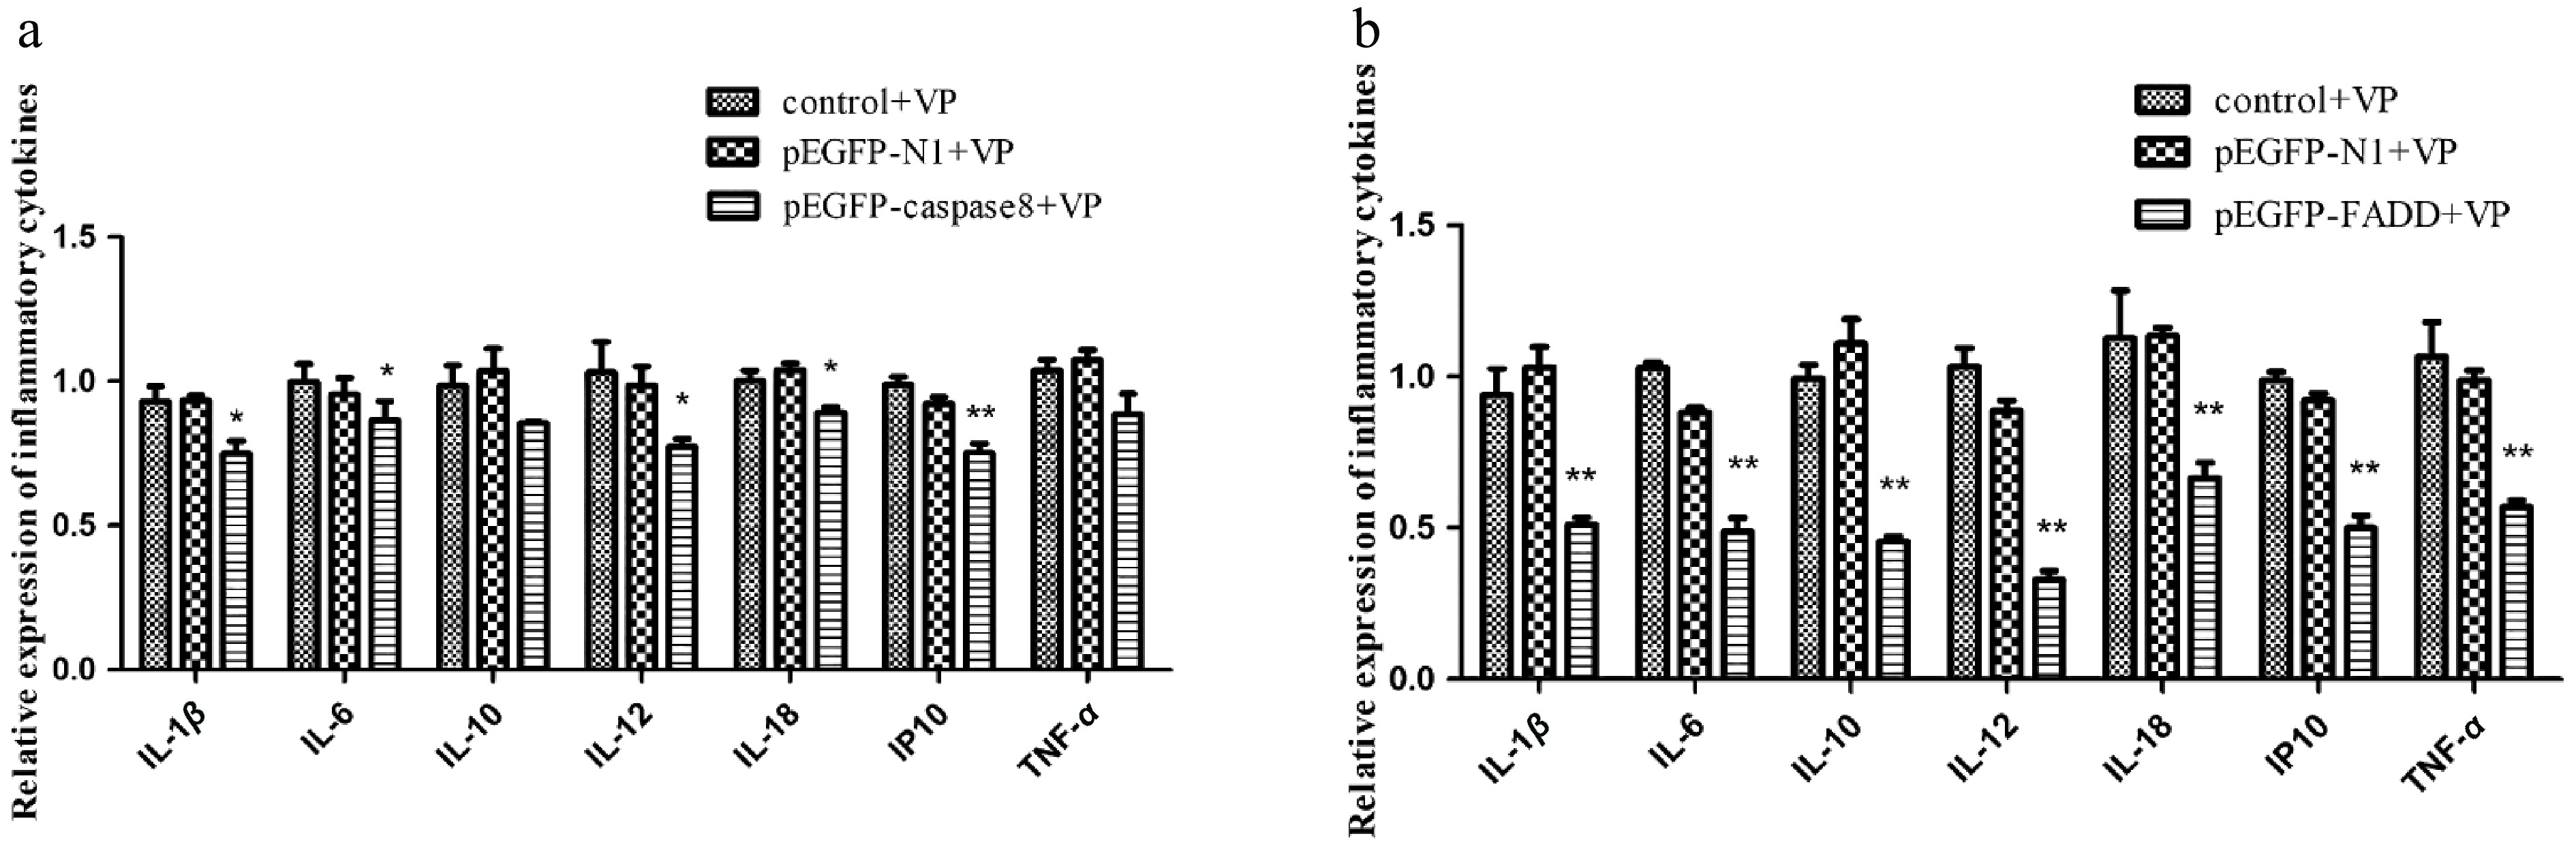
Figure 6.
The effect of the overexpression of pEGFP–caspase-8 on downstream inflammatory factors when infected with V. parahaemolyticus. The expression levels of IL-1β, IL-6, IL-10, IL-12, IL-18, IP10, and TNF-α were detected by qRT-PCR, and GAPDH was used as internal reference. (a) pEGFP–FADD. (b) pEGFP–caspase-8. Vertical bars represent the mean ± SE (n = 3), and significant differences are marked with asterisks (* p < 0.05, ** p < 0.01).
Figures
(6)
Tables
(0)