-
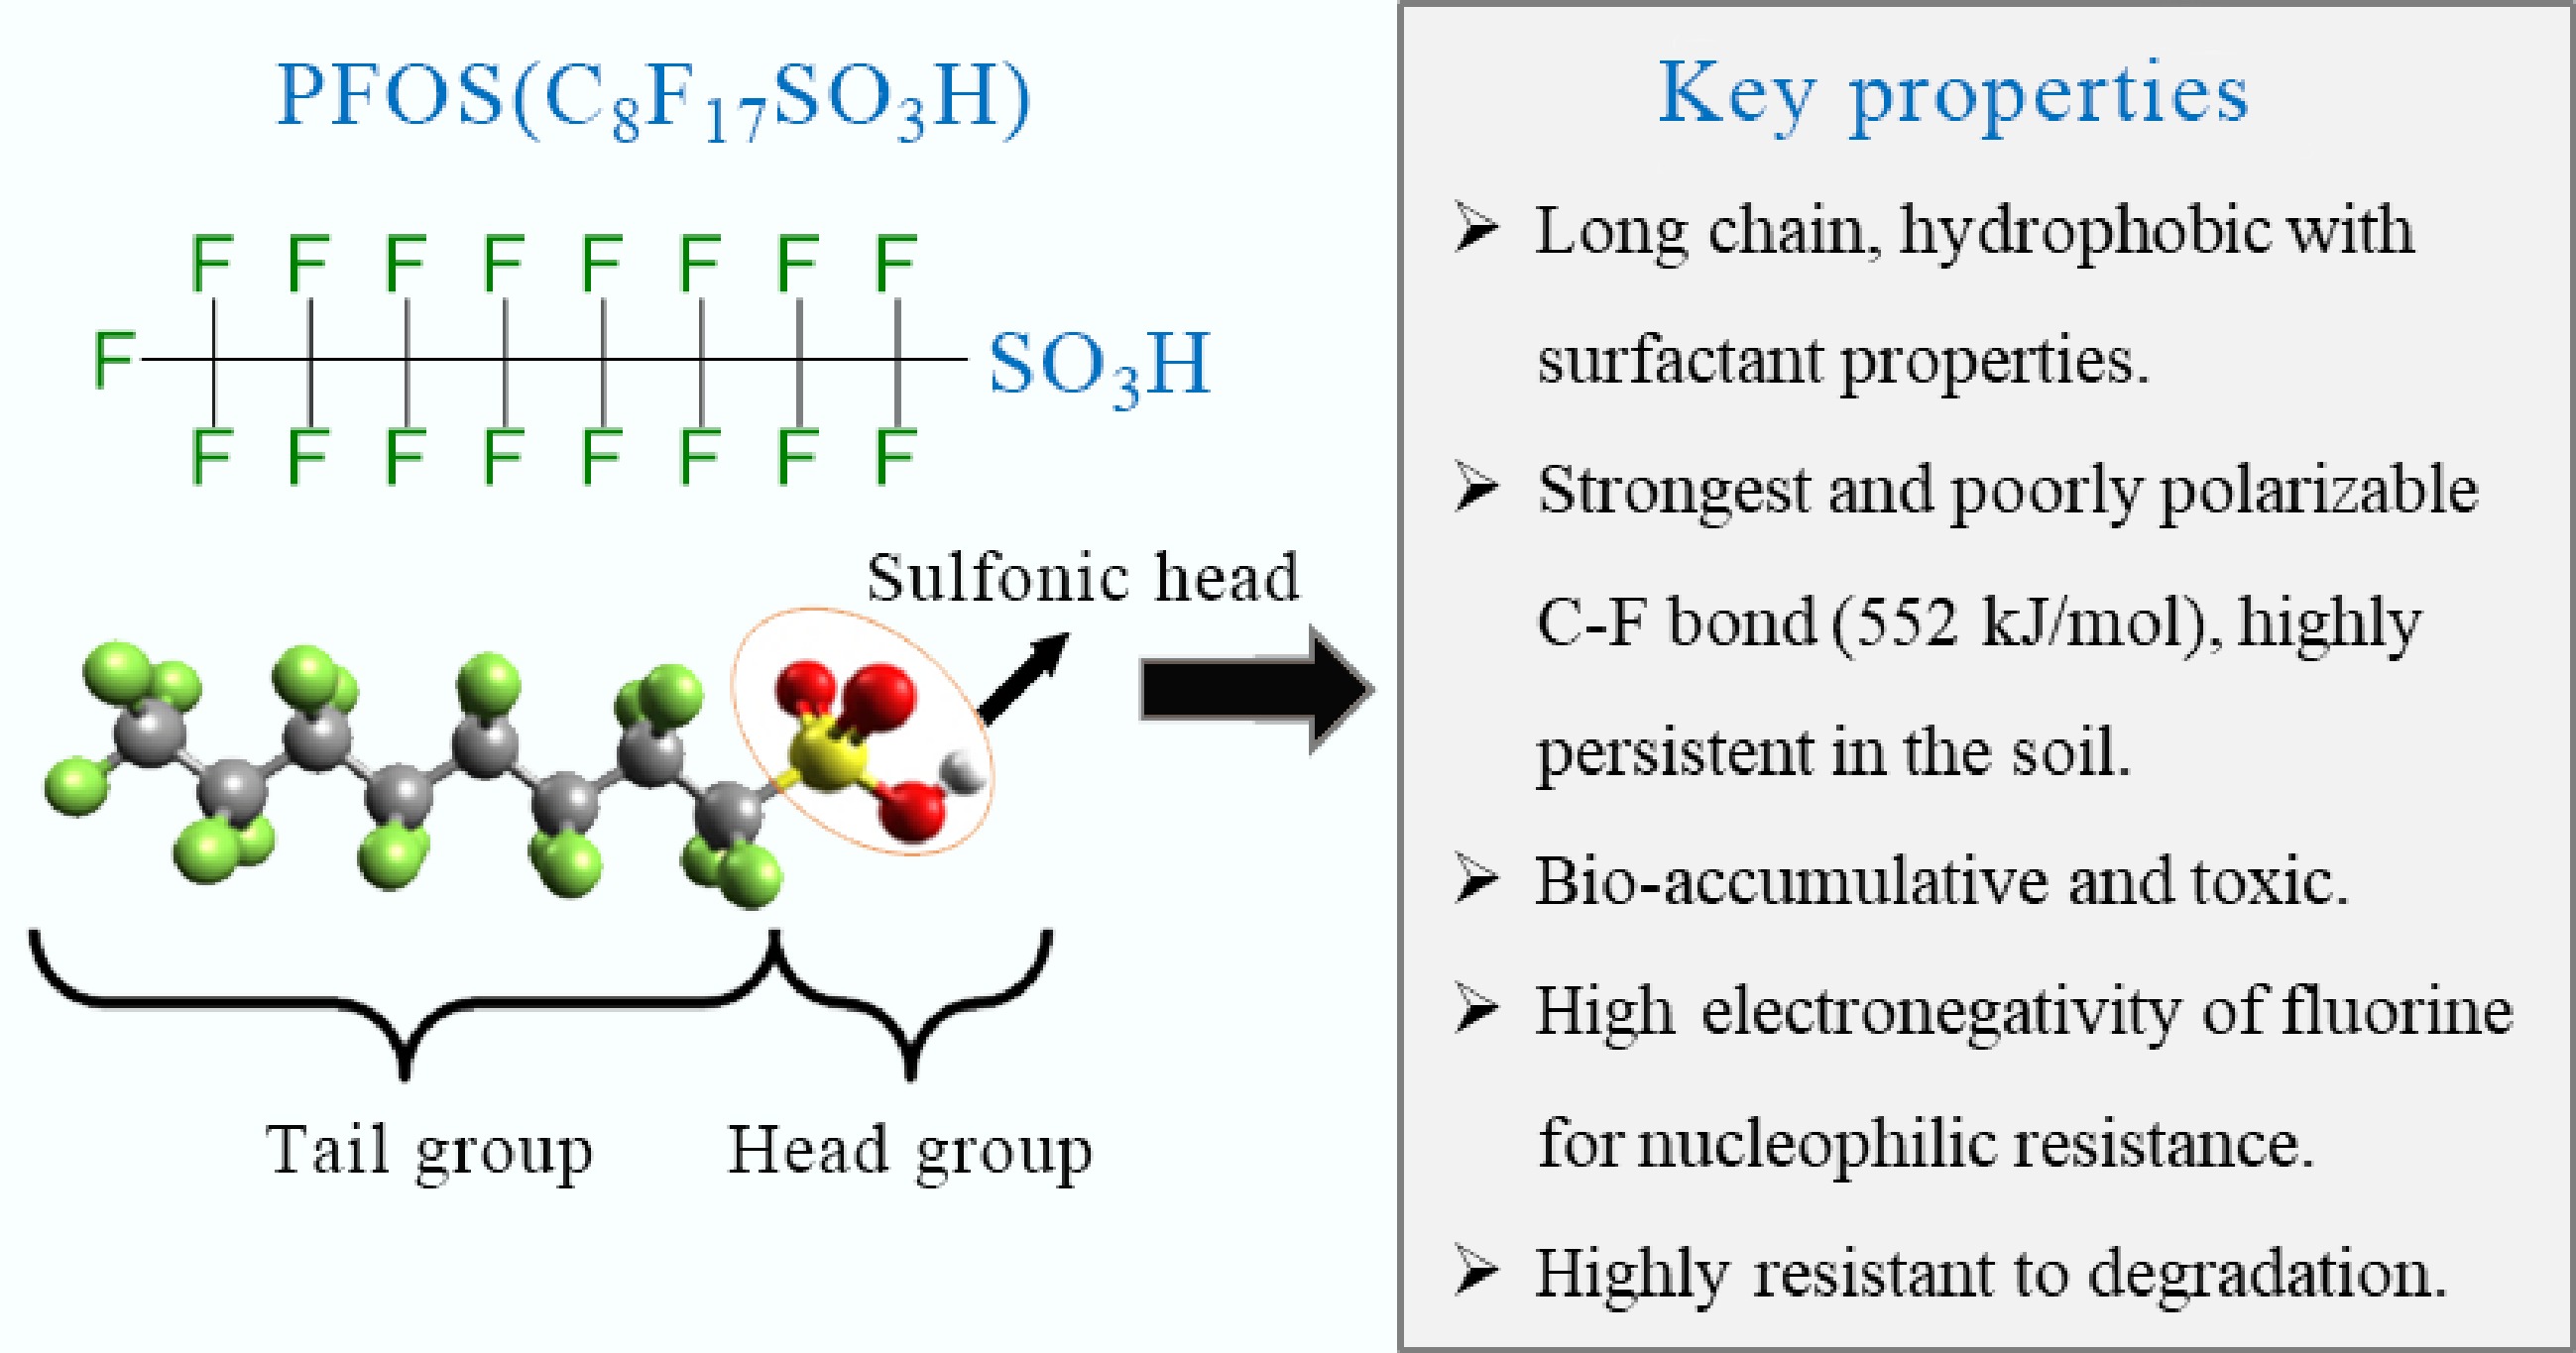
Figure 1.
The chemical structure and key properties of PFOS.
-
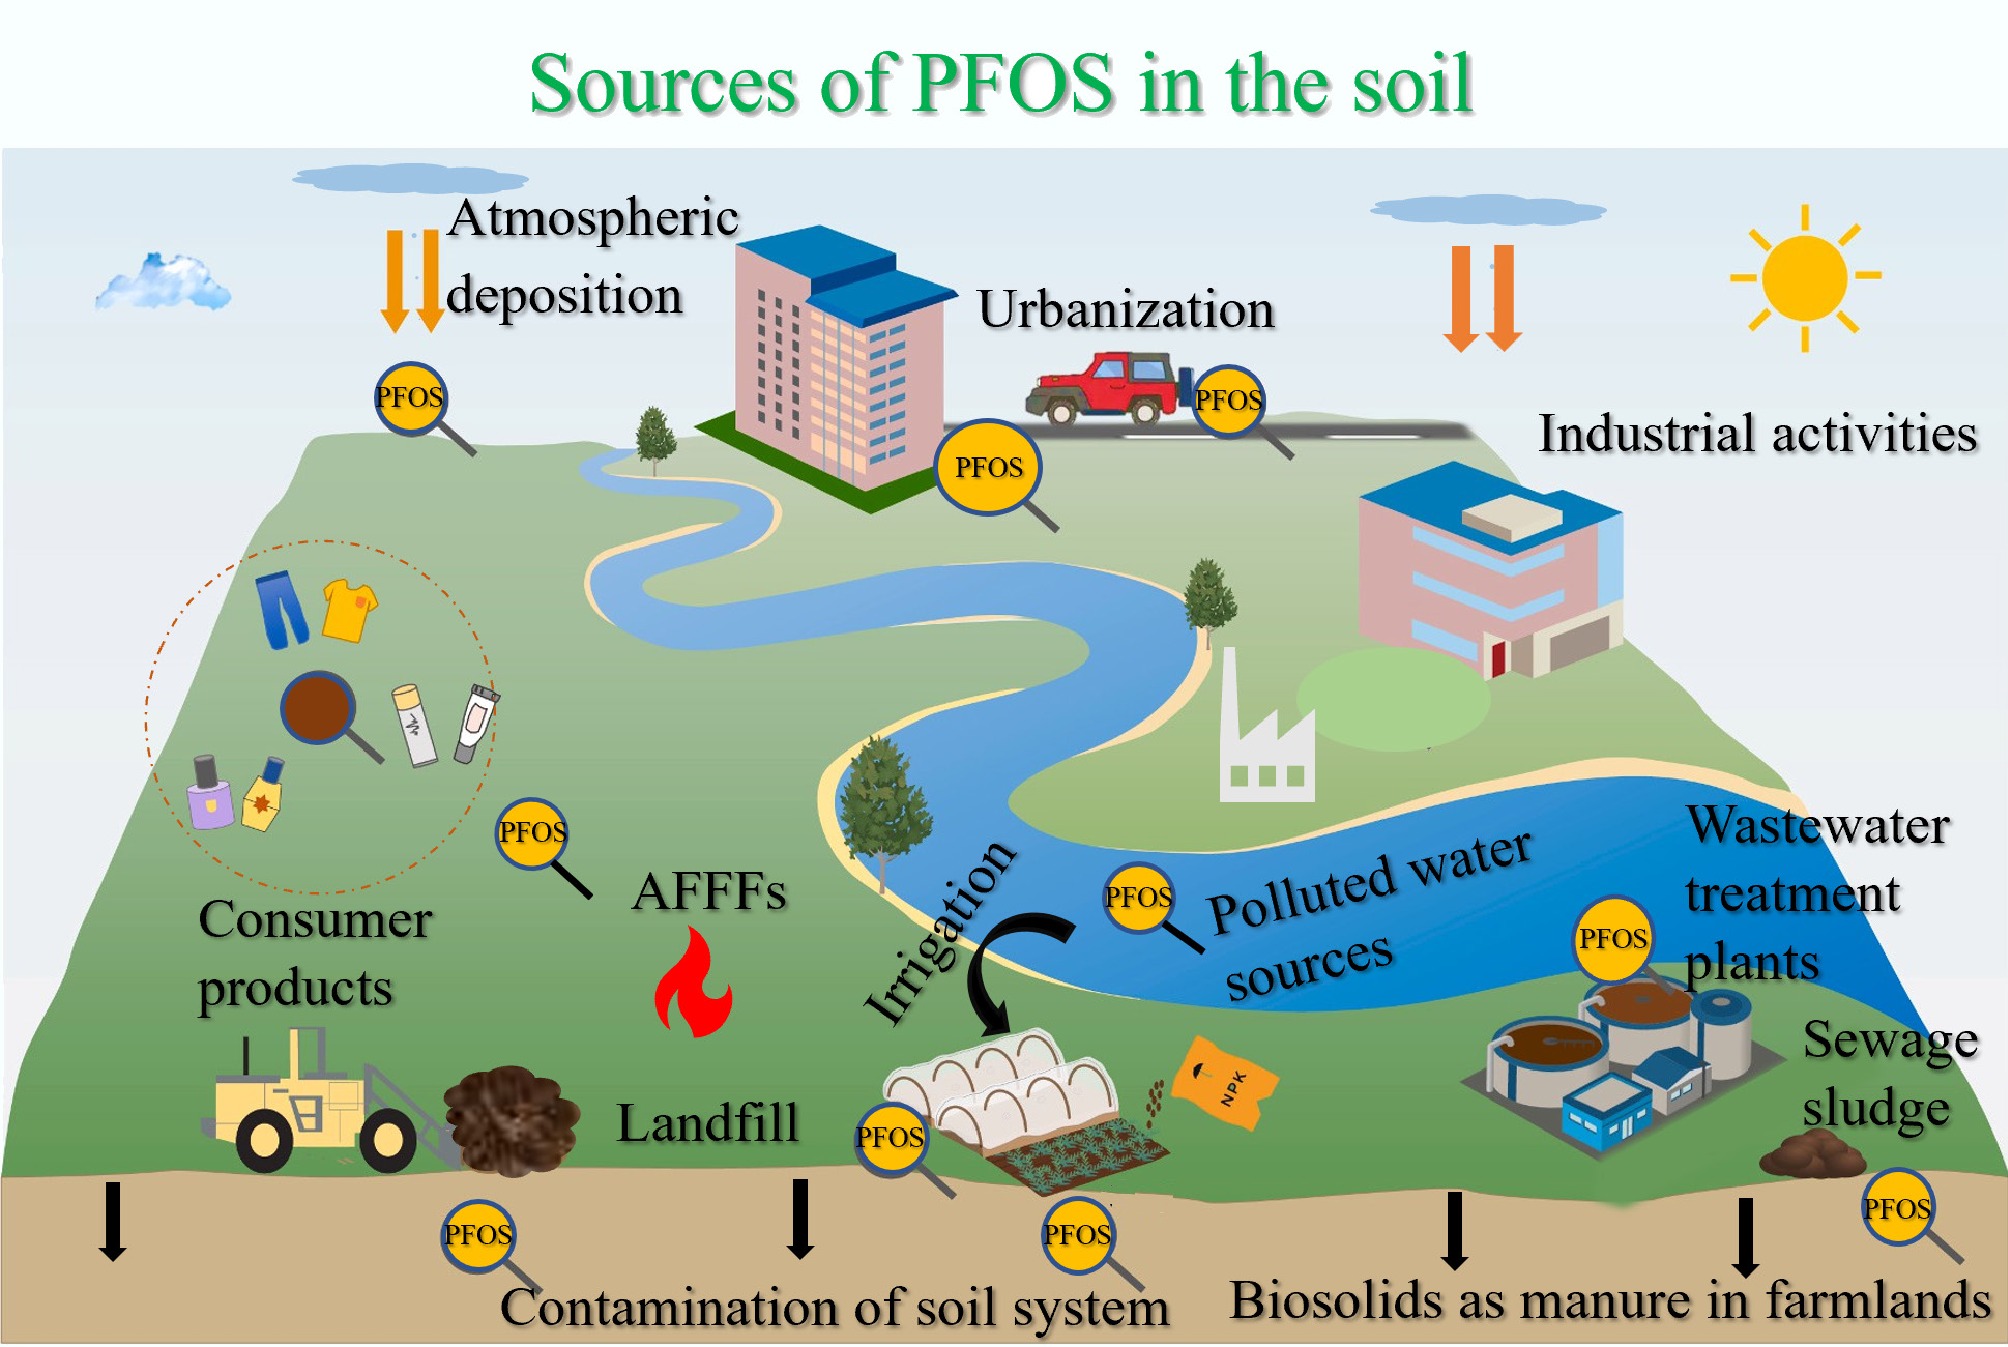
Figure 2.
The possible sources and fate of PFOS in the soil environment in Africa.
-
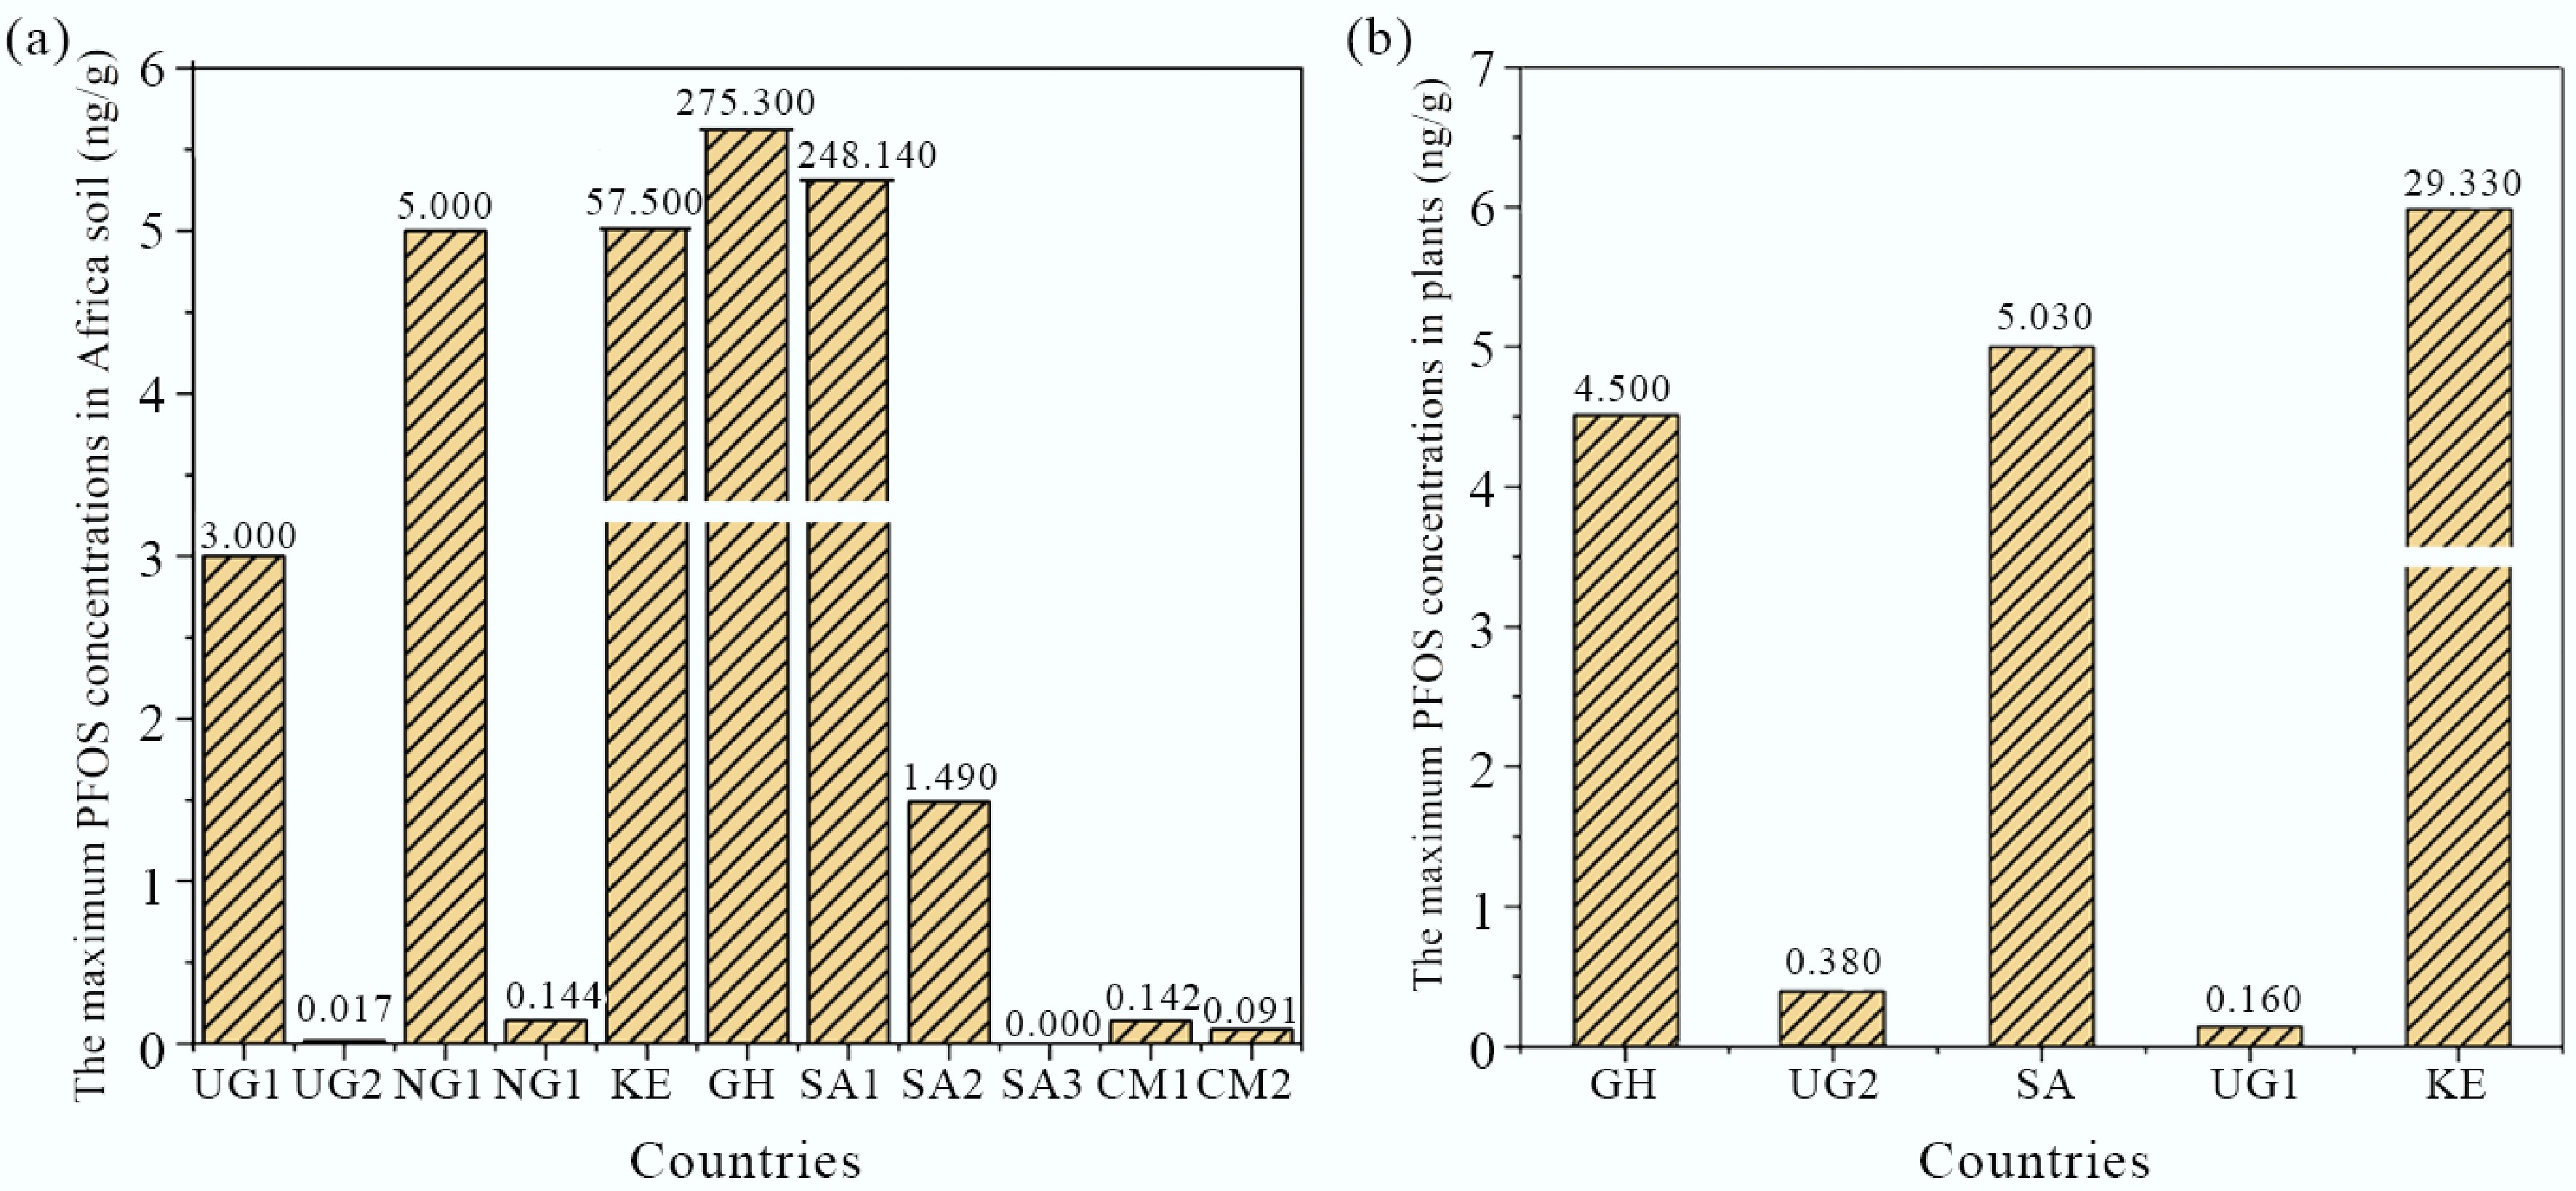
Figure 3.
The maximum concentrations of PFOS in: (a) the soil, (b) and plants collected from different locations in Africa (UG1: Uganda; UG2: Mabira Forest Reserve, Uganda; NG1: Nigeria; NG2: Jos, Nigeria; KE: Kenya; GH: Ghana; SA1: Cape Town, South Africa; SA2: South Africa; SA3: Mapunguwe National Park, South Africa; CM1: Buea, Cameroon; CM2: Edea, Cameroon).
-
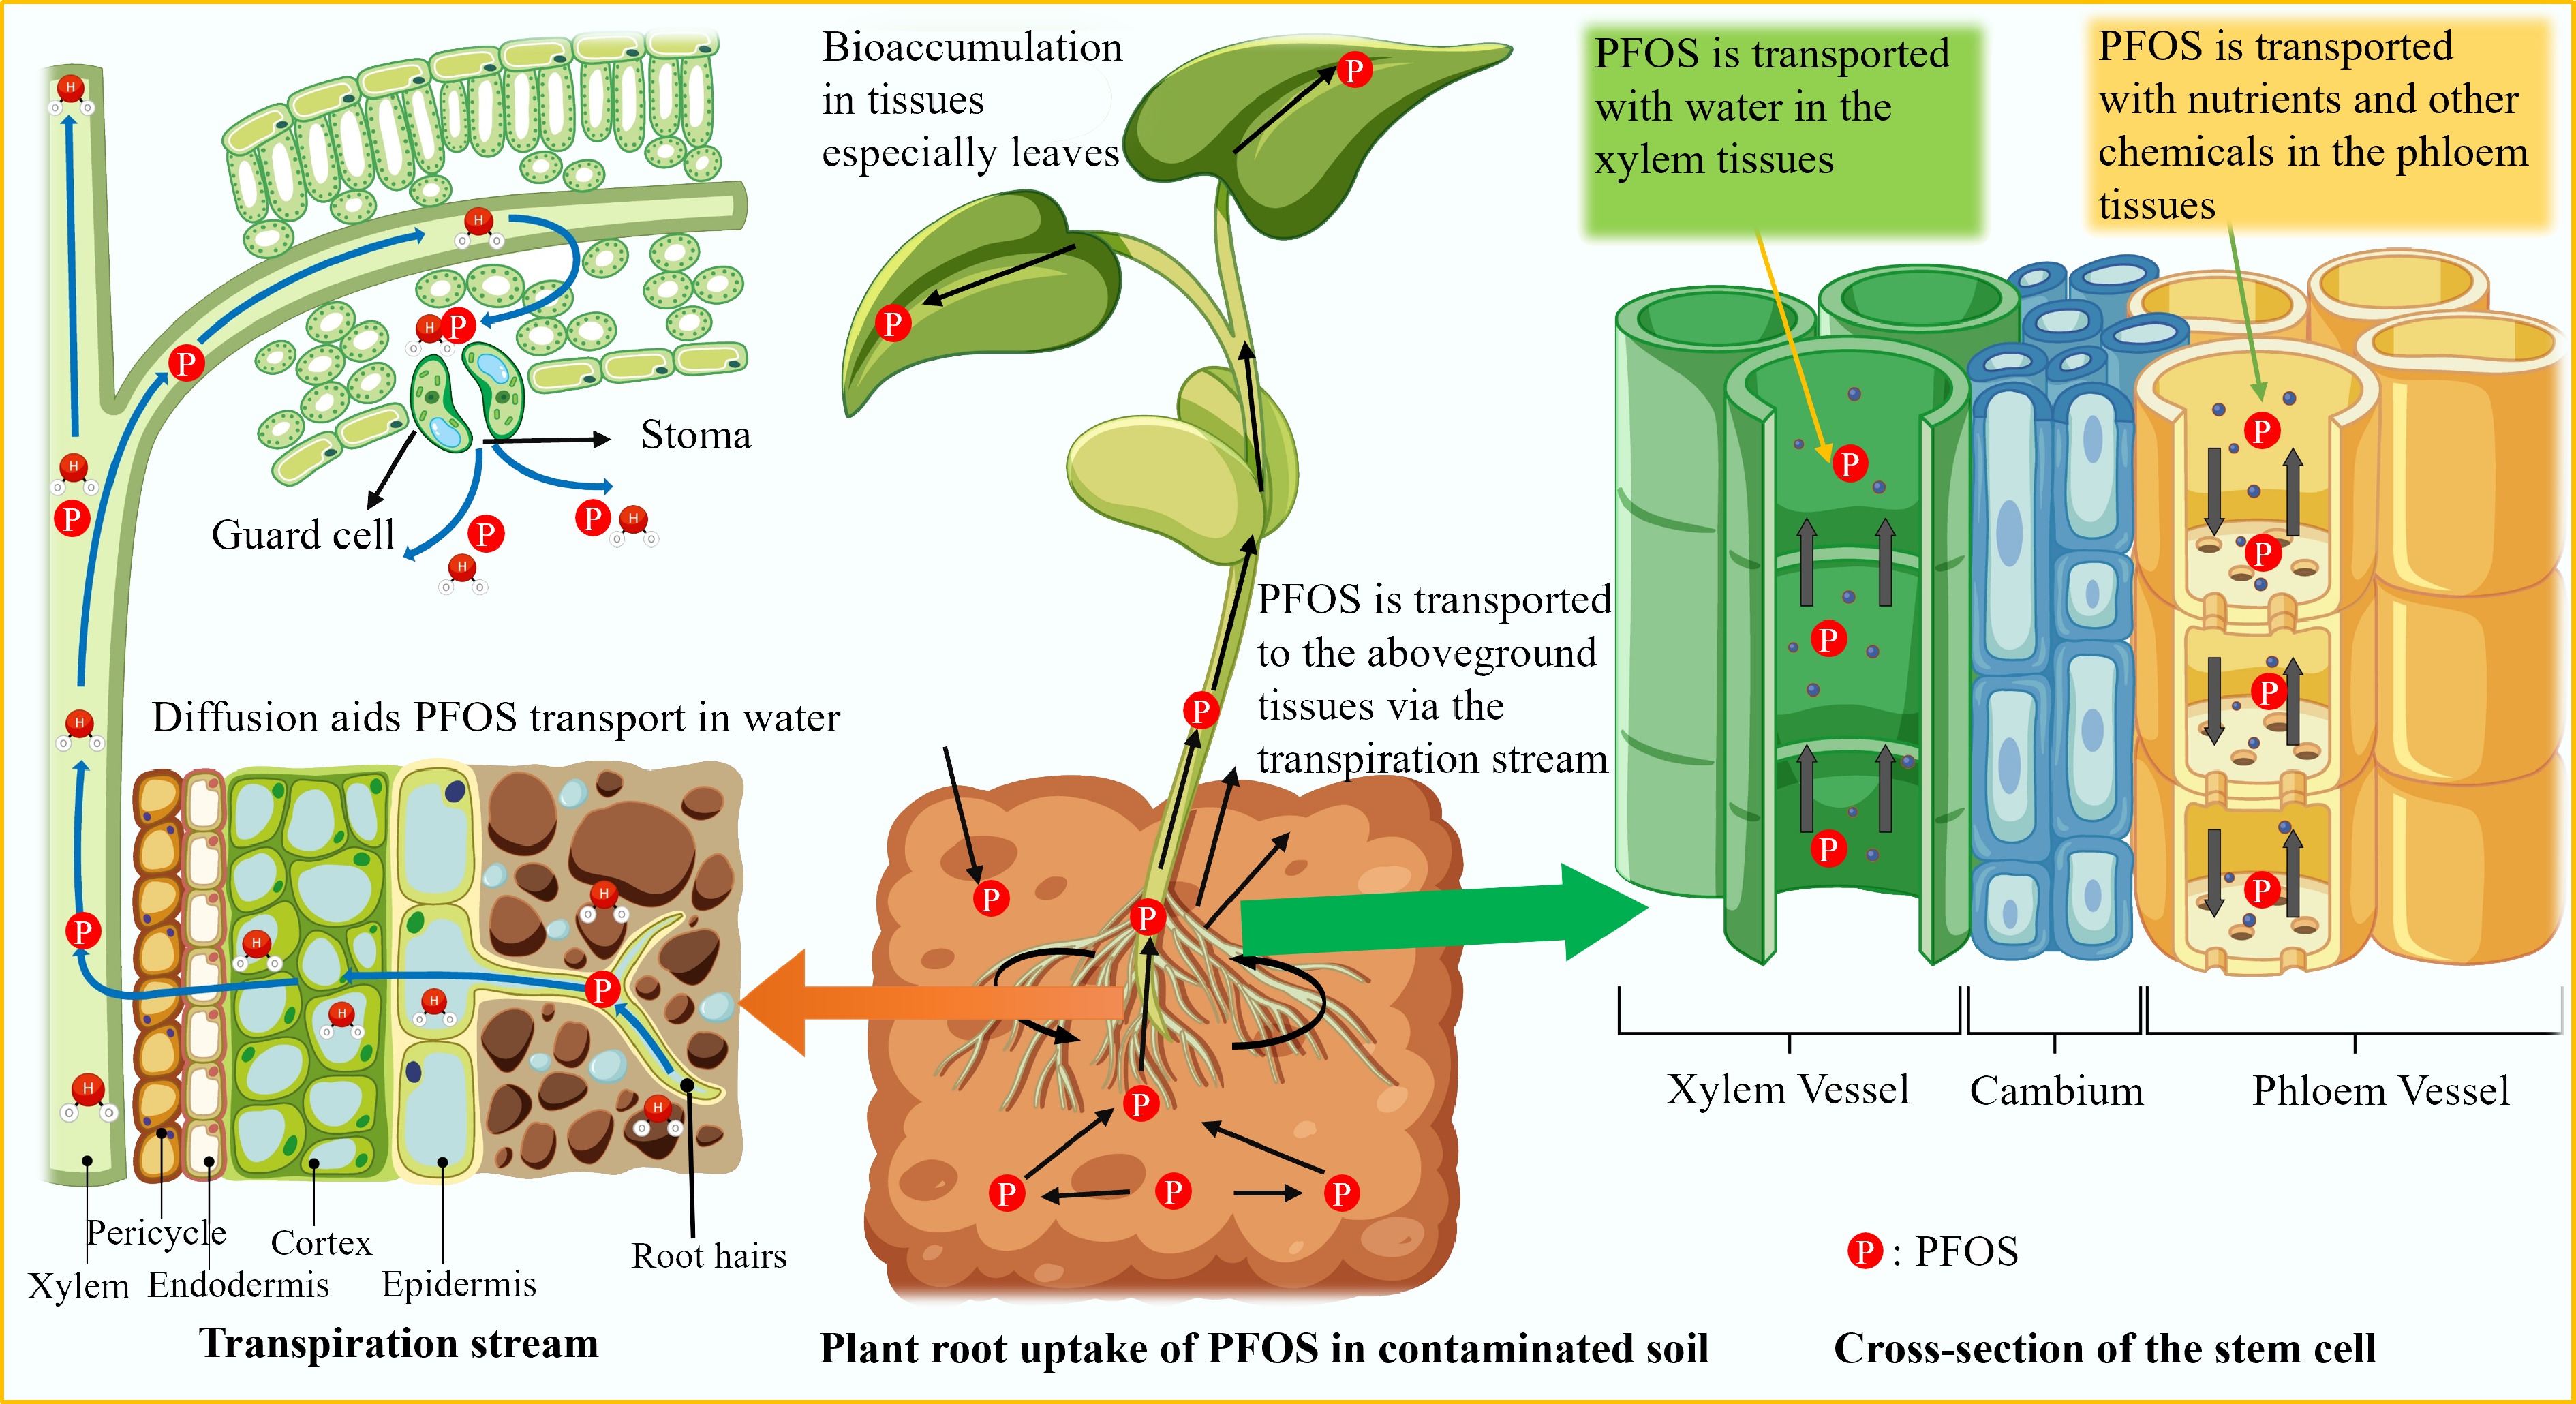
Figure 4.
Root uptake and translocation via transpiration and cell membrane (symplastic and apoplastic pathways) of PFOS to aboveground tissues via the cortex, phloem, and xylem cells.
-
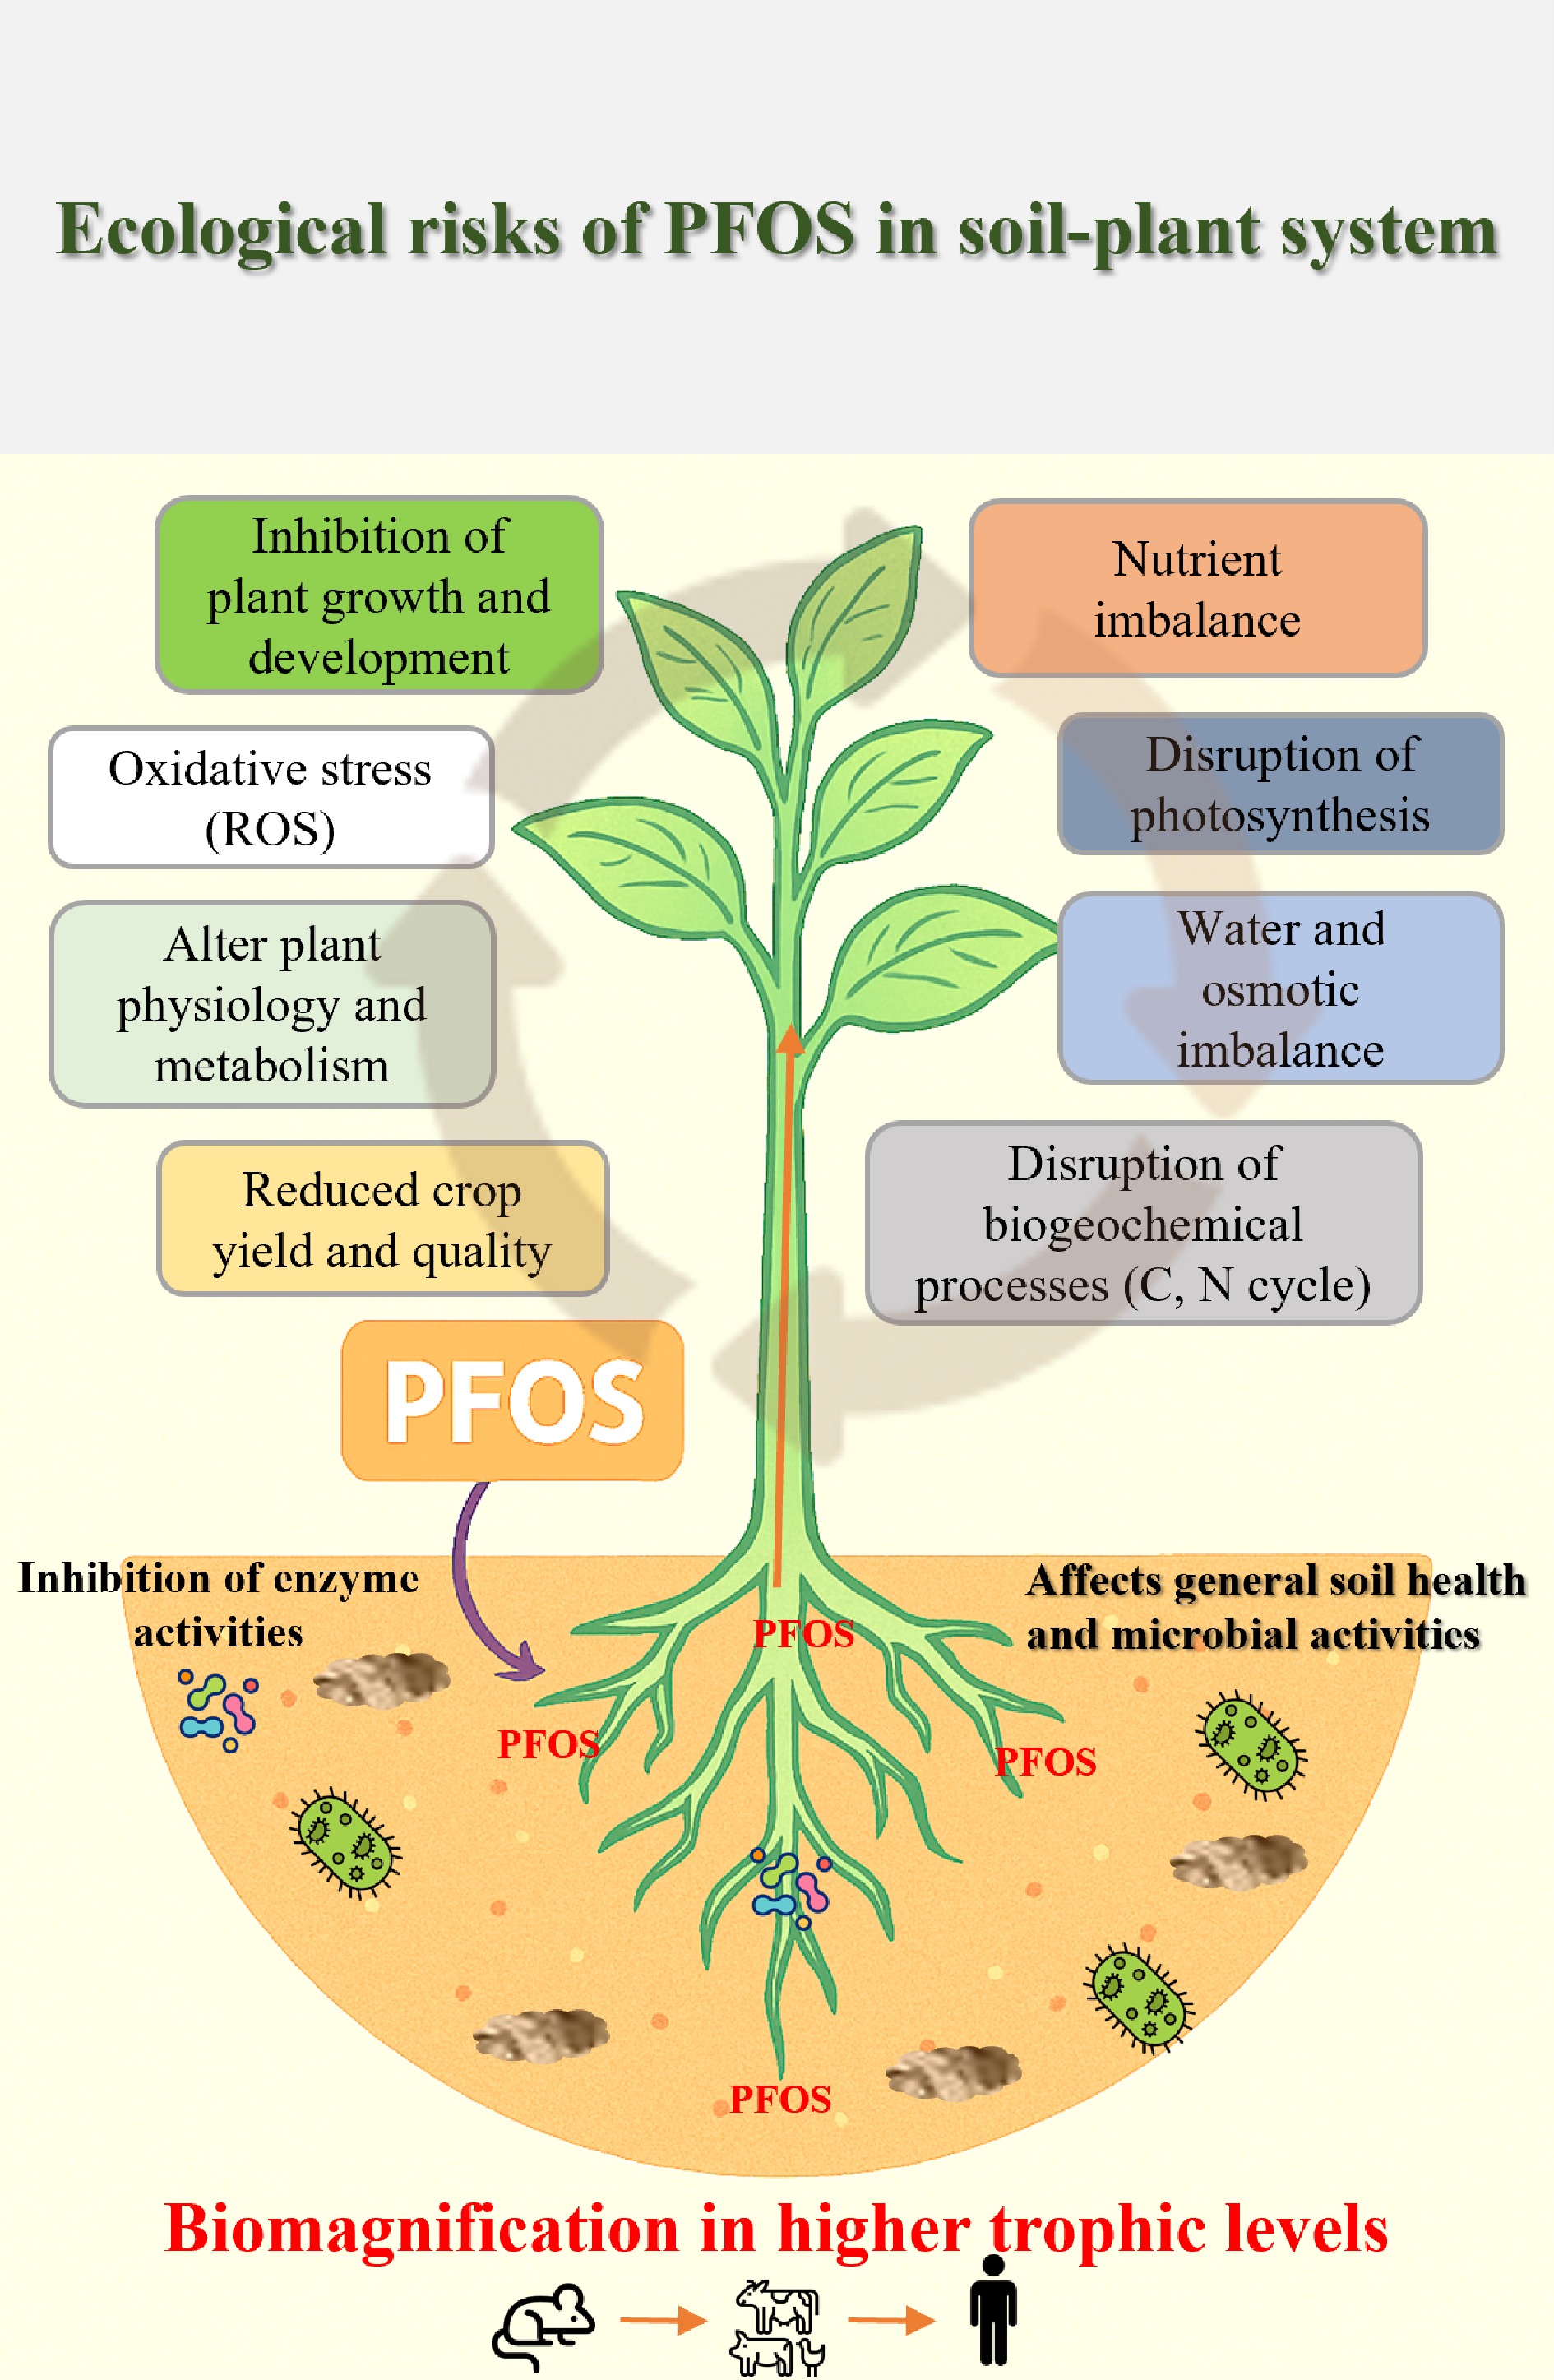
Figure 5.
Ecological risks caused by PFOS accumulation in the soil–plant system.
-
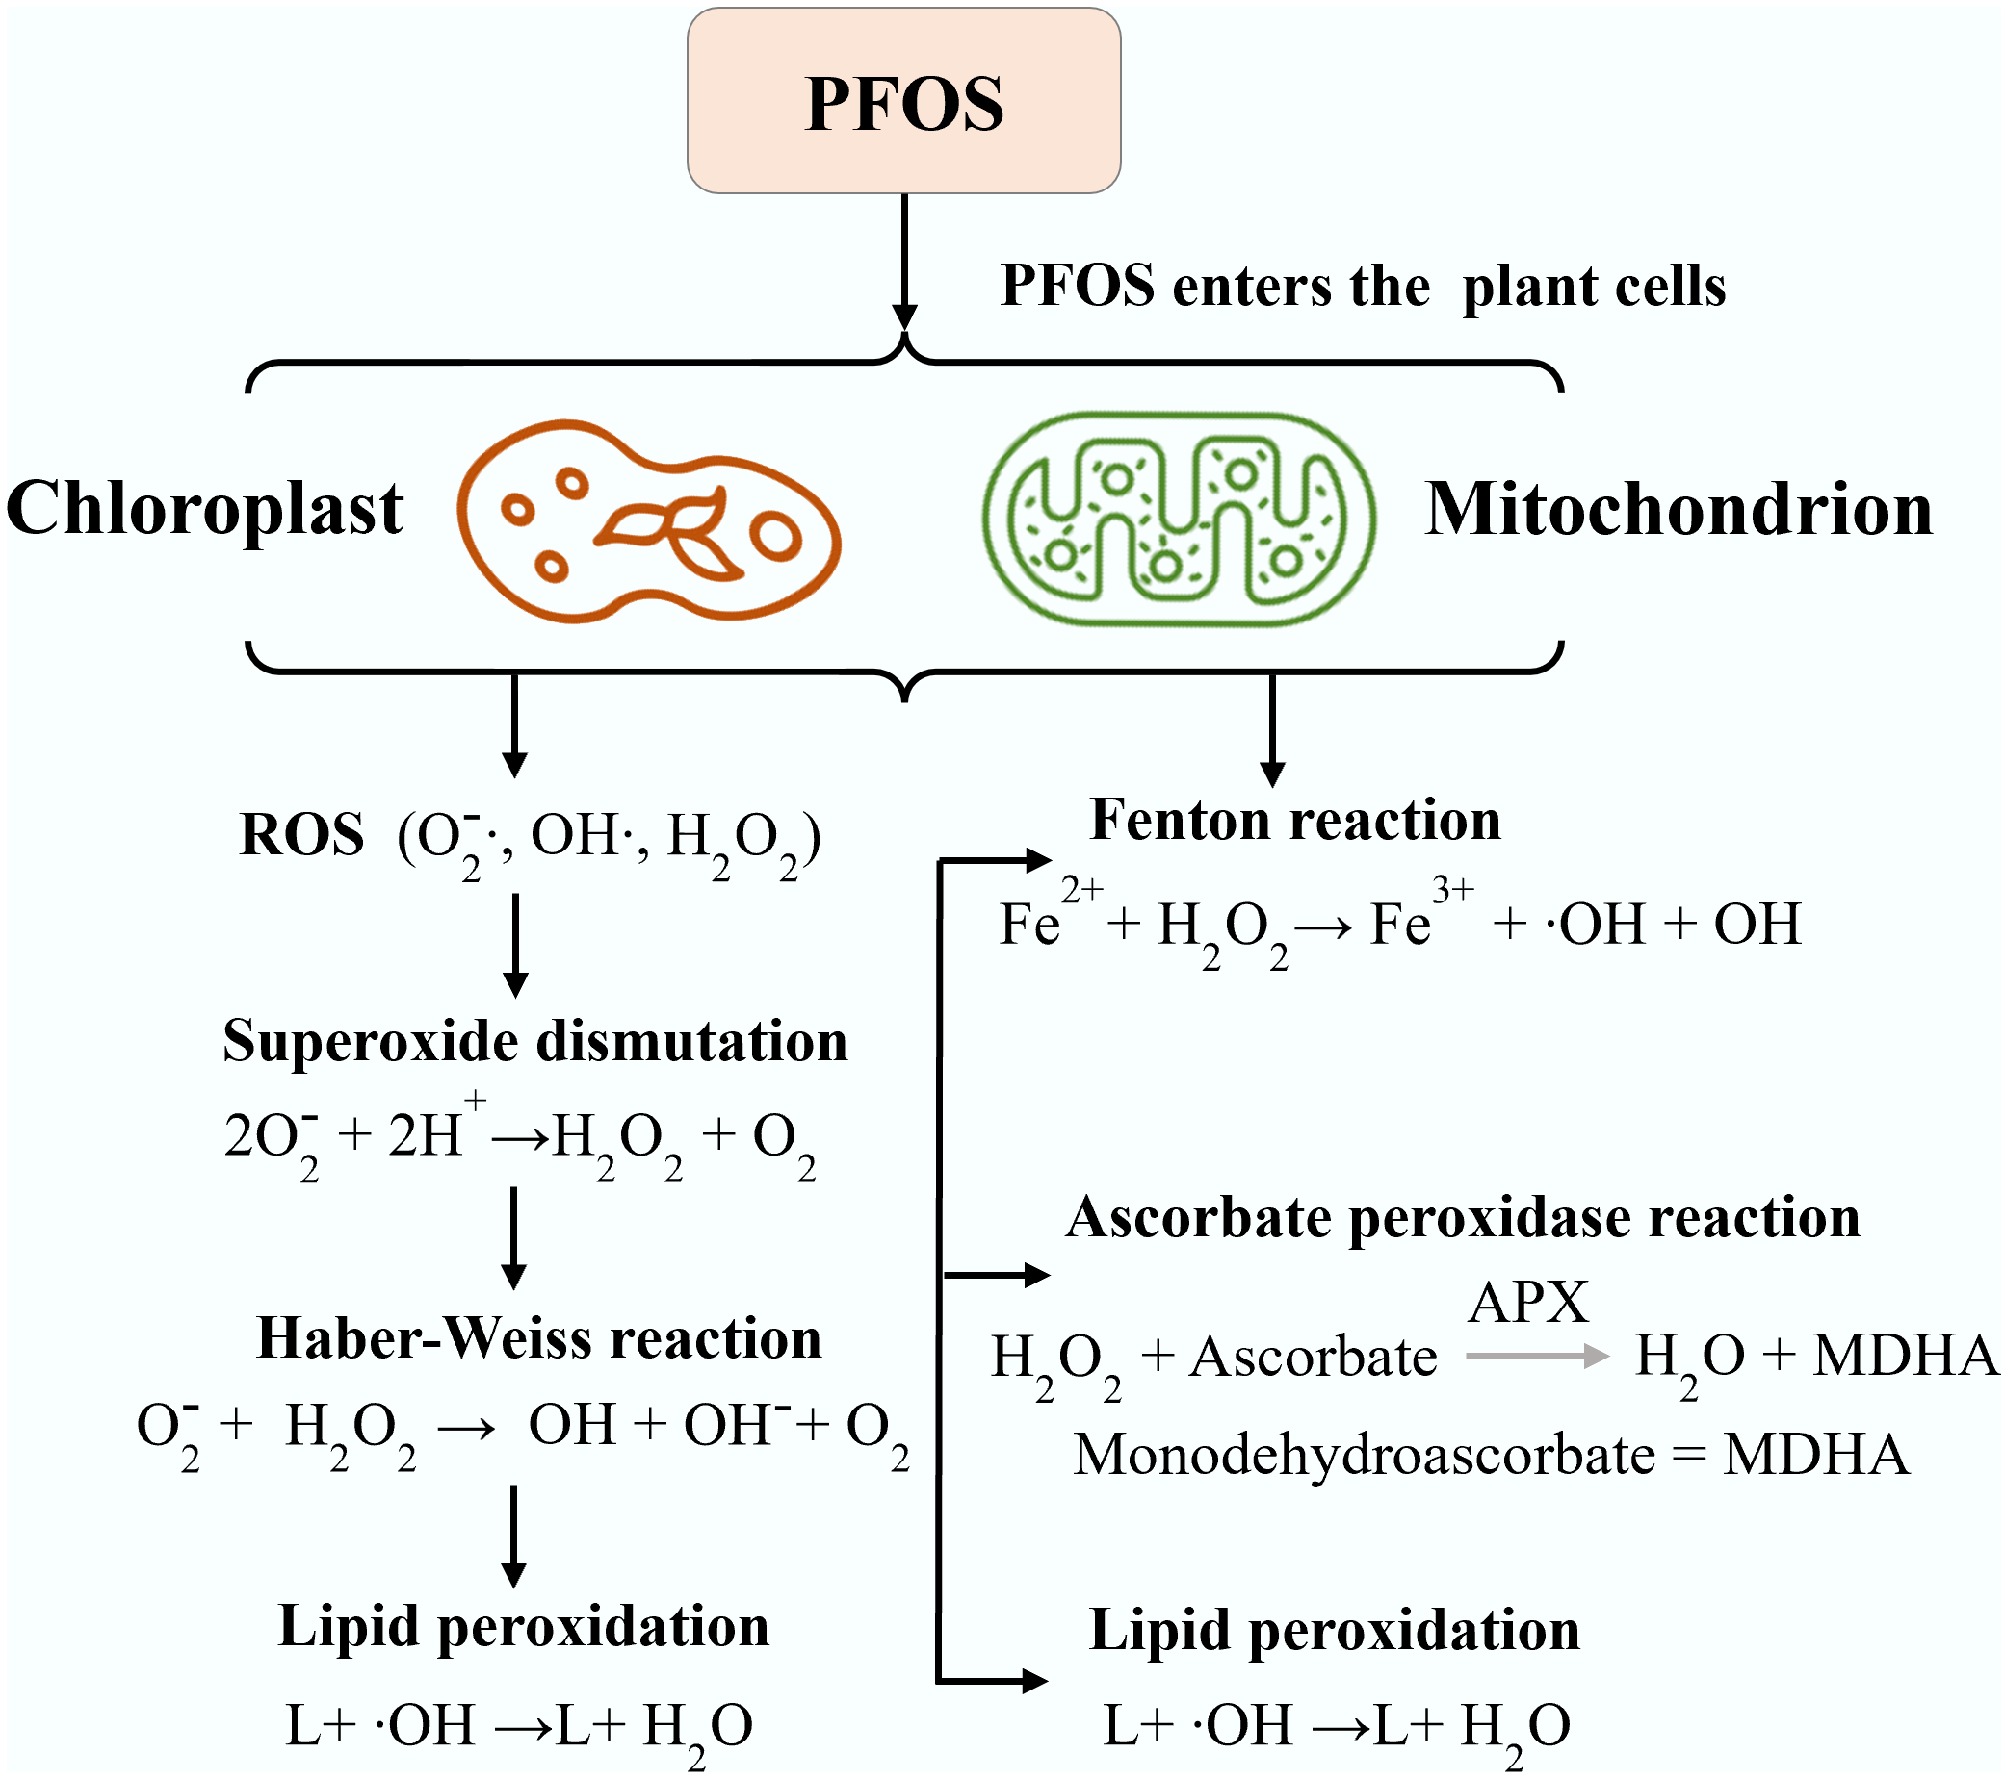
Figure 6.
The reactions that occur in plants from the production of ROS to the resulting Fenton reaction.
Figures
(6)
Tables
(0)