-
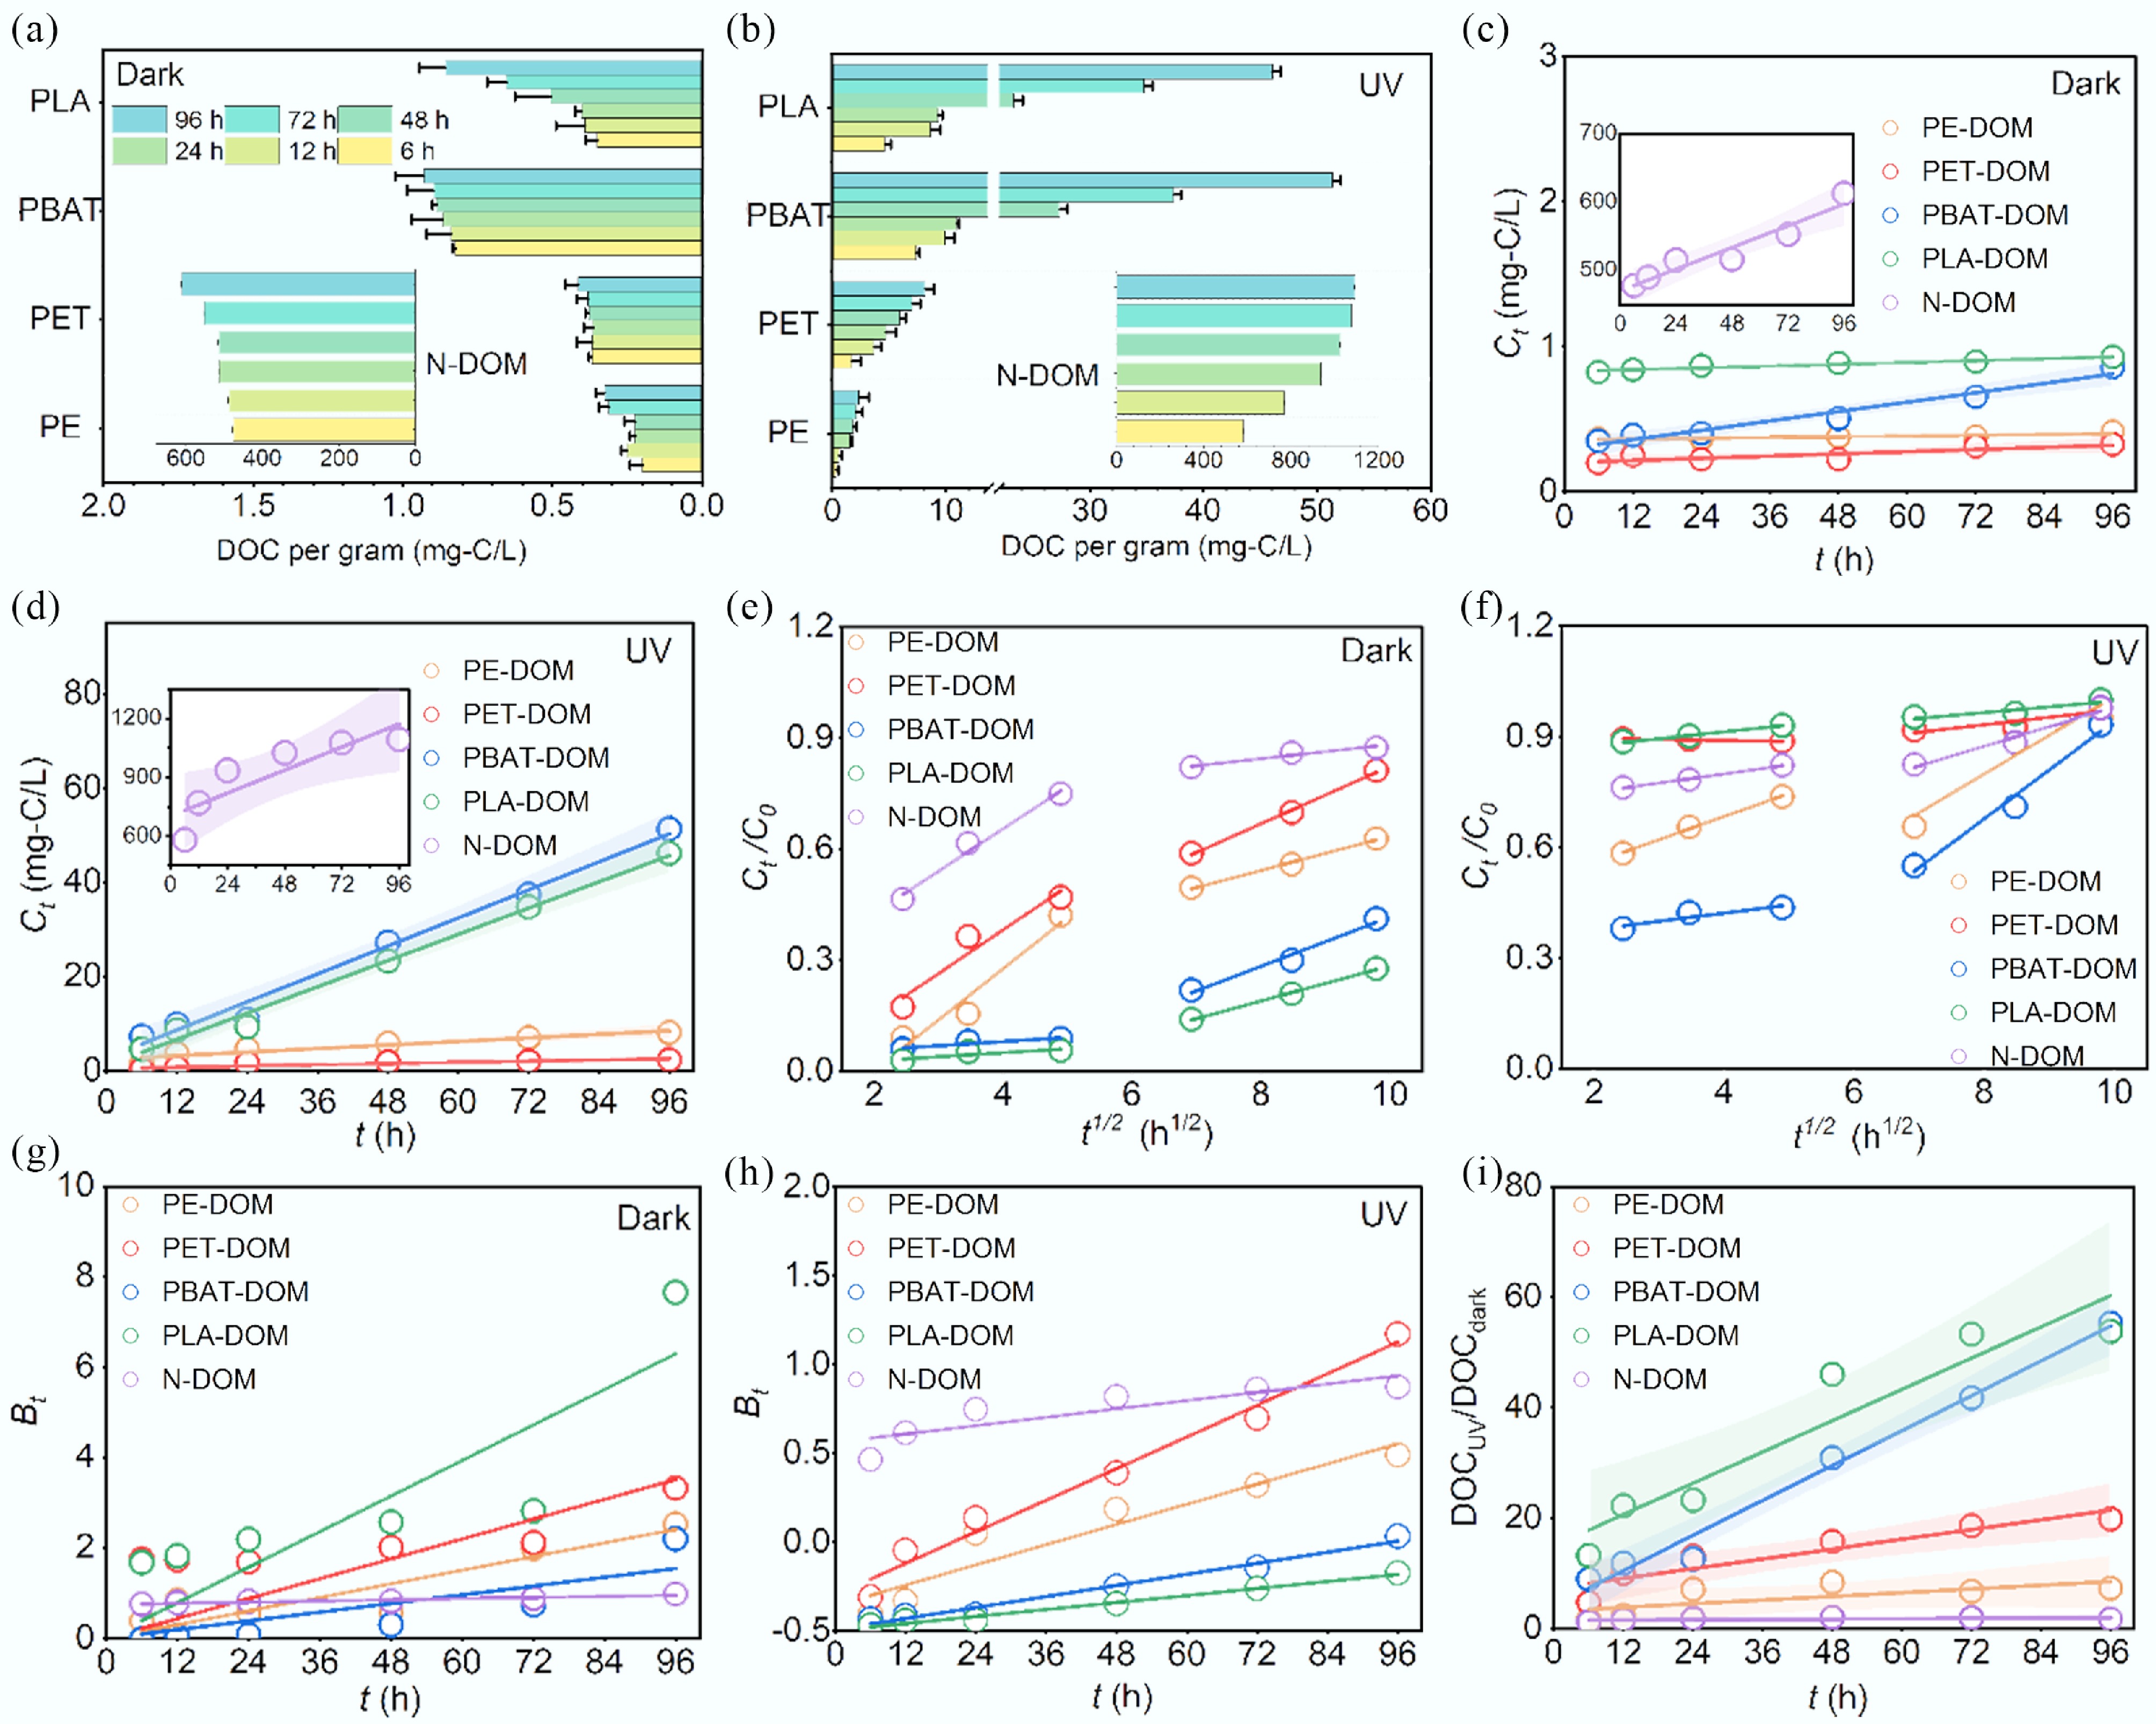
Figure 1.
Derivation kinetics of MPs-DOM and N-DOM with the treatment under dark and UV irradiation conditions. (a), (b) DOC; (c), (d) zero-order kinetic model; (e), (f) intraparticle diffusion kinetic model; (g), (h) Boyd film diffusion kinetic model; and (i) the DOCUV/DOCdark ratio.
-
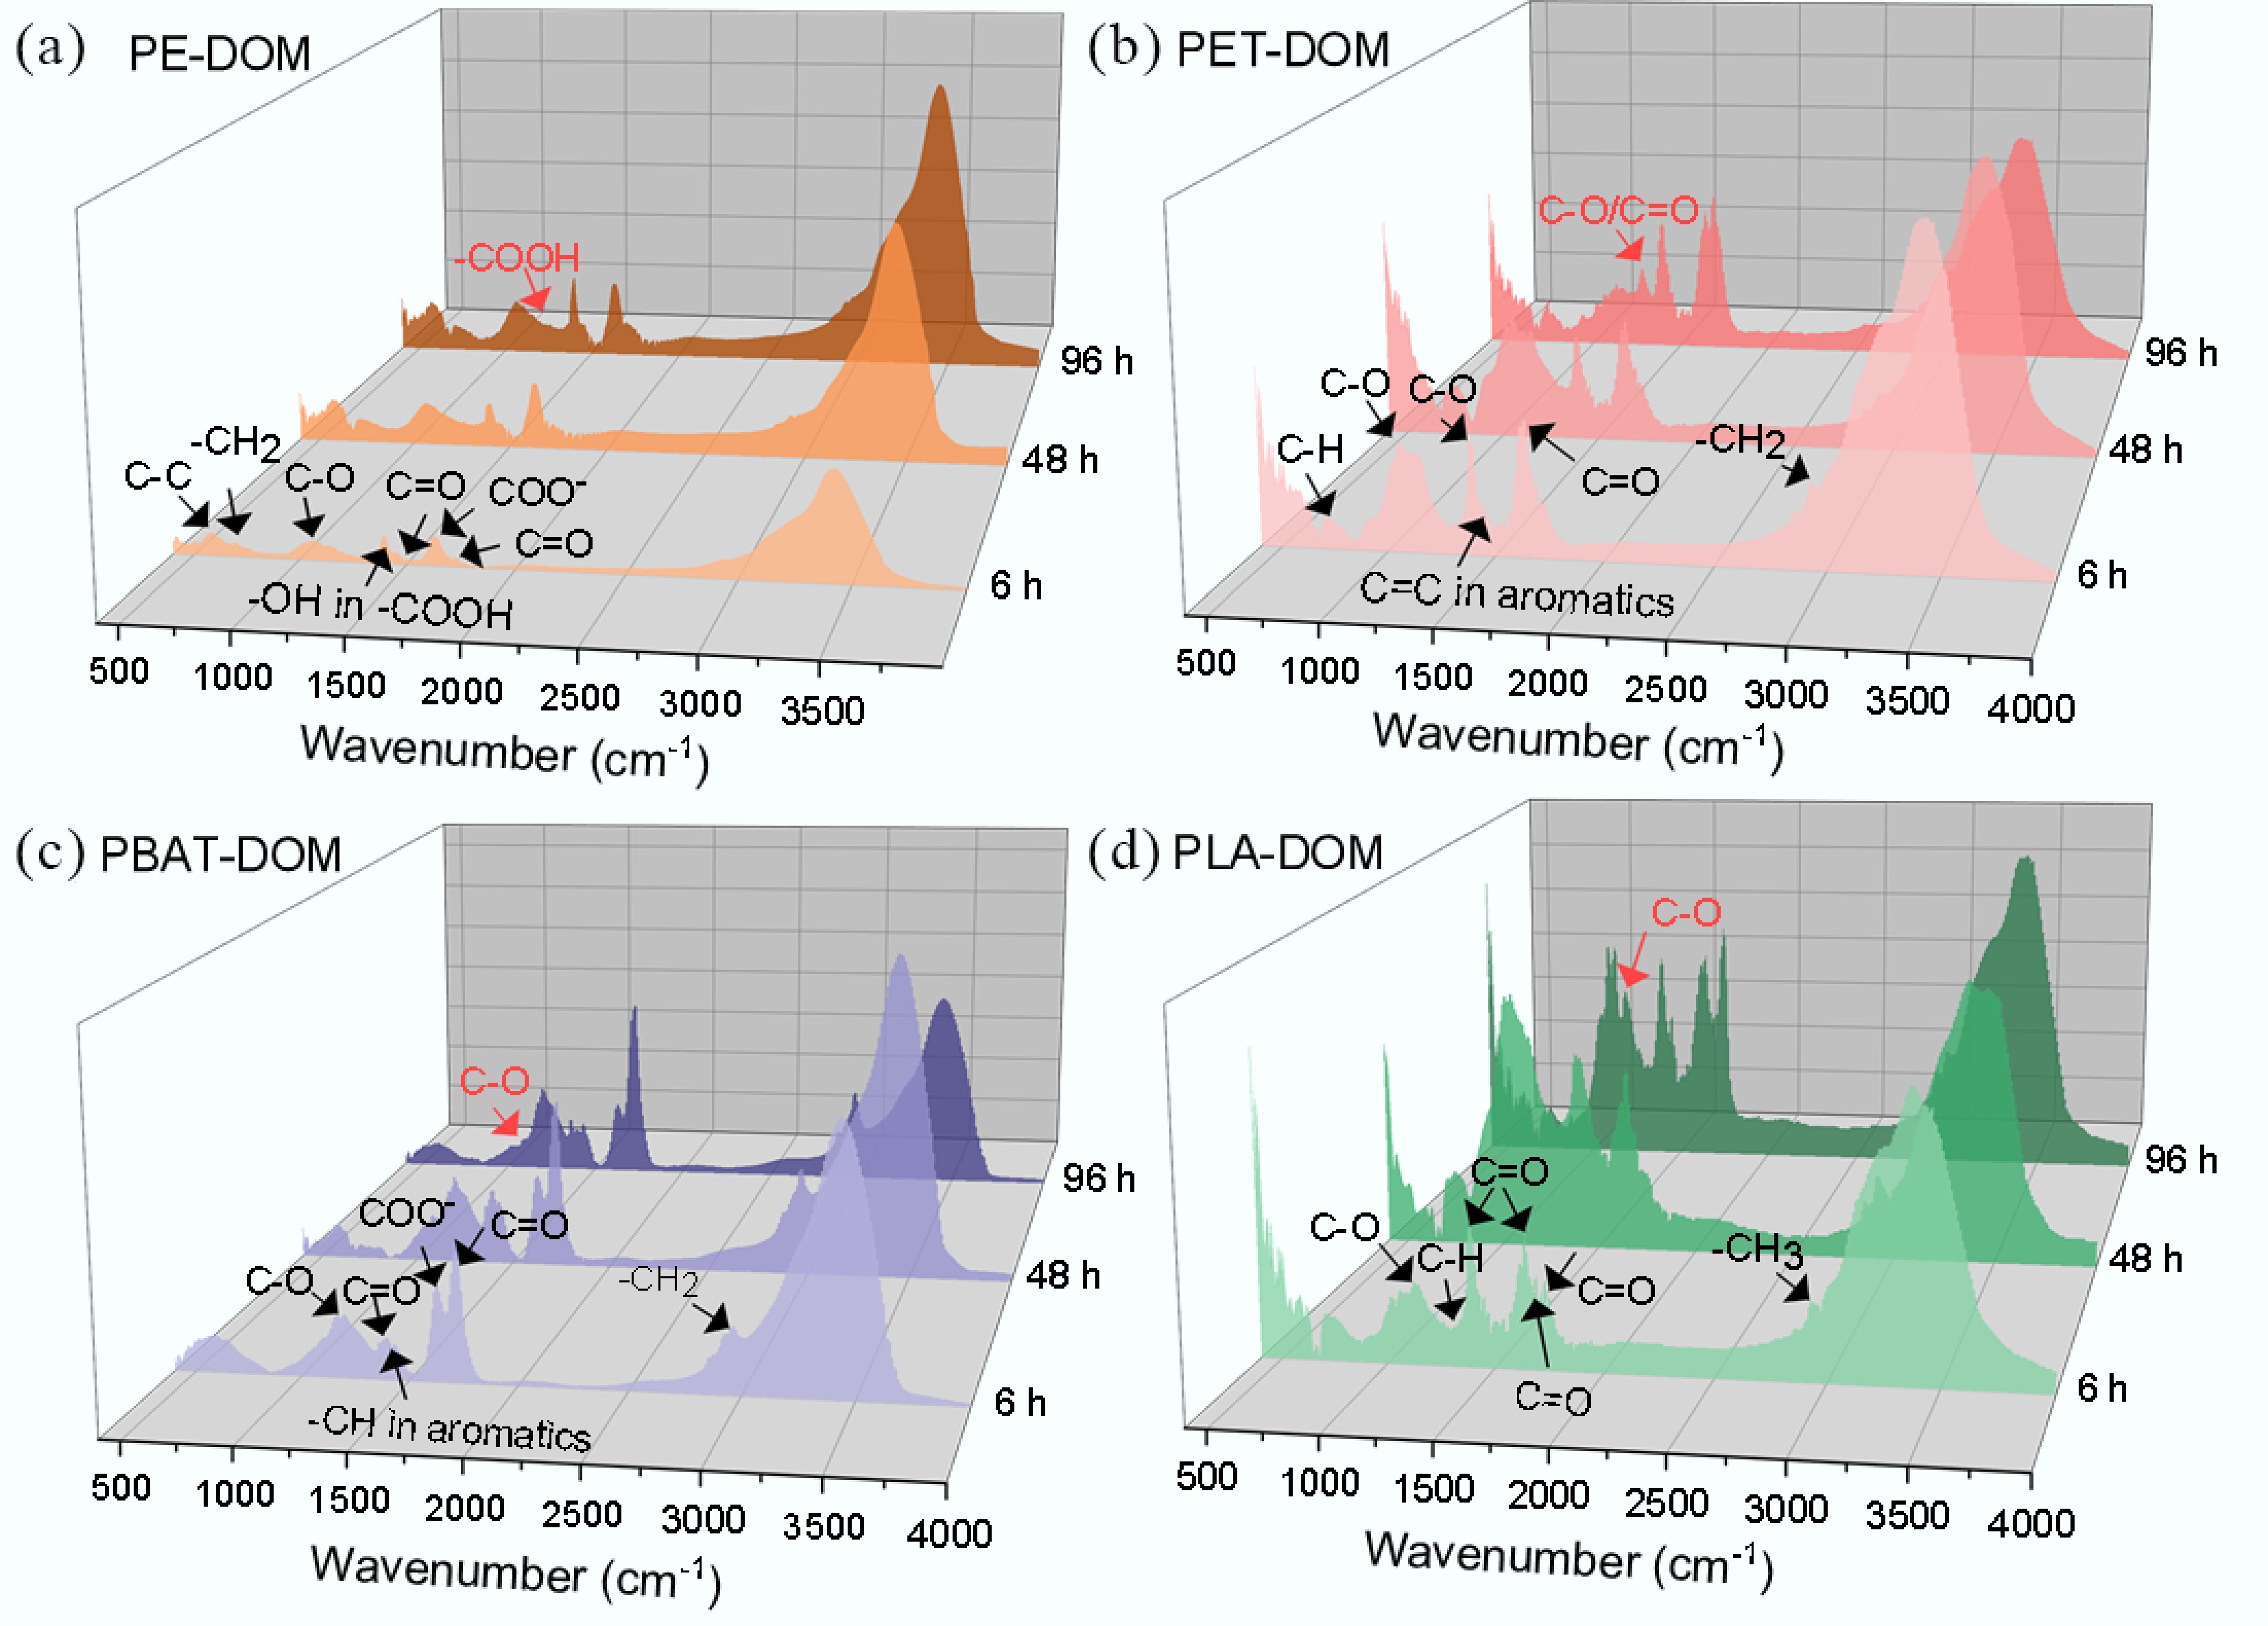
Figure 2.
FT-IR spectra of MPs-DOM during UV derivation. (a) PE-DOM; (b) PET-DOM; (c) PBAT-DOM; (d) PLA-DOM.
-
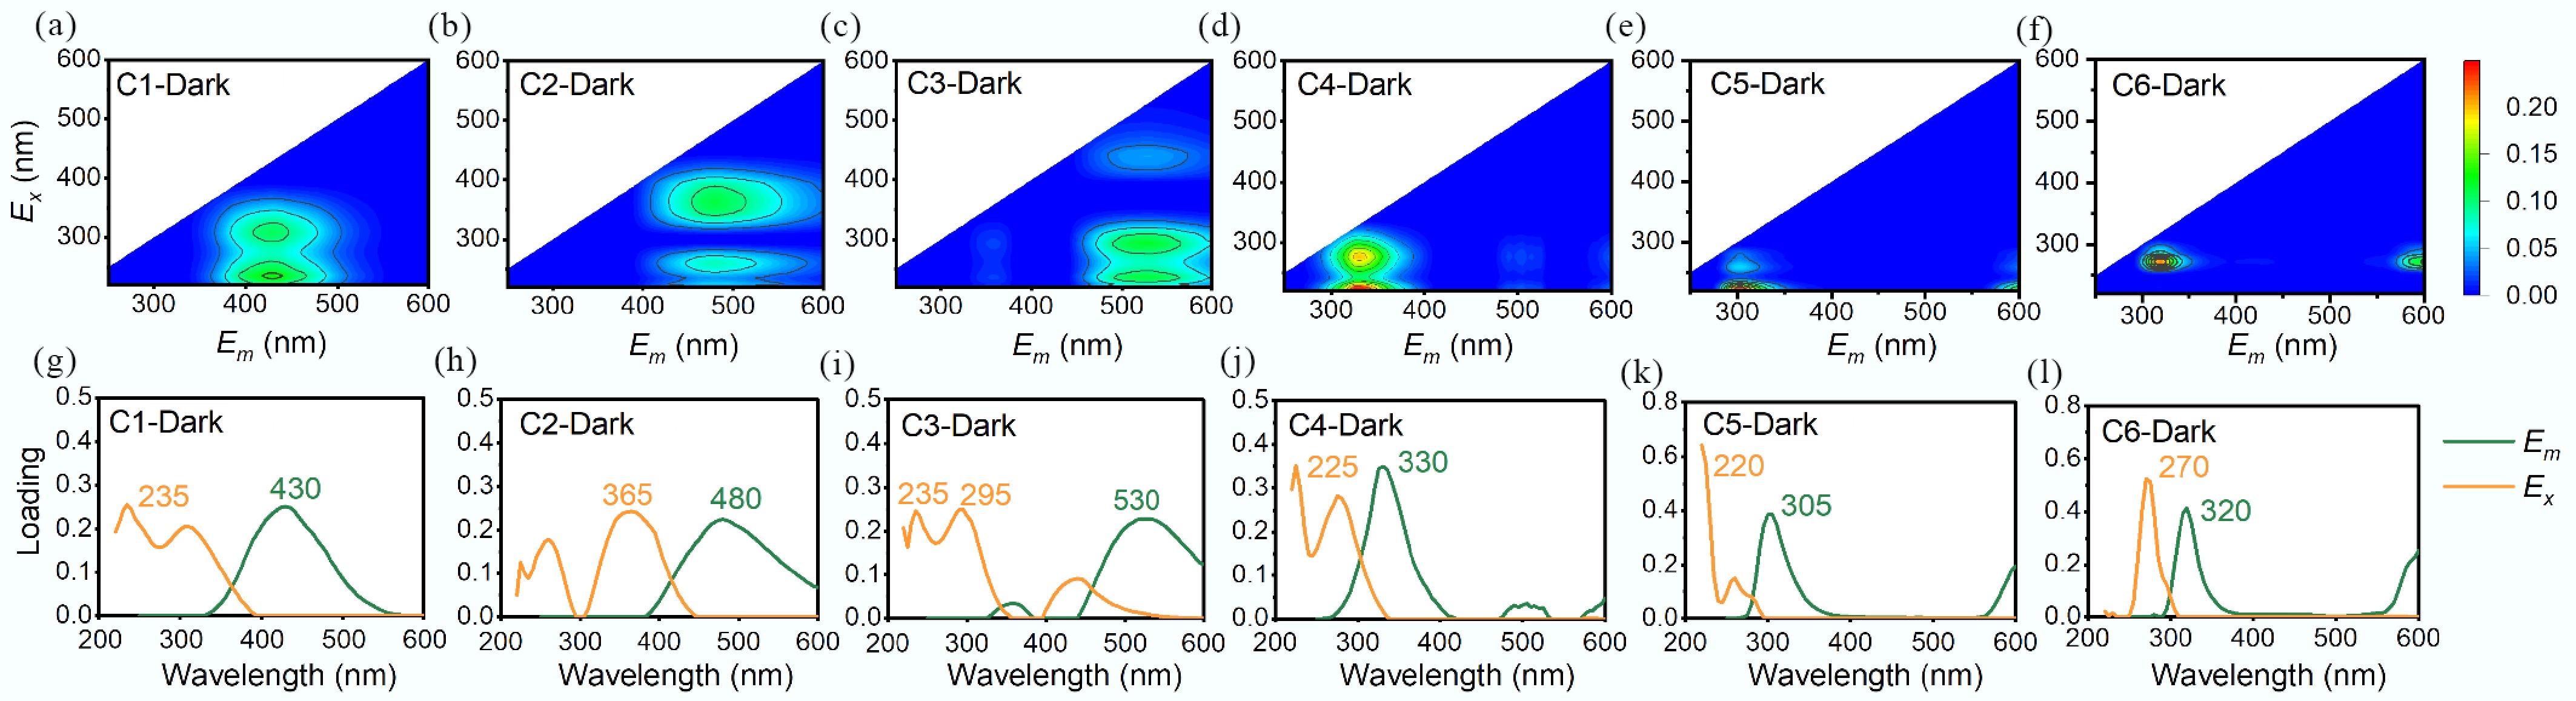
Figure 3.
EEM-PARAFAC contour plots and loadings of excitation and emission wavelengths of MPs-DOM and N-DOM derived in the dark condition.
-
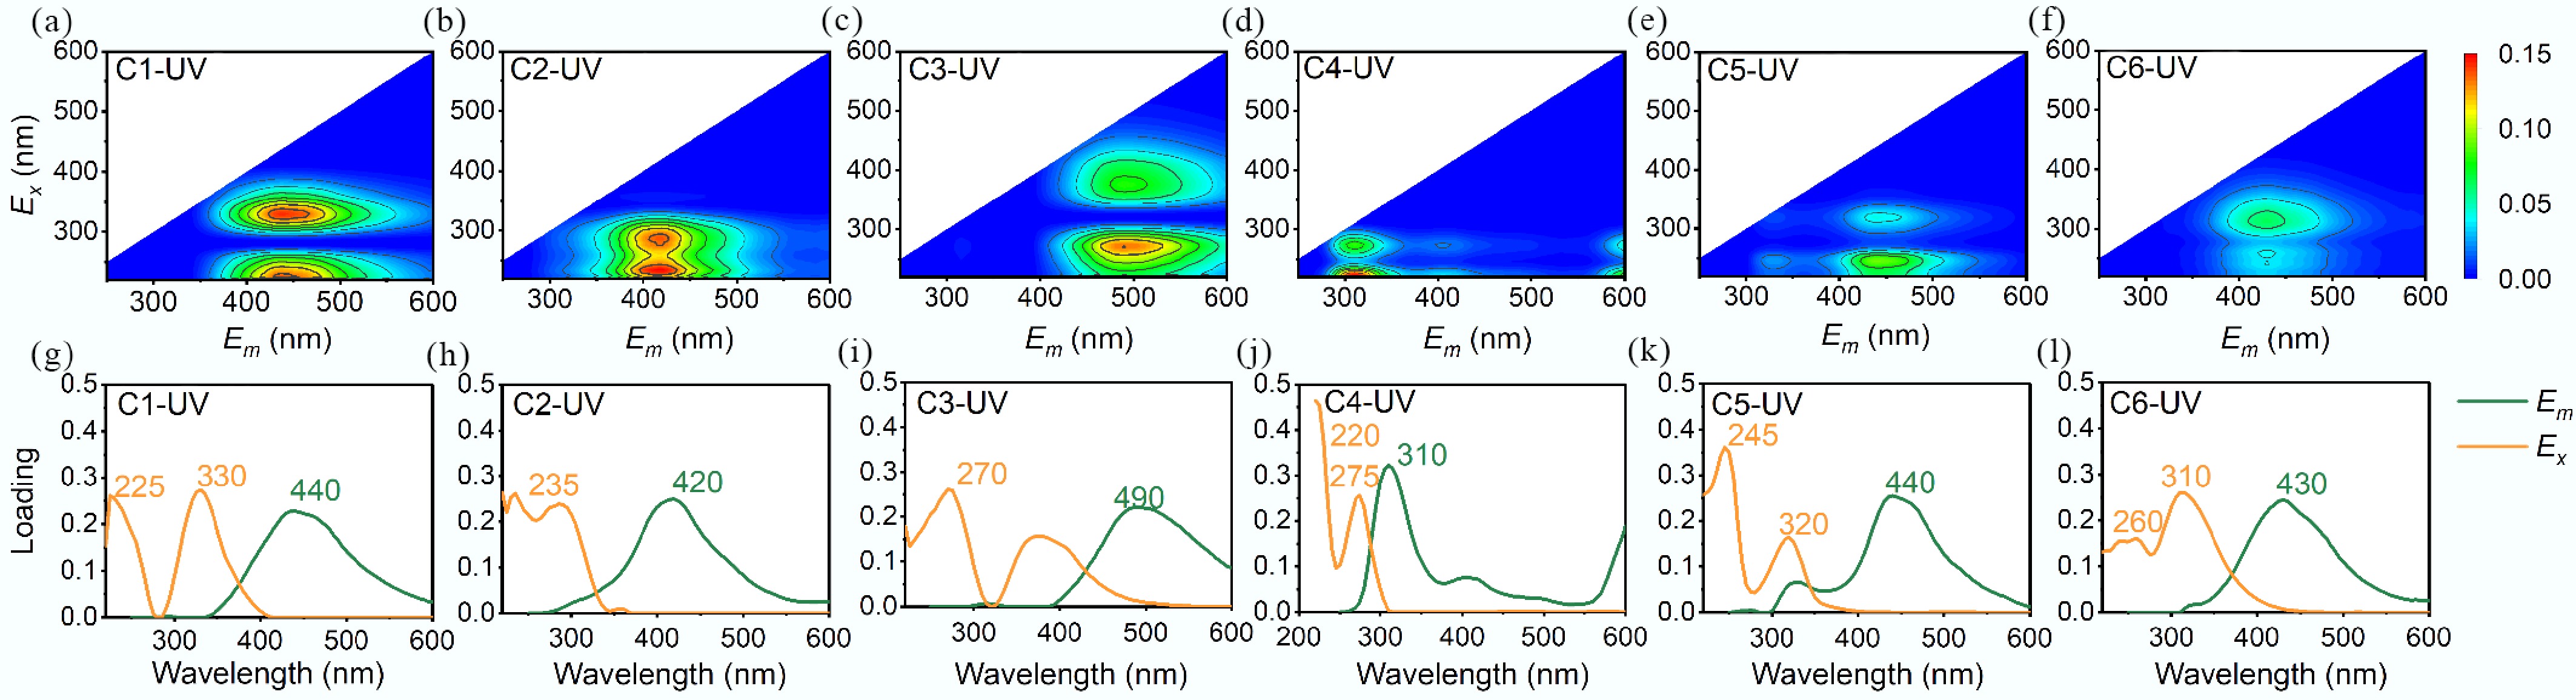
Figure 4.
EEM-PARAFAC contour plots and loadings of excitation and emission wavelengths of MPs-DOM and N-DOM derived under UV irradiation.
-
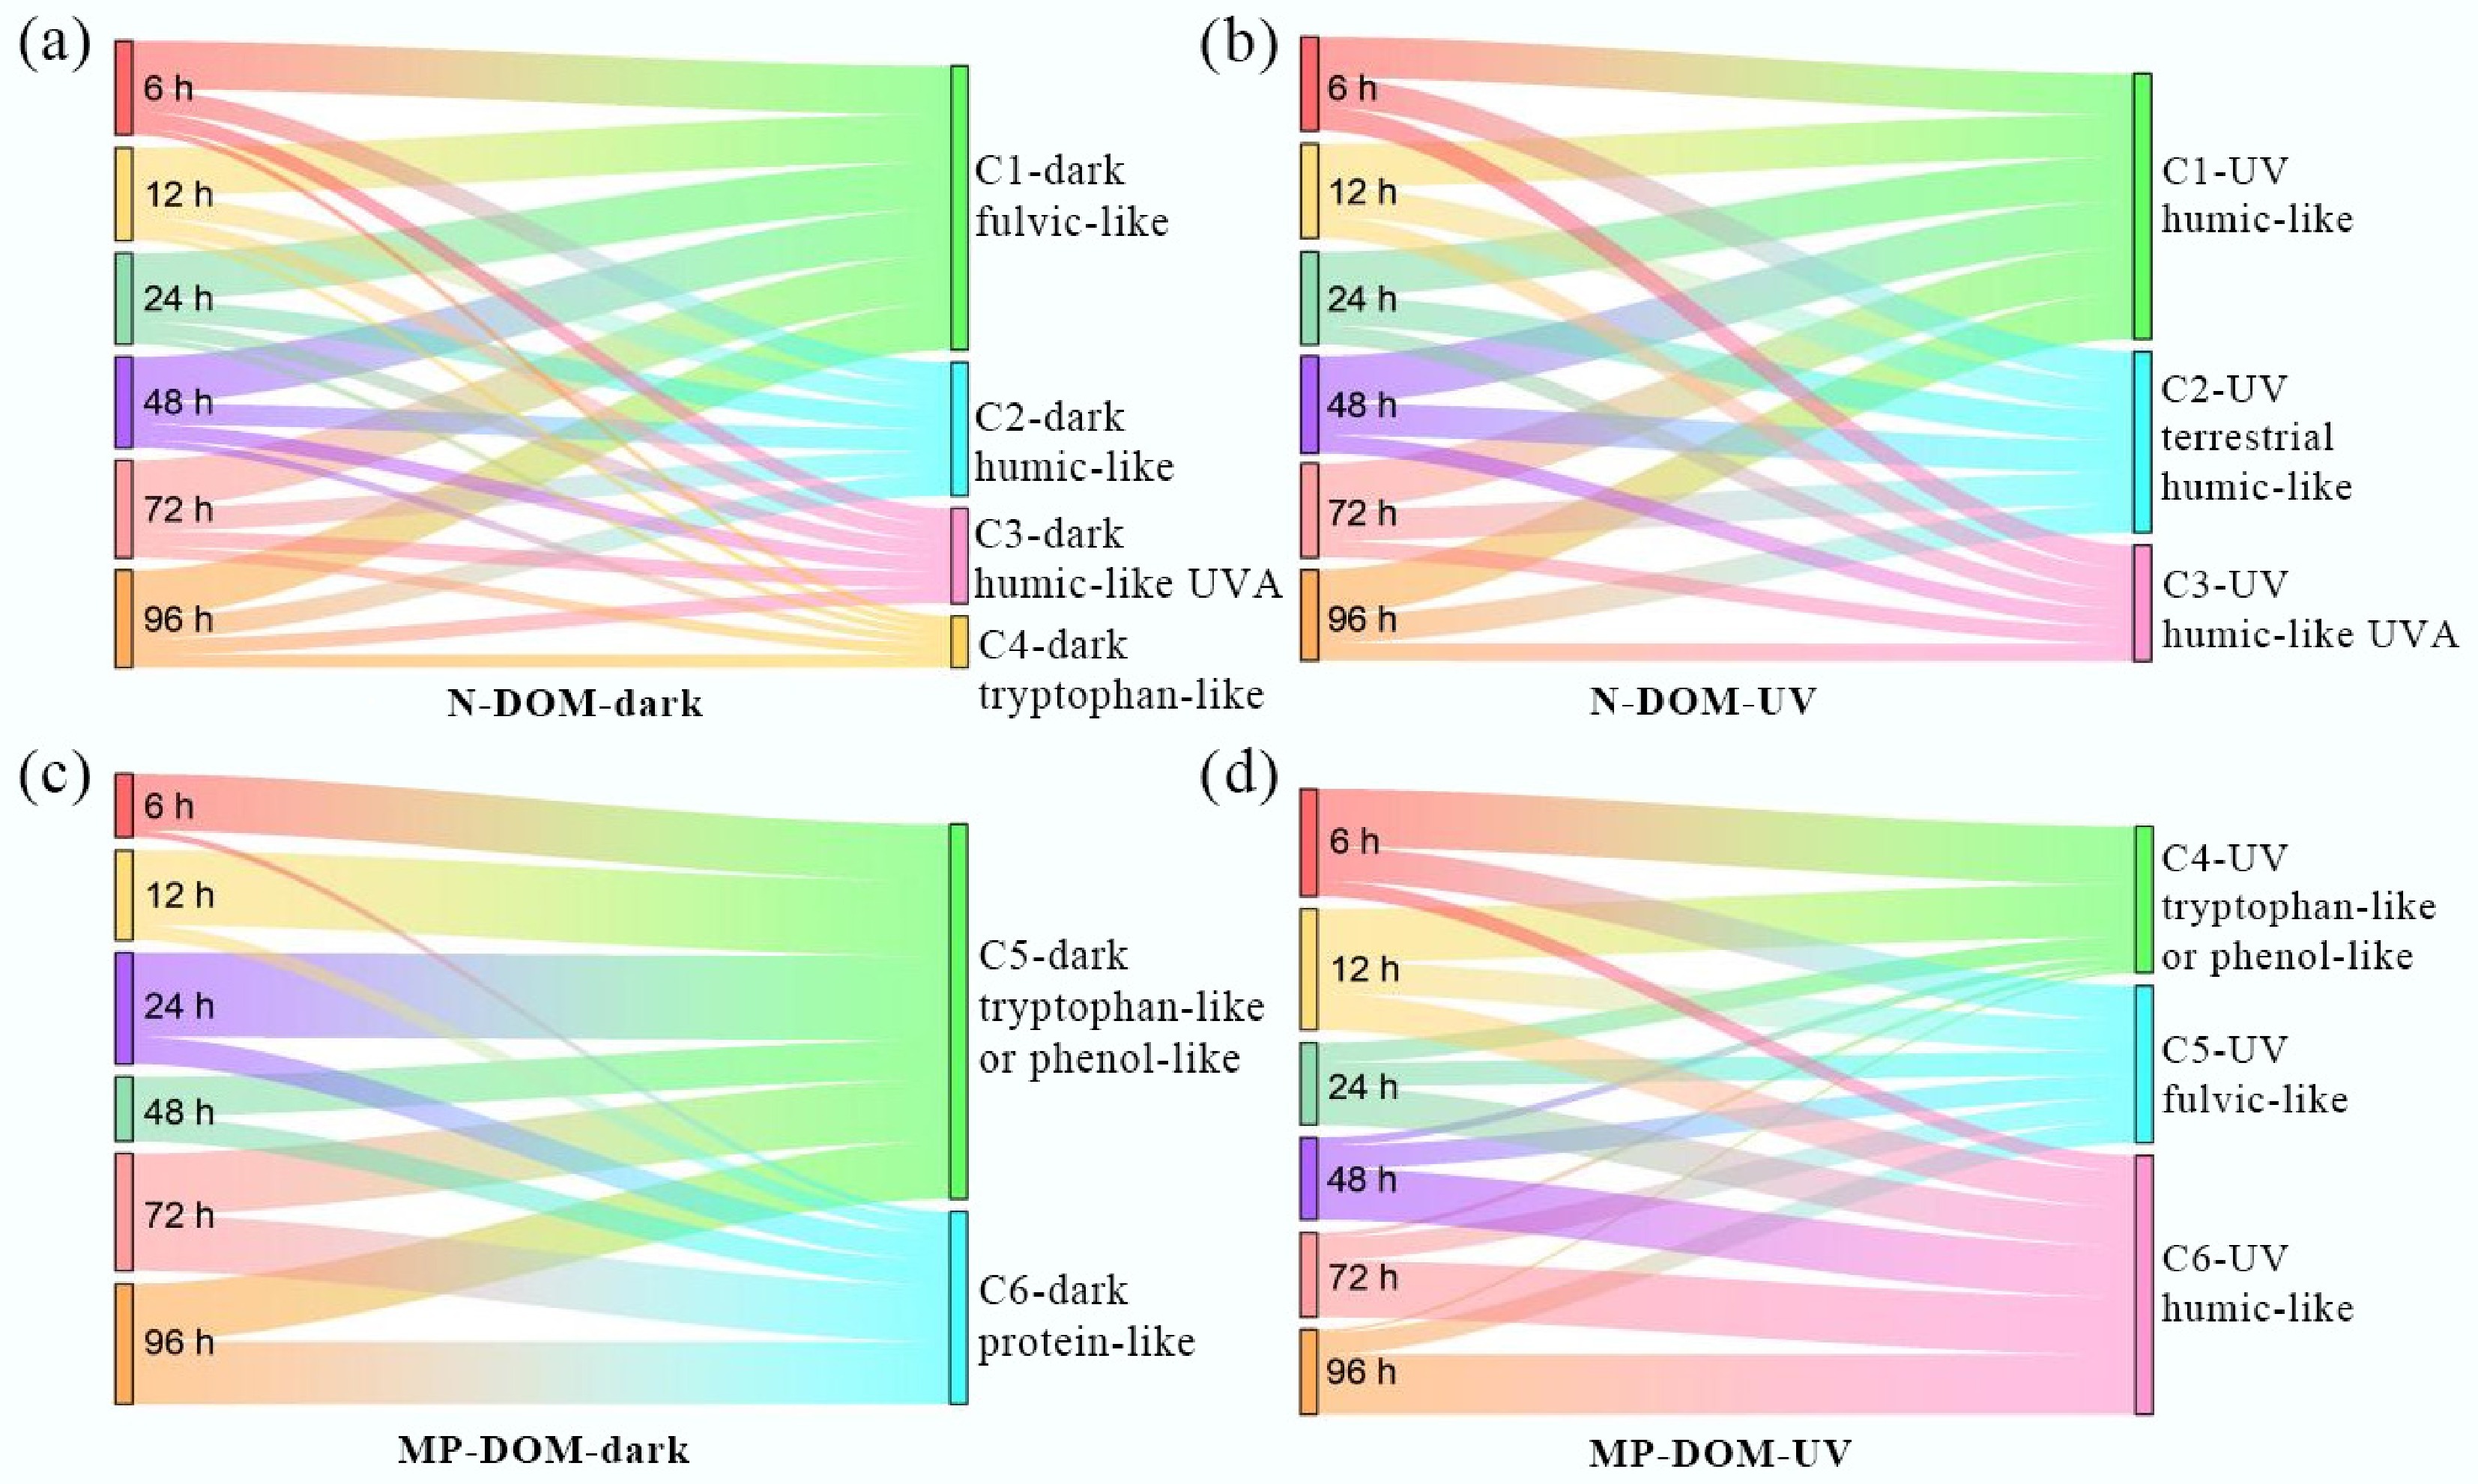
Figure 5.
Relative proportions of Fmax of each component during the derivation process. (a) N-DOM in dark; (b) N-DOM under UV irradiation; (c) MPs-DOM in dark; (d) MPs-DOM under UV irradiation.
-
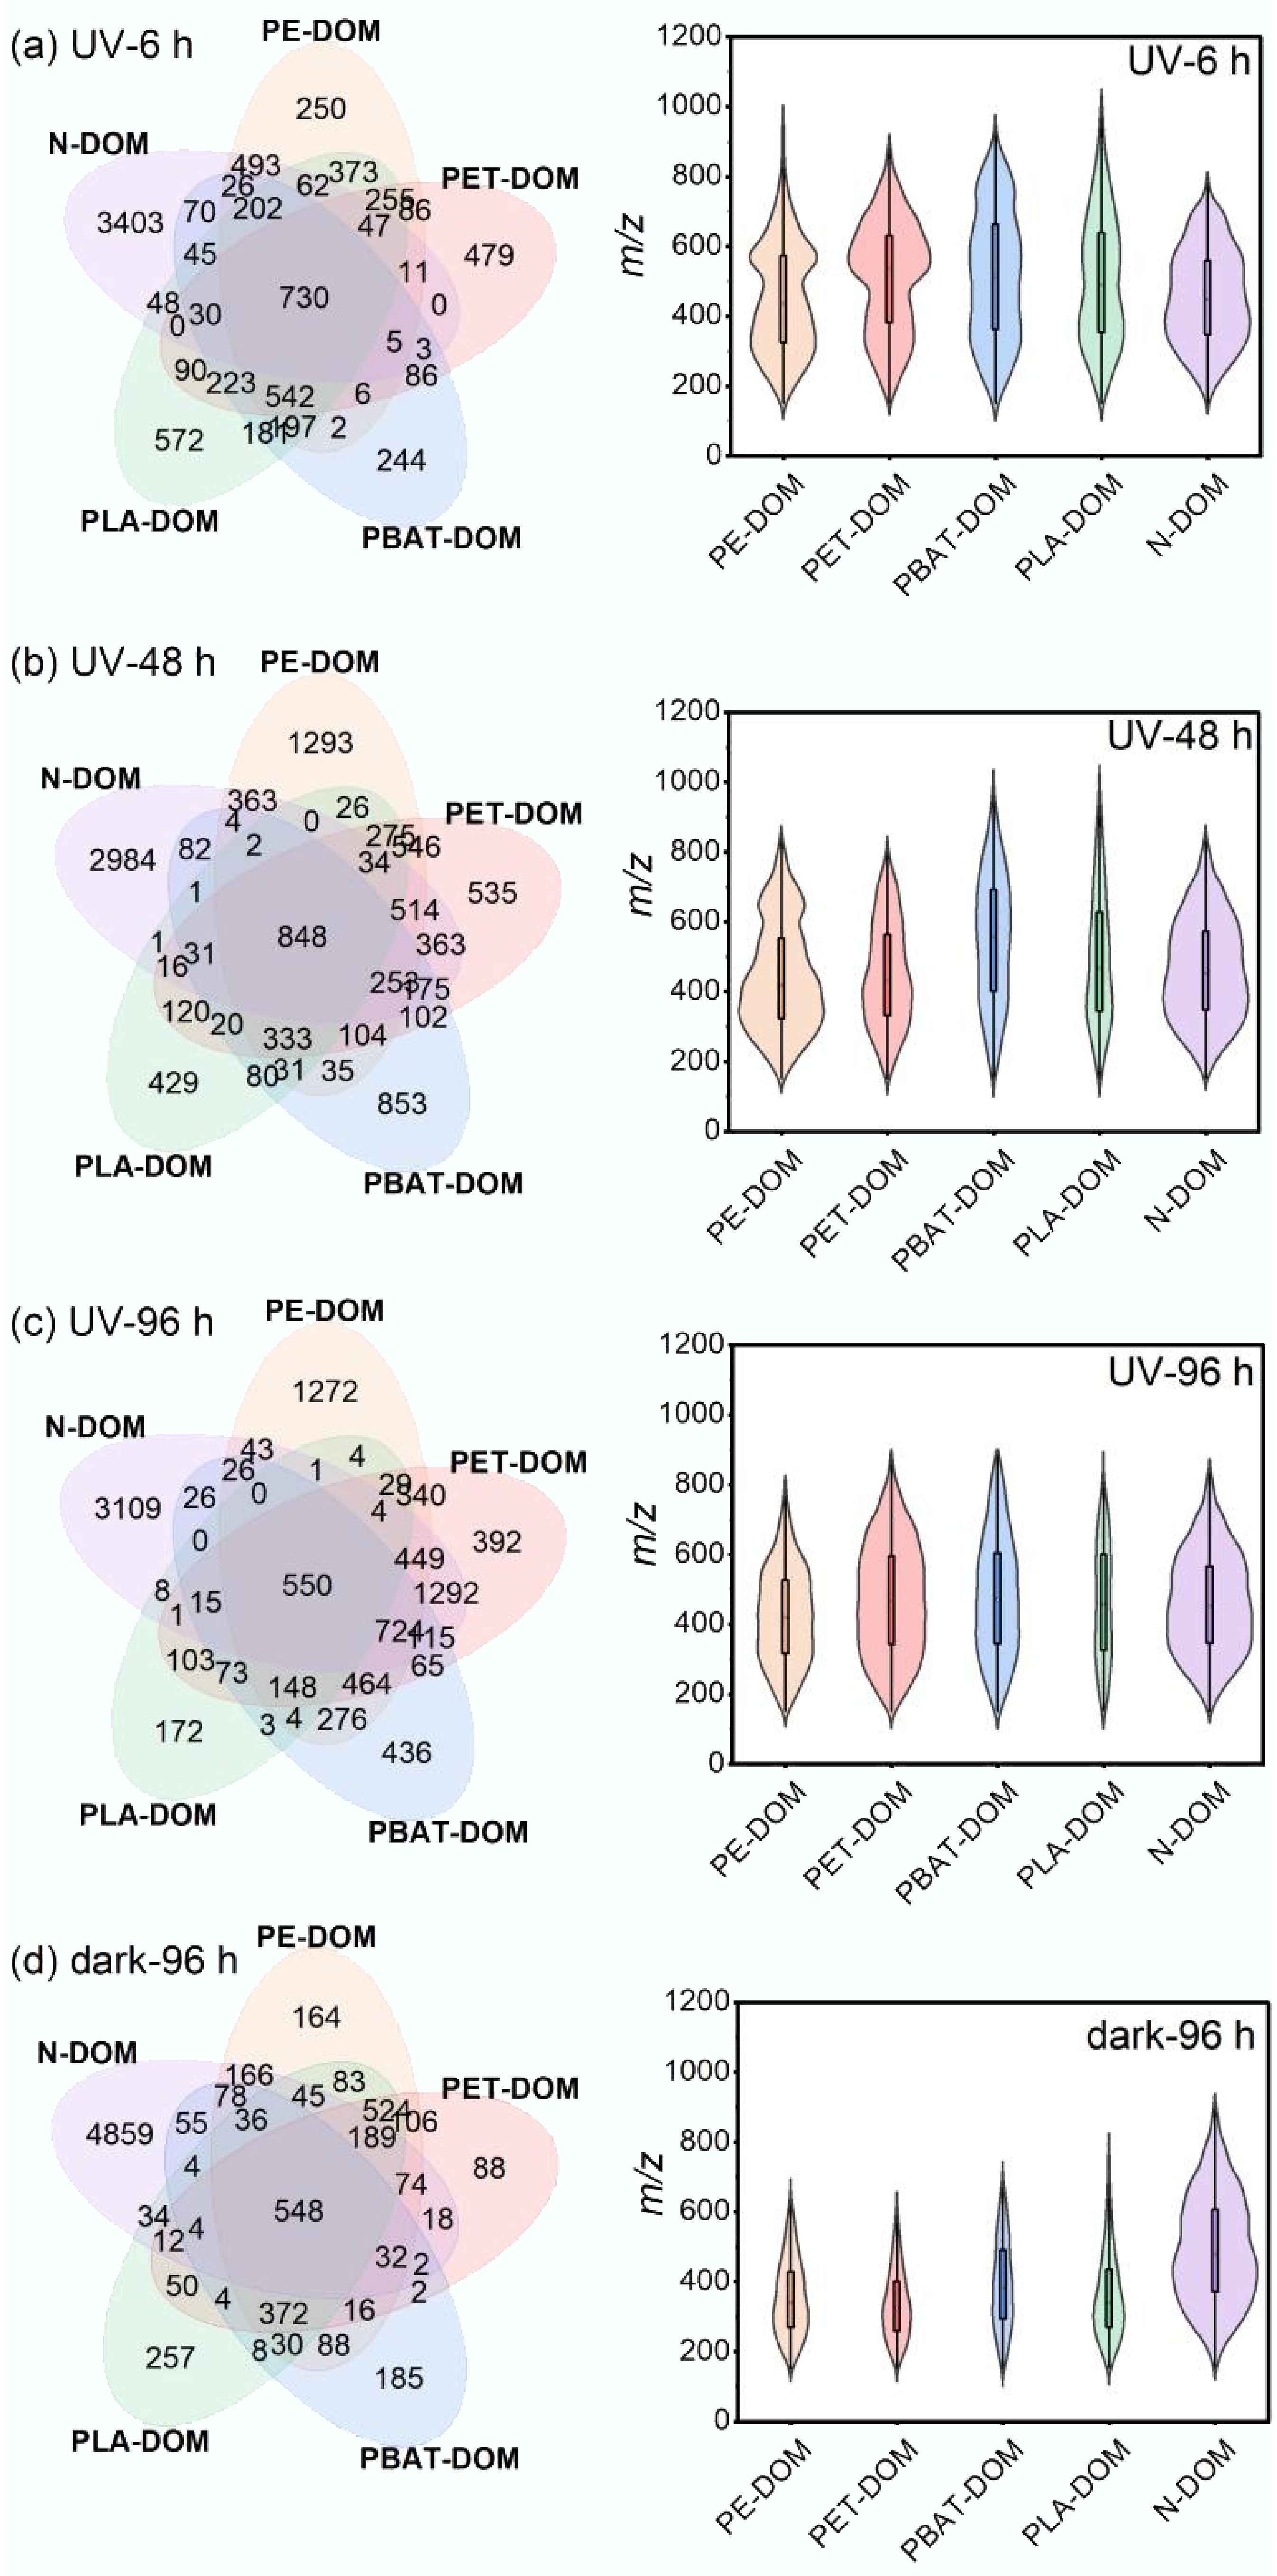
Figure 6.
Venn diagrams of molecular formulas and distribution of m/z values during UV derivation. (a) 6 h under UV irradiation; (b) 48 h under UV irradiation; (c) 96 h under UV irradiation; (d) 96 h in dark.
-
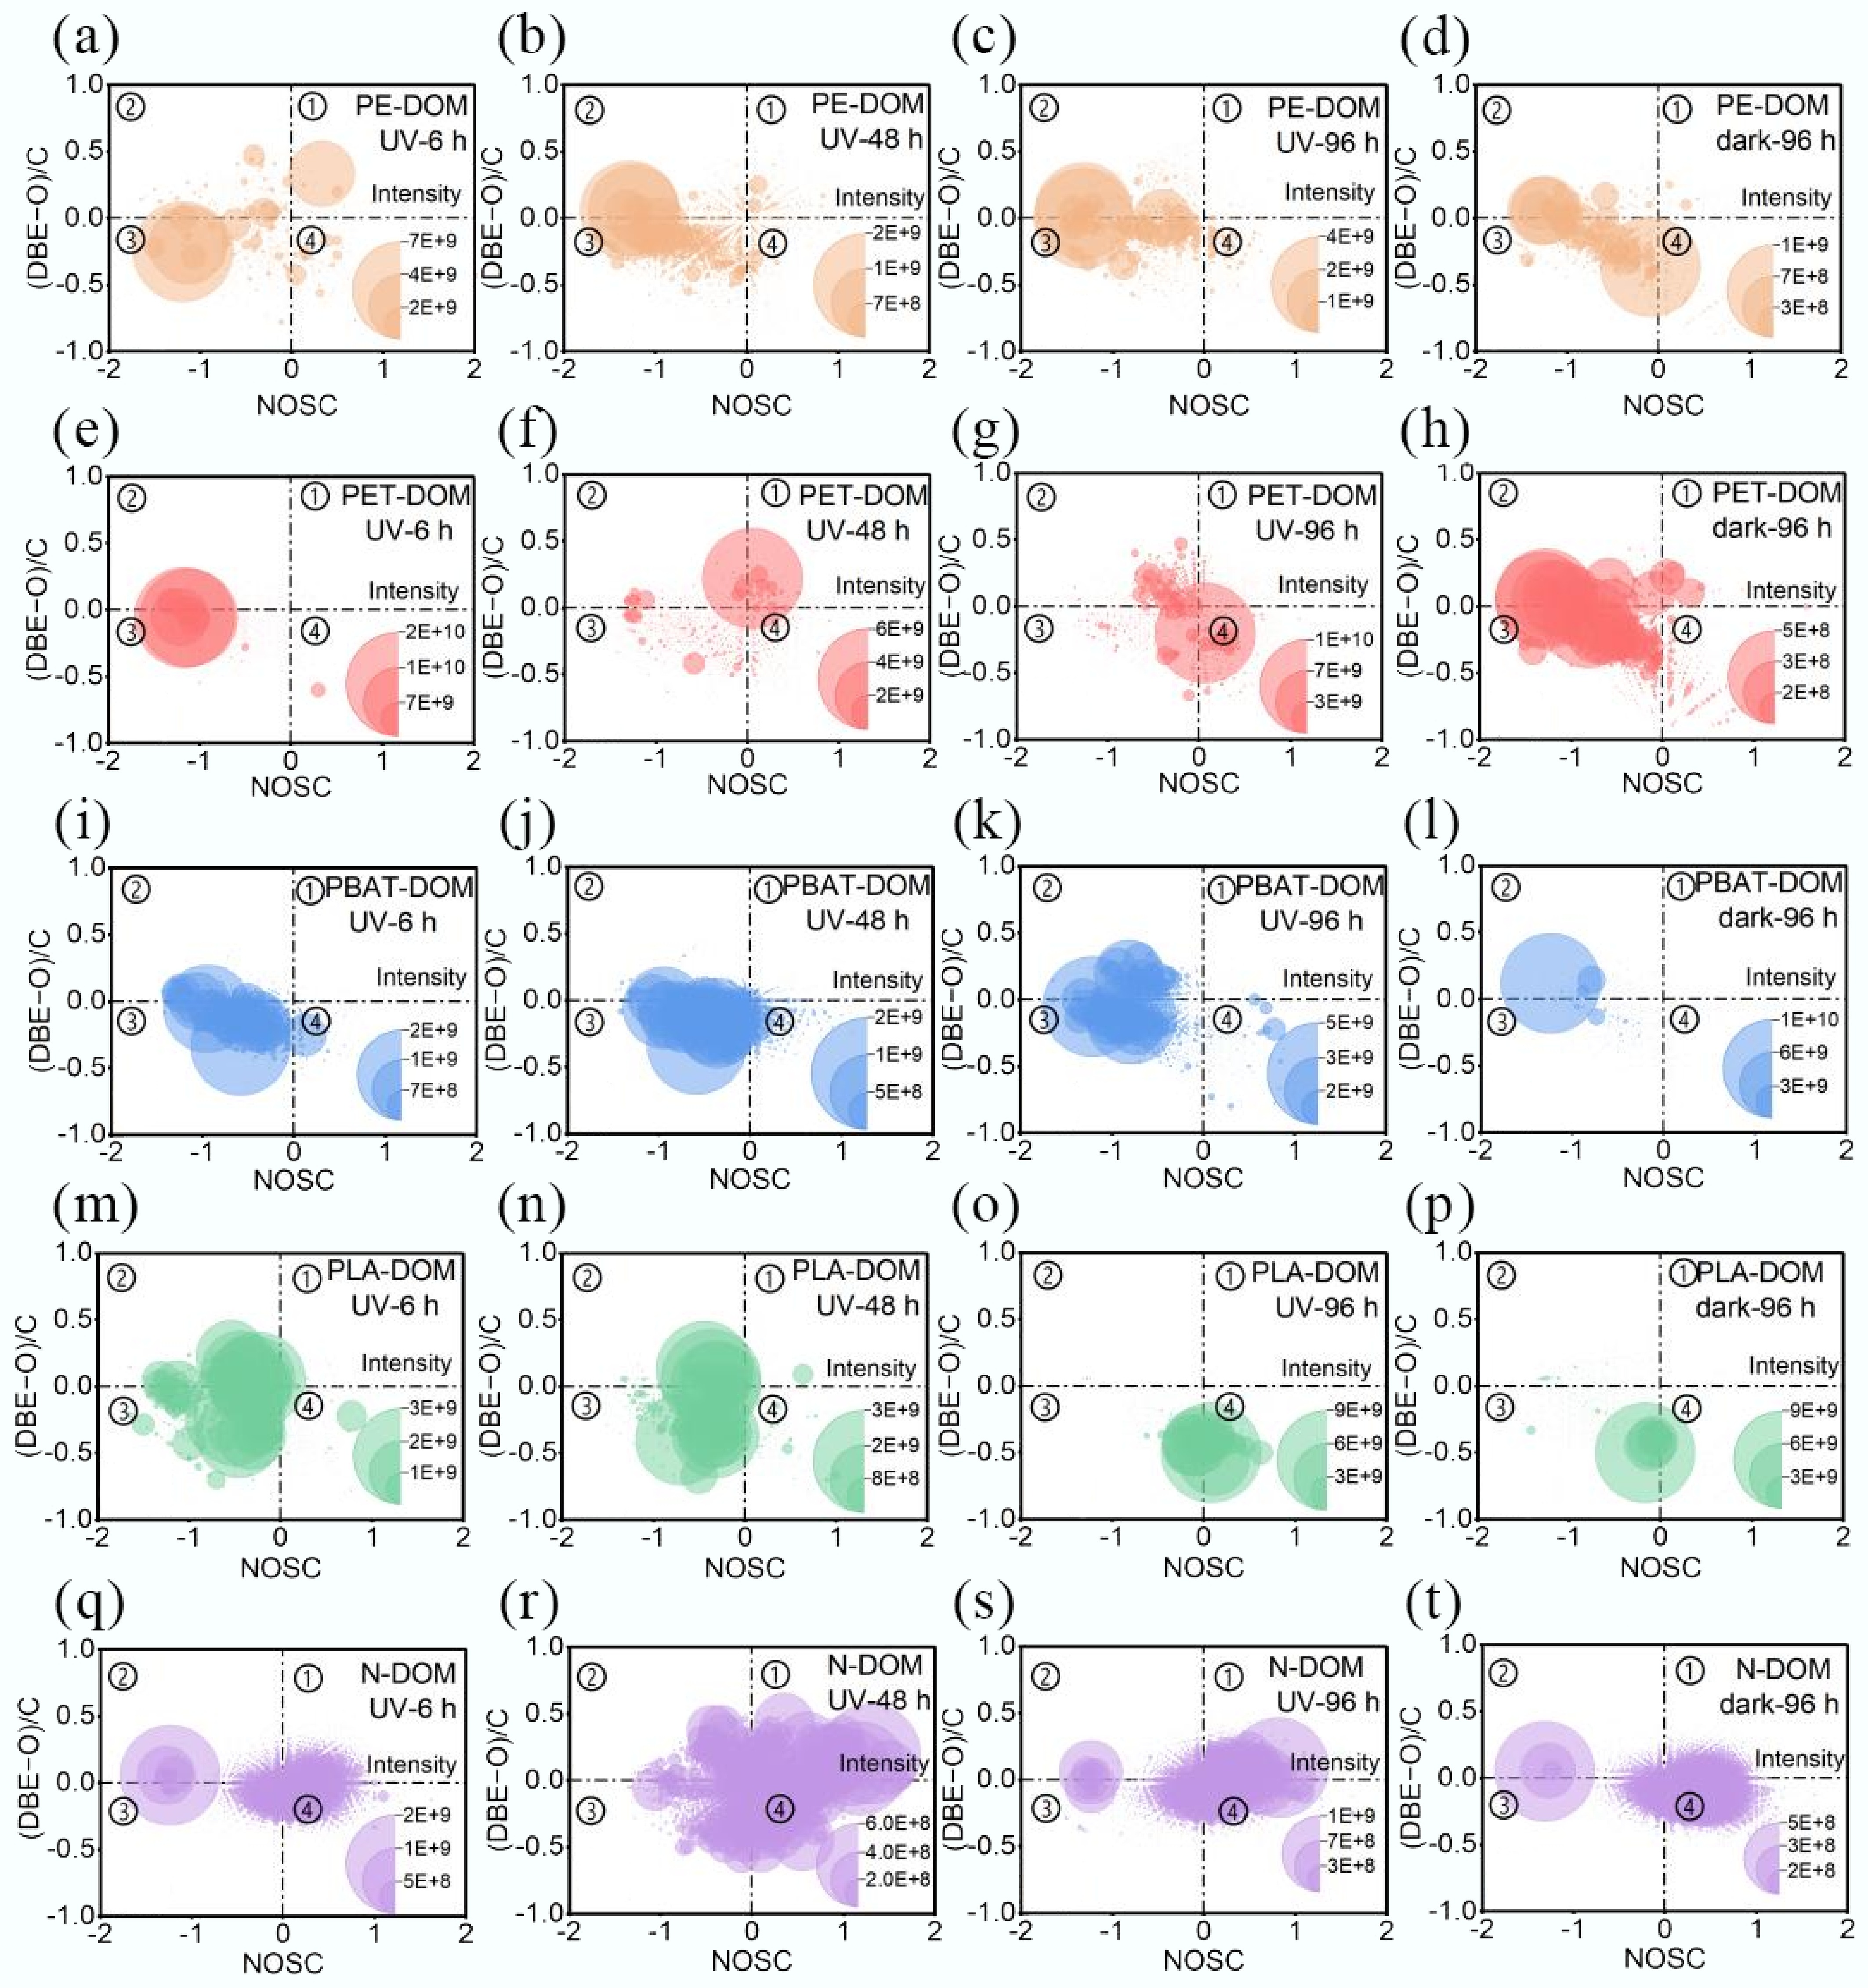
Figure 7.
(DBE-O)/-C vs NOSCwa plots of MPs-DOM and N-DOM.
-
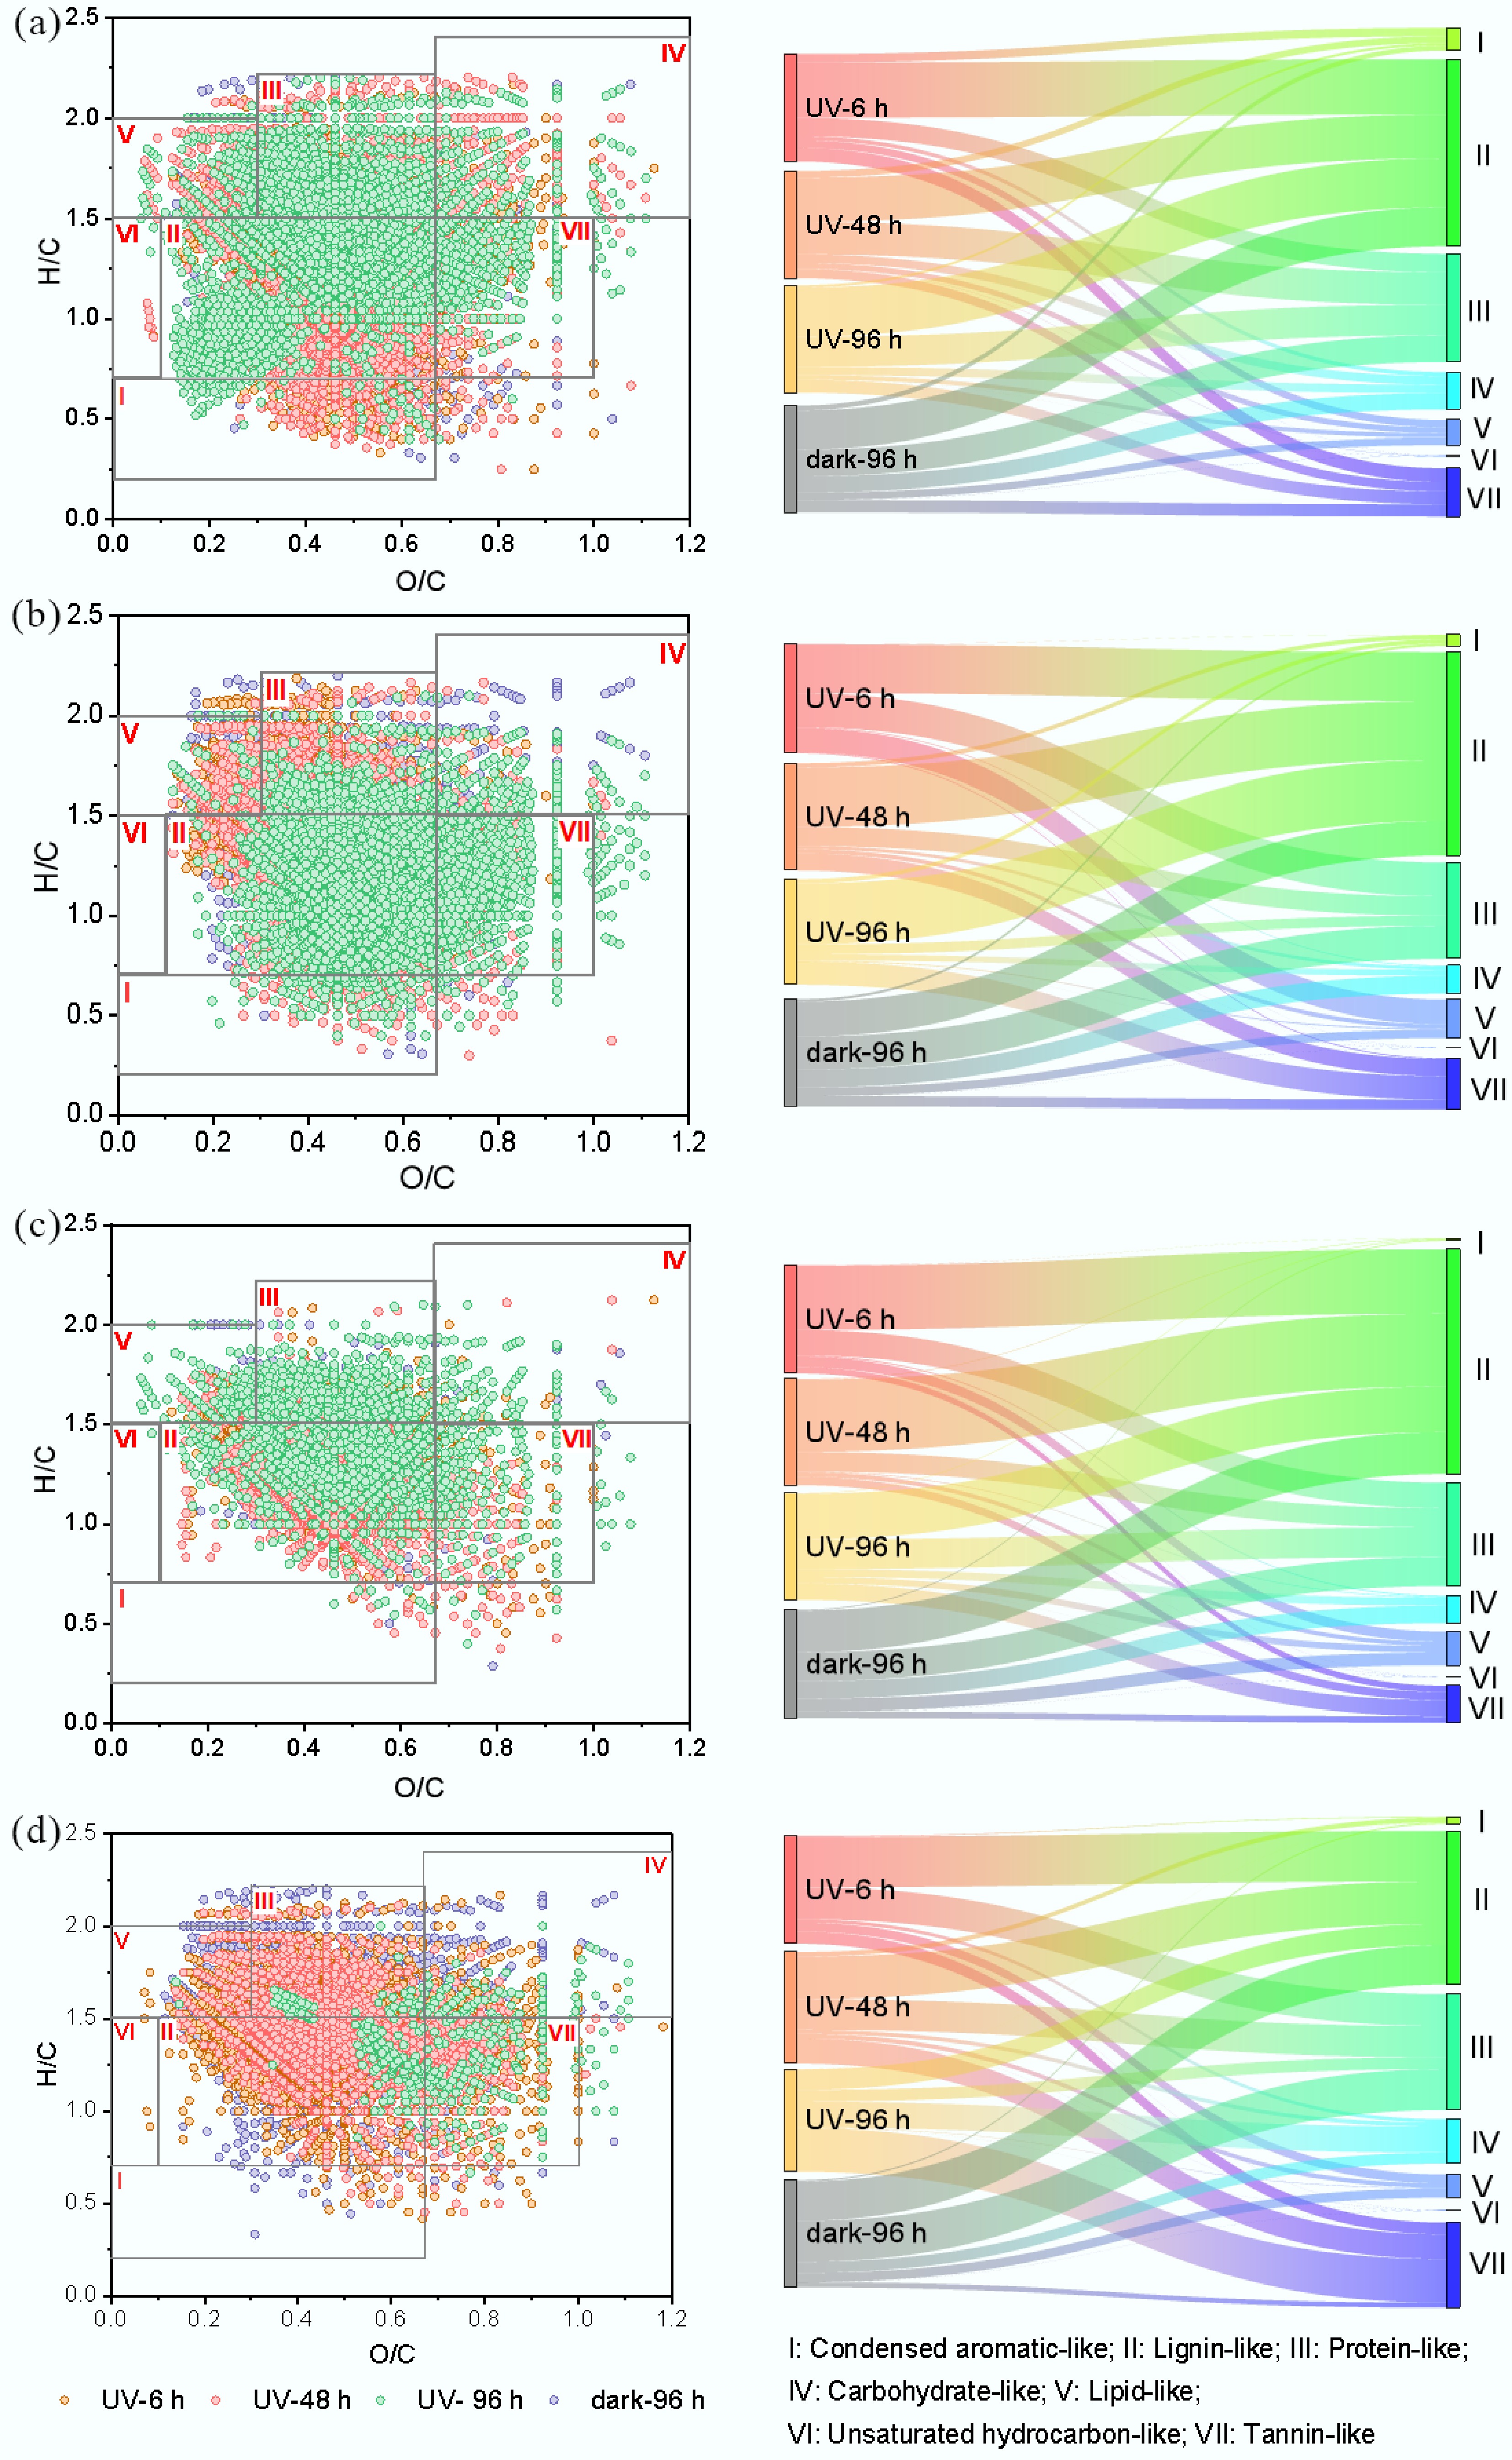
Figure 8.
VK diagram and distribution of typical compounds during UV derivation process. (a) PE-DOM; (b) PET-DOM; (c) PBAT-DOM; (d) PLA-DOM.
Figures
(8)
Tables
(0)