-
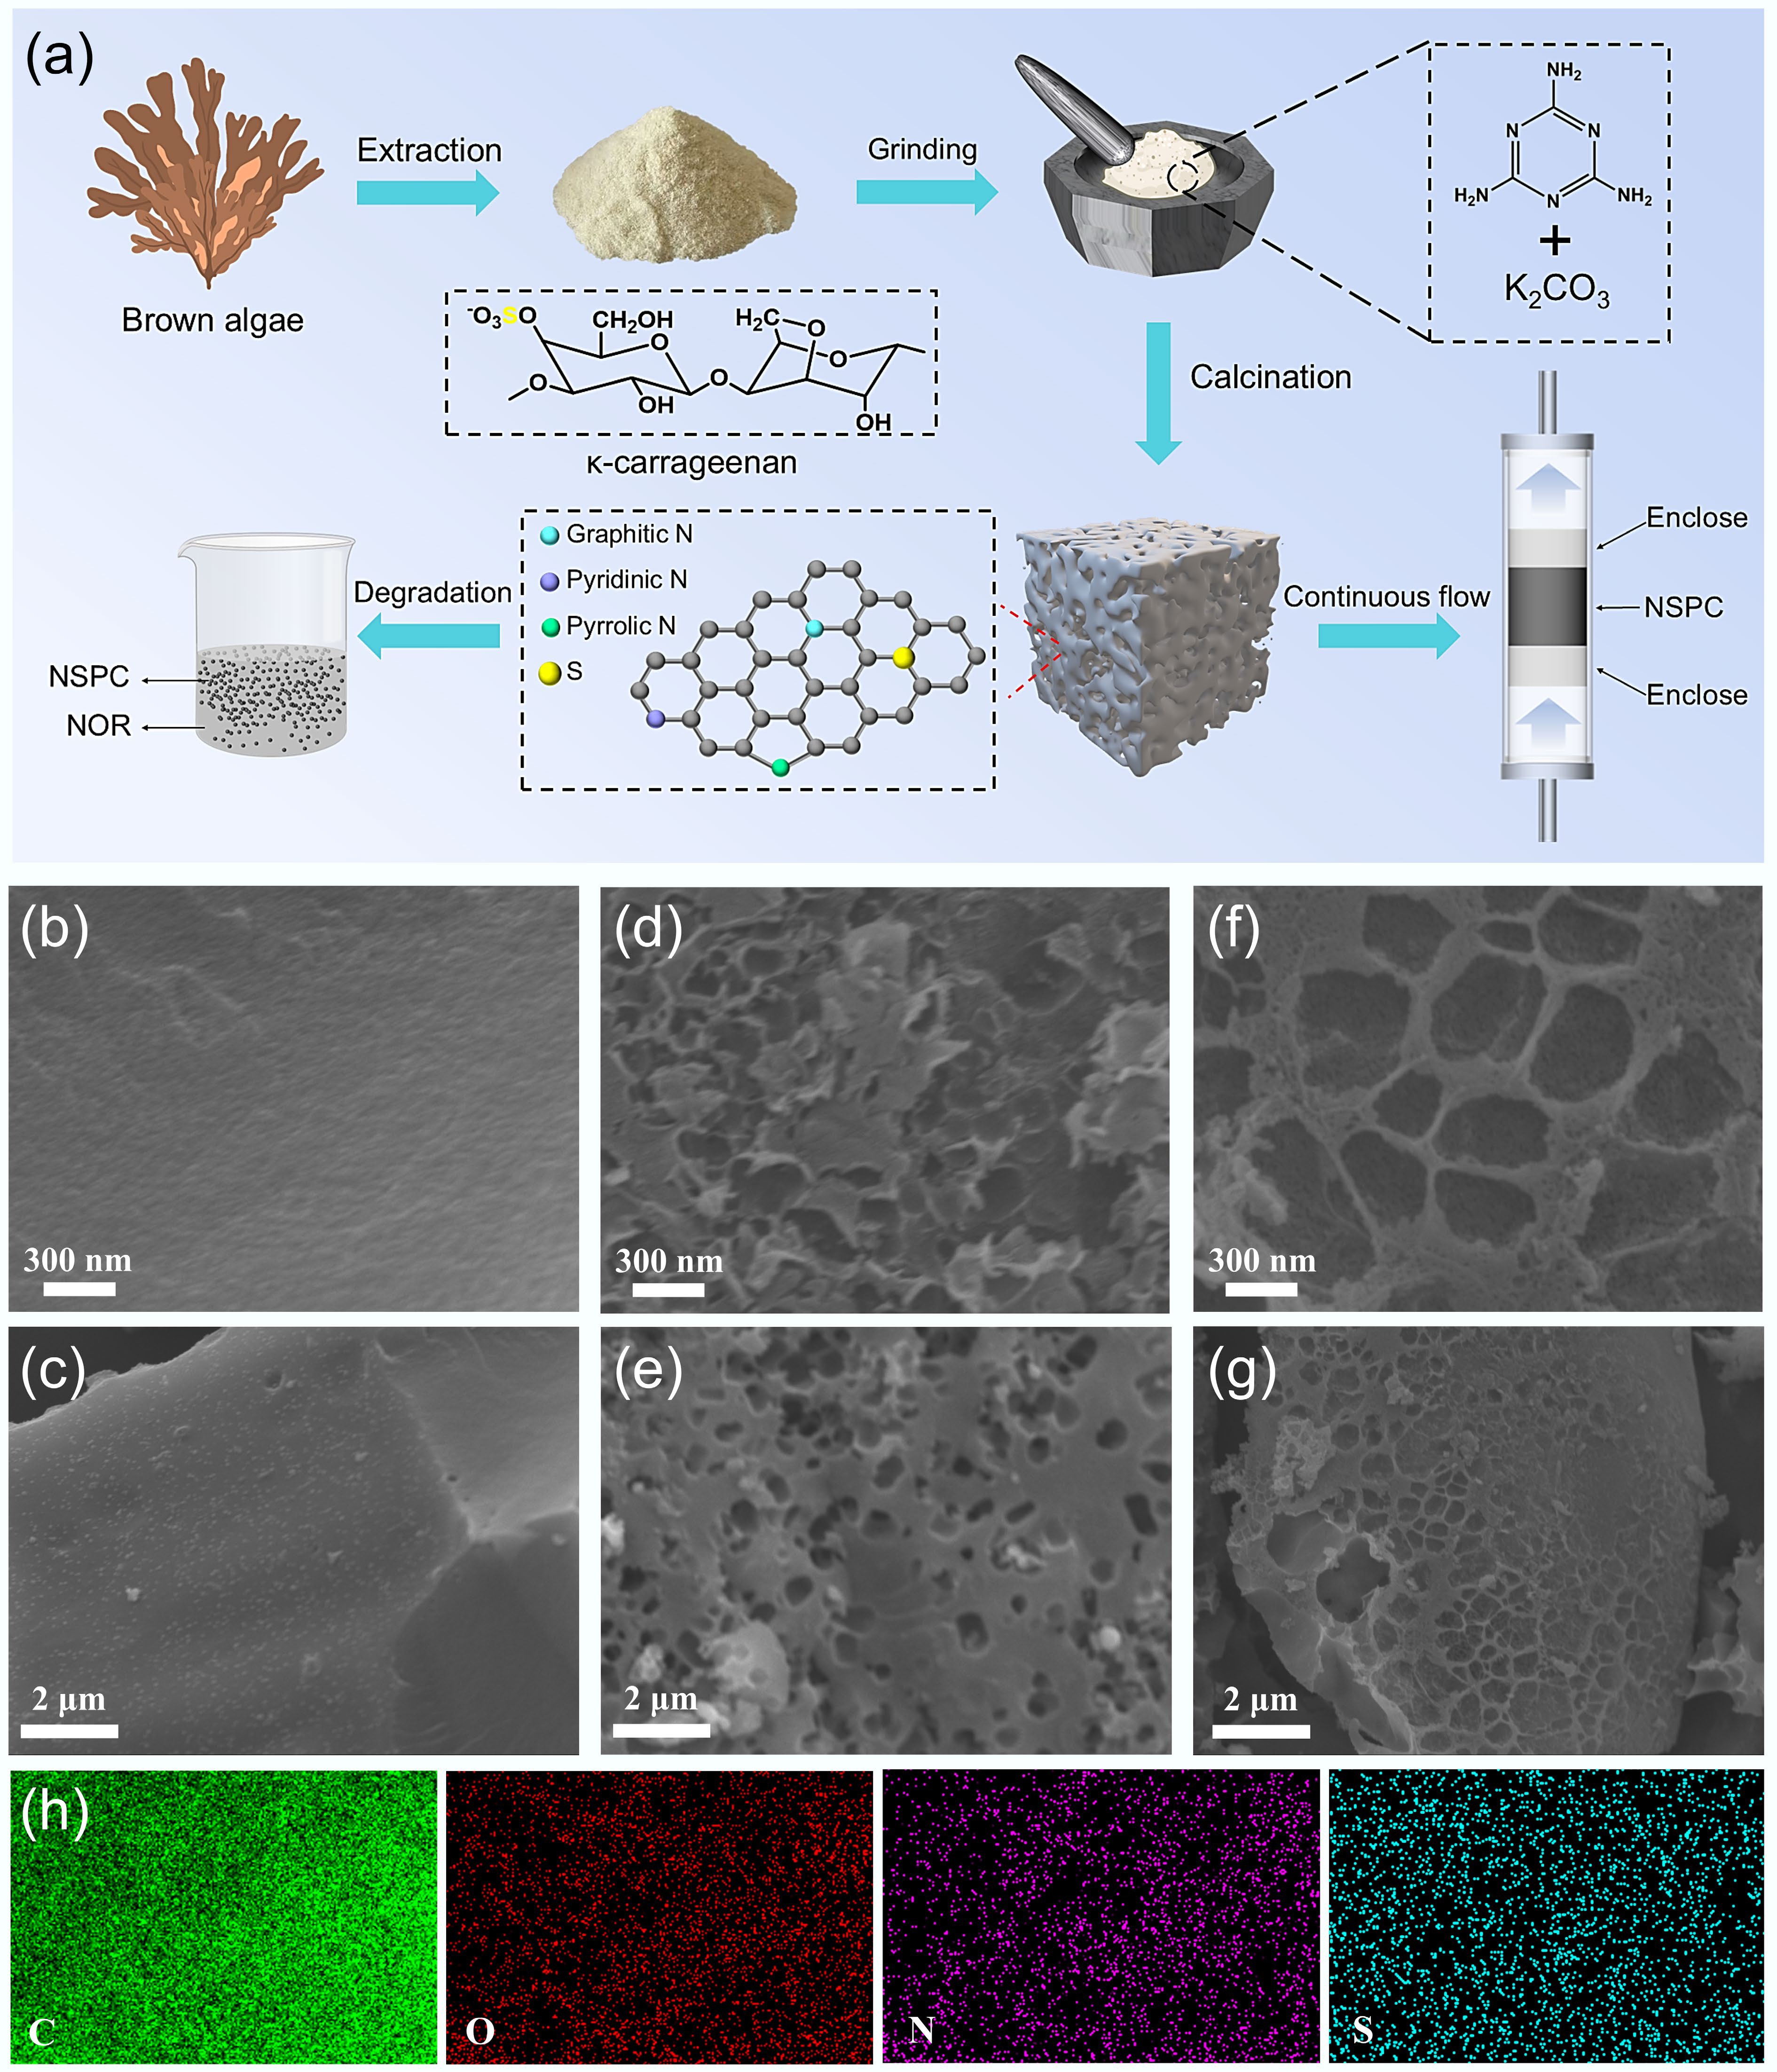
Figure 1.
(a) Schematic diagram of NSPC preparation. (b), (c) SEM images of SC-700. (d), (e) SPC-700. (f), (g) NSPC-700. (h) EDS mapping images of C, N, and O in NSPC-700.
-
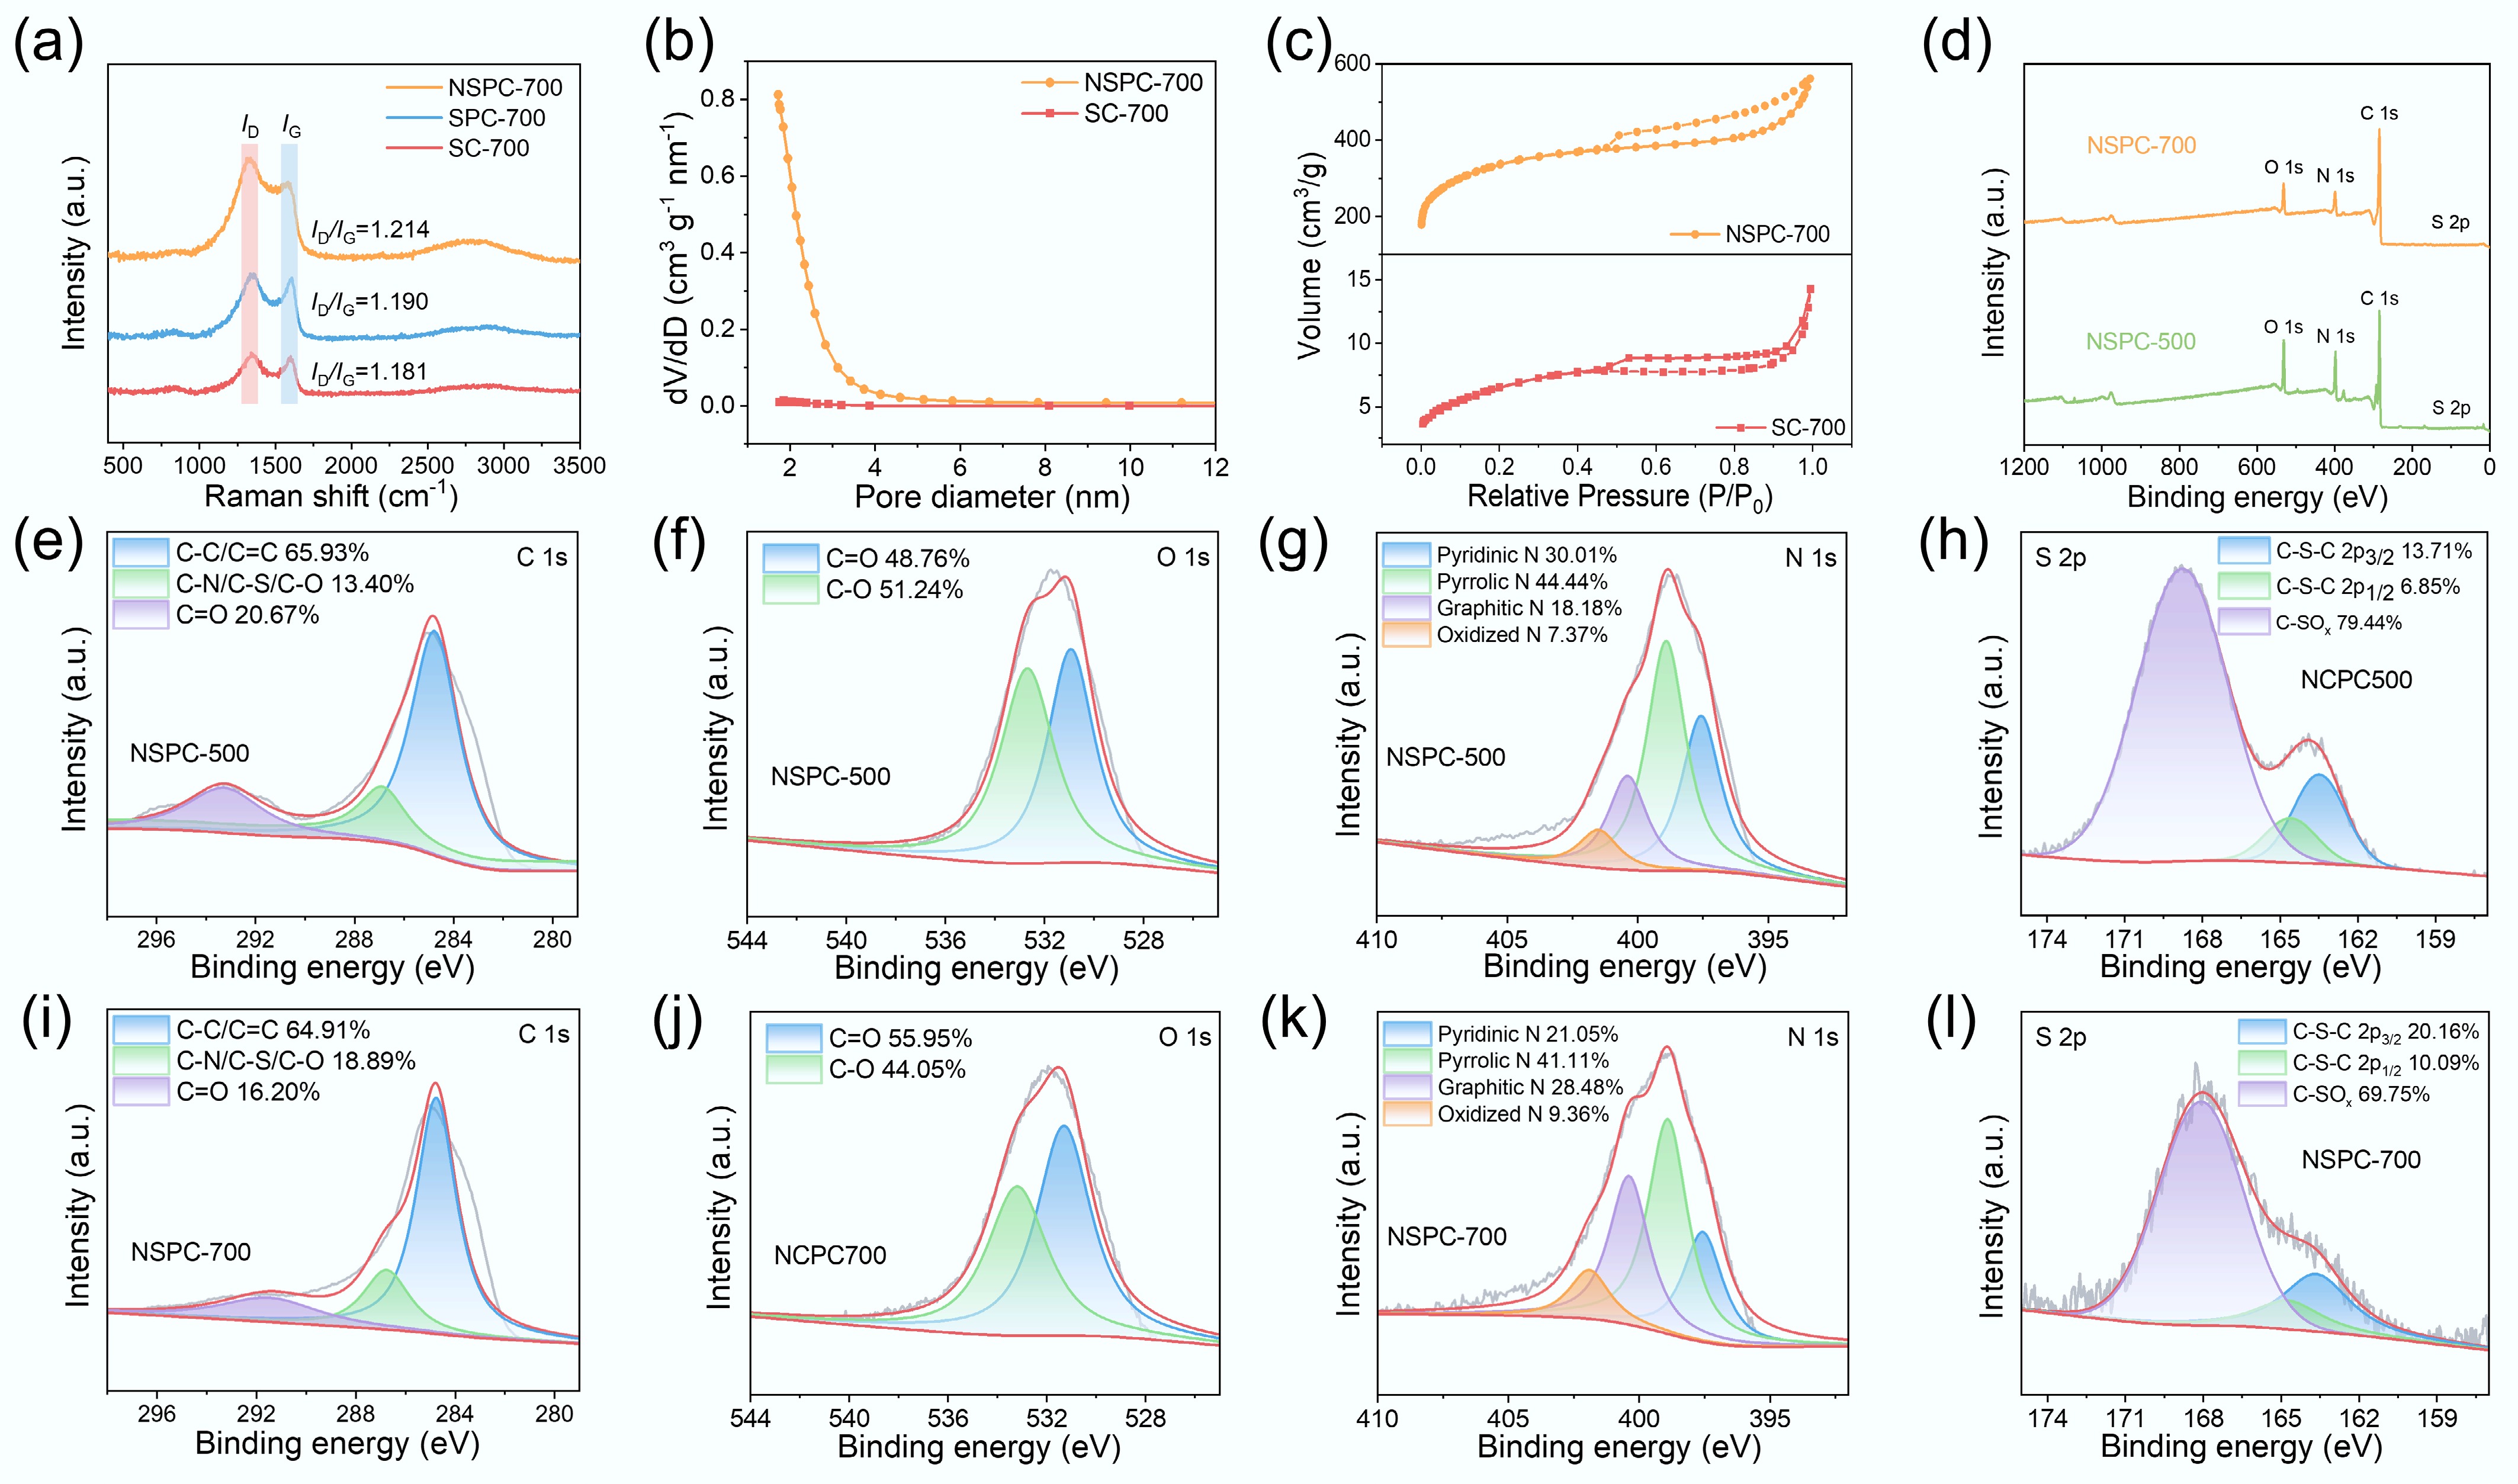
Figure 2.
(a) Raman mapping images of SC-700, SPC-700, and NSPC-700. (b) N2 adsorption/desorption isotherms, and (c) pore size distribution curves of SC-700, and NSPC-700. (d) XPS survey spectra of NSPC-500 and NSPC-700. High-resolution XPS spectra of (e), (i) C 1s, (f), (j) O 1s, (g), (k) N 1s, and (h), (l) S 2p for NSPC-500 and NSPC-700.
-

Figure 3.
Effect of (a) different catalytic systems, (b) carbonization temperature, (c) rate constants for different systems, (d) mass ratio of κ-c to melamine, (e) initial pH, (f) presence of natural organic matter and inorganic anions on NOR degradation, (g) TOC removal, and (h) Comparison with other reported catalysts. Experimental conditions unless otherwise specified: [NOR]0 = 20 mg L−1, [PMS]0 = 1.0 mM, room temperature, and pH = 7.0.
-
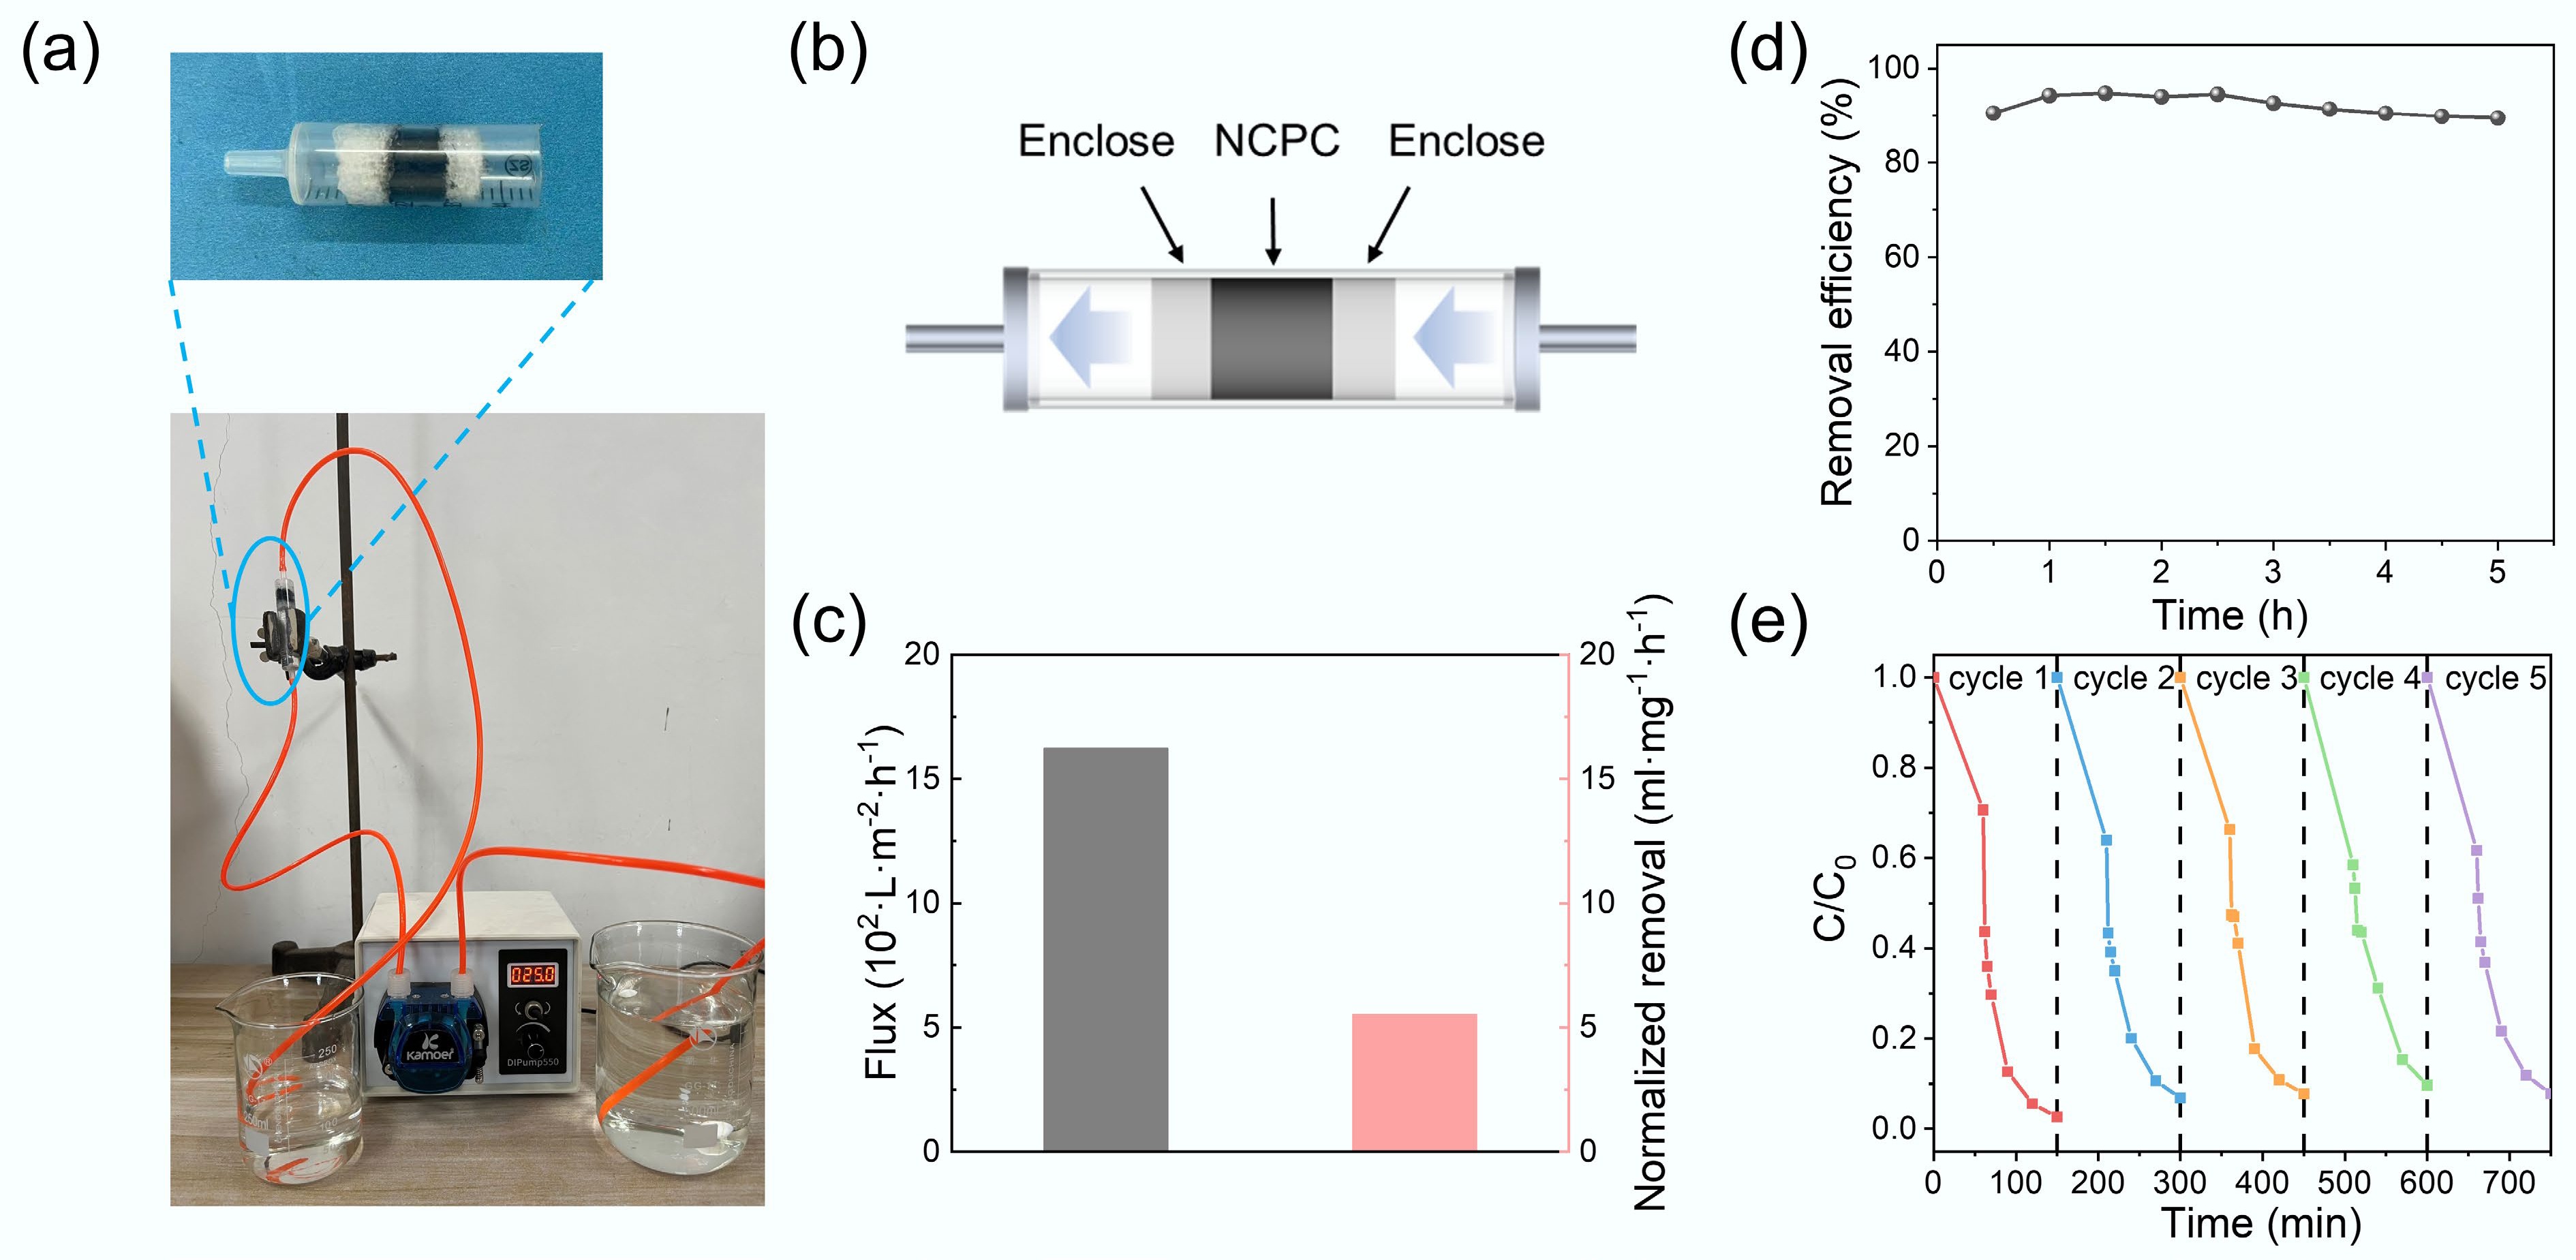
Figure 4.
(a) Continuous flow devices. (b) Schematic diagram of the degradation device. (c) Continuous flow device flux and removal efficiency. (d) Removal efficiency of NOR for 5 h. (e) Cycling performances.
-

Figure 5.
(a) Quenching experiments. DMPO and TEMP spin-trapping EPR spectra of (b) O2•−, (c) SO4•−/•OH, and (d) 1O2 in NSPC-700/PMS system. (e) EIS measurement of SC-700, NSPC-600, and NSPC-700. (f) I-t curve of SC-700, NSPC-600, and NSPC-700. (g) Contribution of different oxidation pathways in the NSPC-700/PMS/NOR system. XPS spectra of used NSPC-700 for (h) N 1s, and (i) S 2p.
-
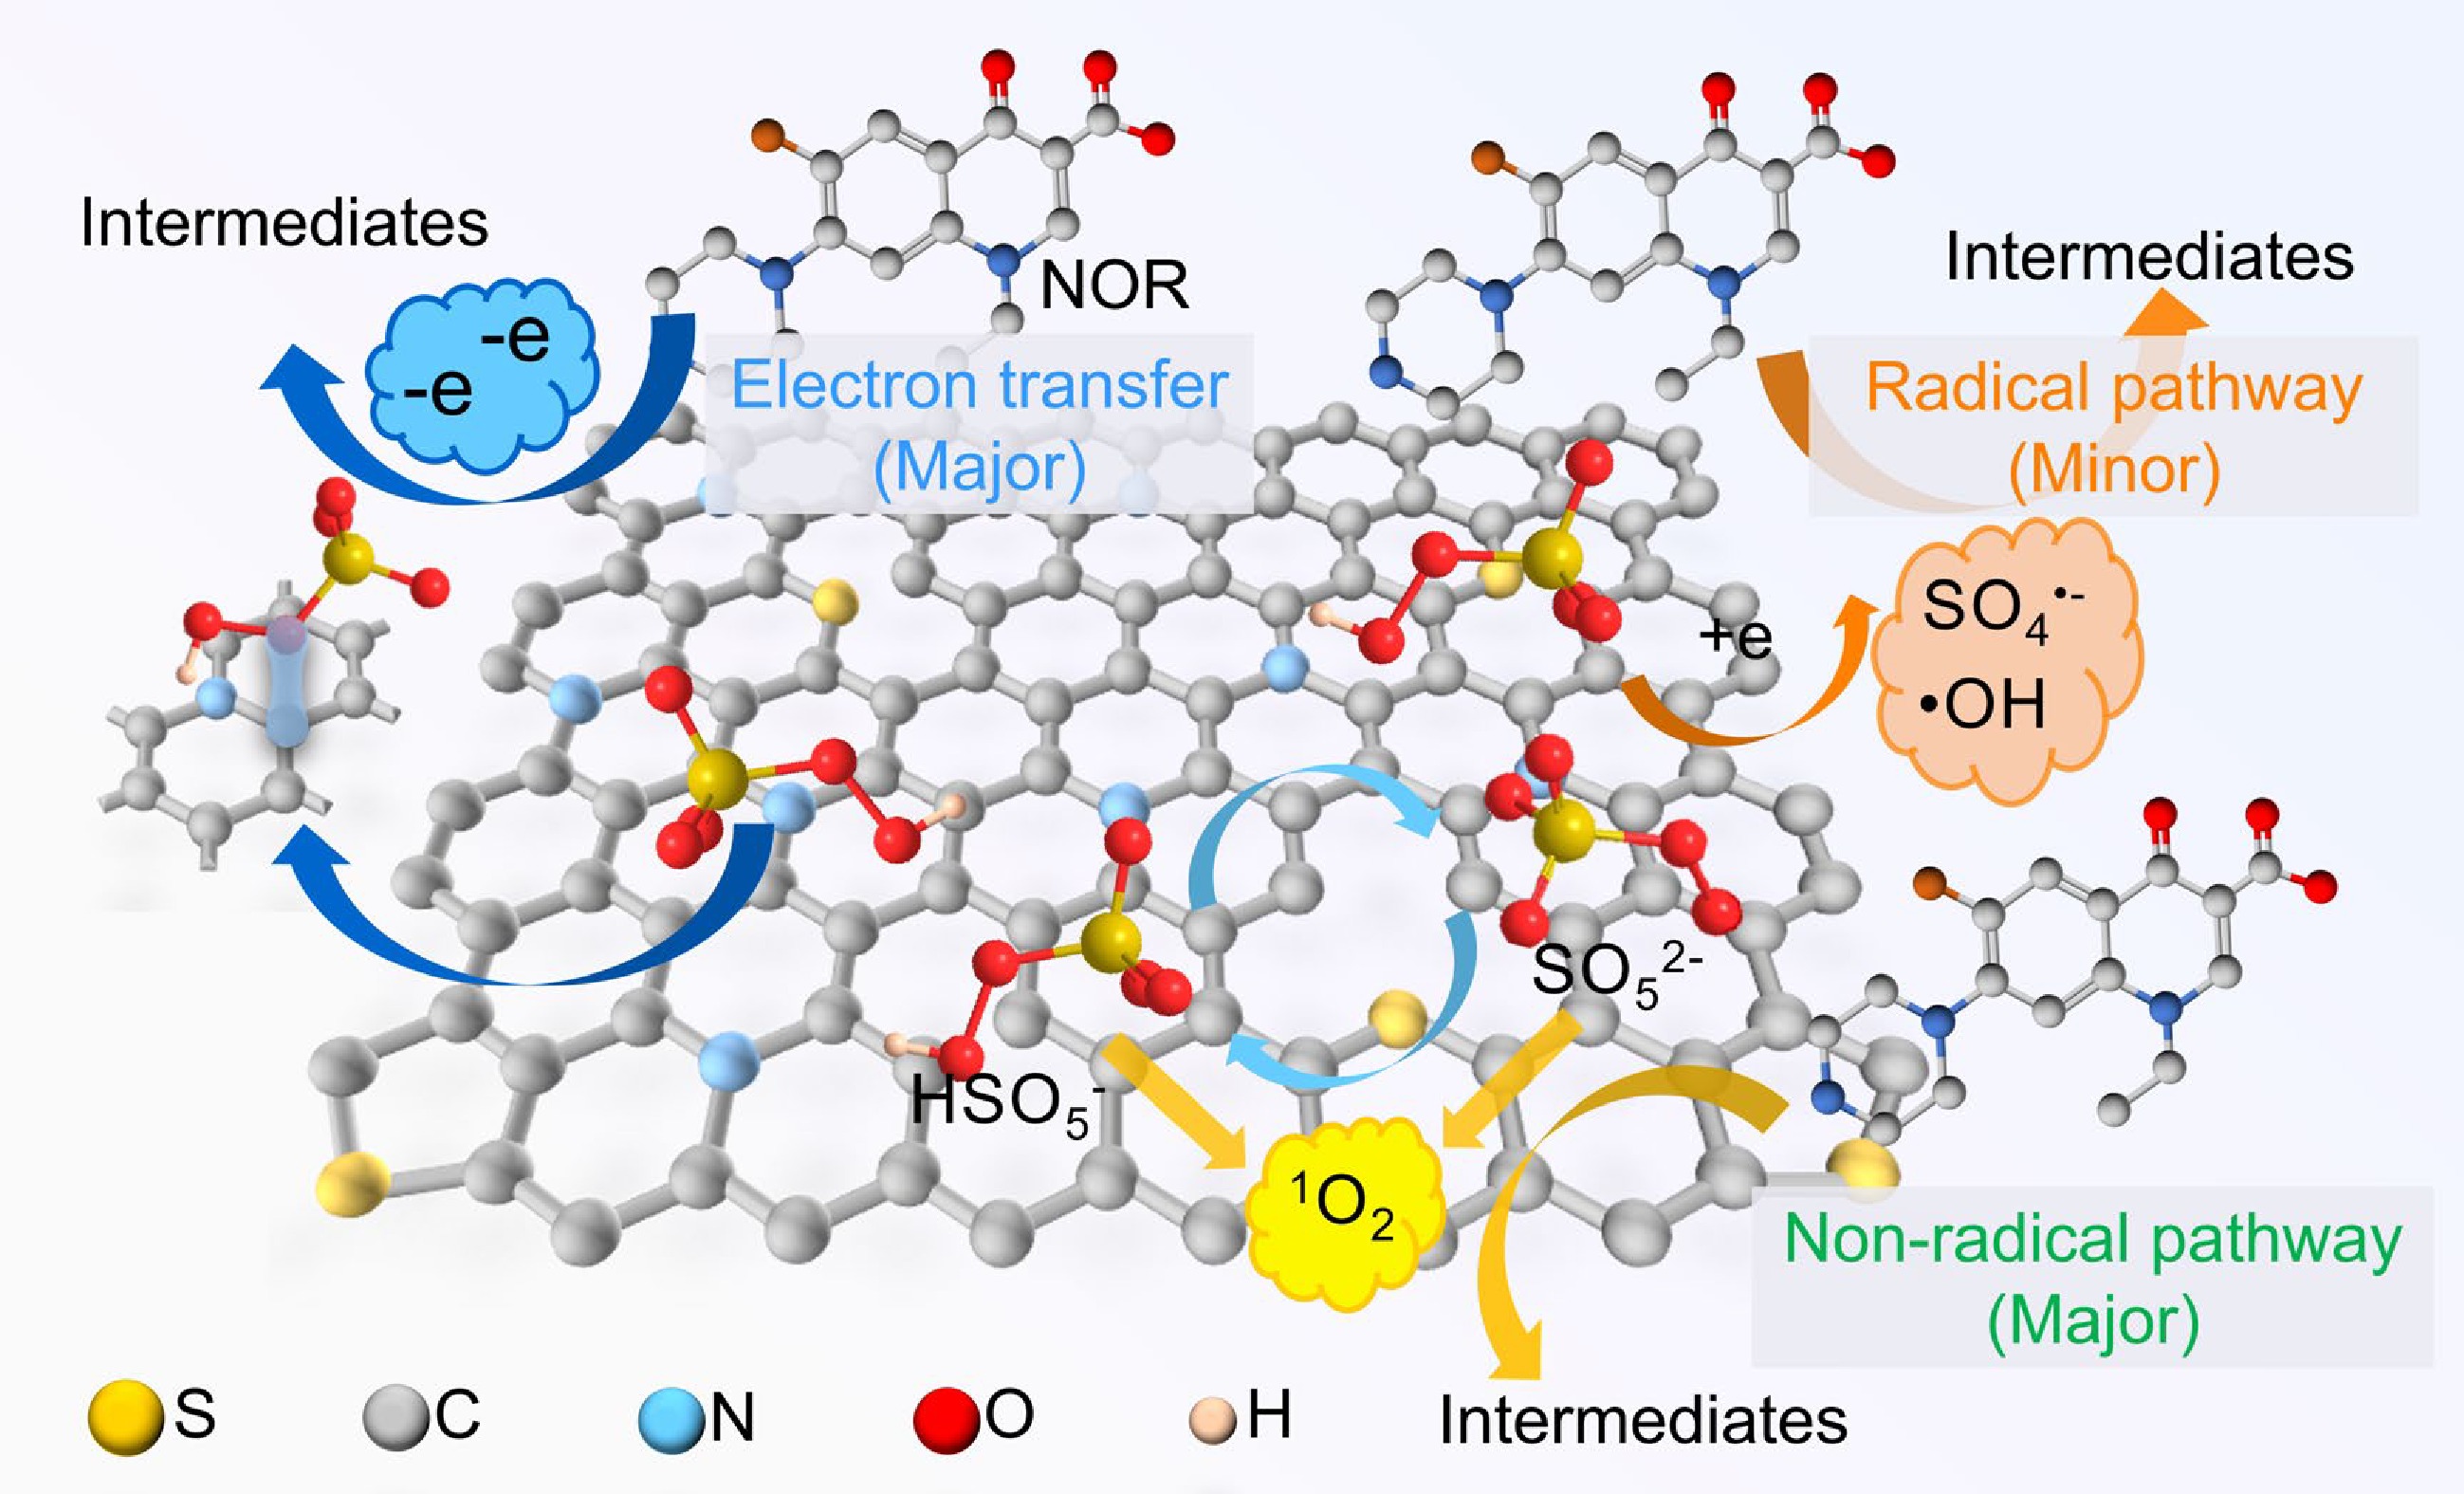
Figure 6.
NOR degradation mechanism.
Figures
(6)
Tables
(0)