-
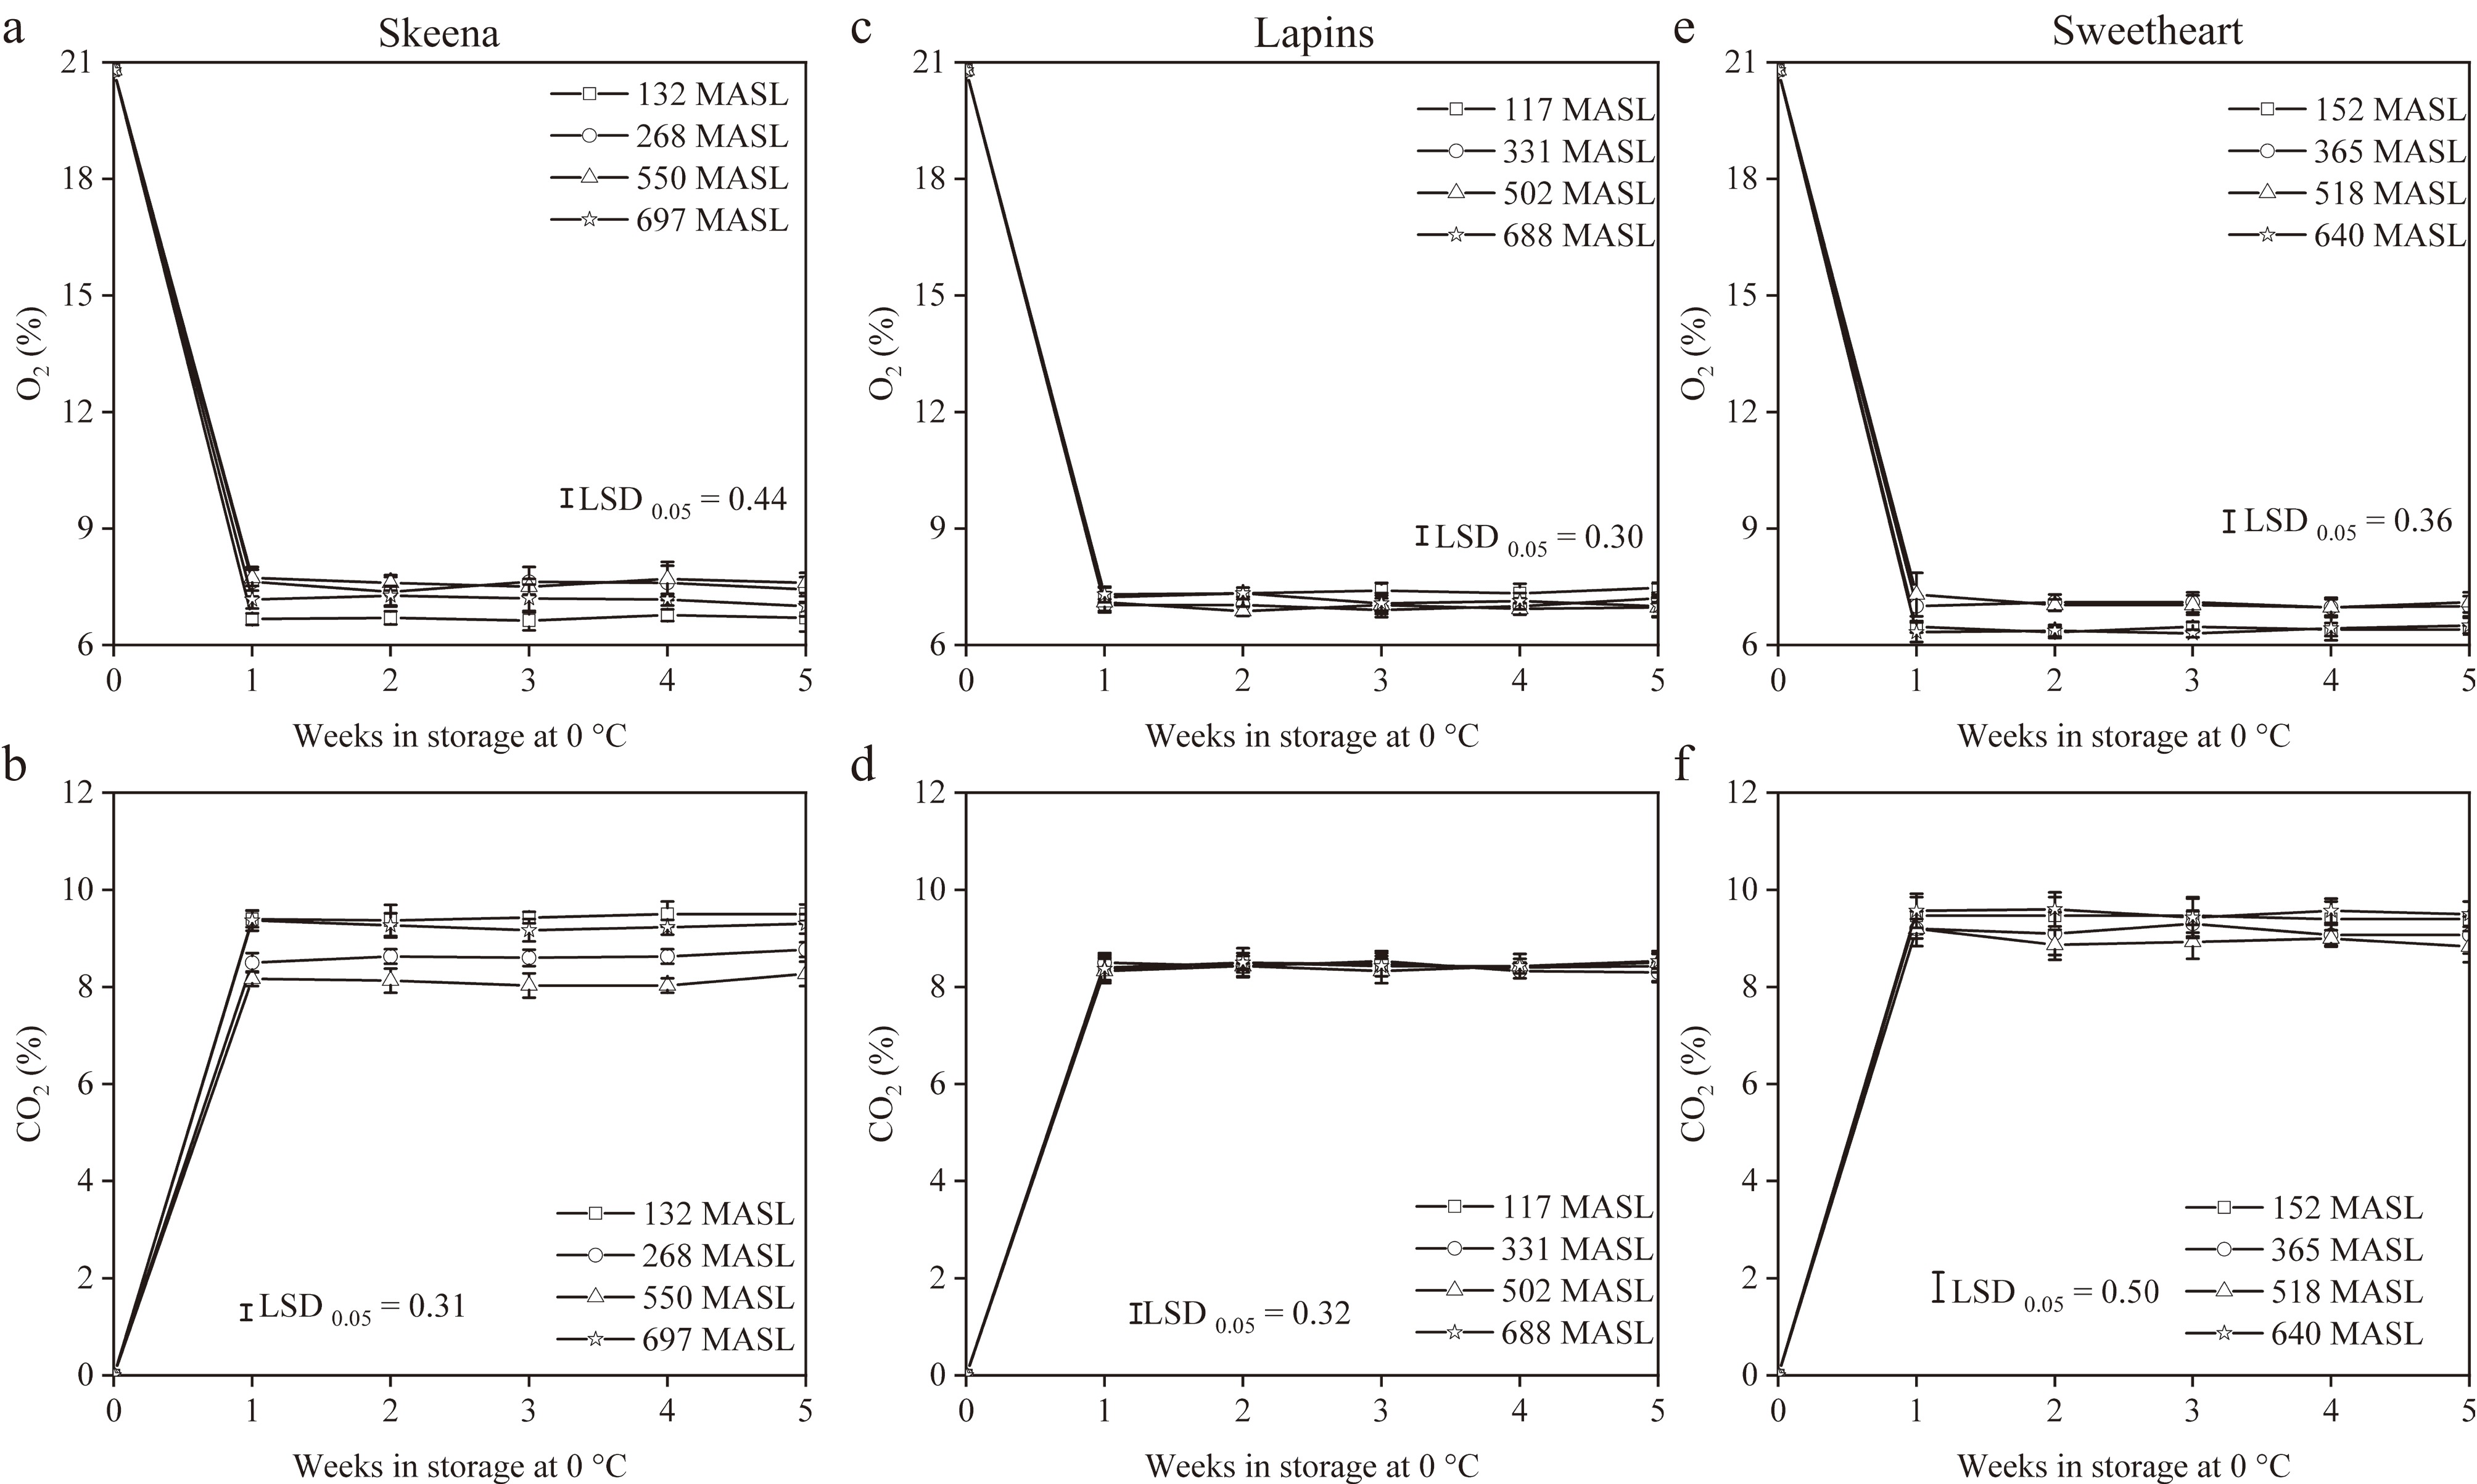
Figure 1.
O2 and CO2 concentrations of 'Skeena' (a) and (b), 'Lapins' (c) and (d), and 'Sweetheart' (e) and (f) sweet cherries from production elevation (PE) ranging from 117 to 697 m above sea level (MASL) after packaging and 1–5 weeks of storage at 0 °C. Vertical bars represent standard deviations (SD).
-
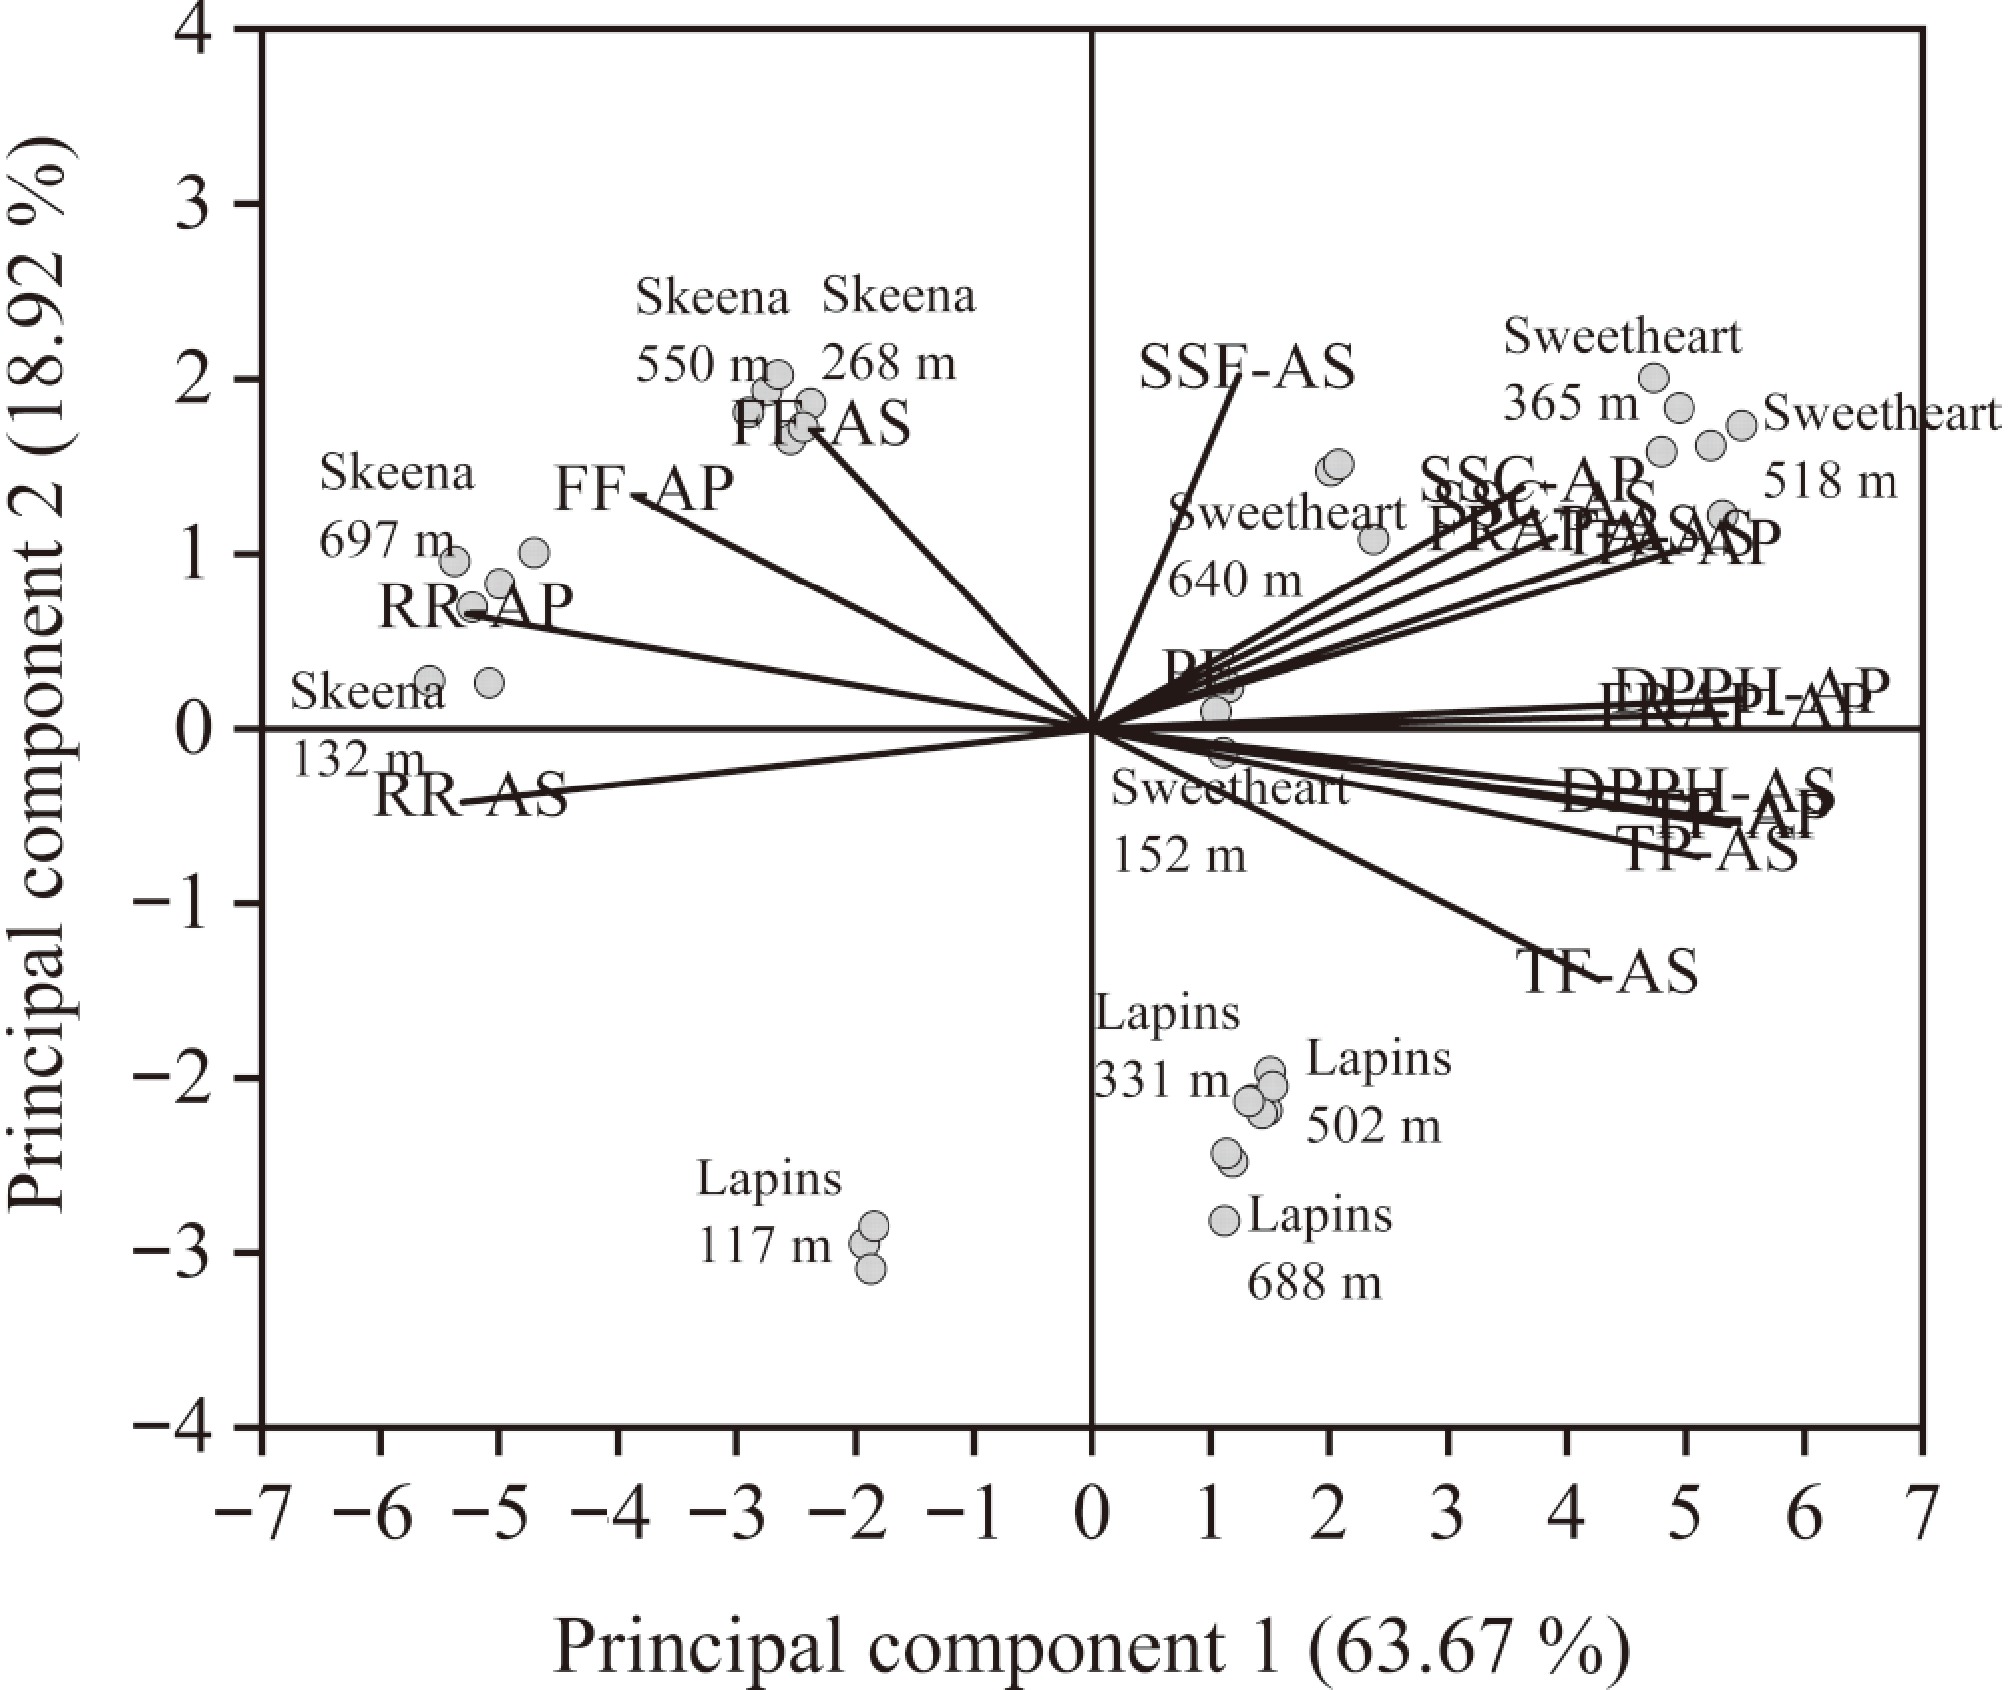
Figure 2.
Principal component analysis of respiration rate (RR), fruit firmness (FF), soluble solid content (SSC), titratable acidity (TA), sensory score of flavor (SSF), total phenolics (TP), total flavonoids (TF), the ability to scavenge 1,1-diphenyl-2-picrylhydrazyl (DPPH), and ferric reducing antioxidant power (FRAP) of 'Skeena', 'Lapins', and 'Sweetheart' cherries from four orchards from production elevation (PE) ranging from 117 to 697 MASL after packaging (AP), and storage (AS).
-
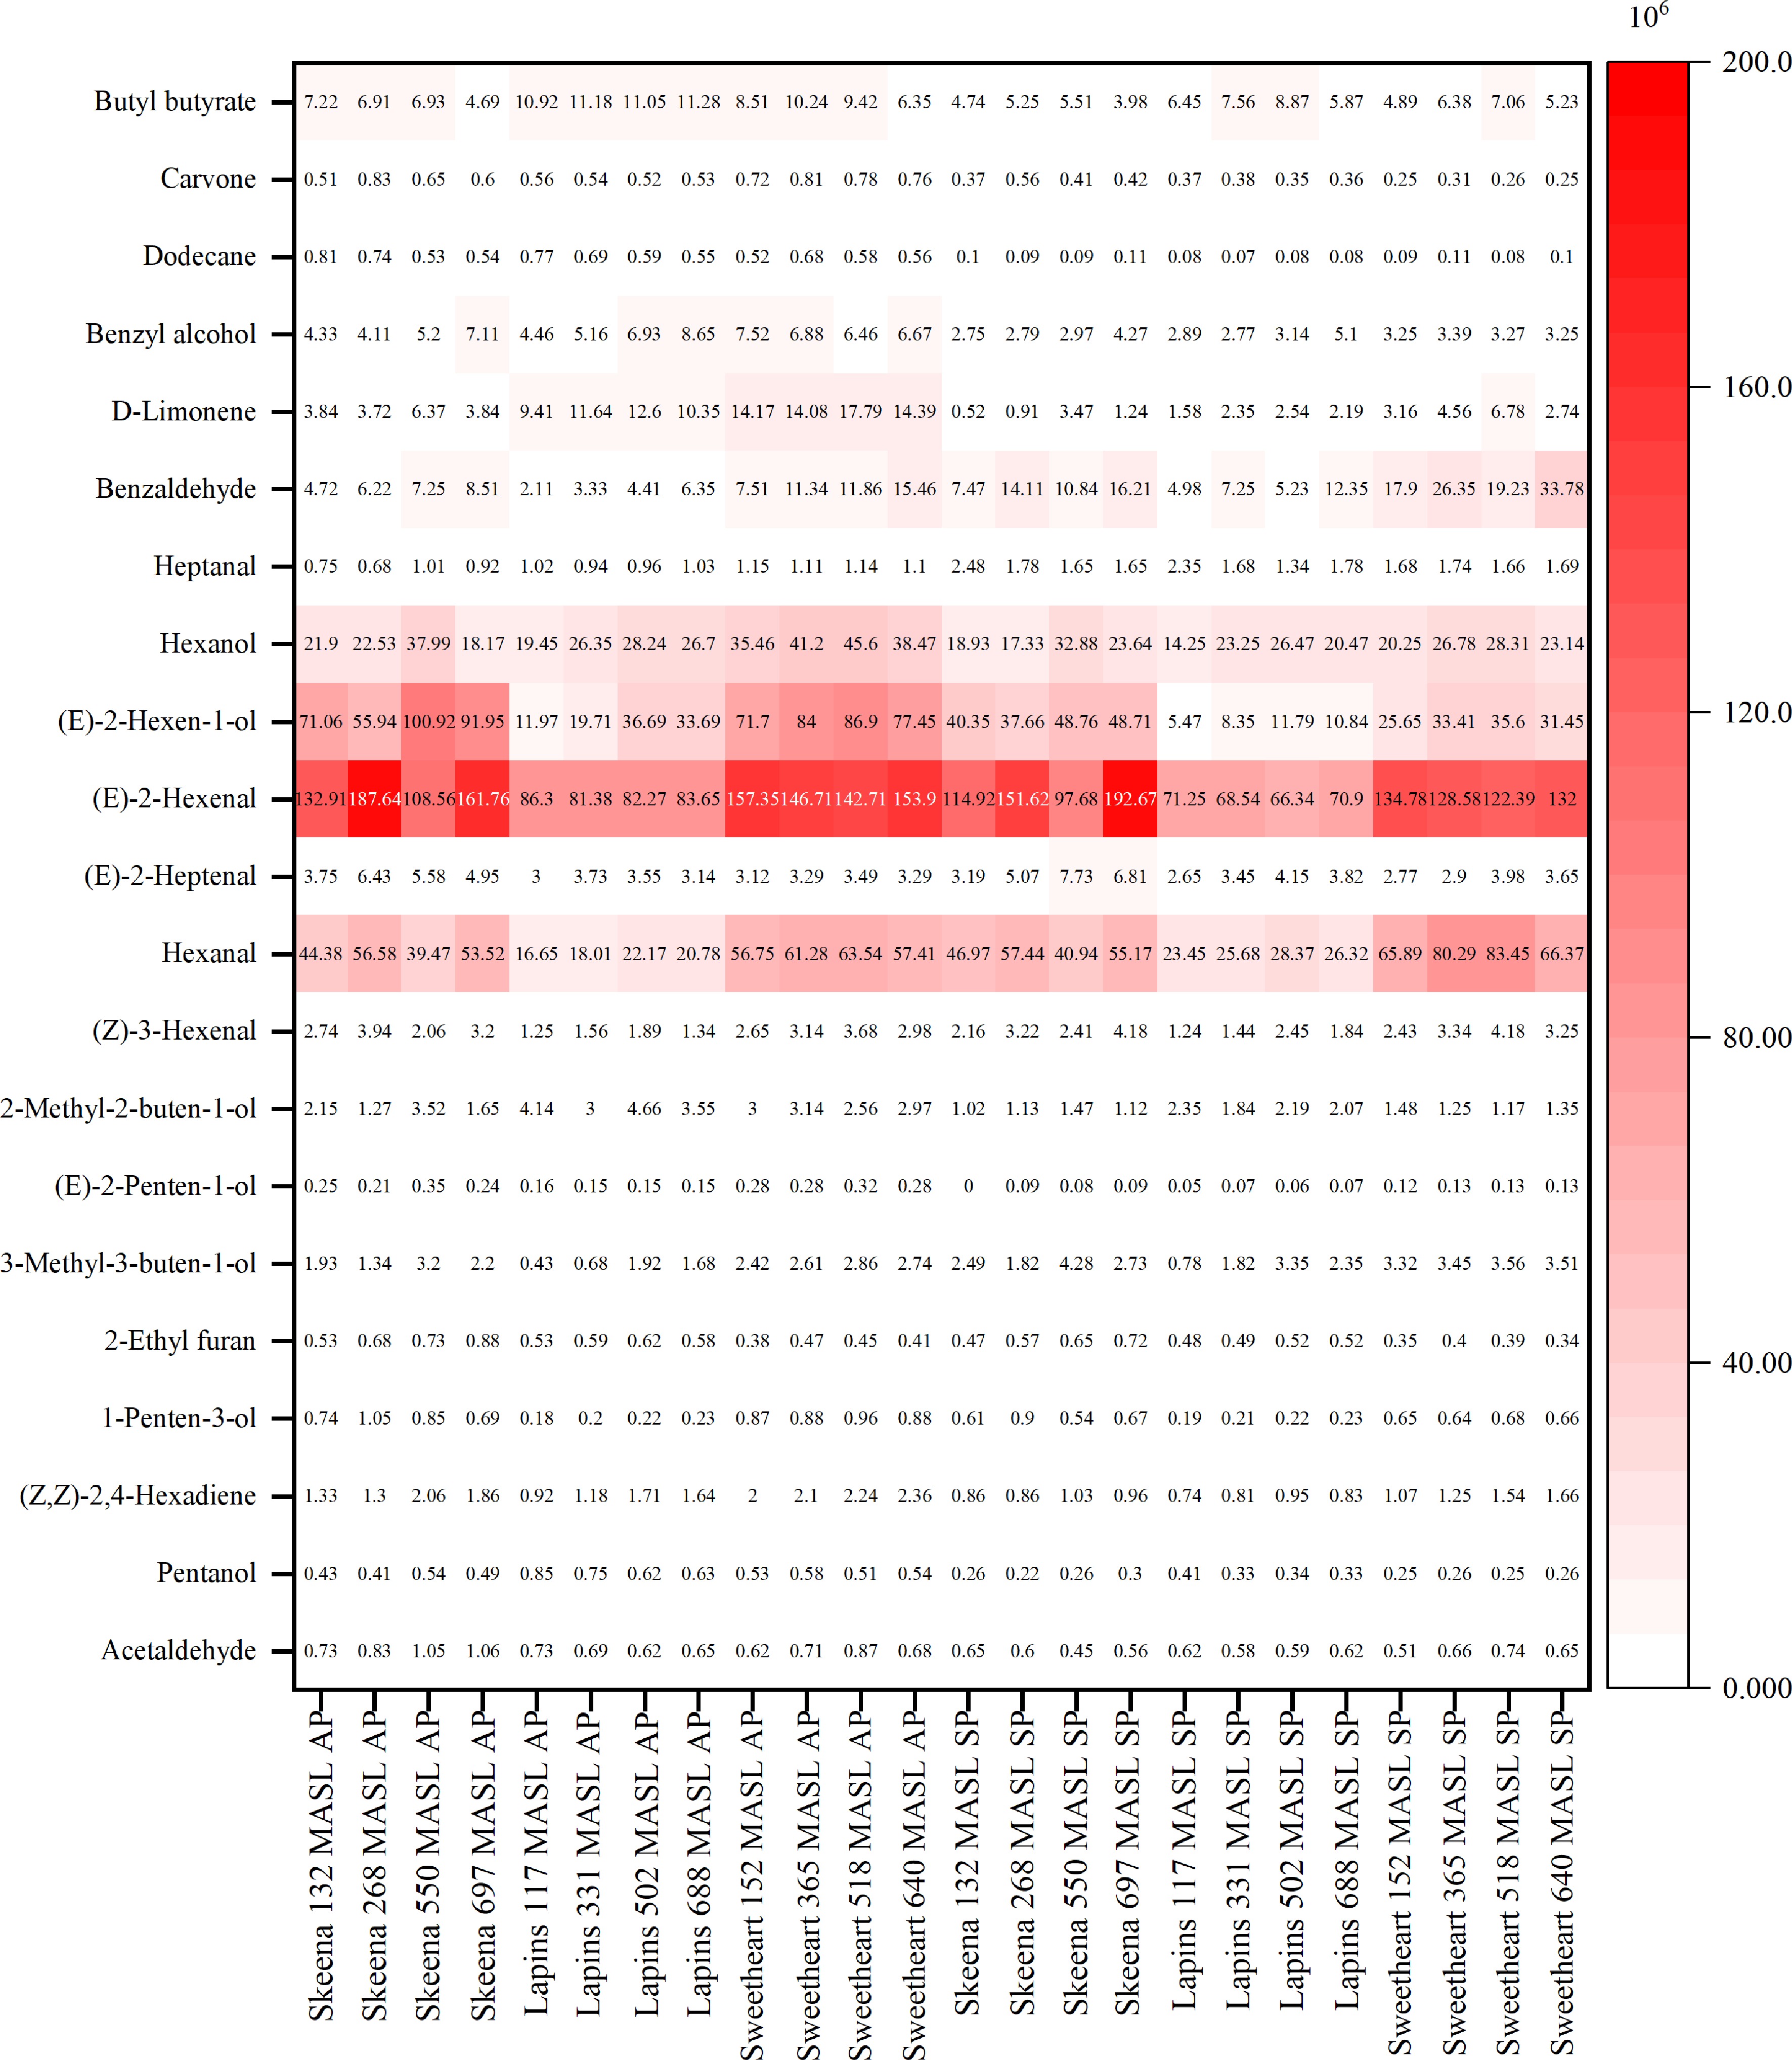
Figure 3.
Changes in aromatic volatile compounds of 'Skeena', 'Lapins', and 'Sweetheart' sweet cherries from production elevation (PE) ranging from 117 to 697 MASL after packaging (AP), and storage (AS). Values are mean area units (divided by 106). Color scale represents the peak number corresponds to elution order.
-
Cultivar Elevation
(MASL)RR (μg CO2 kg−1·s−1) After packaging After 5 weeks of
storage at 0 °CSkeena 132 3.40 b 2.86 b 268 3.19 c 2.47 d 550 3.29 bc 2.67 c 697 3.55 a 3.02 a R2 of linear model 0.136ns 0.077ns R2 of quadratic model 0.881*** 0.908*** R2 of cubic model 0.881*** 0.920*** Lapins 117 2.88 a 2.66 a 331 2.64 b 2.38 b 502 2.57 c 2.38 b 688 2.51 c 2.37 b R2 of linear model 0.862*** 0.624** R2 of quadratic model 0.957*** 0.893*** R2 of cubic model 0.934*** 0.933*** Sweetheart 152 2.80 a 2.30 a 365 2.41 c 1.90 c 518 2.39 c 1.93 c 640 2.64 b 2.11 b R2 of linear model 0.176ns 0.211ns R2 of quadratic model 0.931*** 0.878*** R2 of cubic model 0.940*** 0.879*** Values are presented as means. Different lowercase letters indicate significant differences among means for each cultivar in each column using Fisher's protected least significant difference (LSD) test at p < 0.05. ns, not significant effect; *, significant effect at the 0.05 level; **, significant effect at the 0.01 level; ***, significant effect at the 0.001 level. Table 1.
Changes in respiration rate (RR) of 'Skeena', 'Lapins', and 'Sweetheart' sweet cherries from production elevation (PE) from 117 to 697 MASL after packaging and 5 weeks of storage at 0 °C.
-
Cultivar Elevation (MASL) After packaging After 5 weeks of storage at 0 °C FF (N) SSC (%) TA (%) FF (N) SSC (%) TA (%) SSF (1–9) Skeena 132 4.31 a 18.10 b 0.79 b 3.96 b 17.07 bc 0.45 ab 6.40 b 268 4.25 a 15.97 c 0.91 a 4.36 a 16.47 c 0.46 ab 7.47 a 550 4.13 ab 19.30 a 0.88 a 3.90 b 17.67 ab 0.49 a 7.30 a 697 3.98 b 17.90 b 0.75 b 4.00 b 18.50 a 0.42 b 6.13 b R2 of linear model 0.663** 0.055ns 0.034ns 0.022ns 0.425* 0.030ns 0.009ns R2 of quadratic model 0.713** 0.136ns 0.844*** 0.235ns 0.665** 0.359ns 0.801*** R2 of cubic model 0.713* 0.928*** 0.845** 0.722* 0.709* 0.643* 0.806** Lapins 117 2.82 c 16.23 c 0.75 b 2.98 b 16.17 b 0.45 c 5.30 b 331 2.92 b 17.10 b 0.91 a 3.23 a 17.43 a 0.51 a 6.37 a 502 3.09 a 17.63 a 0.94 a 3.24 a 17.27 a 0.50 ab 6.03 a 688 3.13 a 16.83 b 0.91 a 3.30 a 16.90 a 0.47 bc 5.27 b R2 of linear model 0.863*** 0.590** 0.250ns 0.738*** 0.200ns 0.060ns 0.004ns R2 of quadratic model 0.871*** 0.914*** 0.800*** 0.874*** 0.751** 0.735** 0.873*** R2 of cubic model 0.907*** 0.916*** 0.864*** 0.910*** 0.794** 0.795** 0.906*** Sweetheart 152 2.68 c 22.03 b 0.97 c 2.93 c 22.67 a 0.55 c 7.20 b 365 3.29 a 23.83 a 1.20 a 3.49 b 23.30 a 0.73 a 7.50 a 518 2.99 b 24.17 a 1.21 a 3.61 b 23.50 a 0.74 a 7.00 bc 640 3.22 a 23.77 a 1.08 b 3.90 a 22.47 a 0.63 b 6.80 c R2 of linear model 0.420* 0.538** 0.228ns 0.920*** 0.000ns 0.216ns 0.349* R2 of quadratic model 0.581* 0.796*** 0.943*** 0.928*** 0.351ns 0.887*** 0.686** R2 of cubic model 0.898*** 0.796** 0.947*** 0.952*** 0.410ns 0.903*** 0.801** Values are presented as means. Different lowercase letters indicate significant differences among means for each cultivar in each column using Fisher's protected least significant difference (LSD) test at p < 0.05. ns, not significant effect; *, significant effect at the 0.05 level; **, significant effect at the 0.01 level; ***, significant effect at the 0.001 level. Table 2.
Changes in quality attributes [fruit firmness (FF), soluble solid content (SSC), titratable acidity (TA), and sensory score of flavor (SSF)] of 'Skeena', 'Lapins', and 'Sweetheart' sweet cherries from production elevation (PE) ranging of 117 to 697 MASL after packaging and 5 weeks of storage at 0 °C.
-
Cultivar Elevation (MASL) After packaging After 5 weeks of storage at 0 °C TP (g·kg−1) TF (g·kg−1) DPPH (g·kg−1) FRAP (g·kg−1) TP (g·kg−1) TF (g·kg−1) DPPH (g·kg−1) FRAP (g·kg−1) Skeena 132 5.28 c 5.41 c 5.69 c 5.95 b 4.84 b 5.03 b 4.98 c 4.87 b 268 6.17 a 6.36 a 6.89 a 7.15 a 5.00 a 5.20 a 5.32 a 5.67 a 550 5.69 b 6.17 b 6.76 b 6.96 a 4.84 b 5.03 b 5.12 b 5.58 a 697 5.17 c 5.18 d 5.61 c 5.89 b 4.66 c 4.90 c 4.96 c 4.68 c R2 of linear model 0.022ns 0.013ns 0.000ns 0.000ns 0.283ns 0.228ns 0.018ns 0.007ns R2 of quadratic model 0.911*** 0.989*** 0.987*** 0.978*** 0.812*** 0.782** 0.766** 0.967*** R2 of cubic model 0.978*** 0.991*** 0.991*** 0.979*** 0.838** 0.860*** 0.861*** 0.977*** Lapins 117 6.75 b 7.09 b 6.61 b 6.58 b 5.24 b 6.08 b 5.05 b 5.13 b 331 7.76 a 7.95 a 7.66 a 7.91 a 5.95 a 6.38 a 6.09 a 5.25 a 502 7.77 a 7.96 a 7.66 a 7.87 a 5.86 a 6.41 a 6.11 a 5.21 ab 688 7.79 a 7.97 a 7.70 a 7.91 a 5.86 a 6.18 b 6.10 a 5.18 ab R2 of linear model 0.643** 0.648** 0.659** 0.628** 0.494* 0.076ns 0.649** 0.049ns R2 of quadratic model 0.927*** 0.936*** 0.936*** 0.930*** 0.852*** 0.857*** 0.955*** 0.521* R2 of cubic model 0.968*** 0.974*** 0.983*** 0.985*** 0.940*** 0.859*** 0.993*** 0.600ns Sweetheart 152 7.32 c 7.58 c 7.49 d 7.30 d 5.38 c 5.61 c 5.53 d 5.28 b 365 8.27 a 8.51 b 8.76 b 8.69 b 5.95 a 6.06 b 6.09 b 6.07 a 518 8.35 a 8.64 a 8.94 a 8.84 a 6.02 a 6.19 a 6.25 a 6.15 a 640 7.83 b 7.67 c 7.94 c 7.69 c 5.62 b 5.67 c 5.84 c 5.25 b R2 of linear model 0.292ns 0.044ns 0.163ns 0.119ns 0.198ns 0.061ns 0.306ns 0.015ns R2 of quadratic model 0.955*** 0.927*** 0.956*** 0.957*** 0.939*** 0.866*** 0.927*** 0.928*** R2 of cubic model 0.963*** 0.988*** 0.990*** 0.991*** 0.959*** 0.960*** 0.973*** 0.991*** Values are presented as means. Different lowercase letters indicate significant differences among means for each cultivar in each column using Fisher's protected least significant difference (LSD) test at p < 0.05. ns, not significant effect; *, significant effect at the 0.05 level; **, significant effect at the 0.01 level; ***, significant effect at the 0.001 level. Table 3.
Changes in antioxidant properties (total phenolics [TP], total flavonoids [TF], the ability to scavenge 1,1-diphenyl-2-picrylhydrazyl [DPPH], and ferric reducing antioxidant power [FRAP]) of 'Skeena', 'Lapins', and 'Sweetheart' sweet cherries from production elevation (PE) ranging from 117 to 697 MASL after packaging and 5 weeks of storage at 0 °C.
Figures
(3)
Tables
(3)