-
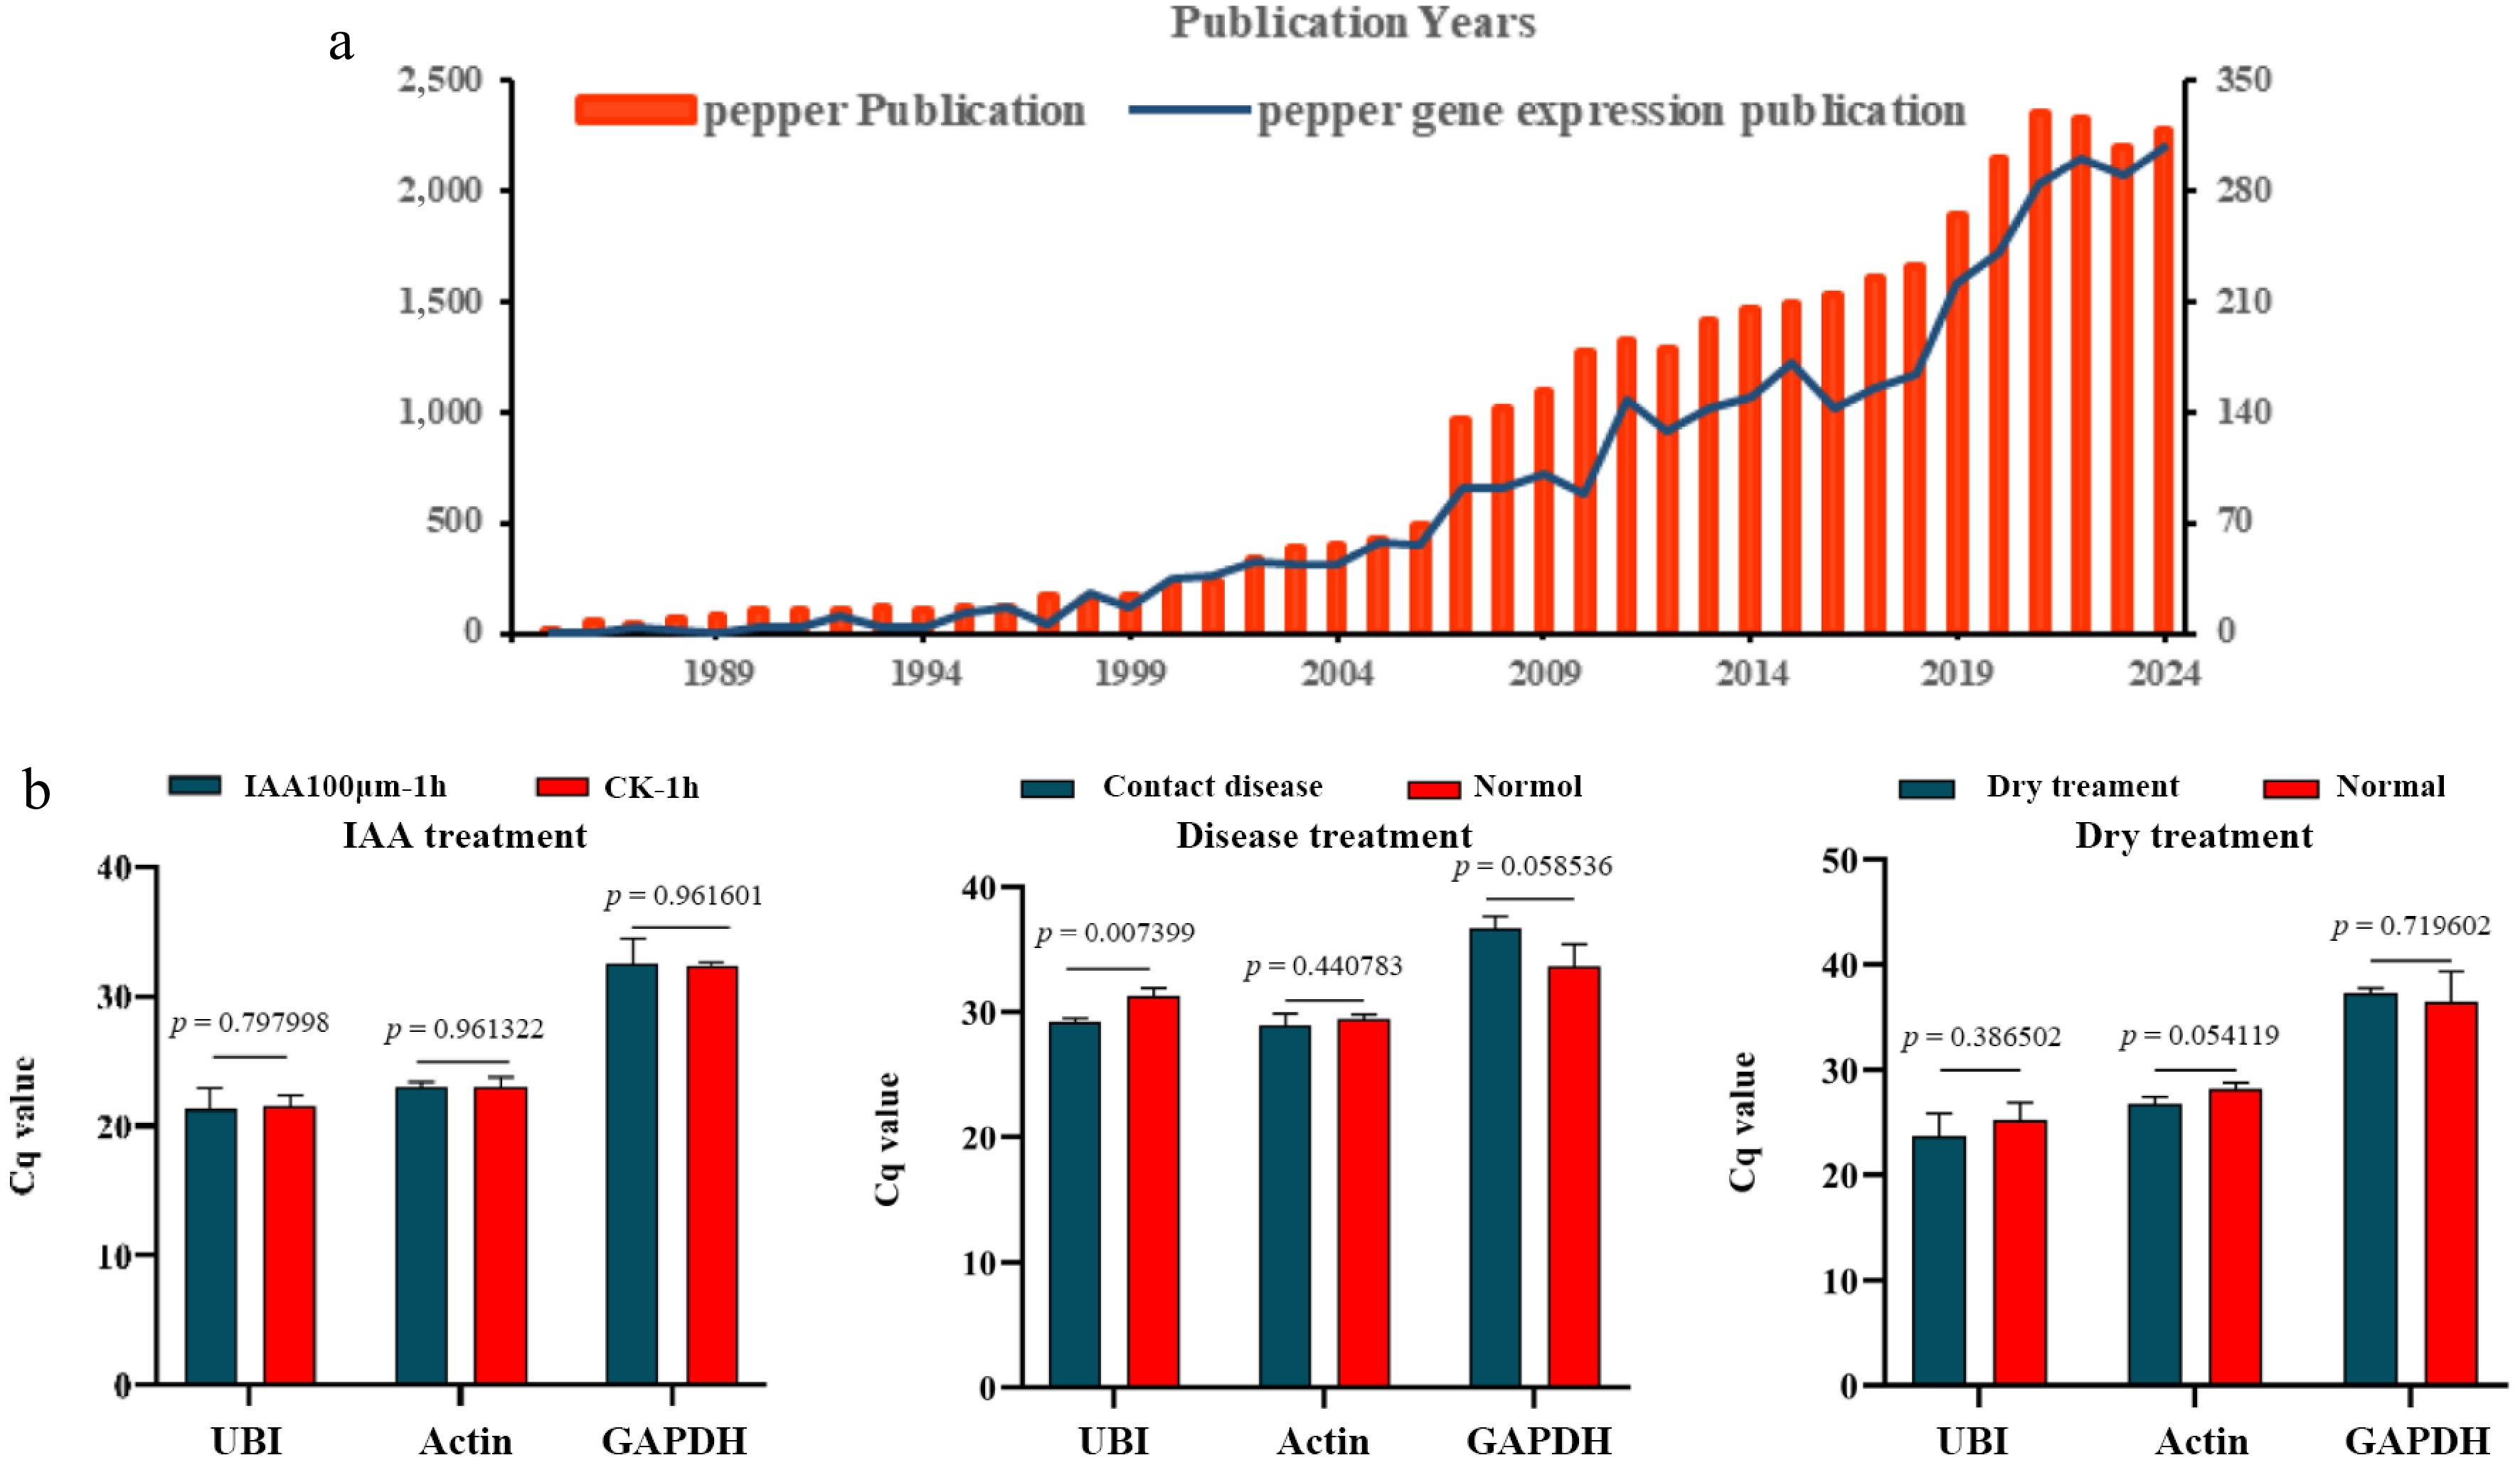
Figure 1.
The existing status of reference genes in pepper. (a) Numbers of pepper gene expression publication from 1988 to 2024. (Based on the Web of Science database using the search word 'pepper' and 'pepper gene expression'). (b) Stability verification of published reference genes. (Significance analysis was performed using the two-tail Student's test (p < 0.05 indicated a significant difference).
-
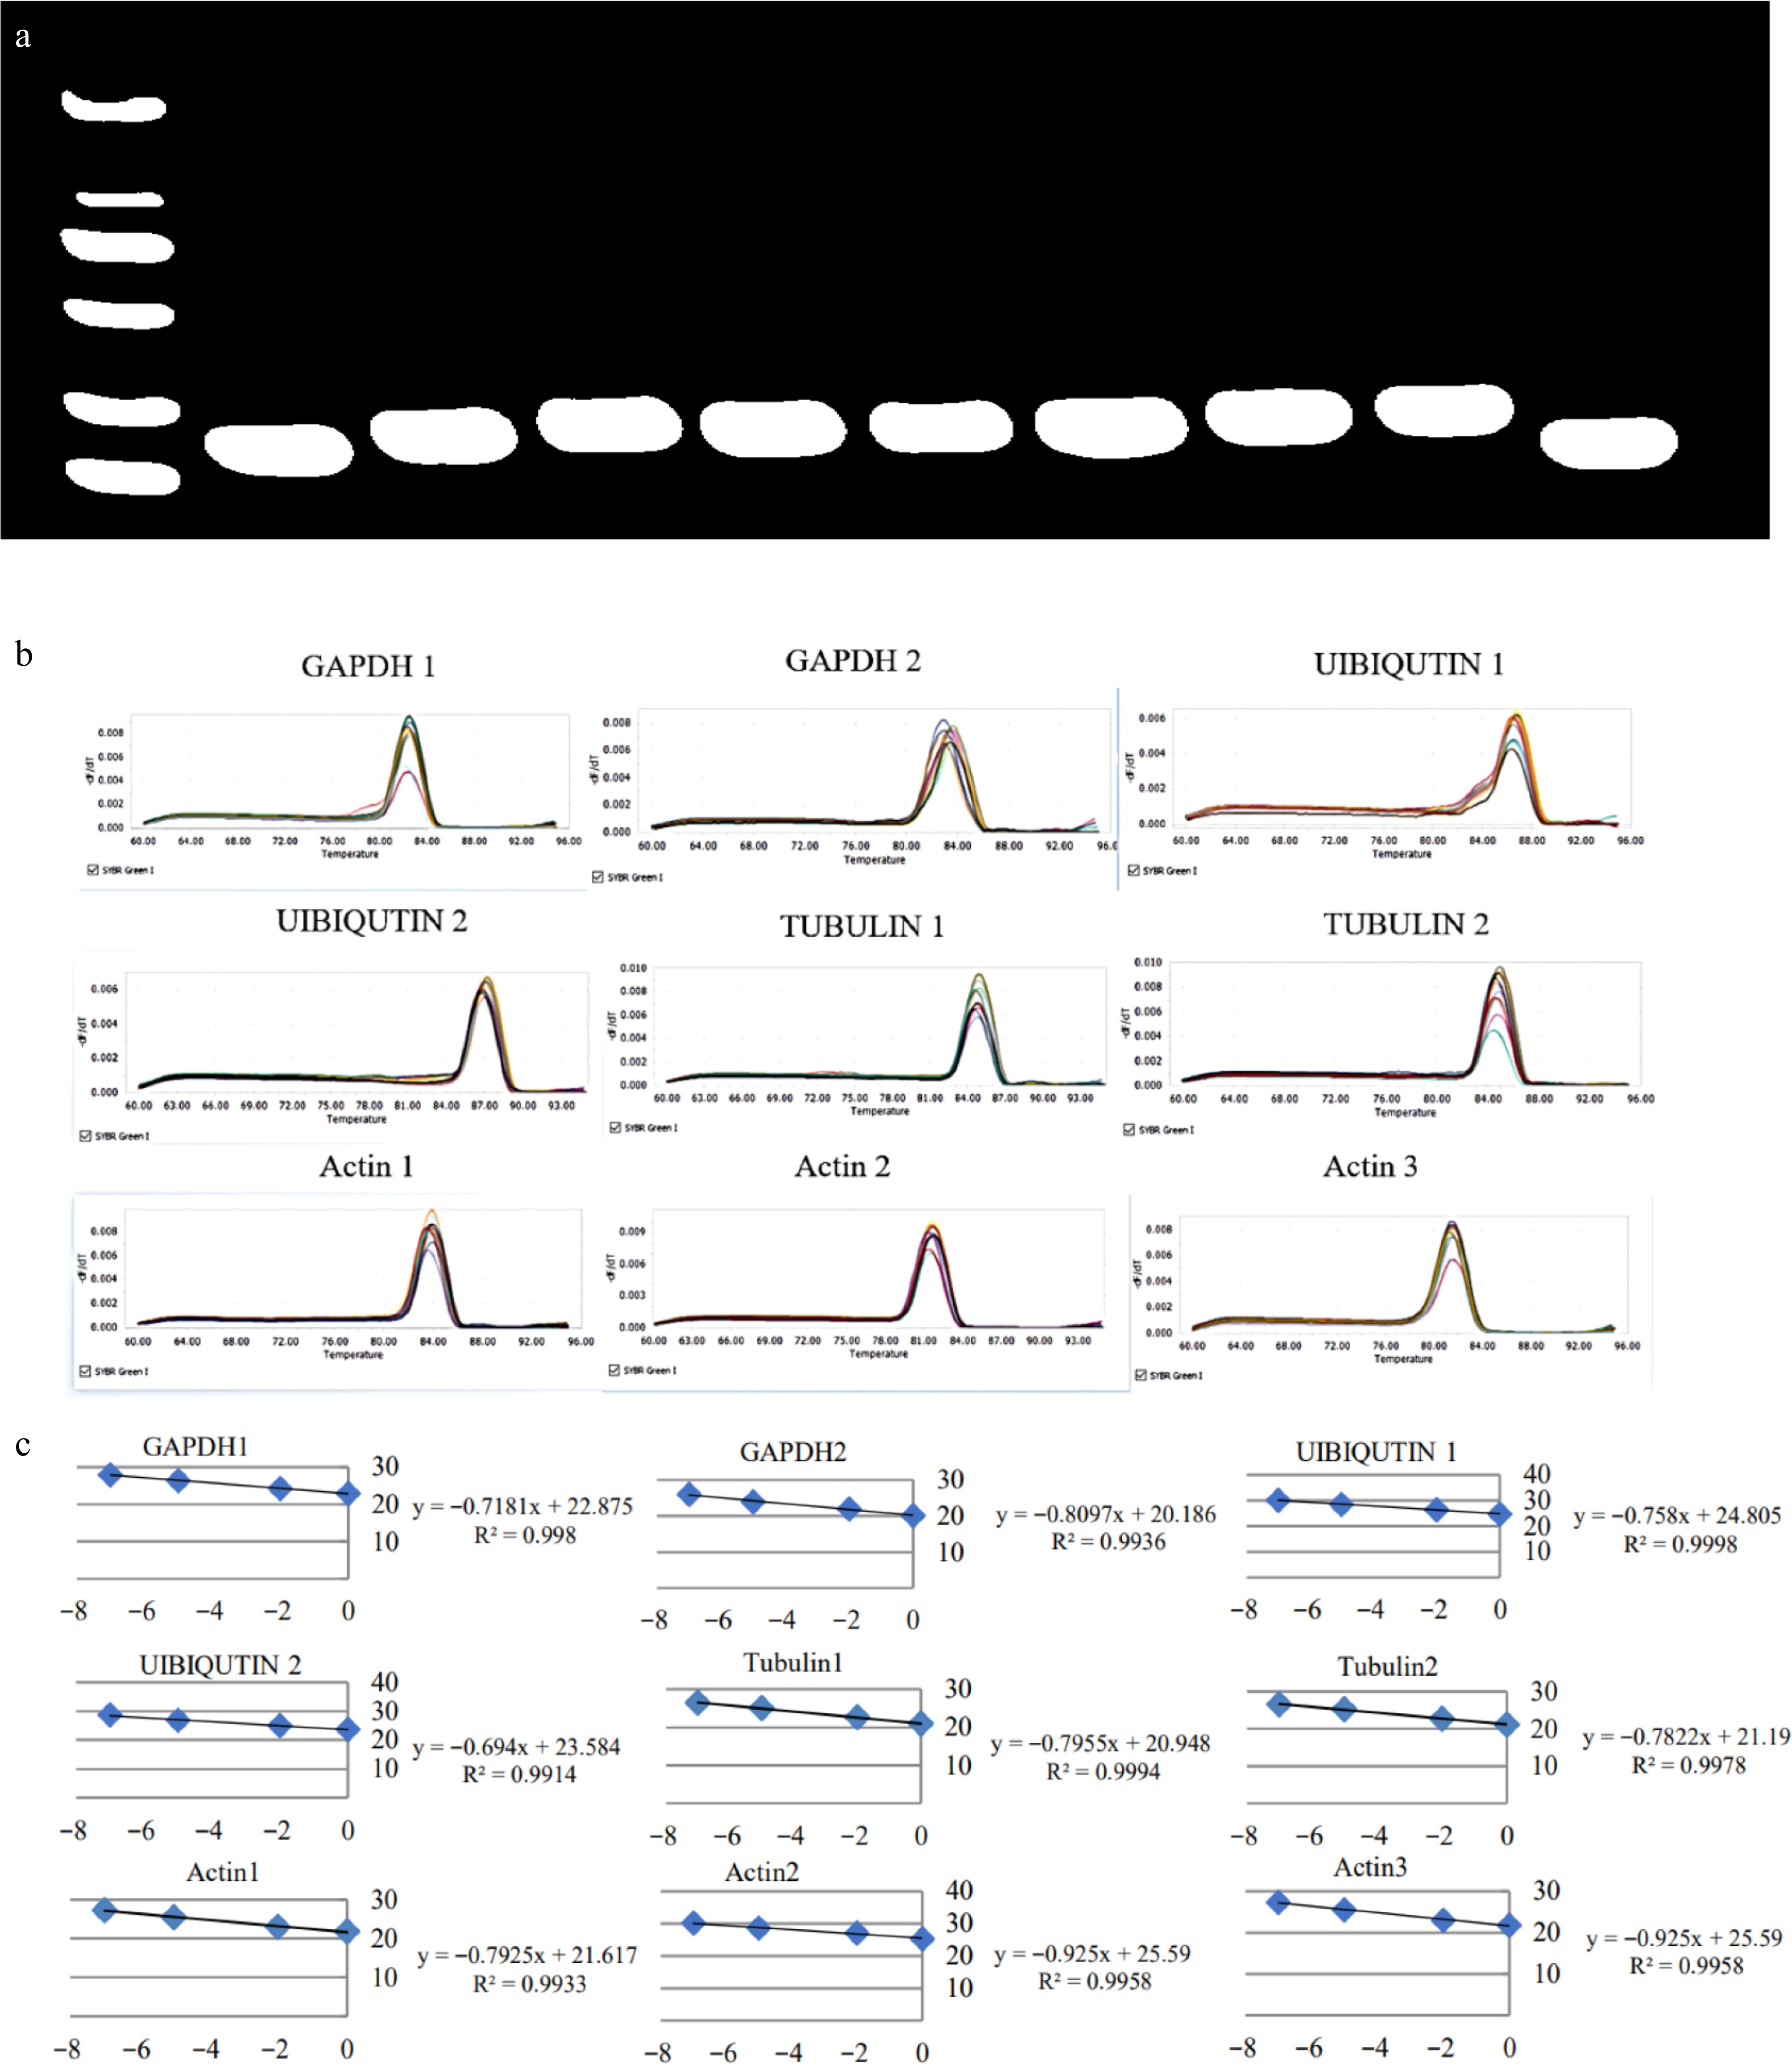
Figure 2.
Specificity detection of nine pairs of primers. (a) The electrophoretic banding pattern of the amplification products of the nine reference genes. (b) The melting curve graphs of the nine reference genes. (c) Amplification efficiency of nine pairs of primers.
-
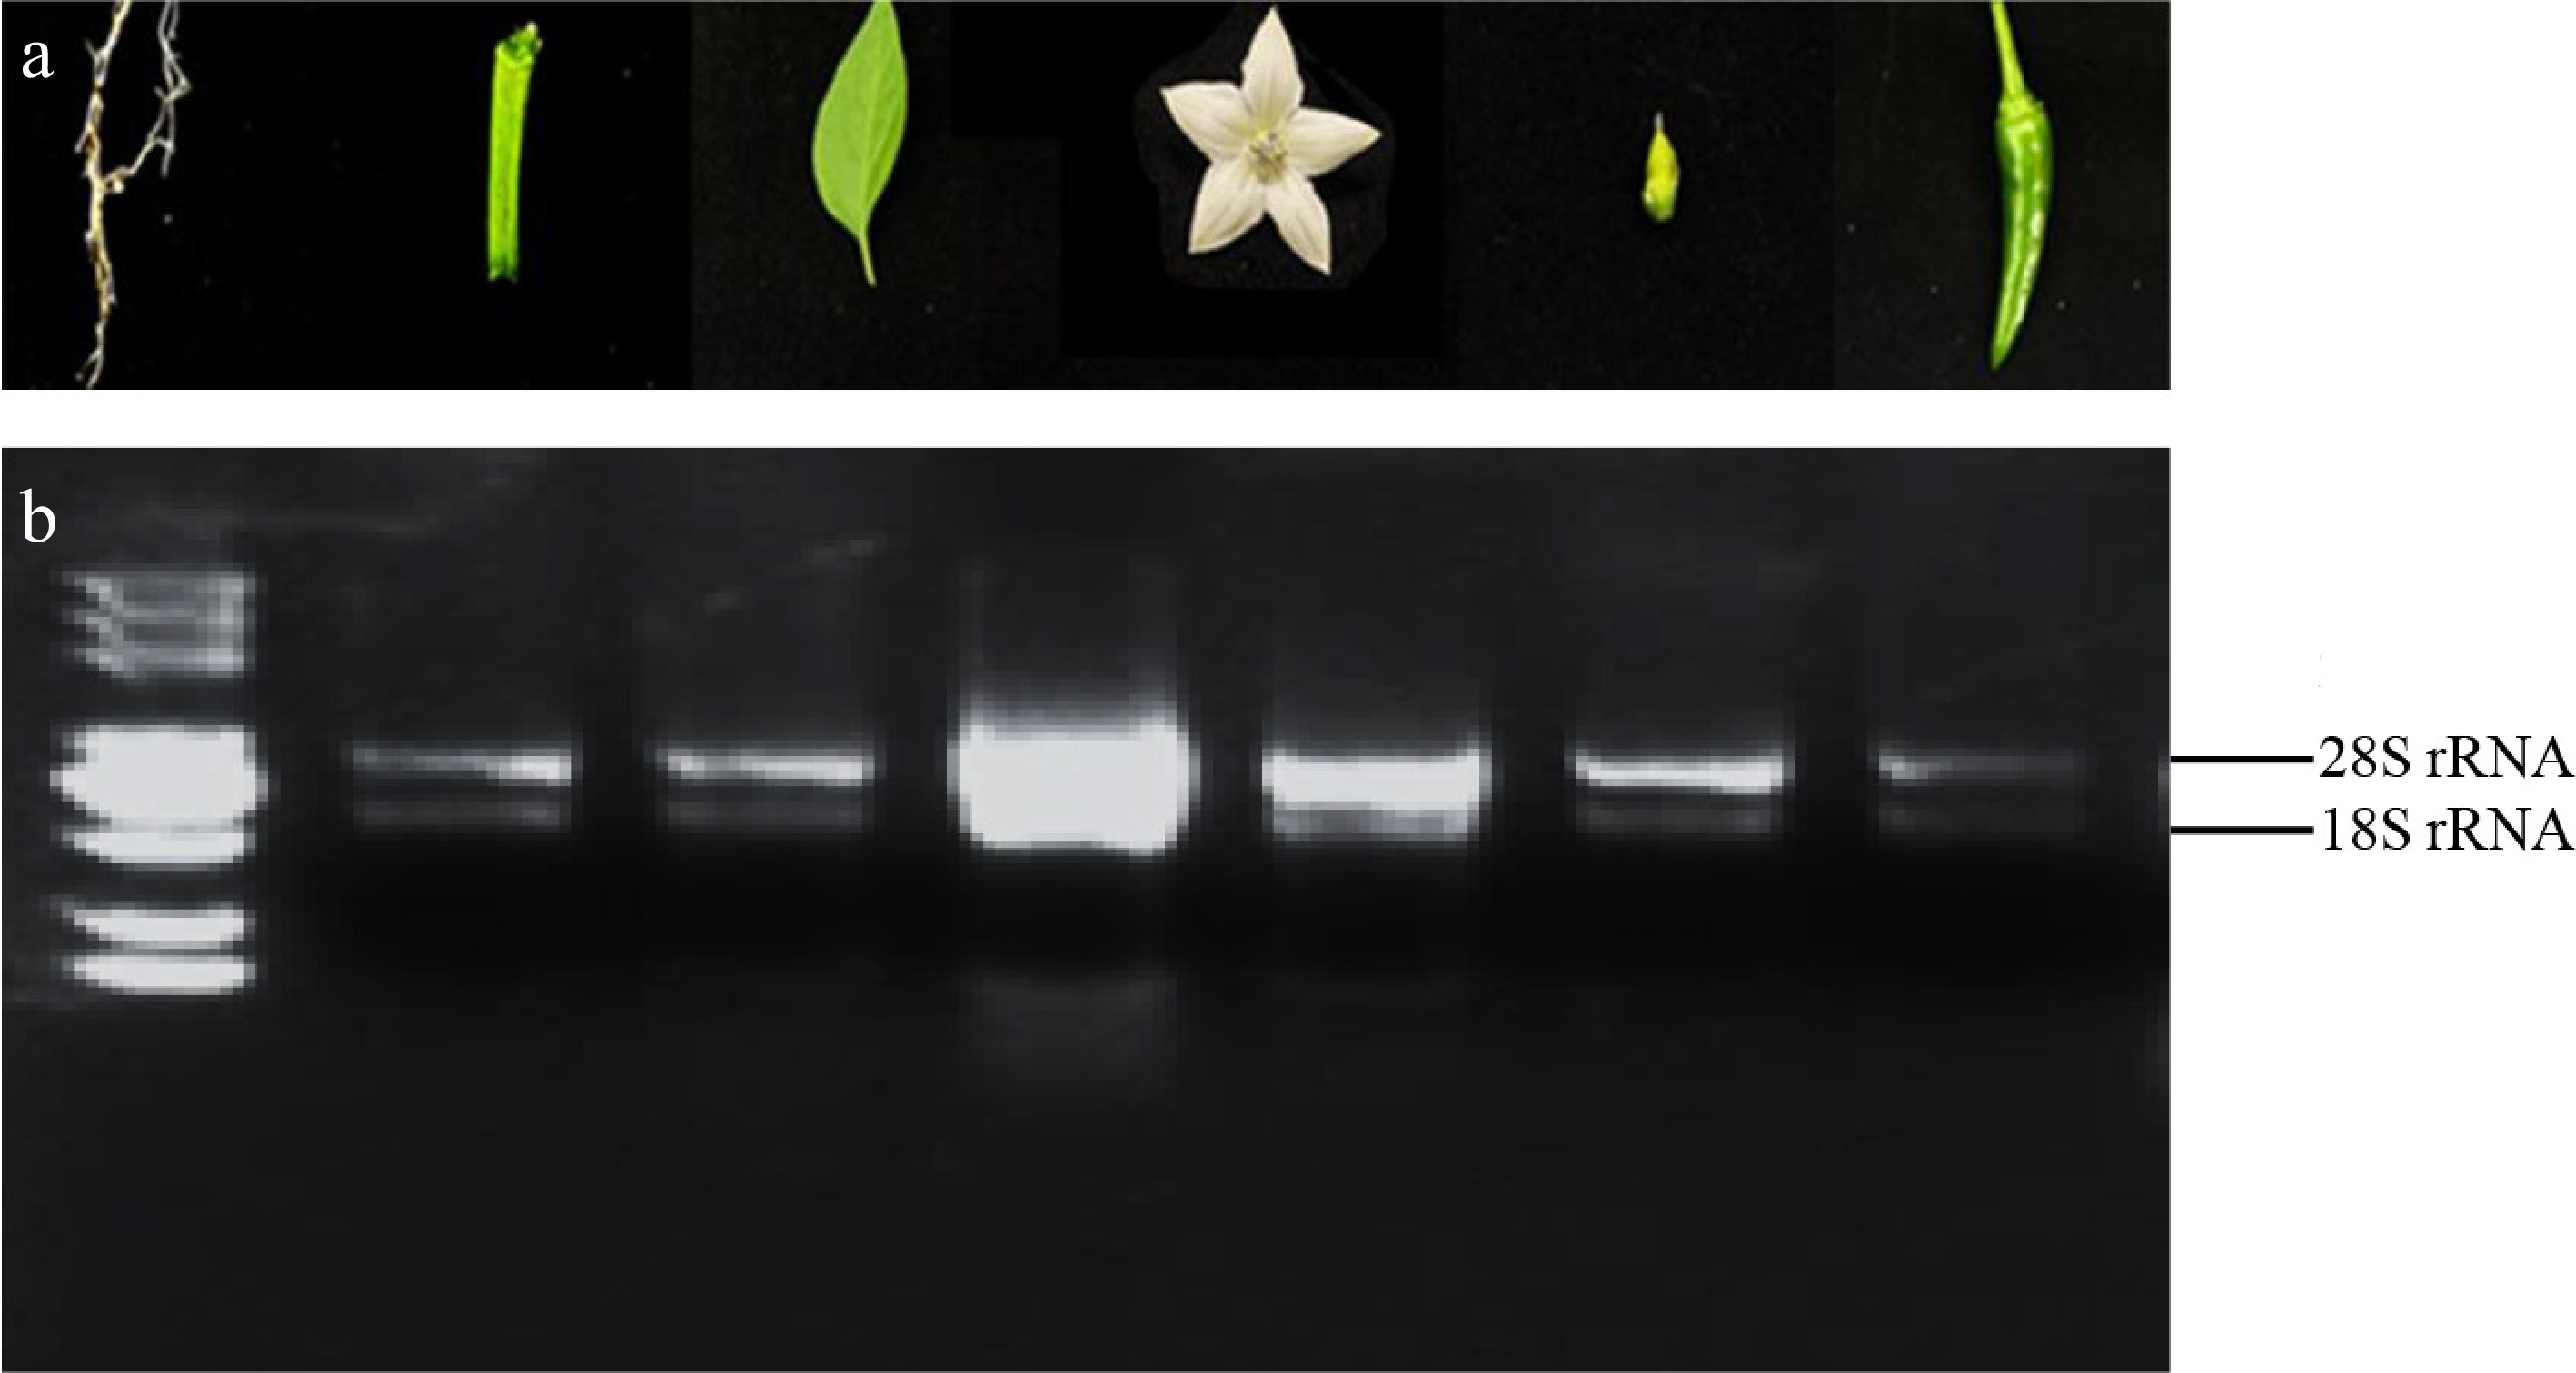
Figure 3.
RNA samples and quality detection. (a) From left to right in turn is the six-leaf stage root, stems at six-leaf stage, six-leaf stage leaves, flowers on the day of anthesis, ovary at the flowering stage, fruits at the color-breaking stage. (b) The integrity of RNA was verified using 1.2% agarose gel electrophoresis, maintaining identical sample loading order to previous procedures.
-
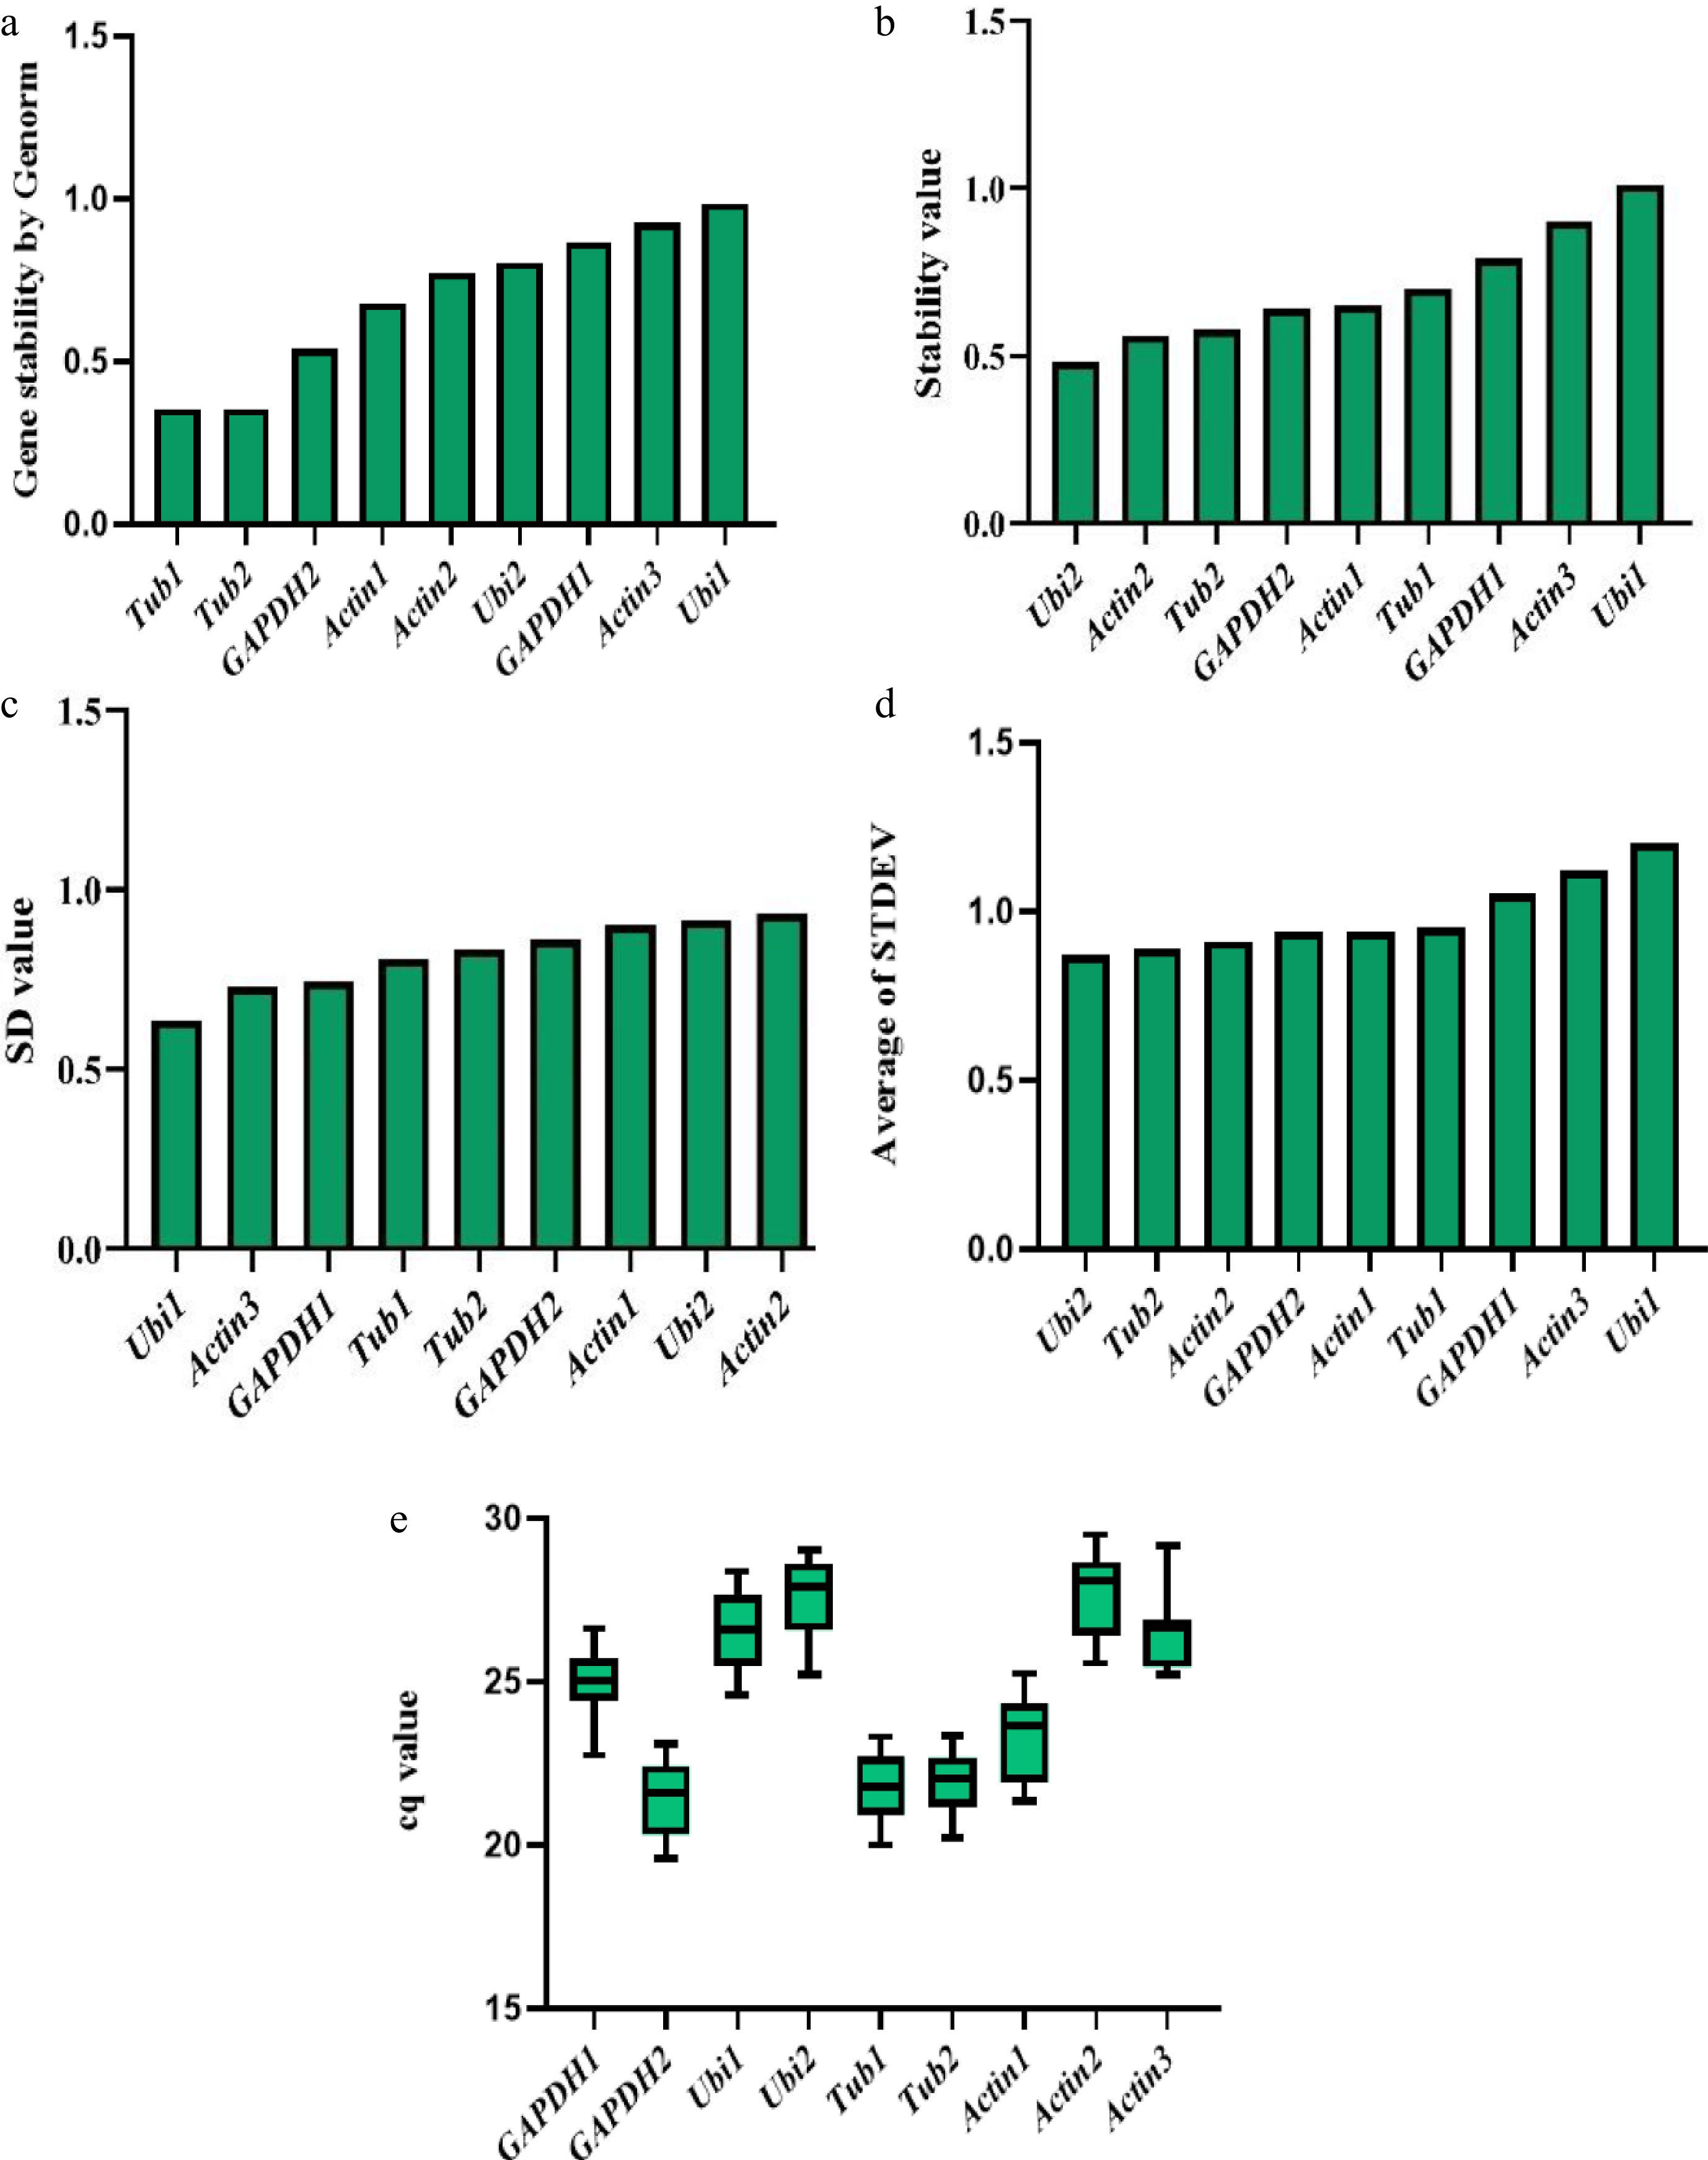
Figure 4.
Expression stability value of nine candidate reference genes calculated by five complementary algorithms or evaluation parameters. (a) Genorm analysis of fluorescence quantitative data of nine genes. (b) Normfinder analysis of fluorescence quantitative data of nine genes. (c) Bestkeeper analysis of fluorescence quantitative data of nine genes. (d) ΔCt analysis of fluorescence quantitative data of nine genes. (e) The Cq values of fluorescence quantitative data of nine genes.
-
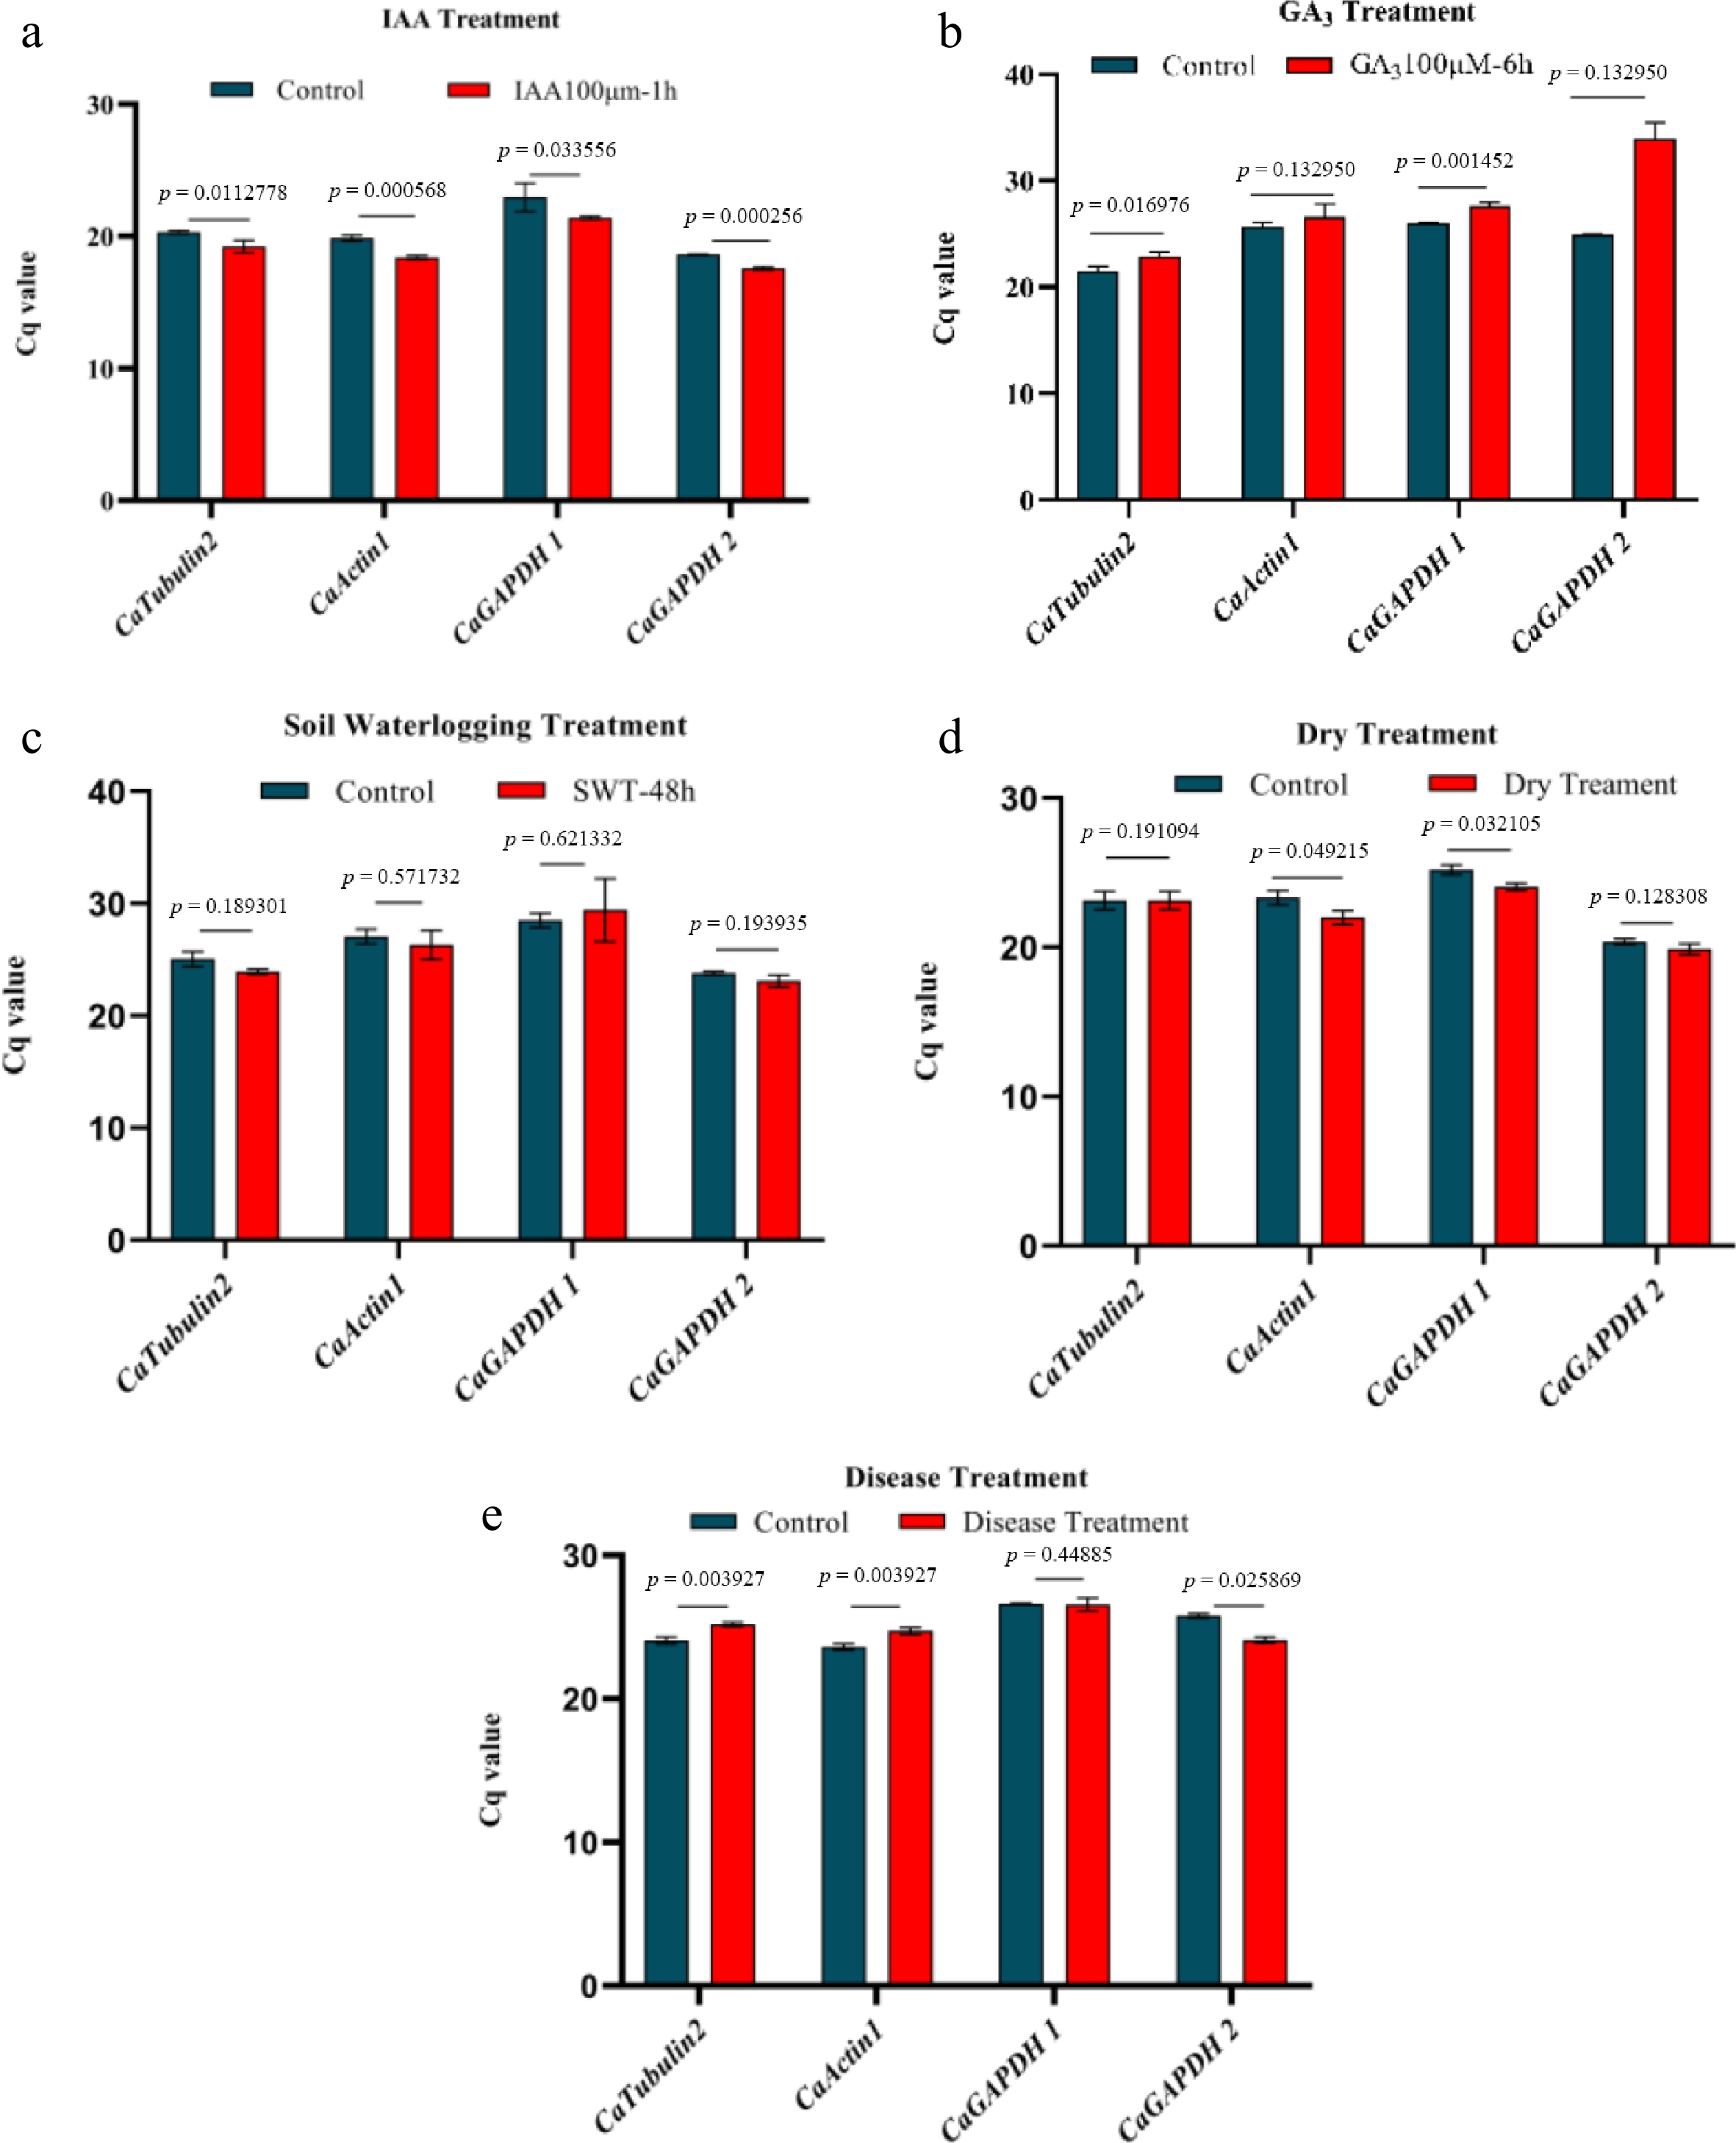
Figure 5.
Stability evaluation of four reference genes under hormonal and environmental stress. (a) The stability of four reference genes under IAA treatment. (b) The stability of four reference genes under GA3 treatment. (c) The stability of four reference genes under waterlogging treatment. (d) The stability of four reference genes under drought treatment. (e) The stability of four reference genes under disease treatment. Significance analysis was performedusing the two-tail Student's test (p < 0.05 indicated a significant difference).
-
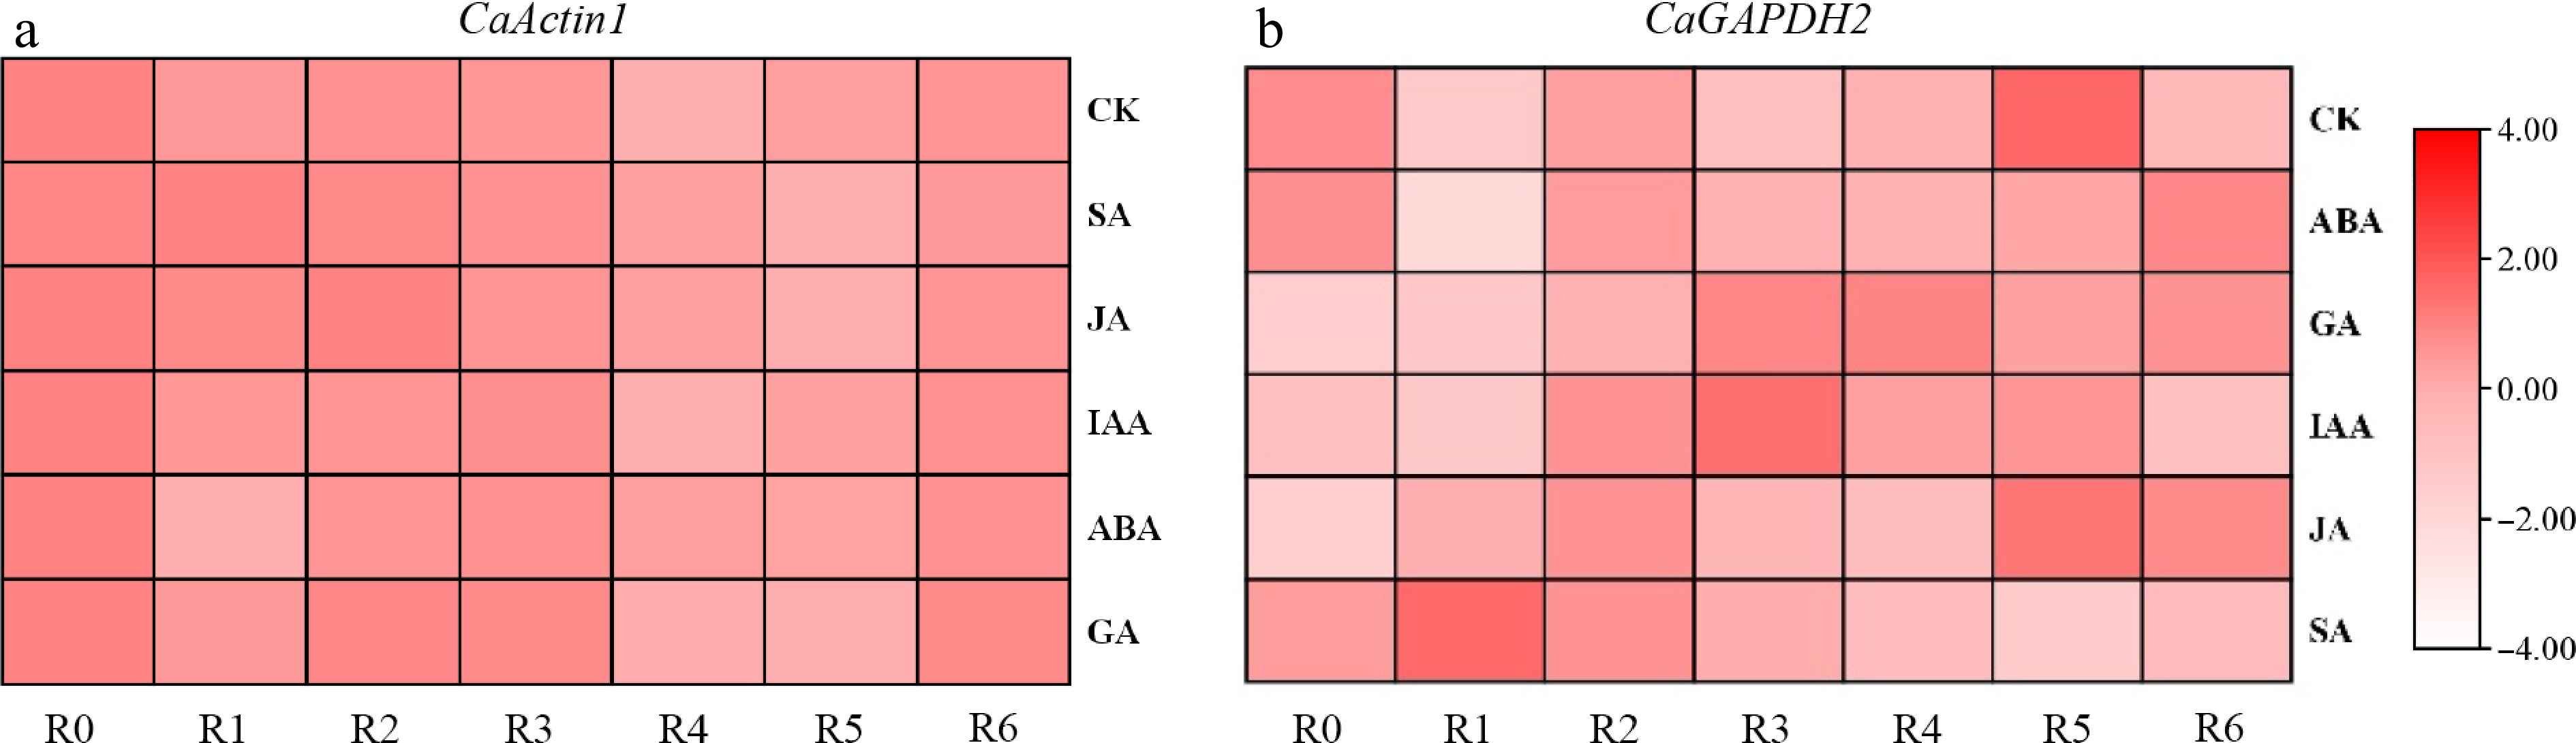
Figure 6.
Analysis of expression stability of CaActin1 and CaGAPDH2 using published pepper data. (a) The expression of CaActin1 in roots under different hormone treatments. (b) The expression of CaGAPDH2 in roots under different stresses.
-
Table 1.
Published commonly used pepper reference.
-
Rank GeNorm analysis NormFinder analysis BestKeeper analysis ΔCᴛ Cq value Comprehensive rank 1 CaTubulin1 CaUbiquitin2 CaTubulin2 CaUbiquitin2 CaGAPDH2 CaTubulin2 2 CaTubulin2 CaActin2 CaGAPDH1 CaTubulin2 CaTubulin2 CaGAPDH2 3 CaGAPDH2 CaTubulin2 CaTubulin1 CaActin2 CaTubulin1 CaActin1 4 CaActin1 CaGAPDH2 CaActin3 CaGAPDH2 CaActin1 CaGAPDH1 5 CaGAPDH1 CaActin1 CaGAPDH2 CaActin1 CaGAPDH1 CaTubulin1 6 CaActin2 CaUbiquitin1 CaUbiquitin2 CaTubulin1 CaUbiquitin1 CaActin2 7 CaUbiquitin2 CaGAPDH1 CaUbiquitin1 CaGAPDH1 CaActin3 CaUbiquitin2 8 CaUbiquitin1 CaActin3 CaActin1 CaActin3 CaActin3 CaActin3 9 CaActin3 CaUbiquitin1 CaActin2 CaUbiquitin1 CaUbiquitin2 CaUbiquitin1 Table 2.
Comprehensive ranking of five complementary algorithms or evaluation parameters.
Figures
(6)
Tables
(2)