-
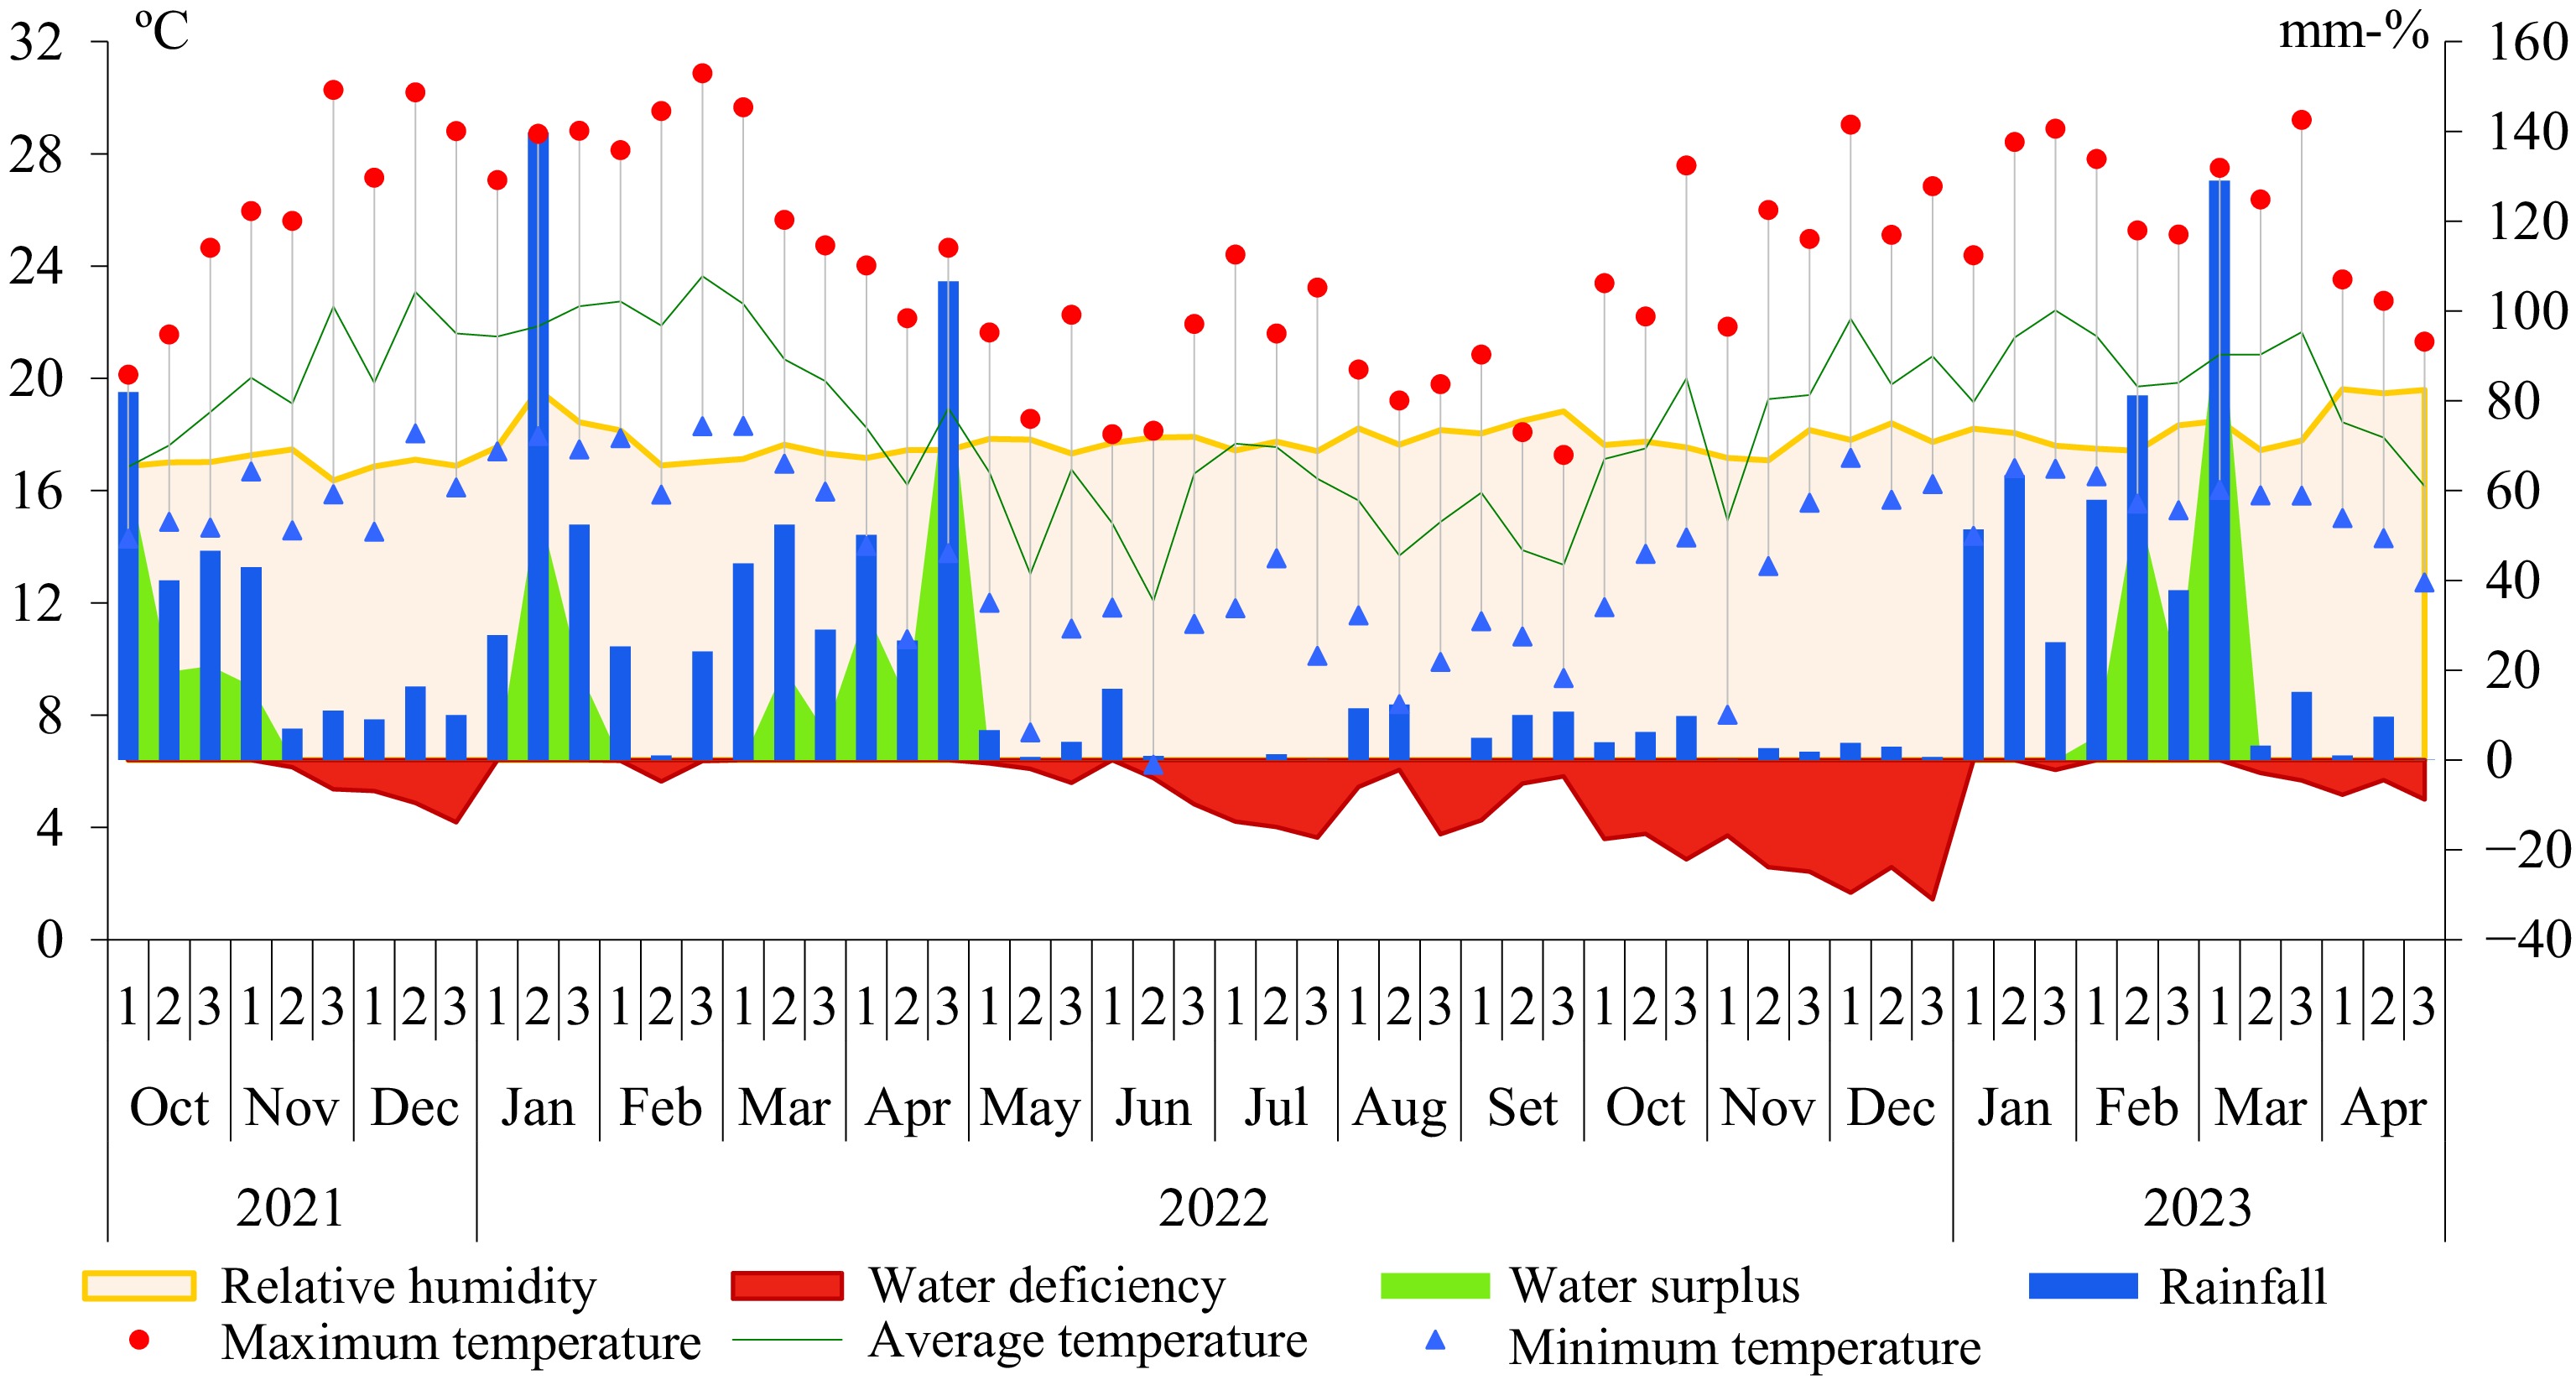
Figure 1.
Climatological data (relative humidity, rainfall, maximum temperature, average temperature, and minimum temperature) and water balance (water deficiency and water surplus) every 10 days during crop development in the field from 2021 to 2023.
-
Crop rotation Year 1 (2017–2018) Year 2 (2018–2019) Year 3 (2019–2020) Year 4 (2020–2021) Year 5 (2021–2022) Year 6 (2022–2023) I W S W S W S W S W S W S II BO M W S W S BO M W S W S III CAN M W S BAR S CAN M W S BAR S IV BO + RY M BO + RY M BO + RY S VET M W S W S W, wheat (Triticum aestivum L.); S, soybean (Glycine max [L.] Merrill); BO, black oat (Avena strigosa Schreb); RY, ryegrass (Lolium multiflorum Lam.); M, maize (Zea mays L.); CAN, canola (Brassica napus L. var. oleifera); BAR, barley (Hordeum vulgare L.); VET, vetch (Vicia sativa L.). Table 1.
Crop rotation treatments in the period from 2017 to 2023.
-
Growing season I II III IV S TD S TD S TD S TD 2017−2018 Winter 300B 110A 0 0 240B 110A 0 0 Summer 300C 0 300B 250A 300B 250A 300B 250A 2018−2019 Winter 270B 100A 270B 100A 270B 100A 0 0 Summer 270B 0 270B 0 270B 0 300B 200A 2019−2020 Winter 250D 100A 250D 100A 250D 100A 0 0 Summer 270B 0 270B 0 270B 0 270B 0 2020−2021 Winter 280B 100A 0 0 280B 100E + 50A 0 0 Summer 270B 0 300B 250A 300B 250A 300B 250A 2021−2022 Winter 296D 200A 296D 200A 296D 200A 296D 200A Summer 300B 0 300B 0 300B 0 300B 0 2022−2023 Winter 300D 111A 300D 111A 300D 111A 296D 111A Summer 300D 0 300D 0 300D 0 300D 0 S, sowing; TD, top dressing; A urea; B formulation 04–30–10 N–P2O5–K2O; C formulation 02–28–20 N–P2O5–K2O; D formulation 10–30–10 N–P2O5–K2O; E ammonium sulfate. Table 2.
Fertilization used in different crop rotations (I, II, III, IV) under a no-till system in the period from 2017 to 2023 (kg ha−1).
-
Attribute Depth
(cm)Phospho-gypsum Crop rotation Average I II III IV pH (CaCl2) 0−5 Without 5.2 5.2 5.0 5.2 5.2 a With 4.9 5.0 5.2 5.1 5.1 a Average 5.0 A 5.1 A 5.1 A 5.2 A 5−10 Without 4.7 4.8 4.7 4.8 4.7 a With 4.7 4.8 4.7 4.7 4.7 a Average 4.7 A 4.8 A 4.7 A 4.7 A 10−20 Without 4.4 4.5 4.5 4.5 4.5 a With 4.4 4.4 4.4 4.5 4.4 a Average 4.4 A 4.5 A 4.4 A 4.5 A 20−40 Without 4.6 4.6 4.5 4.6 4.6 a With 4.5 4.6 4.5 4.6 4.6 a Average 4.5 A 4.6 A 4.5 A 4.6 A Al3+
(cmolc dm−3)0−5 Without 0.16 0.18 0.30 0.15 0.20 a With 0.13 0.15 0.21 0.12 0.15 b Average 0.15 B 0.16 B 0.25 A 0.13 B 5−10 Without 0.80 0.50 0.59 0.53 0.60 a With 0.45 0.43 0.50 0.51 0.47 b Average 0.62 A 0.46 A 0.55 A 0.52 A 10−20 Without 0.70 0.74 0.76 0.87 0.76 a With 0.61 0.56 0.65 0.80 0.65 a Average 0.65 A 0.65 A 0.70 A 0.83 A 20−40 Without 0.73 0.71 0.68 0.54 0.67 a With 0.77 0.74 0.75 0.66 0.73 a Average 0.75 A 0.72 A 0.71 A 0.60 A Al3+ saturation
(%)0−5 Without 2.1 2.1 3.8 1.6 2.4 a With 1.8 1.8 2.5 1.4 1.9 b Average 2.0 B 2.0B 3.2 A 1.5 B 5−10 Without 13.9 9.3 9.2 8.5 10.2 a With 7.3 7.4 8.2 9.2 8.0 b Average 10.6 A 8.4 A 8.7 A 8.9 A 10−20 Without 17.7 16.2 17.3 18.7 17.5 a With 13.8 13.7 14.6 17.6 14.9 a Average 15.8 A 15.0 A 16.0 A 18.2 A 20−40 Without 18.9 18.2 18.2 14.8 17.5 a With 20.4 18.6 18.5 16.9 18.6 a Average 19.7 A 18.4 A 18.4 A 15.9 A Mean values followed by the same letter (uppercase for crop rotation; lowercase for application of phosphogypsum) do not differ significantly according to the Tukey test at 5% significance. Table 3.
Soil pH (0.01 mol L−1 CaCl2), exchangeable Al3+ content, and Al3+ saturation at different depths as affected by crop rotations and application of phosphogypsum in a no-till system of the soil, at different depths, considering crop rotations and the use of phosphogypsum in a no-till system.
-
Attribute Depth
(cm)Phospho-
gypsumCrop rotation Average I II III IV Ca2+
(cmolc dm−3)0−5 Without 5.4 5.6 4.8 5.9 5.4 a With 5.0 5.9 6.2 6.1 5.8 a Average 5.2 B 5.8 AB 5.5 AB 6.0 A 5−10 Without 3.4 3.2 3.2 3.3 3.3 a With 3.3 3.2 3.4 3.0 3.2 a Average 3.4 A 3.2 A 3.3 A 3.2 A 10−20 Without 2.1 2.3 2.3 2.3 2.3 a With 2.4 2.3 2.4 2.4 2.4 a Average 2.3 A 2.3 A 2.4 A 2.4 A 20−40 Without 1.9 2.0 2.0 2.1 2.0 a With 1.8 2.1 2.0 2.2 2.0 a Average 1.9 A 2.1 A 2.0 A 2.2 A Mg2+
(cmolc dm−3)0−5 Without 2.0 2.1 2.0 2.5 2.2 a With 1.9 2.1 1.7 2.2 2.0 a Average 2.0 A 2.1 A 1.9 A 2.4 A 5−10 Without 1.2 2.0 2.2 2.3 1.9 a With 1.6 1.8 1.8 2.0 1.8 a Average 1.4 A 1.9 A 2.0 A 2.2 A 10−20 Without 1.0 1.3 1.0 1.4 1.2 a With 1.3 1.3 1.2 1.3 1.3 a Average 1.2 A 1.3 A 1.1 A 1.4 A 20−40 Without 1.1 1.2 0.9 0.9 1.0 a With 1.0 1.0 1.2 1.0 1.1 a Average 1.1 A 1.1 A 1.1 A 1.0 A K+
(cmolc dm−3)Without 0.67 0.71 0.64 0.75 0.69 a 0−5 With 0.52 0.65 0.58 0.60 0.59 b Average 0.59 B 0.68 A 0.61 AB 0.67 A Without 0.32 0.37 0.40 0.29 0.35 b 5−10 With 0.36 0.45 0.41 0.38 0.40 a Average 0.34 A 0.41 A 0.41 A 0.34 A Without 0.19 0.22 0.31 0.20 0.23 a 10−20 With 0.26 0.23 0.25 0.19 0.23 a Average 0.22 A 0.22 A 0.28 A 0.20 A Without 0.15 0.13 0.16 0.09 0.13 b 20−40 With 0.22 0.18 0.18 0.14 0.18 a Average 0.18 A 0.16 B 0.17 AB 0.11 C Mean values followed by the same letter (uppercase for crop rotation; lowercase for application of phosphogypsum) do not differ significantly according to the Tukey test at 5% significance. Table 4.
Exchangeable Ca2+, Mg2+, and K+ contents at different soil depths as affected by crop rotations and application of phosphogypsum in a no-till system.
-
Attribute Depth
(cm)Phosphogypsum Crop rotation Average I II III IV Organic C
(g dm−3)0−5 Without 34.2 34.8 33.3 37.7 35.0 a With 33.6 33.2 33.3 35.5 33.9 a Average 33.9 A 34.0 A 33.3 A 36.6 A 5−10 Without 30.3 31.5 32.9 29.9 31.2 a With 31.4 31.8 32.1 30.2 31.4 a Average 30.9 A 31.7 A 32.5 A 30.1 A 10−20 Without 25.4 28.4 25.9 29.1 27.2 a With 25.8 26.2 26.2 27.5 26.4 a Average 25.6 B 27.3 AB 26.1 B 28.3 A 20−40 Without 22.5 24.9 23.5 25.4 24.1 a With 23.0 25.4 24.5 25.8 24.7 a Average 22.8 B 25.2 A 24.0 AB 25.6 A P
(mg dm−3)0−5 Without 32.2 38.8 27.5 23.9 30.6 b With 48.1 34.5 40.8 30.8 38.6 a Average 40.2 A 36.7 A 34.2 AB 27.4 B 5−10 Without 27.2 24.0 32.3 28.6 28.0 a With 21.3 24.5 27.3 23.3 24.1 a Average 24.3 A 24.3 A 29.8 A 26.0 A 10−20 Without 8.6 6.7 7.2 10.2 8.2 a With 6.3 8.1 9.0 7.1 7.6 a Average 7.5 A 7.4 A 8.1 A 8.7 A 20−40 Without 5.0 3.7 3.5 3.0 3.8 a With 4.3 3.0 3.8 3.4 3.6 a Average 4.7 A 3.4 A 3.7 A 3.2 A SO4-S
(mg dm−3)Without 51.5 Ab 45.6 Ab 50.0 Ab 42.5 Ab 47.4 0-5 With 78.2 Ba 74.2 Ba 84.1 Ba 135.4 Aa 93.0 Average 64.9 59.9 67.1 89.0 Without 82.3 86.5 78.4 74.9 80.5 b 5−10 With 185.5 162.7 171.6 189.2 177.3 a Average 133.9 A 124.6 A 125.0 A 132.1 A Without 124.3 100.6 110.1 107.6 110.7 b 10-20 With 217.4 170.3 193.1 190.6 192.9 a Average 170.9 A 135.5 A 151.6 A 149.1 A Without 206.0 199.3 218.1 141.5 191.2 b 20-40 With 262.4 254.8 274.0 227.5 254.7 a Average 234.2 A 227.1 A 246.1 A 184.5 B Mean values followed by the same letter (uppercase for crop rotation; lowercase for application of phosphogypsum) do not differ significantly according to Tukey's test at 5% significance. Table 5.
Organic C and extractable P (Mehlich-1) and SO4-S (0.01 mol L−1 calcium phosphate) contents at different soil depths as affected by crop rotations and application of phosphogypsum in a no-till system.
-
Phosphogypsum Crop rotation Average I II III IV N, leaf (g kg−1) Without 43.7 37.1 42.0 43.9 41.7 a With 44.4 40.1 41.2 42.6 42.1 a Average 44.1 A 38.6 B 41.6 AB 43.3 A P, leaf (g kg−1) Without 5.1 4.8 5.1 4.6 4.9 b With 5.8 5.6 6.0 5.7 5.8 a Average 5.5 A 5.2 A 5.6 A 5.2 A K, leaf (g kg−1) Without 31.4 32.9 32.6 31.0 32.0 a With 31.3 34.0 31.3 30.0 31.7 a Average 31.4 A 33.5 A 32.0 A 30.5 A Ca, leaf (g kg−1) Without 8.5 8.3 8.5 8.7 8.5 b With 9,4 9,3 10,4 9,3 9,6 a Average 9,0 A 8,8 A 9,5 A 9,0 A Mg, leaf (g kg−1) Without 3,5 3,2 3,4 3,5 3,4 a With 2,8 2,6 2,9 2,9 2,8 b Average 3,2 A 2,9 B 3,2 A 3,2 A S, leaf (g kg−1) Without 2.6 2.2 2.2 2.8 2.5 b With 2.6 2.8 2.8 3.2 2.9 a Average 2.6 AB 2.5 B 2.5 B 3.0 A Cu, leaf (mg kg−1) Without 10.2 11.8 10.8 7.7 10.1 a With 10.5 10.4 9.9 6.4 9.3 a Average 10.4 AB 11.1 A 10.4 AB 7.1 B Mn, leaf (mg kg−1) Without 60.8 59.8 63.1 53.3 59.3 a With 69.2 69.0 64.3 55.5 64.5 a Average 65.0 A 64.4 AB 63.7 AB 54.4 B Fe, leaf (mg kg−1) Without 93.0 92.5 93.6 93.1 93.1 a With 95.9 91.9 96.7 85.1 92.4 a Average 94.5 A 92.2 A 95.2 A 89.1 A Zn, leaf (mg kg−1) Without 29.2 29.7 31.7 31.2 30.5 b With 33.5 31.7 33.2 33.0 32.9 a Average 31.4 A 30.7 A 32.5 A 32.1 A Mean values followed by the same letter (uppercase for crop rotation; lowercase for application of phosphogypsum) do not differ significantly according to the Tukey test at 5%. Table 6.
Leaf nutrient contents of soybean in 2021–2022 as affected by crop rotations and application of phosphogypsum in a no-till system.
-
Phosphogypsum Crop rotation Average I II III IV 2021−2022 (kg ha−1) Without 3,415 3,225 3,188 3,554 3,346 b With 3,685 3,742 3,390 3,892 3,677 a Average 3,550 AB 3,484 AB 3,289 B 3,723 A 2022−2023 (kg ha−1) Without 4,370 4,697 4,179 4,004 4,312 b With 4,577 4,741 4,418 4,843 4,645 a Average 4,474 A 4,719 A 4,298 A 4,423 A Mean values followed by the same letter (uppercase for crop rotation; lowercase for application of phosphogypsum) do not differ significantly according to the Tukey test at 5% significance. Table 7.
Soybean grain yields in 2021–2022 and 2022–2023 as affected by crop rotations and application of phosphogypsum in a no-till system.
Figures
(1)
Tables
(7)