-
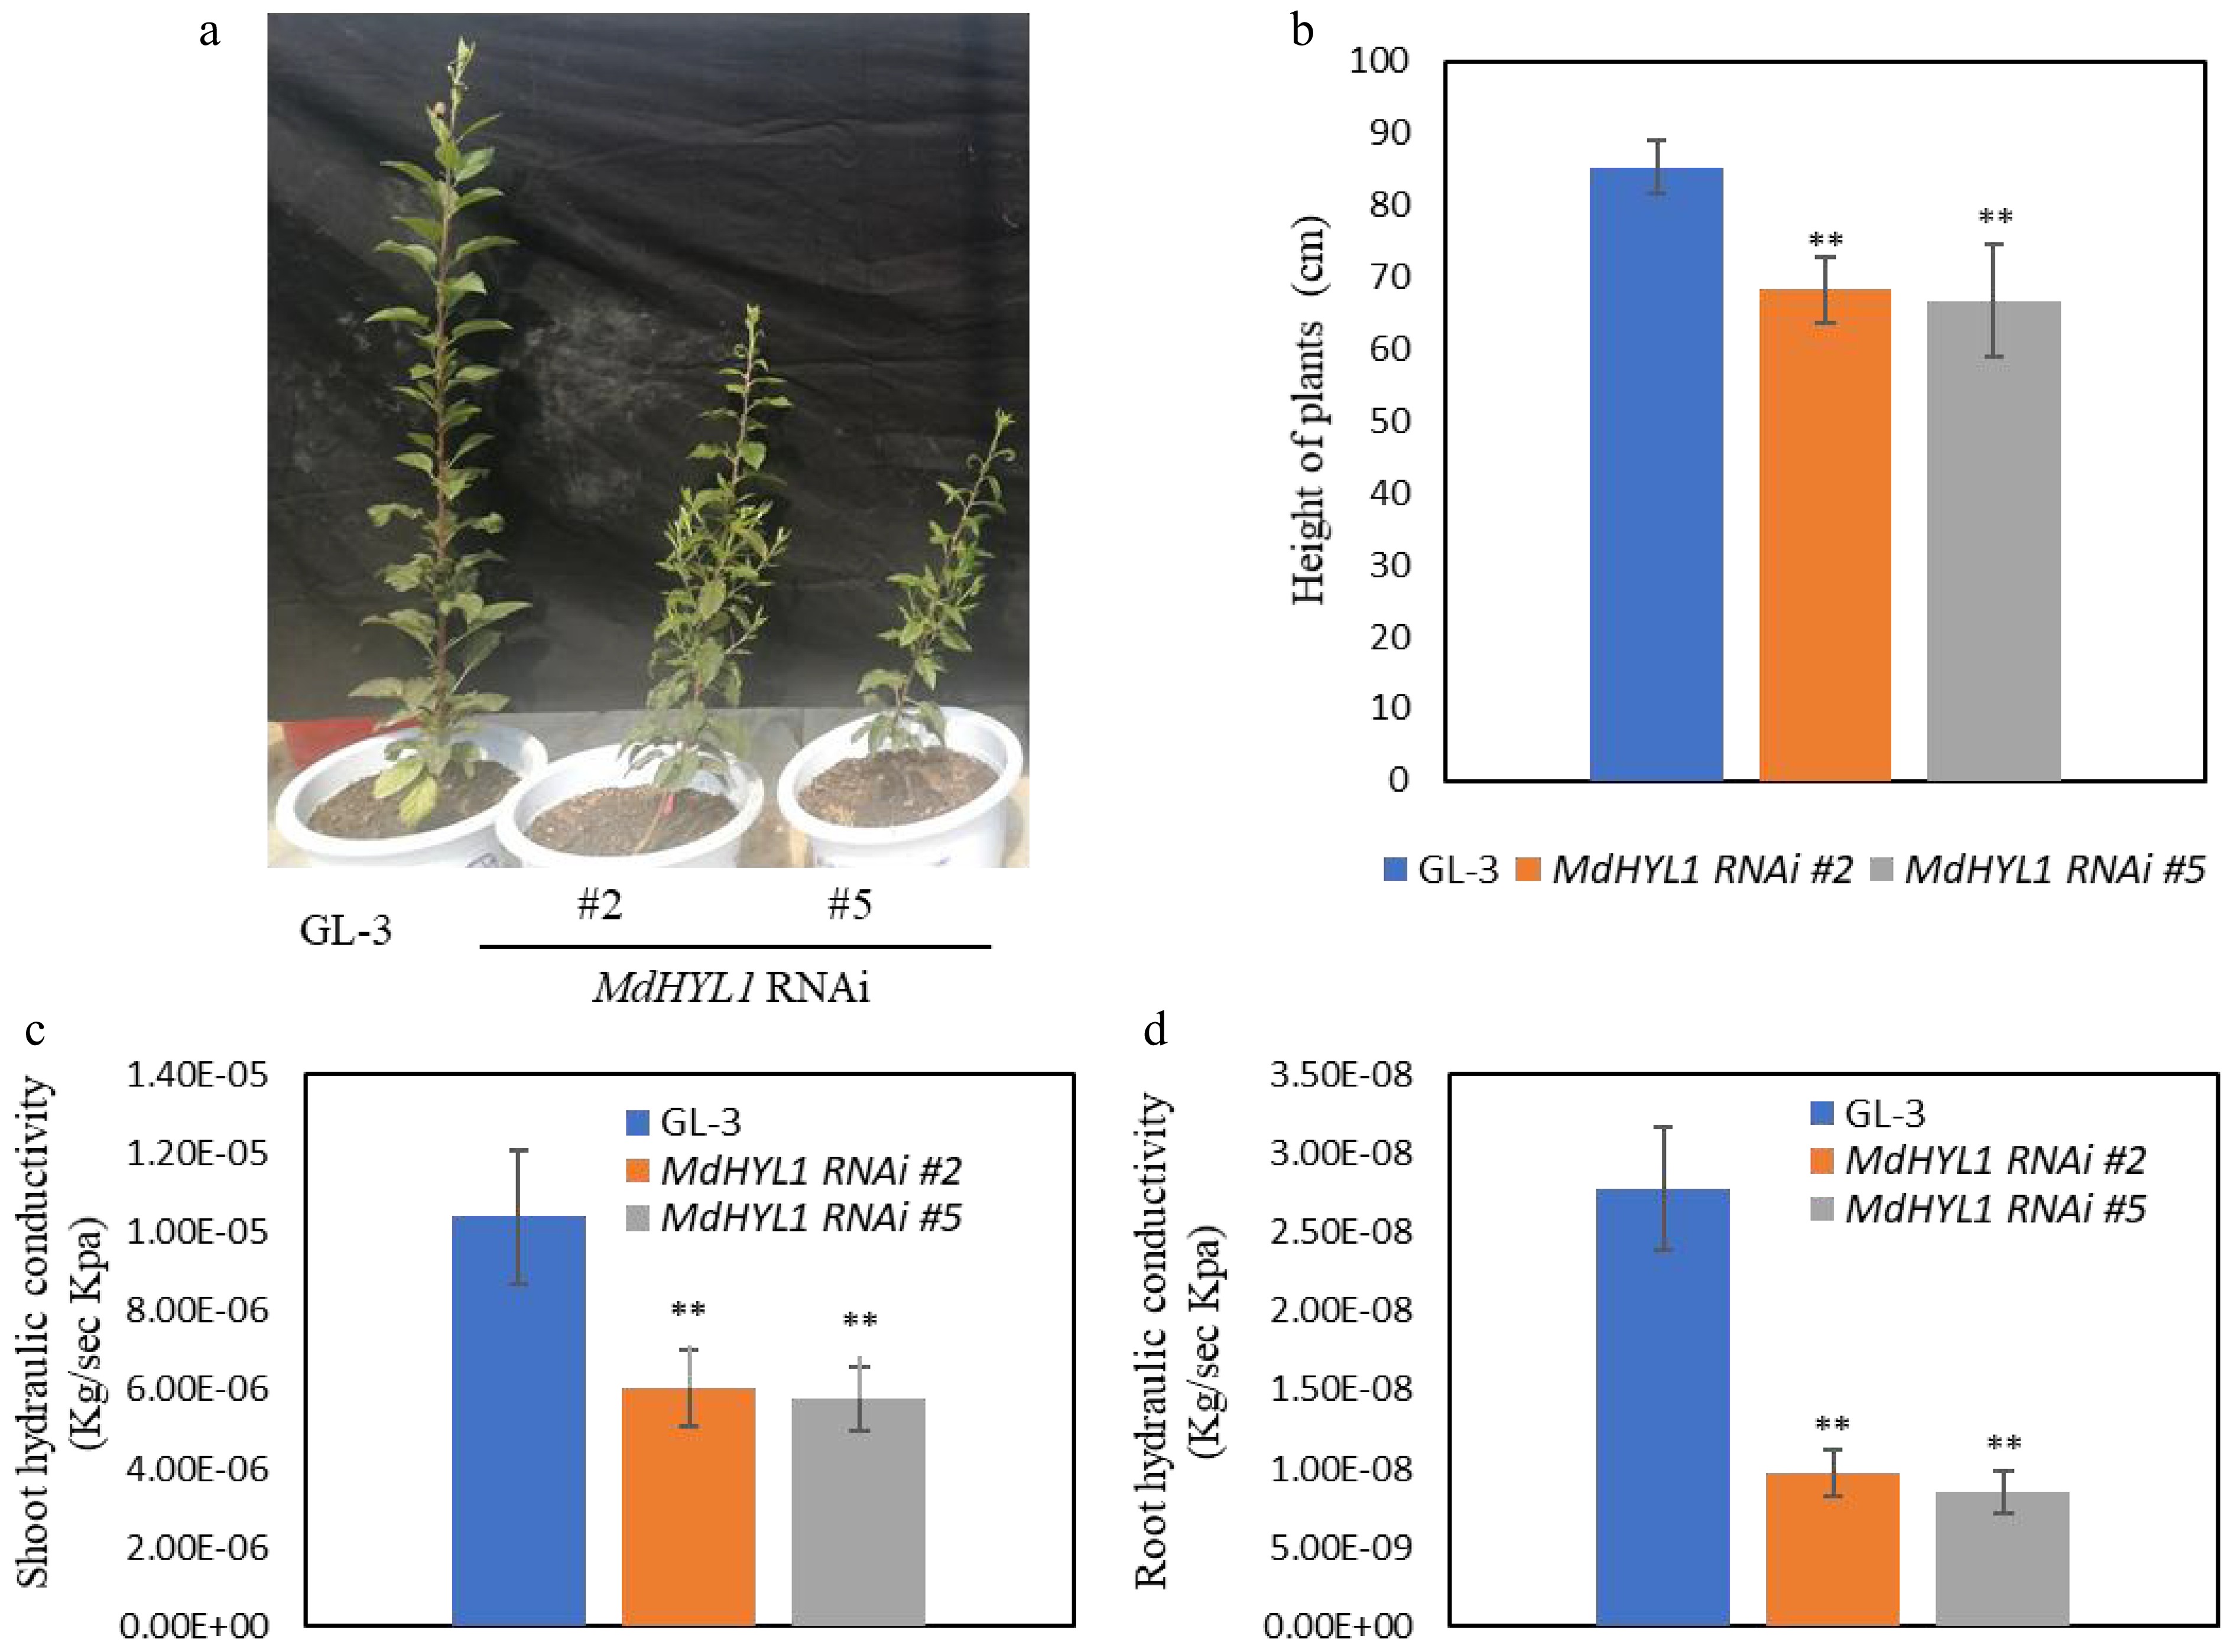
Figure 1.
MdHYL1 RNAi transgenic apple plants showed dwarfing phenotypes and reduced water transport capacity. (a) The morphology of wild-type GL-3 and two independent MdHYL1 RNAi plants (#2 and #5). (b) The plant height between GL-3 and MdHYL1 RNAi plants (#2 and #5). (c), (d) Hydraulic conductivity of shoot and root in GL-3 and MdHYL1 RNAi transgenic apple seedlings. The two-tailed t-test analyzed the differences between groups, all data are expressed as the mean ± SD (n = 6). *, p < 0.05; **, p < 0.01.
-
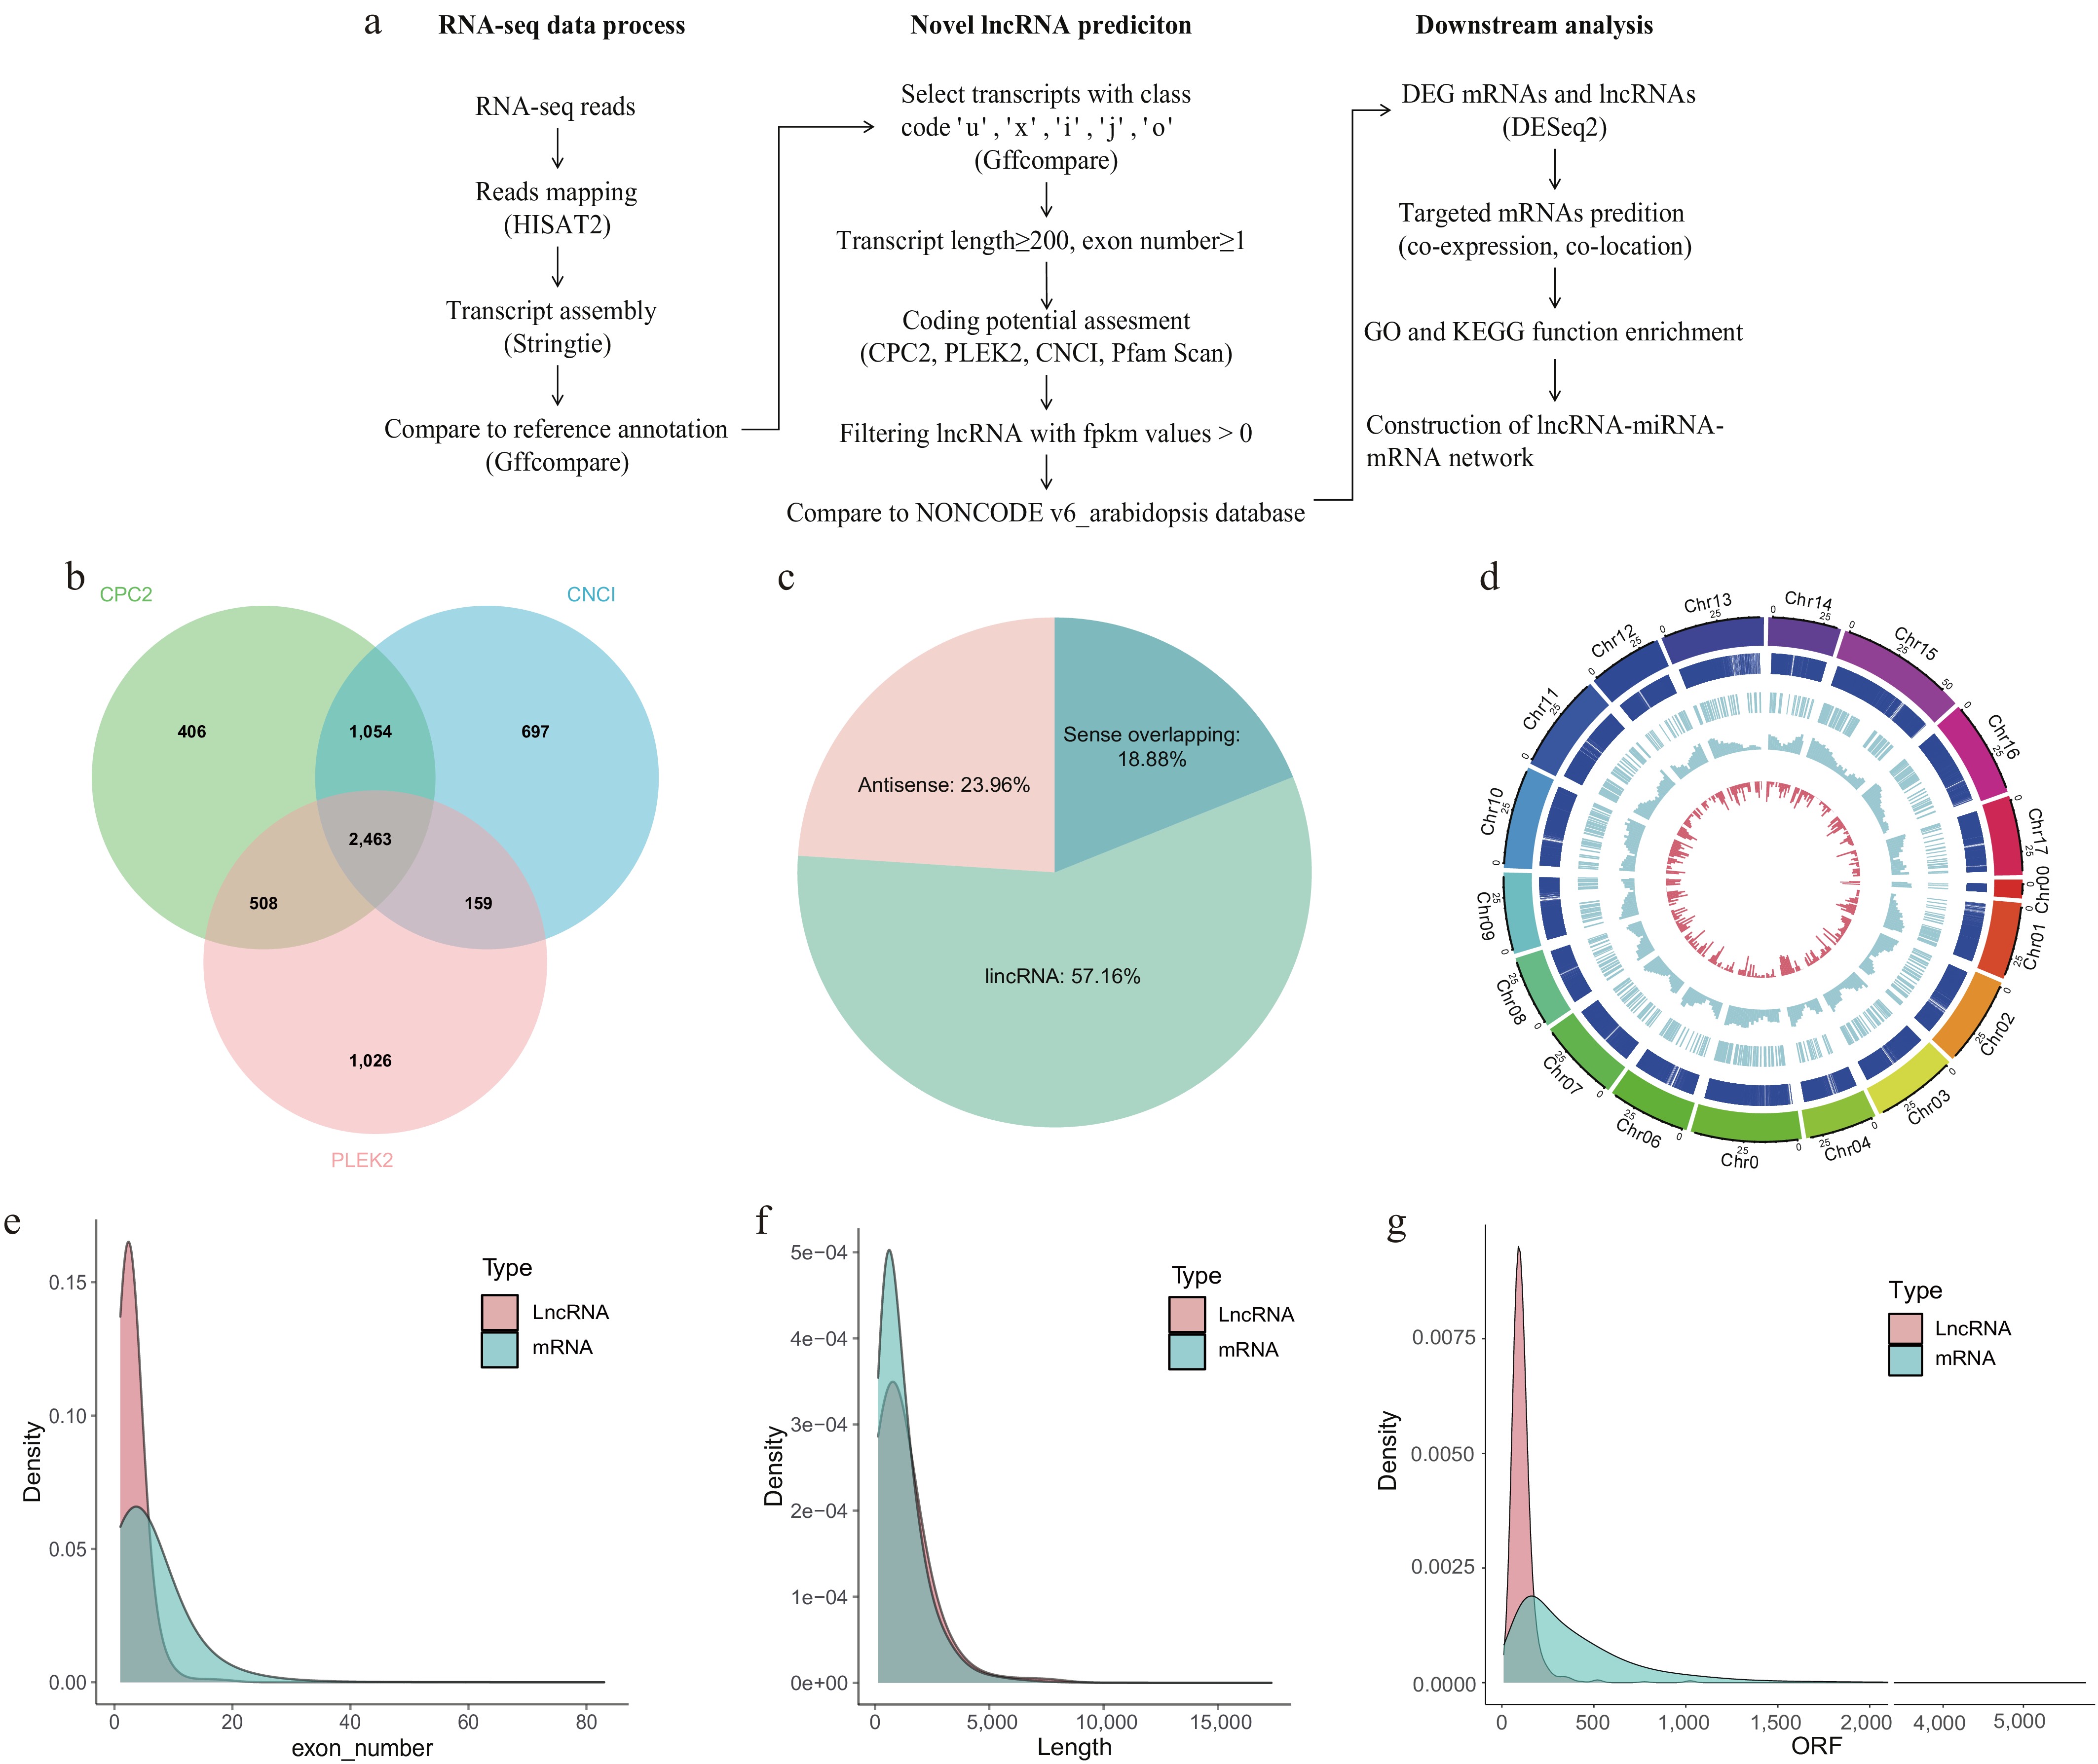
Figure 2.
Overview of lncRNA identification and characterization. (a) Pipline for RNA-seq data processing, novel lncRNA prediction, and downstream functional analyses. (b) The number of predicted lncRNAs supported by CPC2, CNCI, and PLEK2. (c) Classification of lncRNAs into different lncRNAs types. (Sense intronic lncRNAs were not found.) (d) Chromosomes 0−17 are displayed in different colors as the outermost thick track. The second track (outer to inner) shows mRNA locations, with each vertical dark blue line representing one gene. The third track indicates lncRNA locations. The fourth and fifth tracks display the abundance of mRNAs (blue columns), and lncRNAs (red columns), respectively, within 2 Mb physical bins across each chromosome. (e) The density of exon numbers, (f) sequence lengths, and (g) ORF lengths for mRNAs and lncRNAs.
-
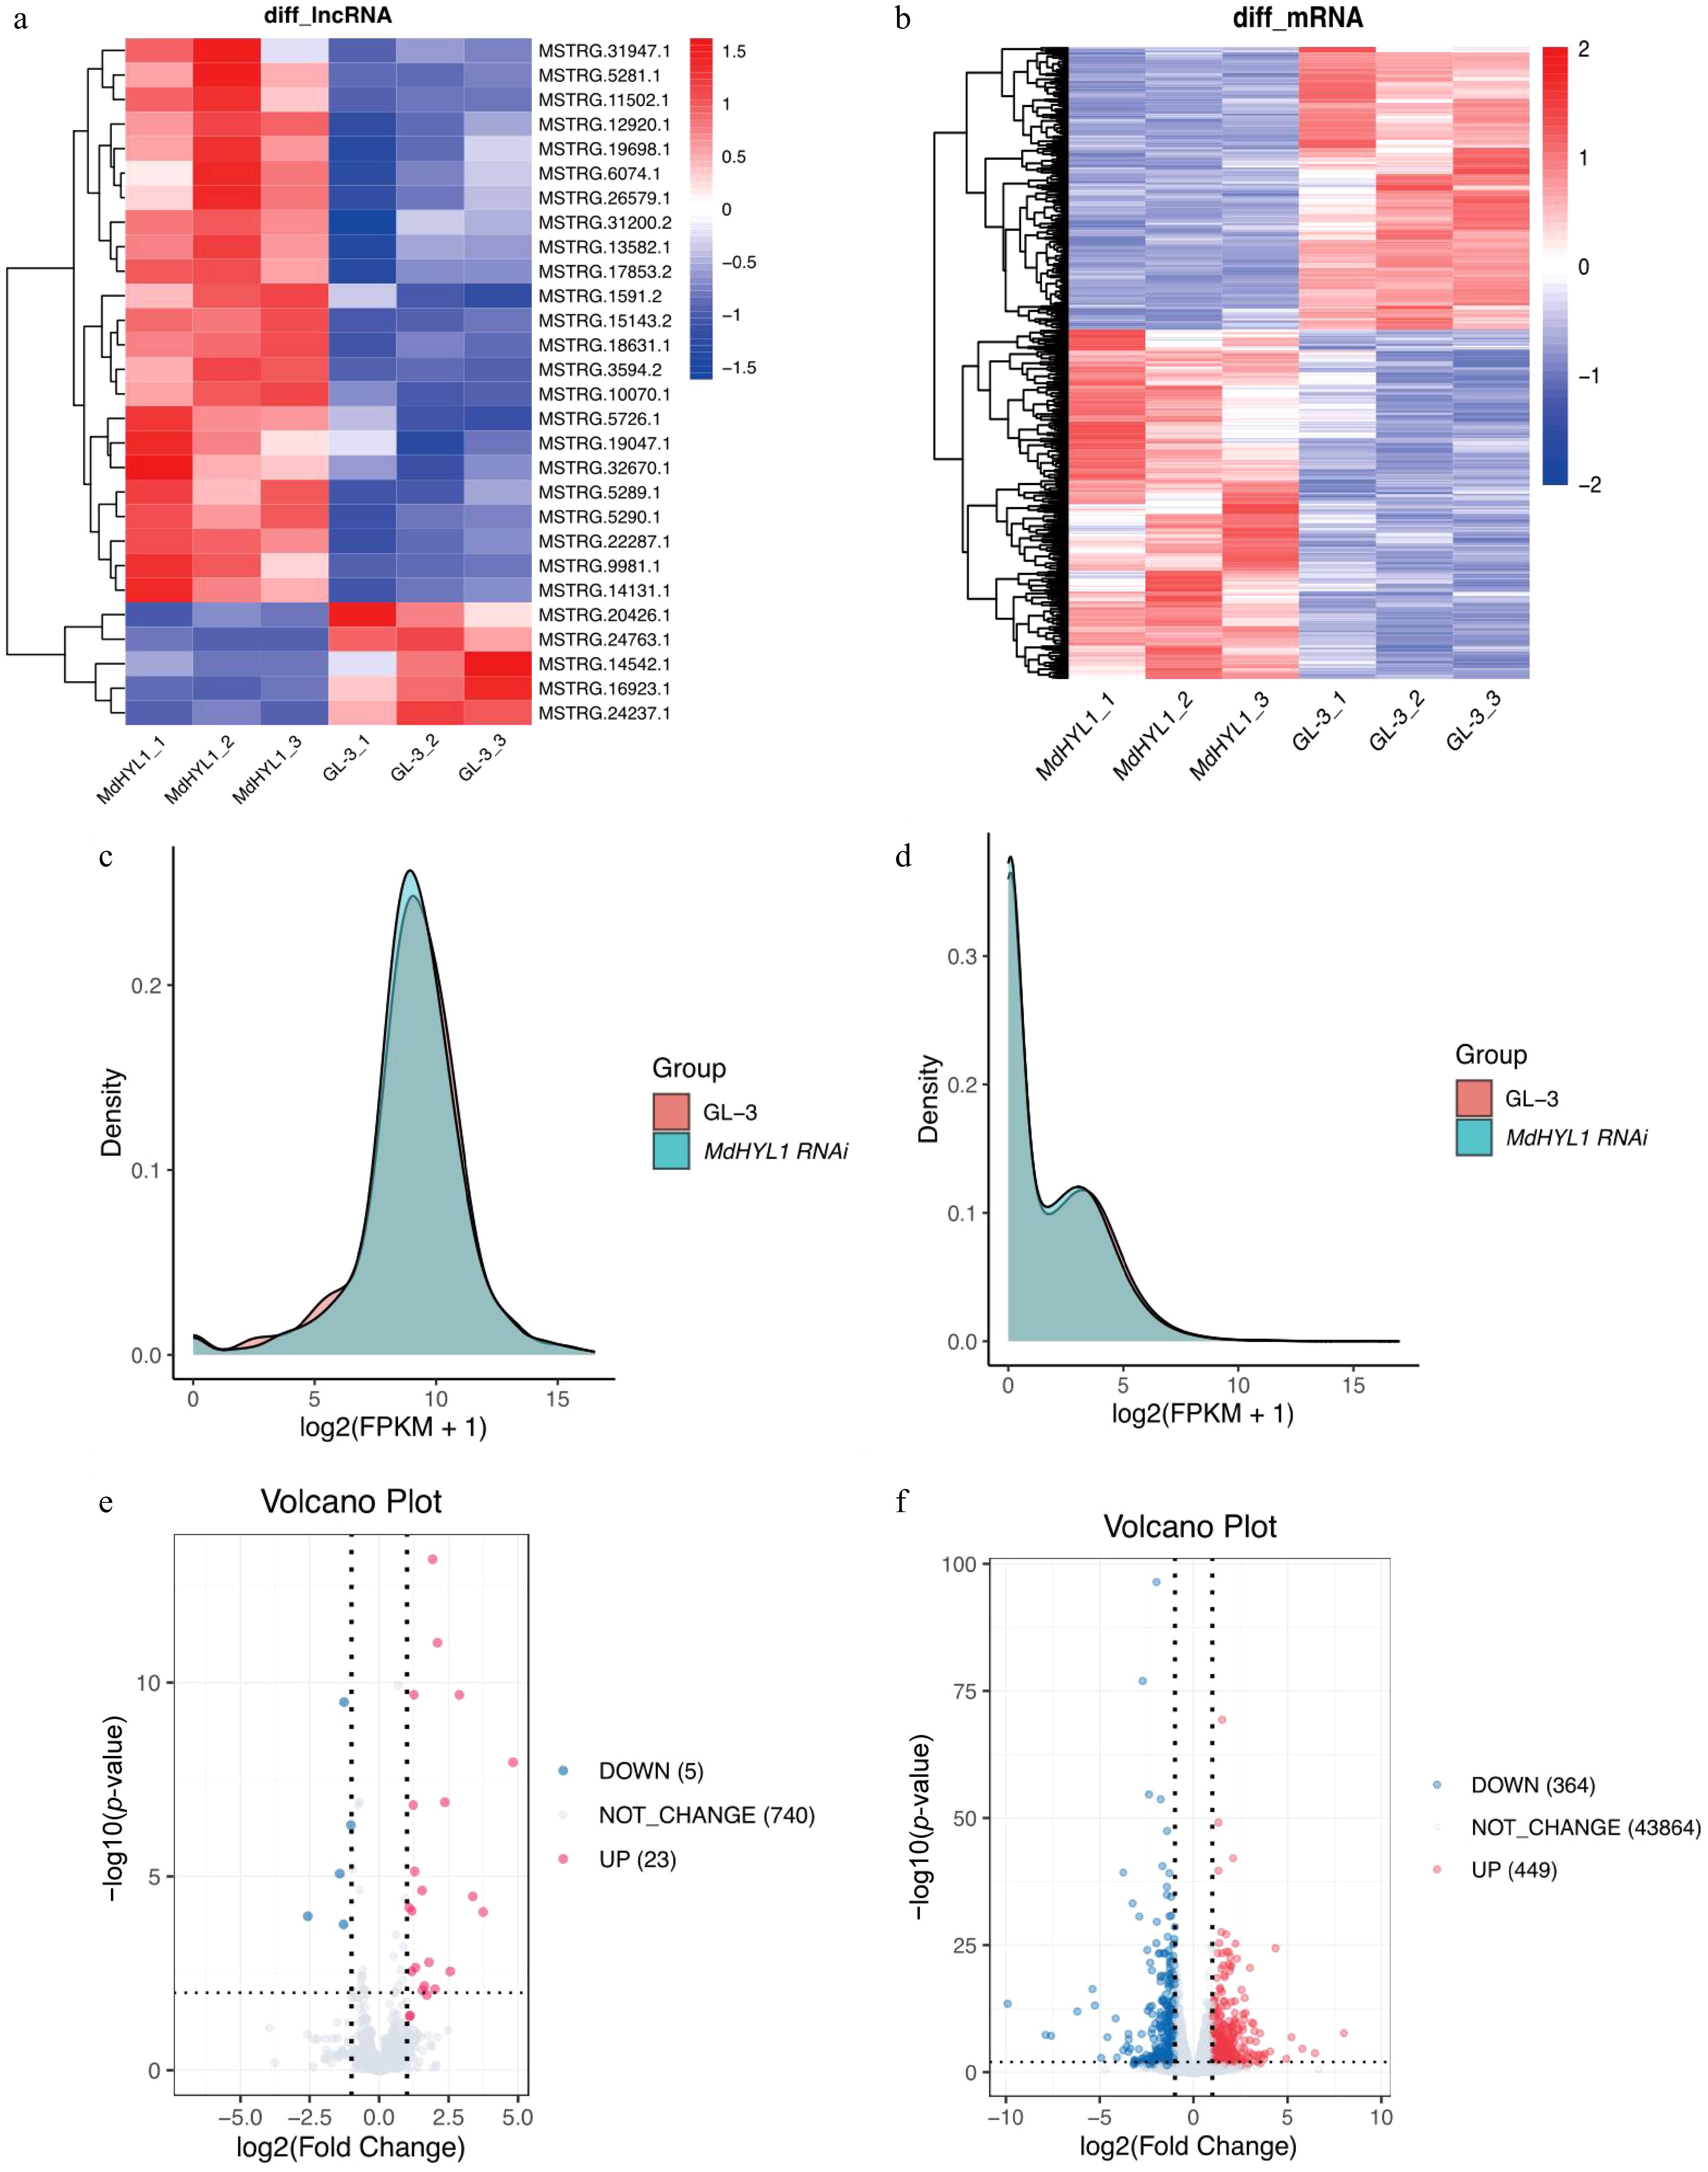
Figure 3.
Differential expression of lncRNAs and mRNAs in MdHYL1 RNAi and GL-3 plants. Heatmap of differentially expressed (a) lncRNAs and (b) mRNAs. Rows are clustered using hierarchical clustering. Density distribution of expression levels for (c) lncRNAs, and (d) mRNAs in MdHYL1 RNAi and GL-3. Volcano plot of differentially expressed (e) lncRNAs, and (f) mRNAs, showing upregulated (red), downregulated (blue), and non-significantly changed (gray) lncRNAs and mRNAs. Differential expression was defined as |log2(Fold change)| > 1 and adjusted p-value < 0.05.
-
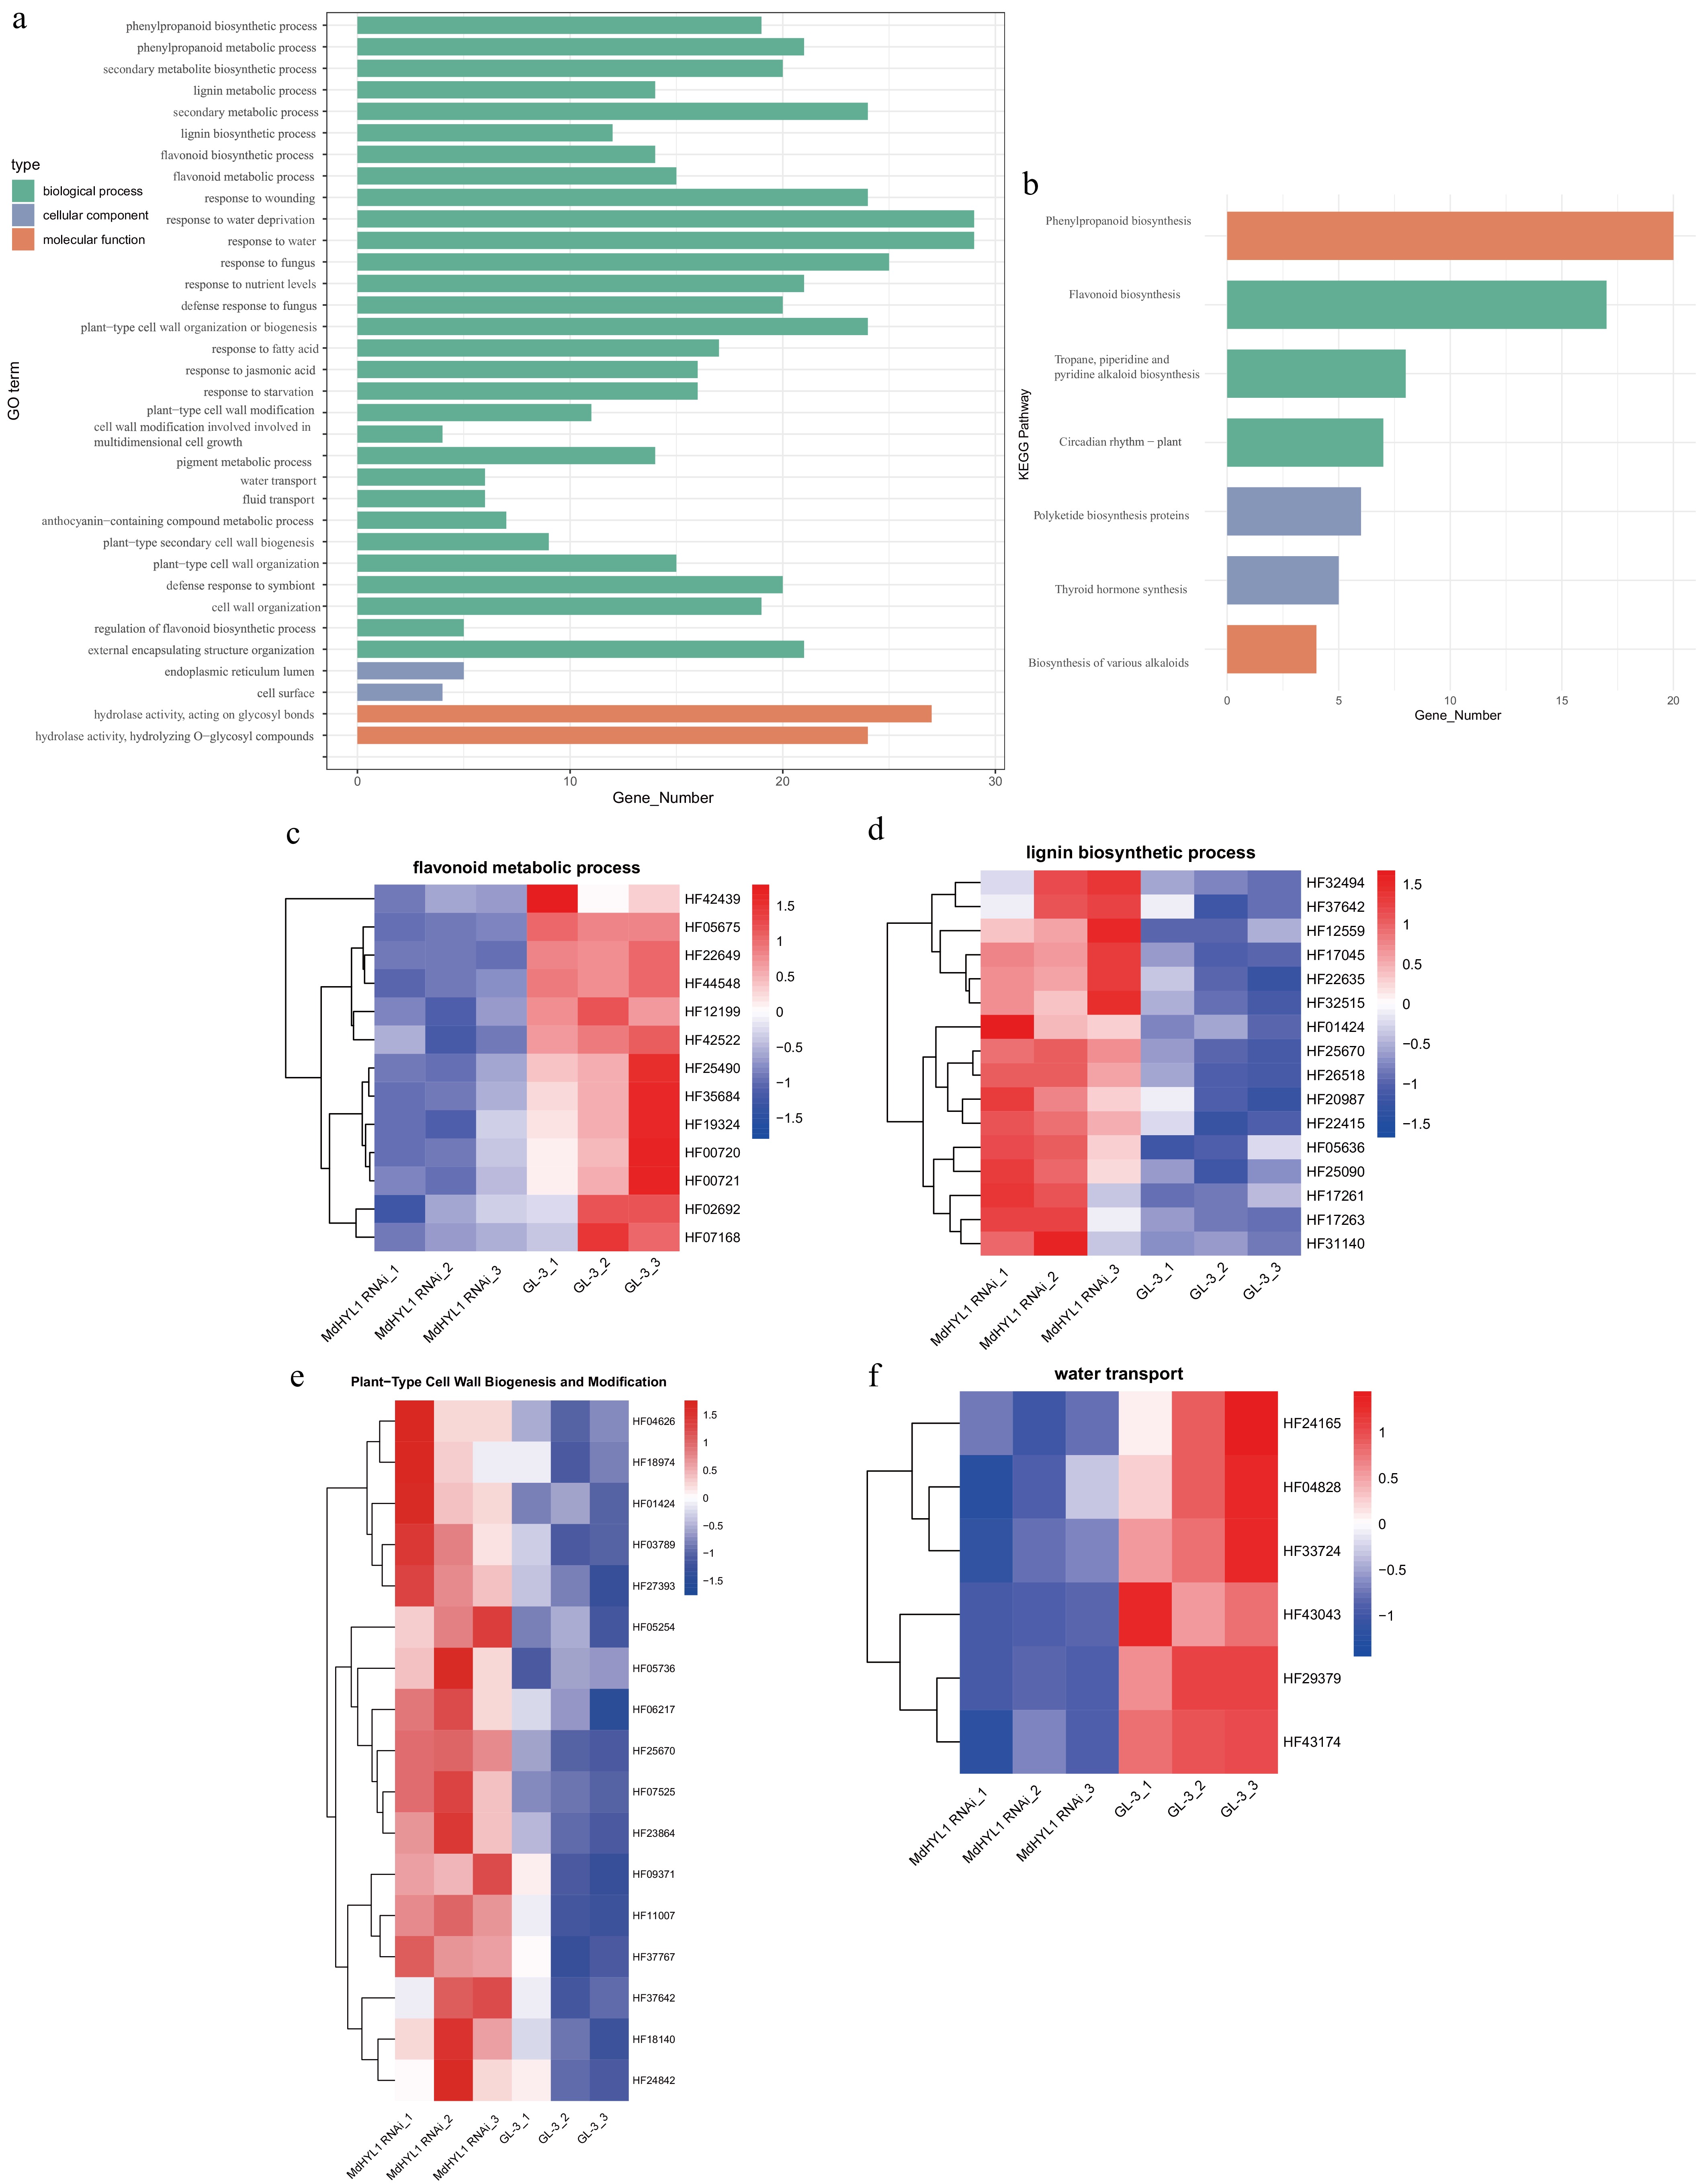
Figure 4.
Functional enrichment and expression of lncRNA target genes in MdHLY1 RNAi plants and GL-3. (a) GO enrichment of differentially expressed lncRNA targets. (b) KEGG enrichment of differentially expressed lncRNA targets. Heatmap showing expression patterns of target genes across MdHYL1 RNAi plants and GL-3 in (c) flavonoid metabolic process, (d) lignin biosynthetic process, (e) plant-type cell wall biogenesis and modification, and (f) water transport. Rows are clustered using hierarchical clustering.
-
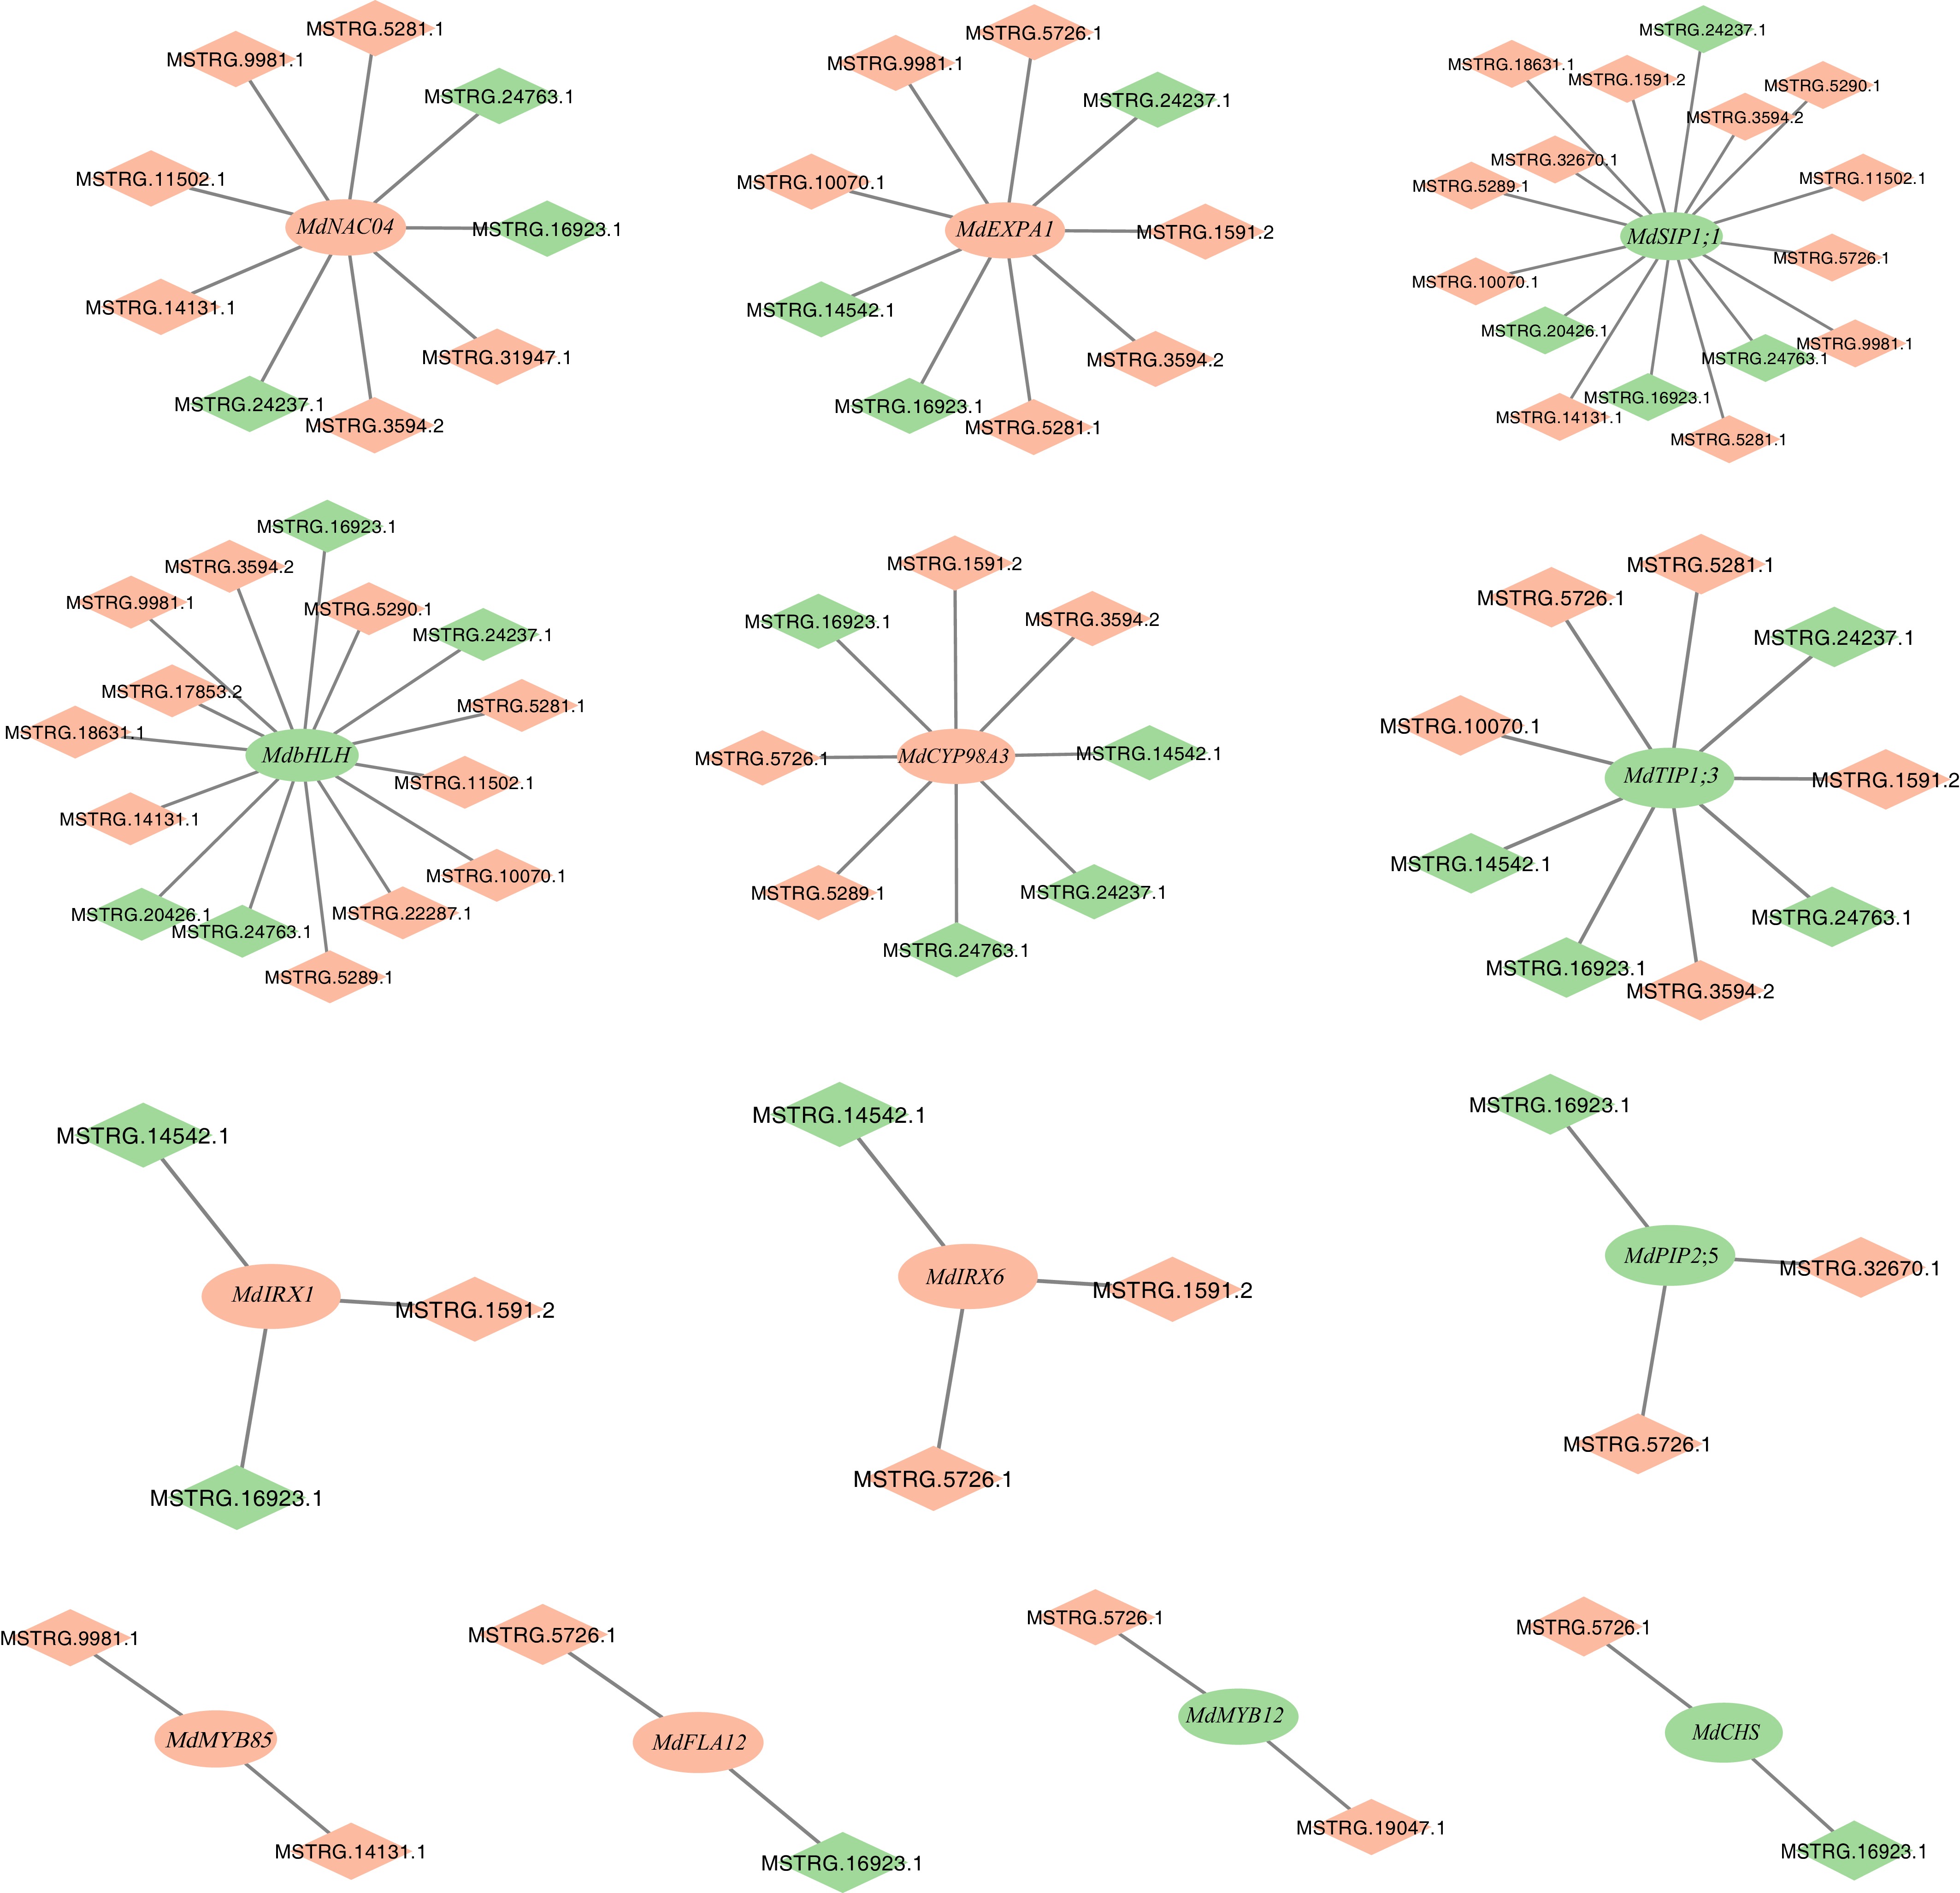
Figure 5.
mRNA–lncRNA regulatory networks centered on key genes involved in flavonoid metabolic process, lignin metabolic process, plant-type cell wall biogenesis and modification, and water transport. The rectangle represents lncRNAs, the diamond represents mRNA, green represents down-regulated genes in MdHYL1 RNAi apple plants than GL-3, and red represents up-regulated trend in MdHYL1 RNAi apple plants than GL-3. Ellipses represent mRNAs, diamonds represent lncRNAs.
-
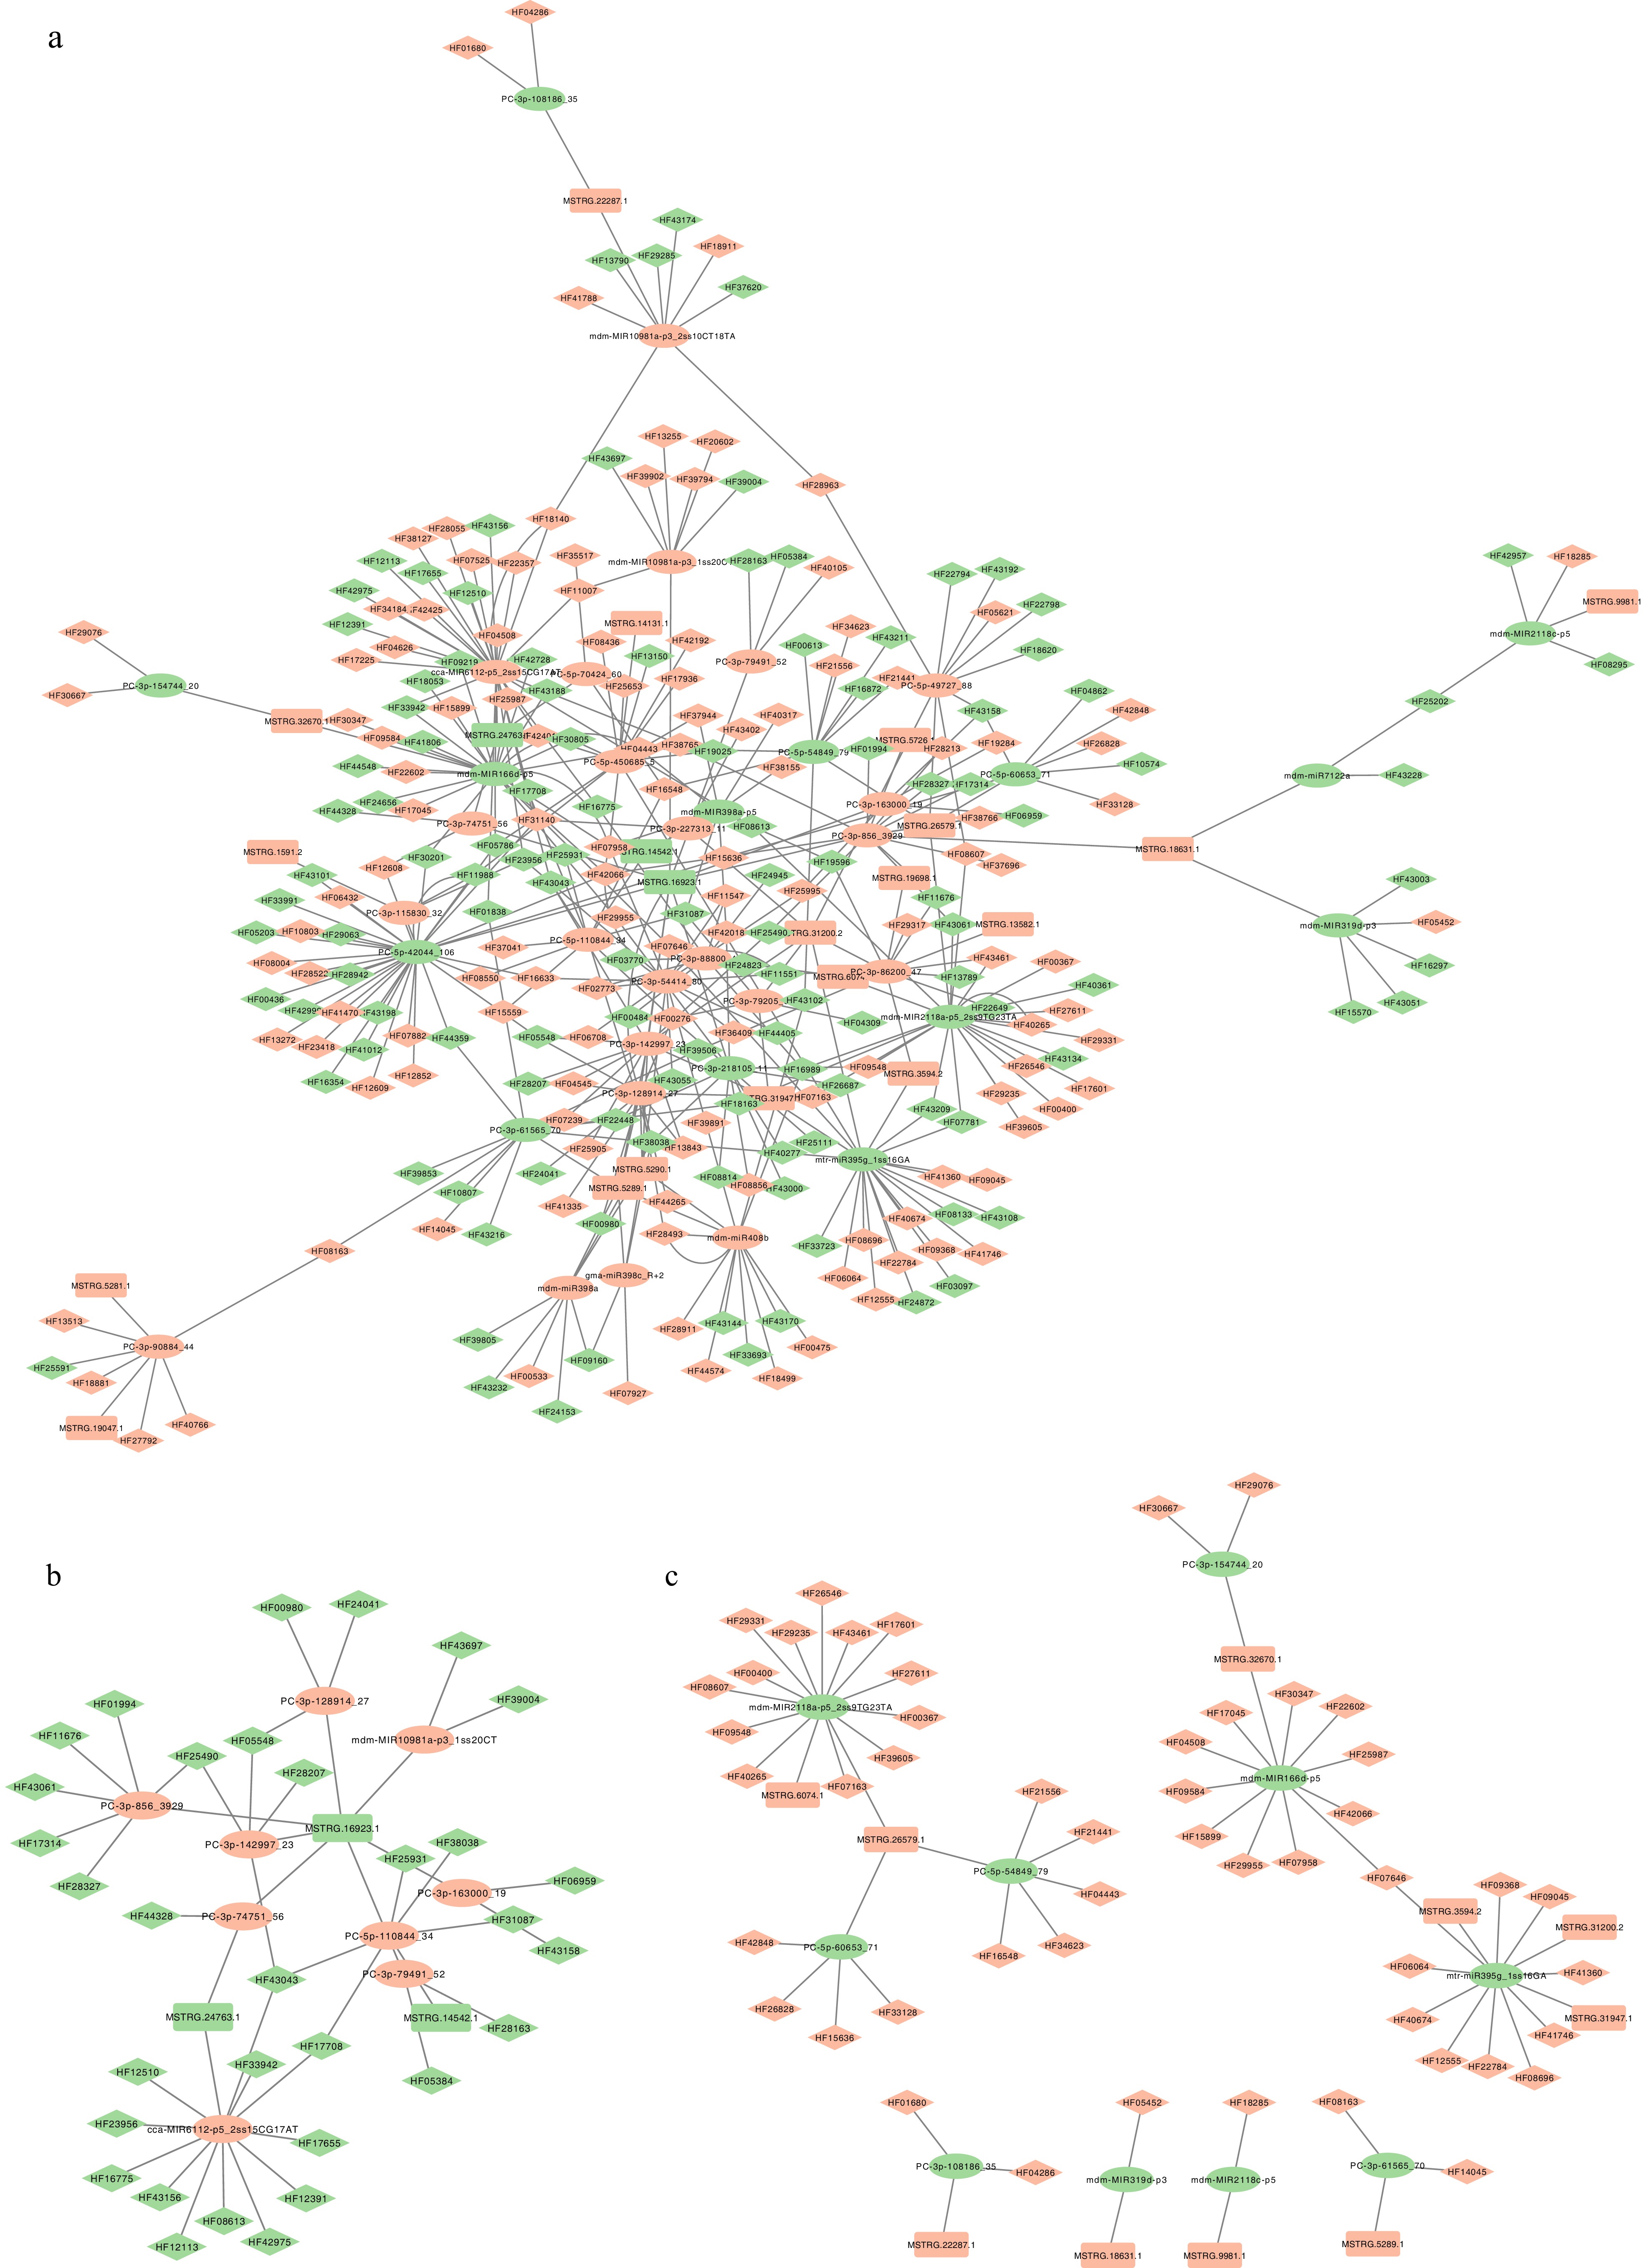
Figure 6.
Visualization of miRNA-mRNA-lncRNA regulatory network in MdHYL1 RNAi plants and GL-3. (a) Predicted comprehensive miRNA-lncRNA-mRNA interaction network. (b) Subnetwork with upregulated miRNAs and their downregulated targets. (c) Subnetwork with downregulated miRNAs and upregulated targets. The ellipse represents miRNA, the rectangle represents lncRNA, the diamond represents mRNA regulated in MdHYL1 RNAi apple plants than GL-3. Green represents down-regulated genes in MdHYL1 RNAi apple plants than GL-3, and red represents up-regulated genes in MdHYL1 RNAi apple plants than GL-3.
-
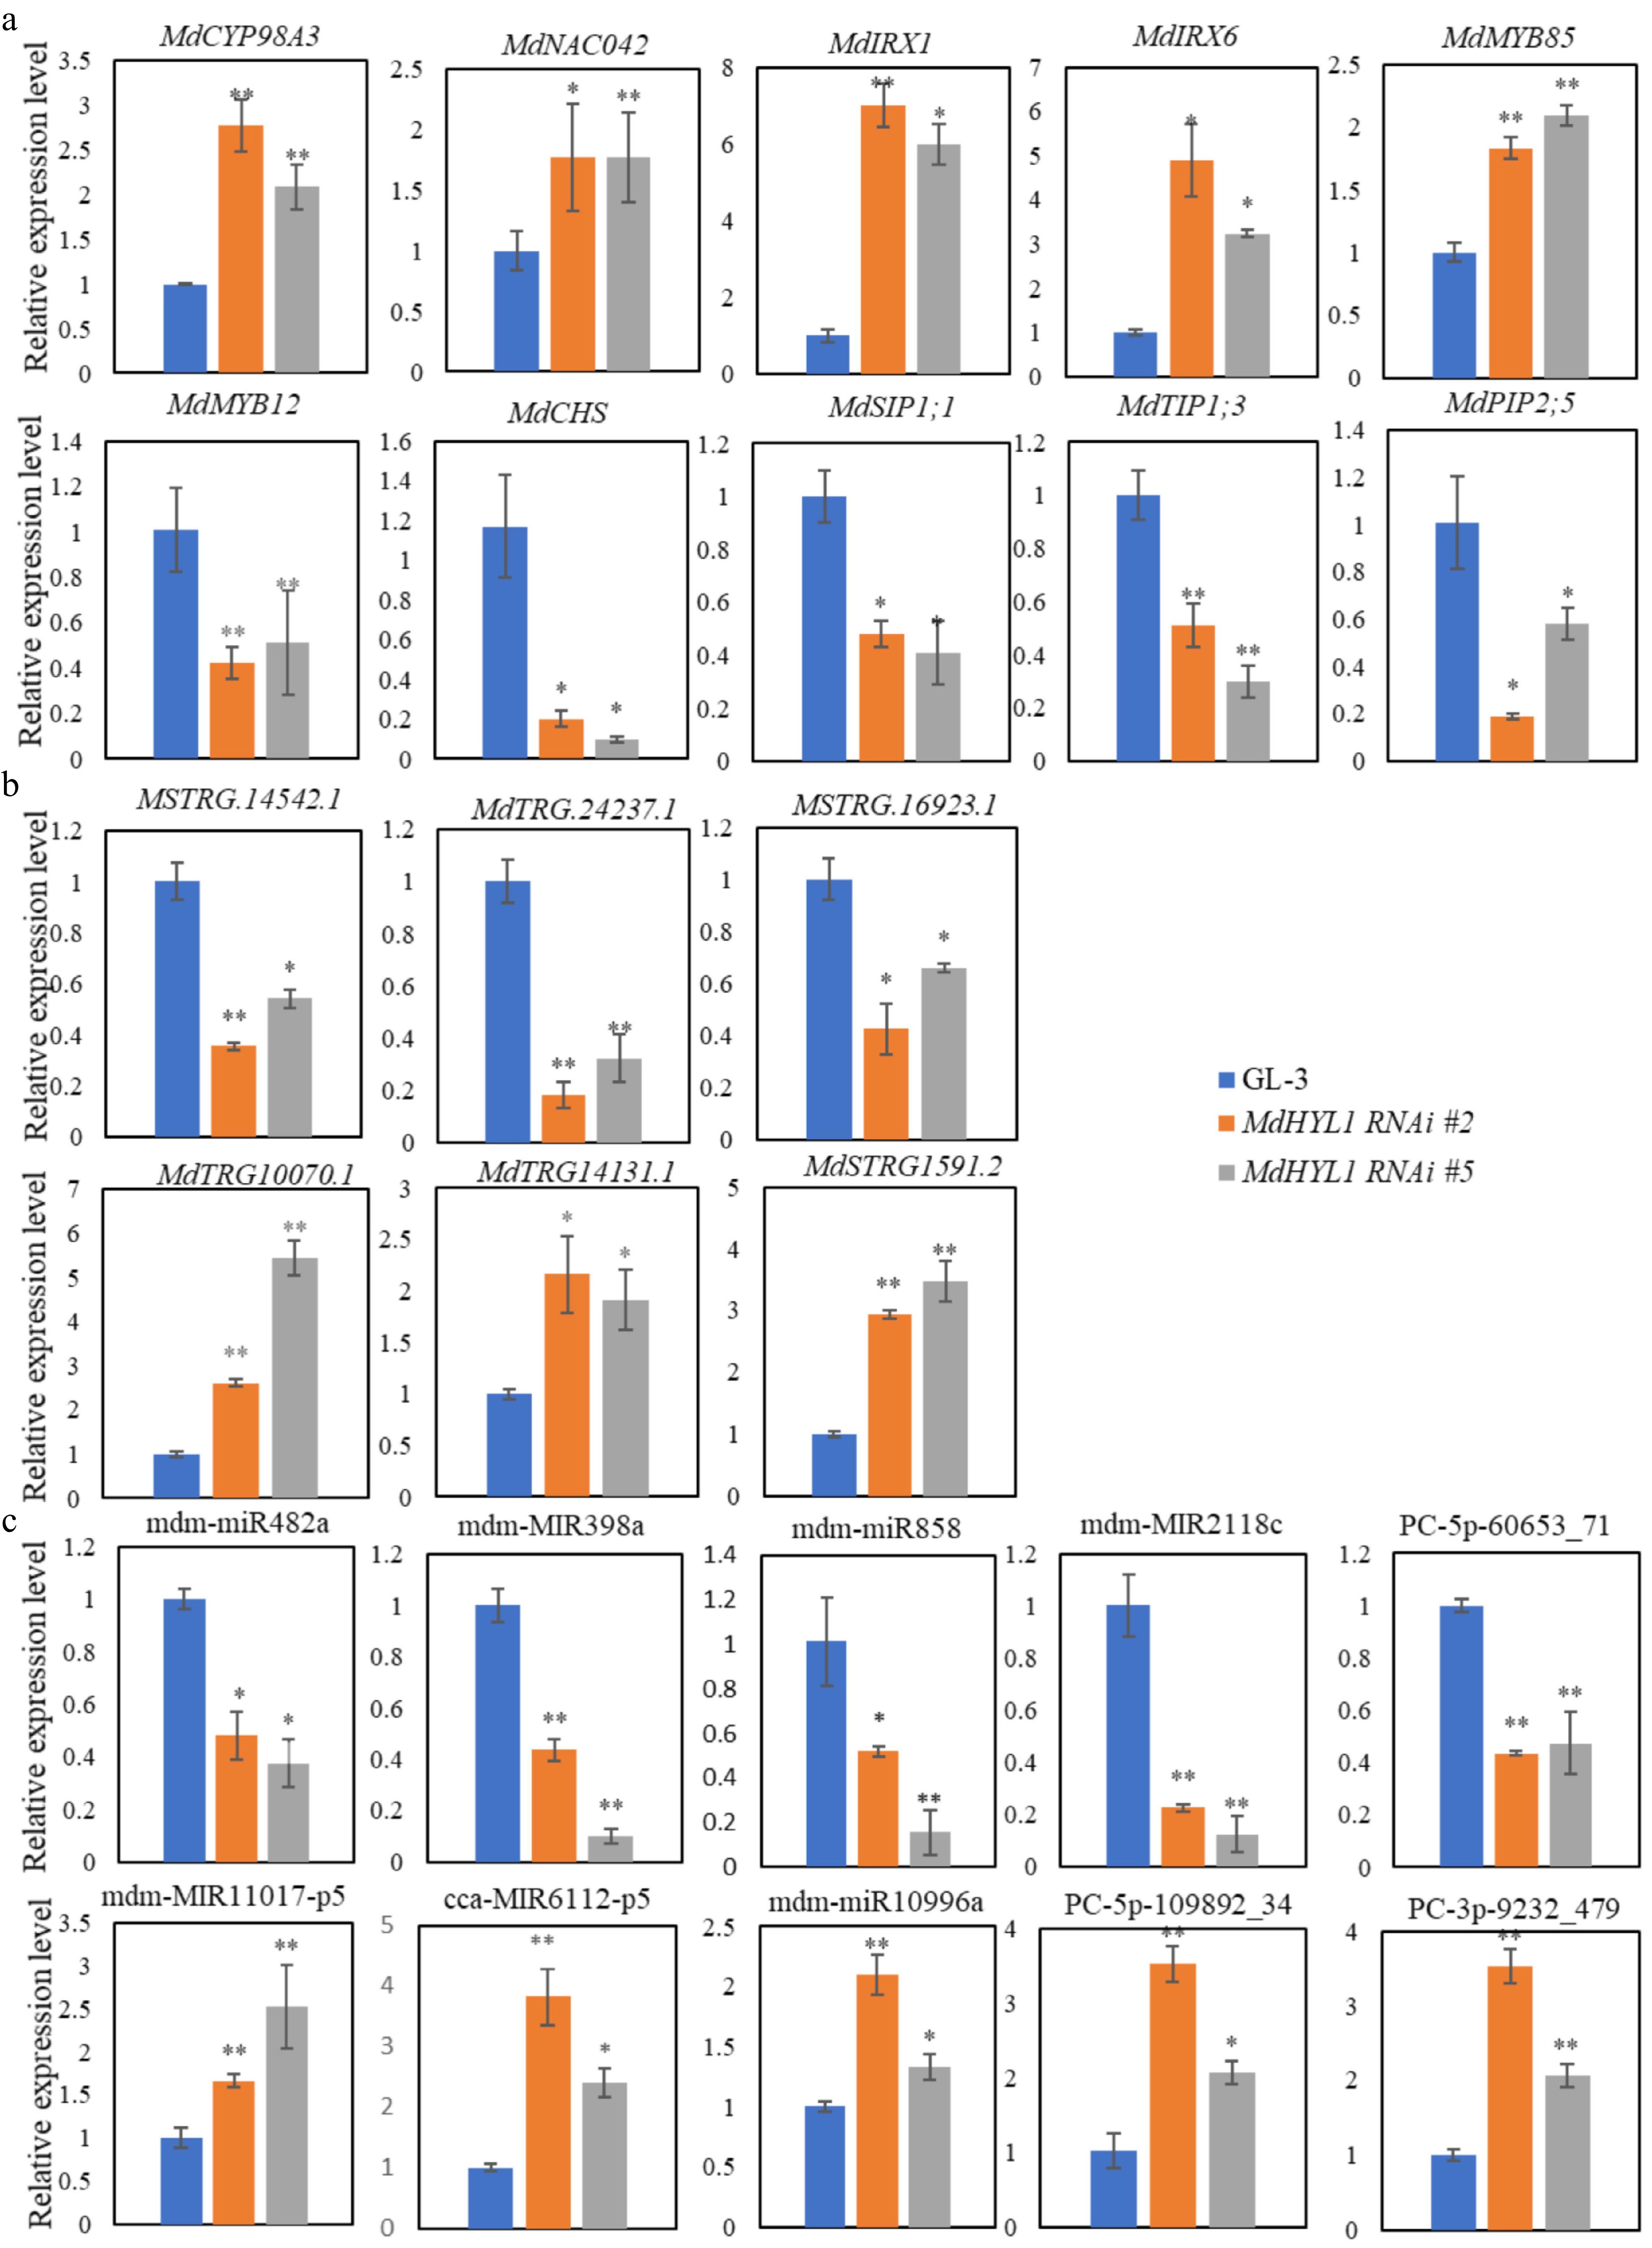
Figure 7.
Relative expression of (a) mRNAs, (b) lncRNAs, and (c) miRNAs with RT-qPCR confirmation in the GL-3 and MdHYL1 RNAi plants. The two-tailed t-test analyzed the differences between groups, * p < 0.05; ** p < 0.01.
-
MdHYL1 RNAi_1 MdHYL1 RNAi_2 MdHYL1 RNAi_3 GL-3_1 GL-3_2 GL-3_3 Raw reads 108,750,904 109,553,184 107,591,190 108,151,660 101,209,678 104,253,686 Clean reads 107,590,616 108,320,772 106,396,686 107,530,470 100,269,134 103,303,754 Clean base (G) 16.137259 16.247269 15.958526 16.128176 15.039191 15.494131 Error rate (%) 0.0014 0.0013 0.0013 0.012 0.008 0.0013 Q30 (%) 94.19 94.26 94.175 91.13 93.705 94.605 Q20 (%) 98.035 98.055 98.035 96.8 97.87 98.2 GC_content (%) 42.525 42.22 42.315 42.64 42.6 42.86 Mapped reads 101,105,892 102,019,938 100,375,286 100,113,566 94,297,562 97,071,070 Mapping rate (%) 0.939727792 0.941831711 0.943406132 0.931025095 0.940444564 0.939666433 Table 1.
Statistical summary of RNA sequencing reads.
Figures
(7)
Tables
(1)