-
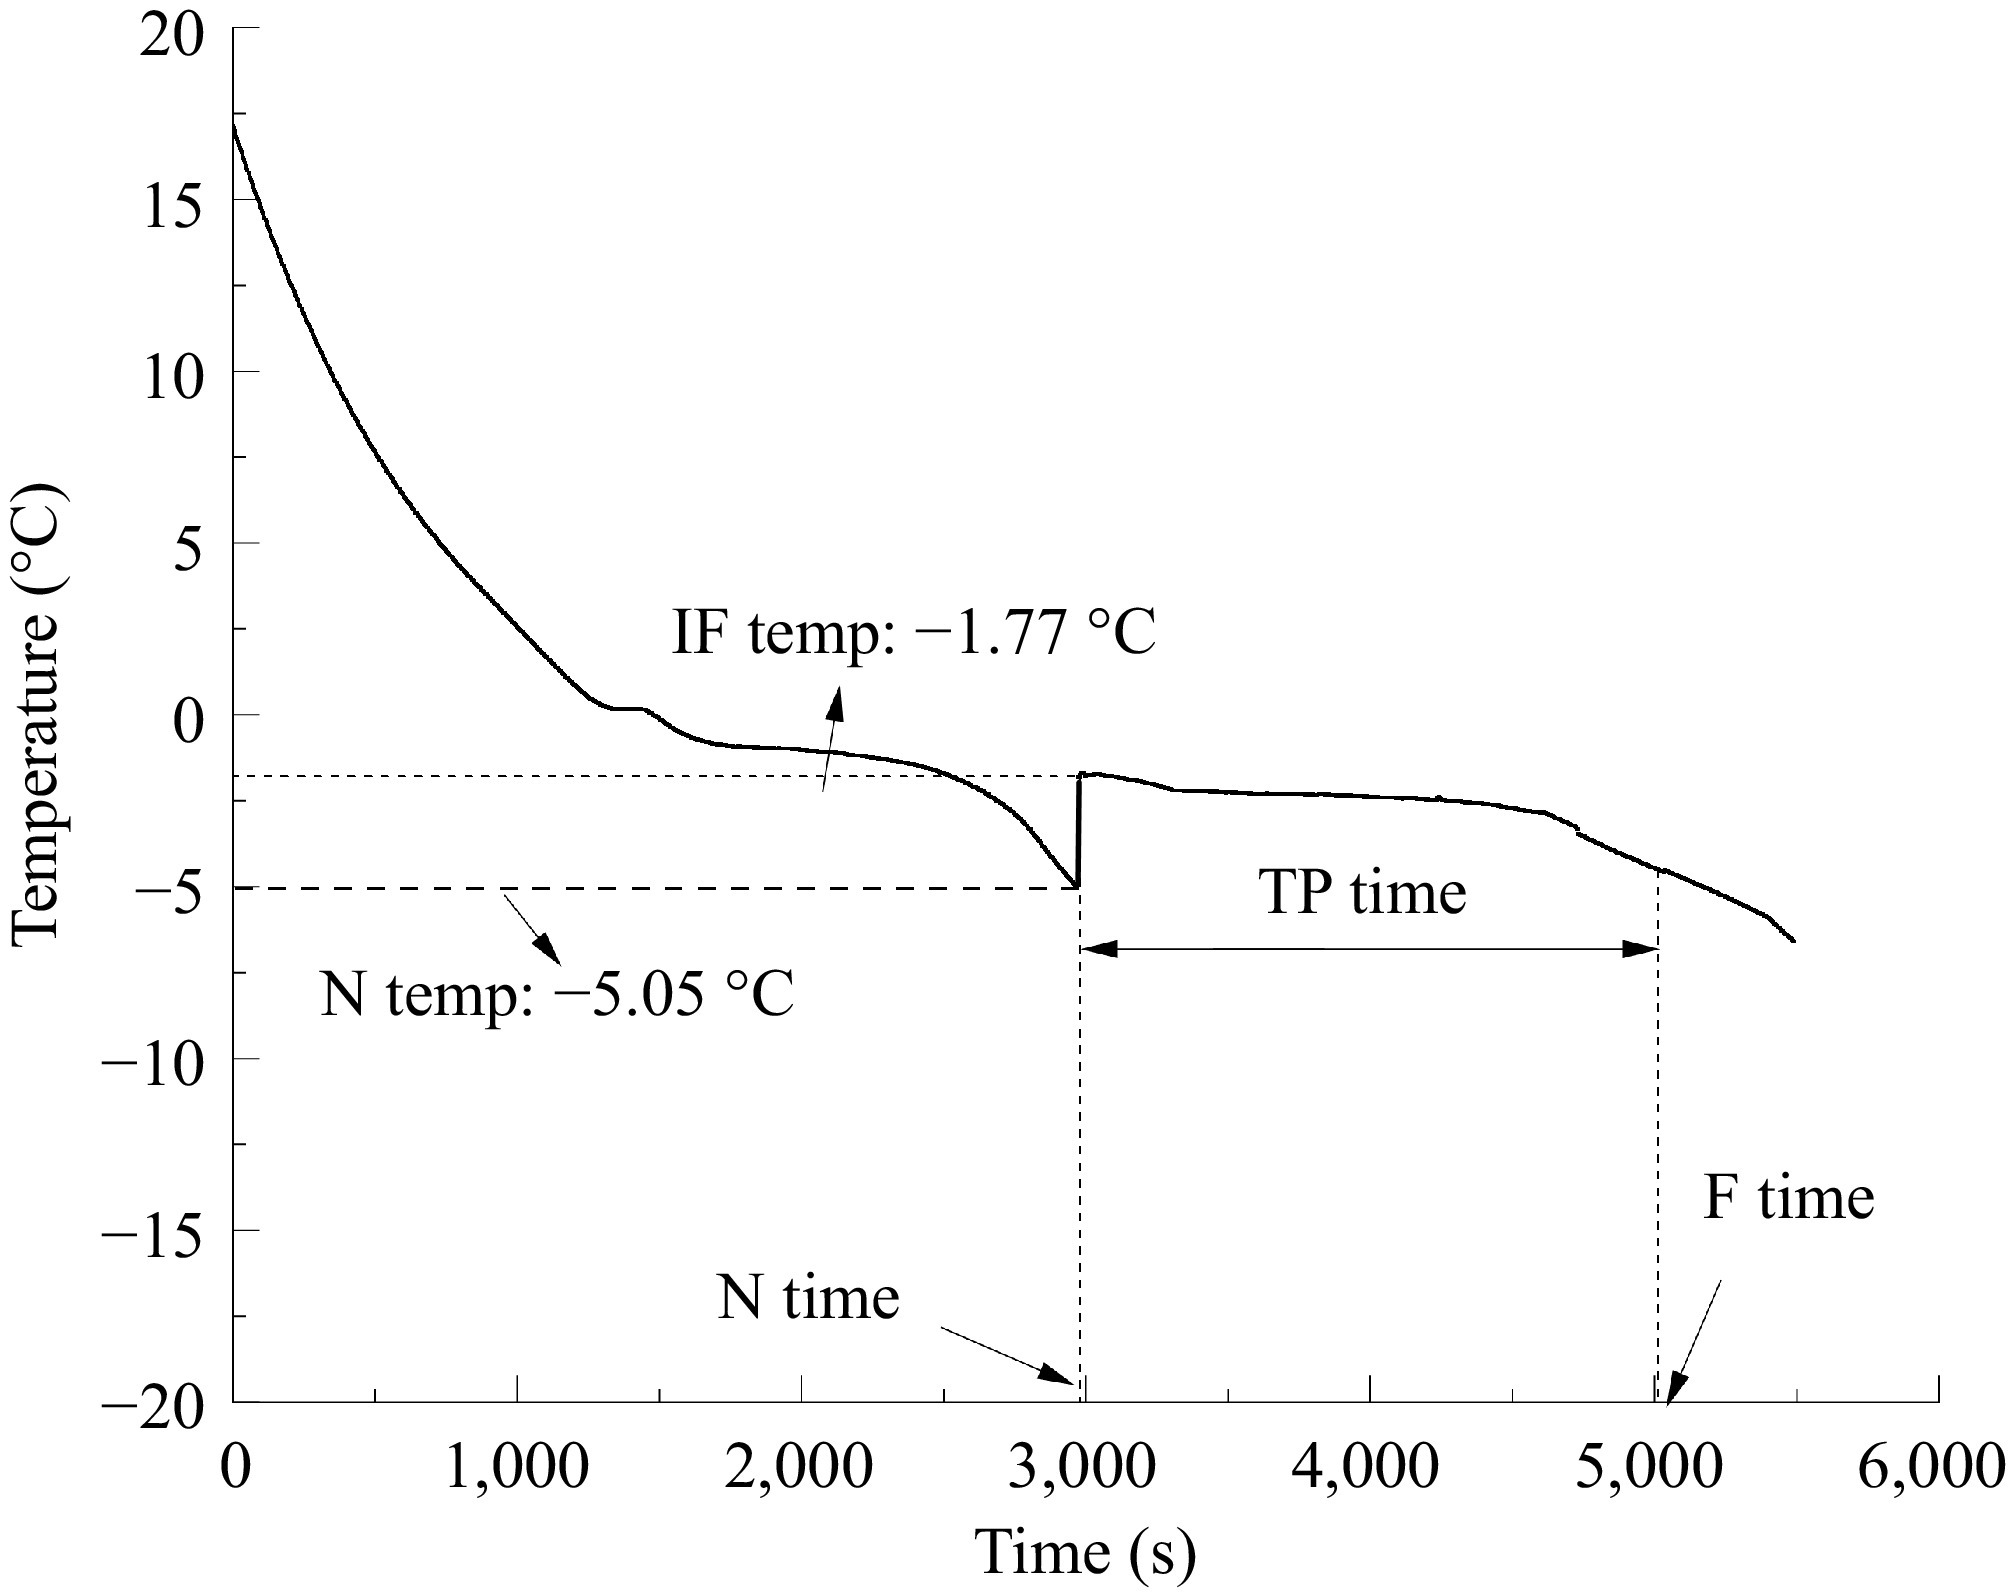
Figure 1.
Freezing curves of fresh-cut potatoes were obtained experimentally. IF Temp: Initial Freezing Temperature; N Temp: Nucleation Temperature; TP time: Transition Phase Time; F time: Freezing Time; N time: Nucleation Time.
-
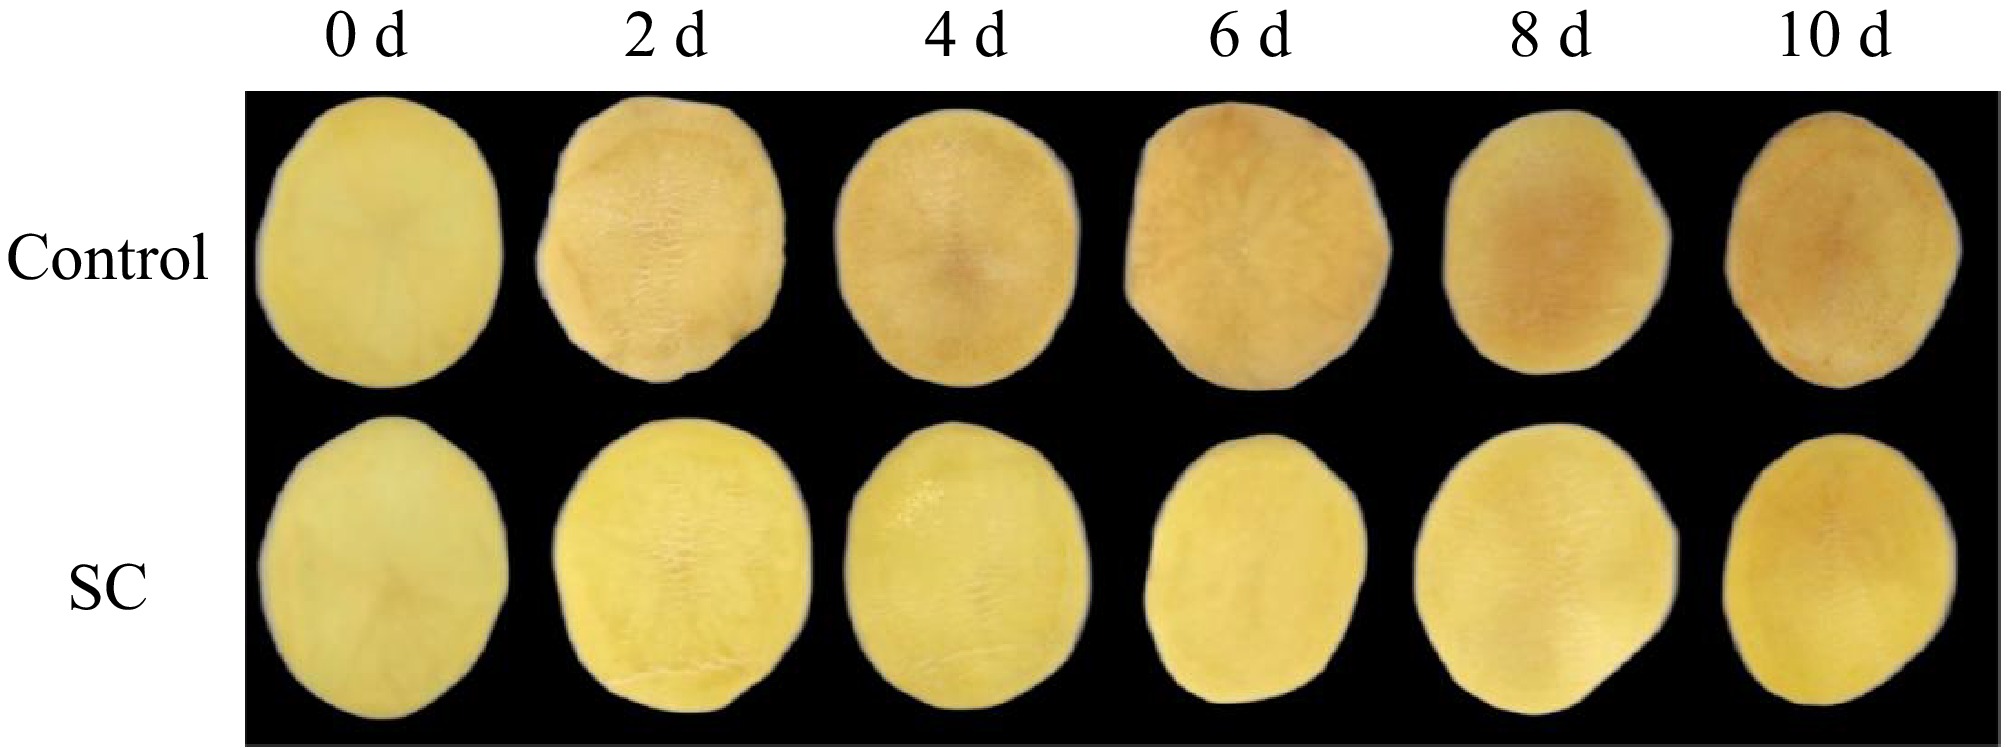
Figure 2.
Changes in the visual appearance of fresh-cut potatoes during SC storage and the control for 10 d.
-

Figure 3.
Effect of SC storage on color change and hardness of fresh-cut potato slices. (a) L* value, (b) BI value, (c) ΔE, (d) hardness. The results are represented as means ± standard deviations. Different letters represent significant differences among different treatments for each sampling time at p ≤ 0.05.
-
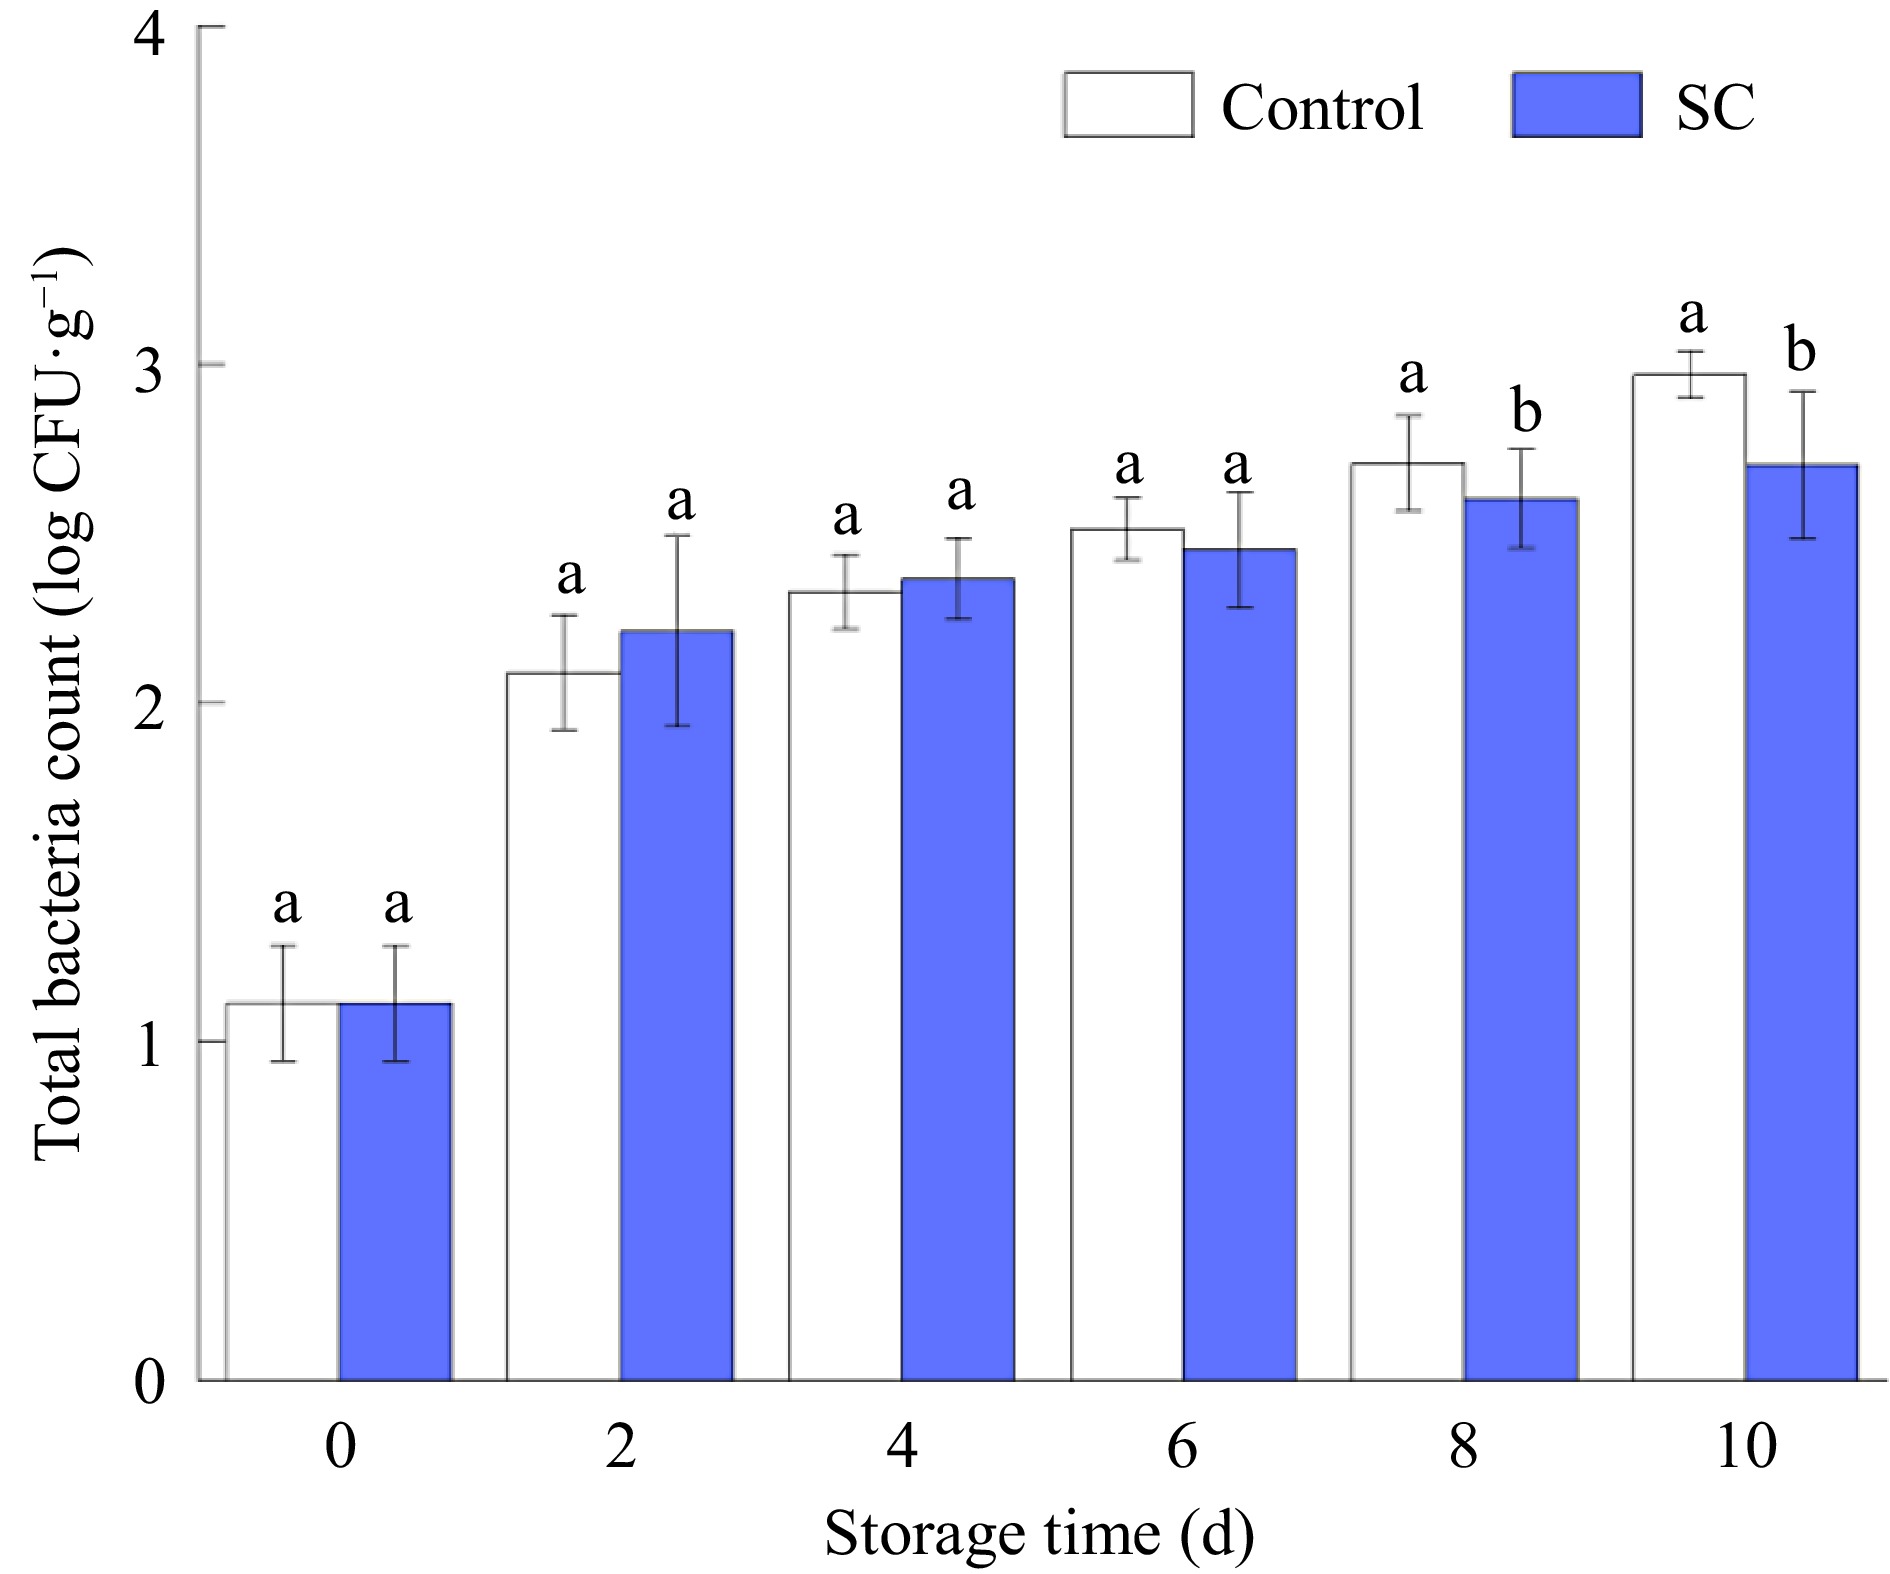
Figure 4.
The total microbial counts of fresh-cut potatoes under SC and the control during storage of 10 d. Vertical bars show the standard errors. Different letters denote significant differences (p ≤ 0.05) between different storage conditions of the same storage time.
-
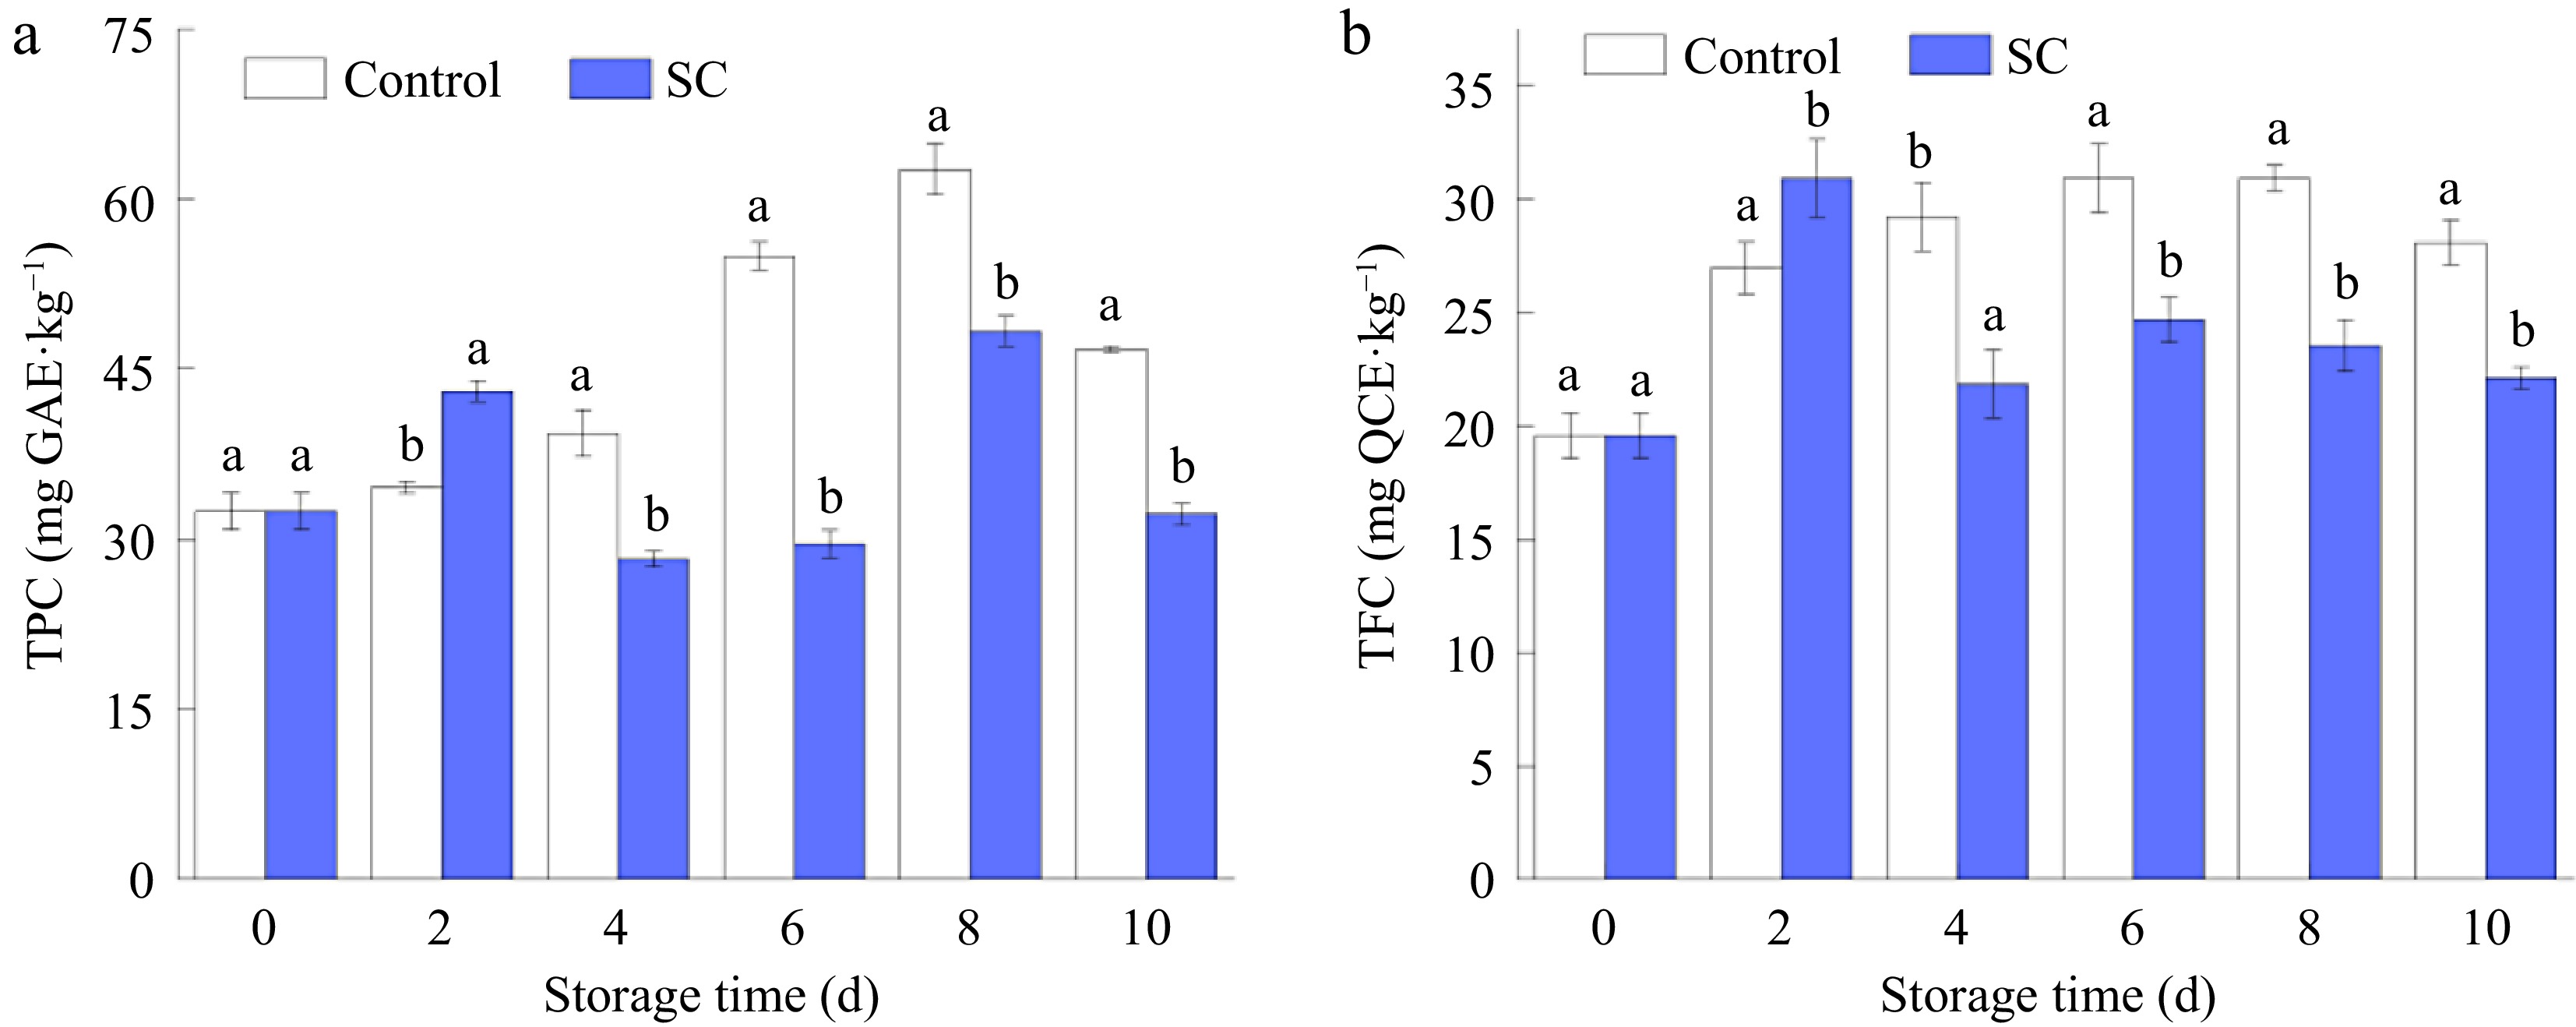
Figure 5.
The (a) TPC, and (b) TFC of fresh-cut potatoes under SC and the control during storage of 10 d. Vertical bars show the standard errors. Different letters denote significant differences (p ≤ 0.05) between different storage conditions of the same storage time.
-
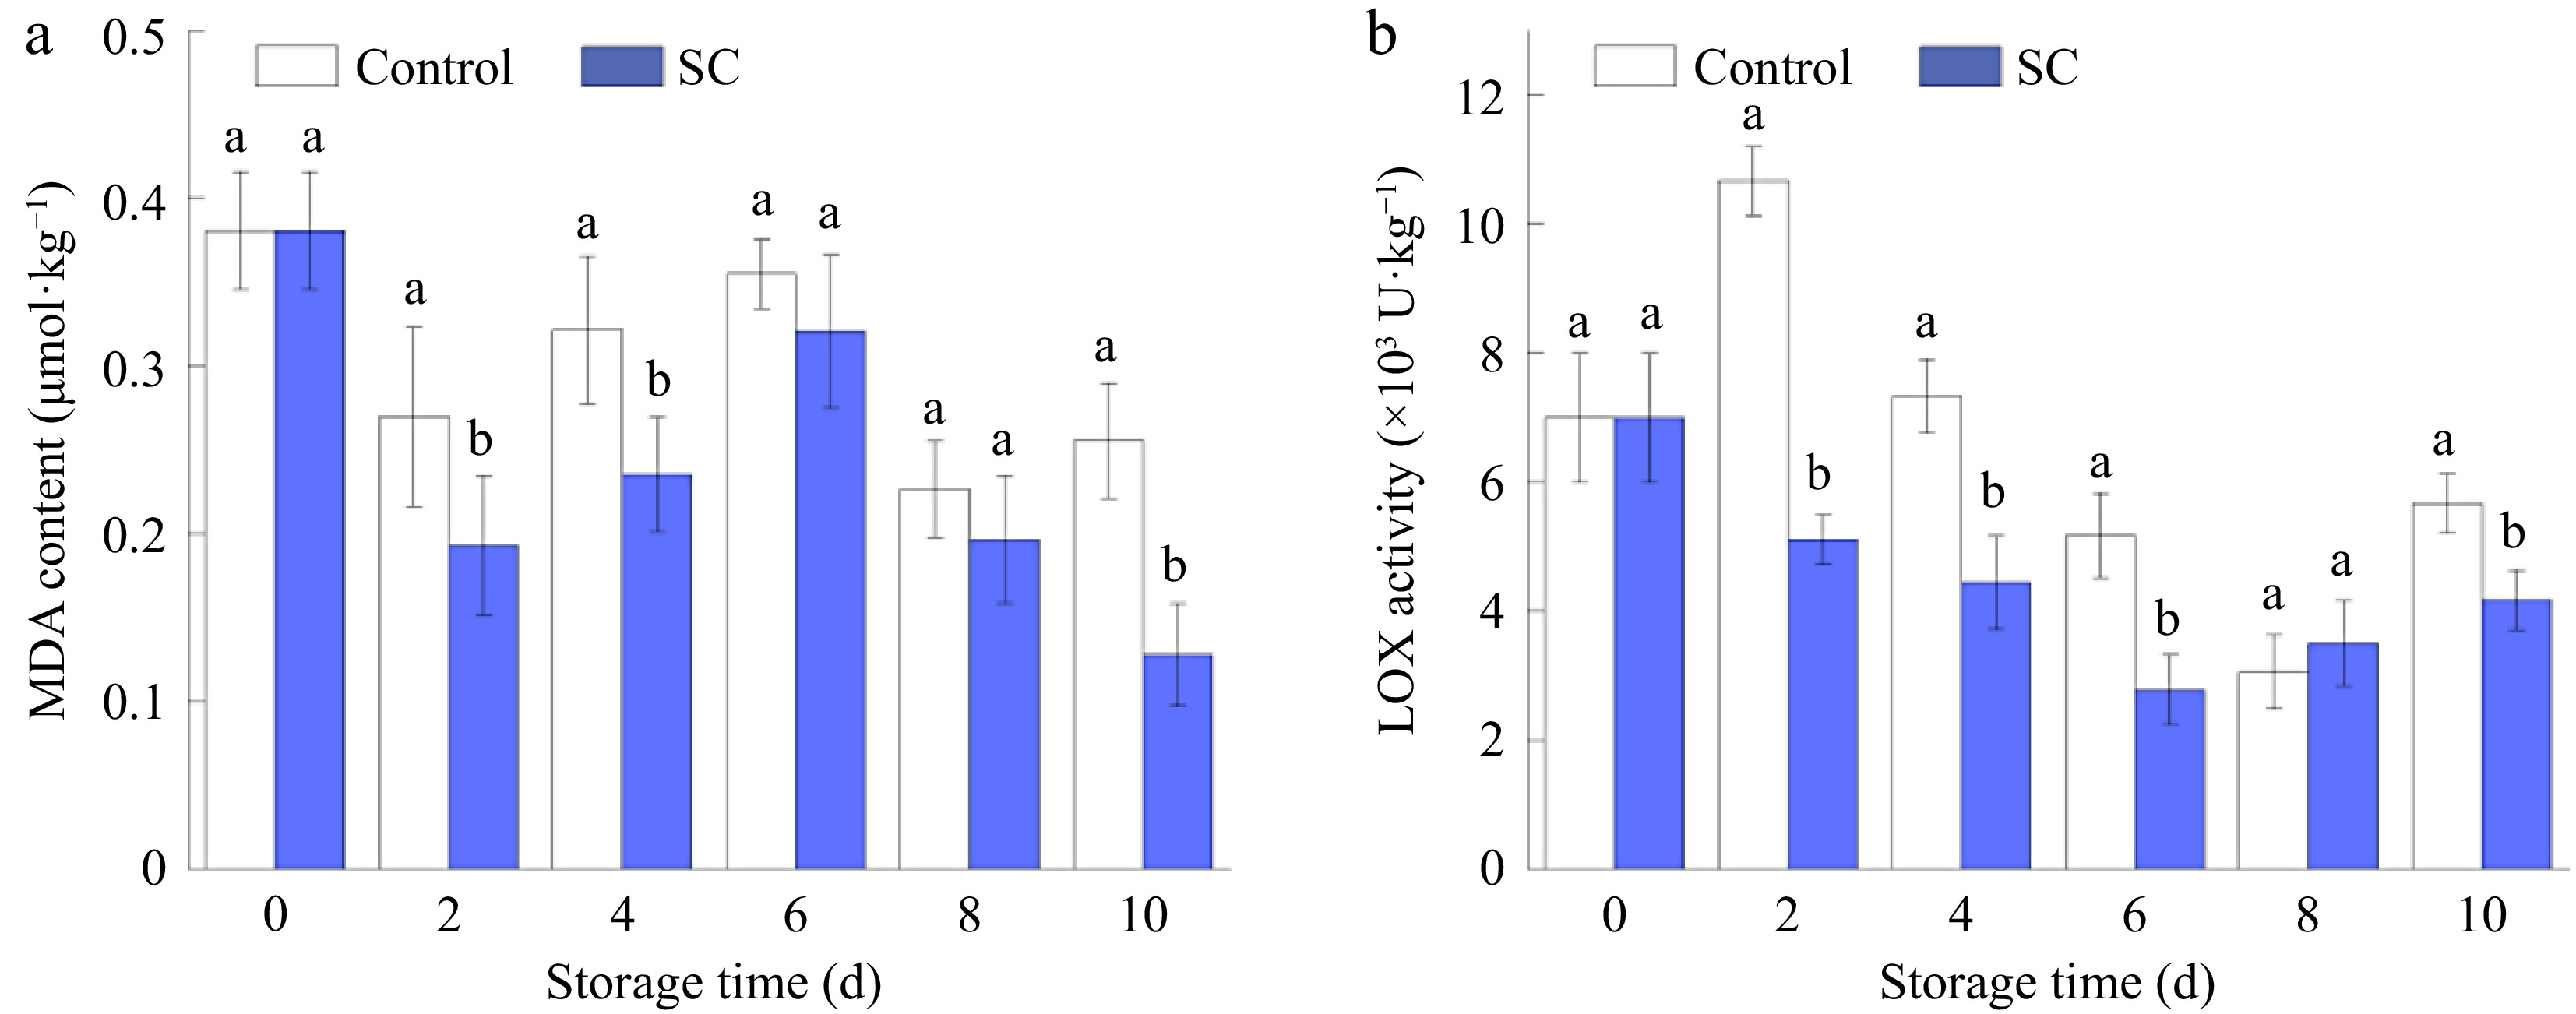
Figure 6.
Changes in (a) MDA content, and (b) LOX activity of fresh-cut potatoes under SC storage and the control during storage of 10 d. Vertical bars show the standard errors. Different letters denote significant differences (p ≤ 0.05) between different storage conditions of the same storage time.
-
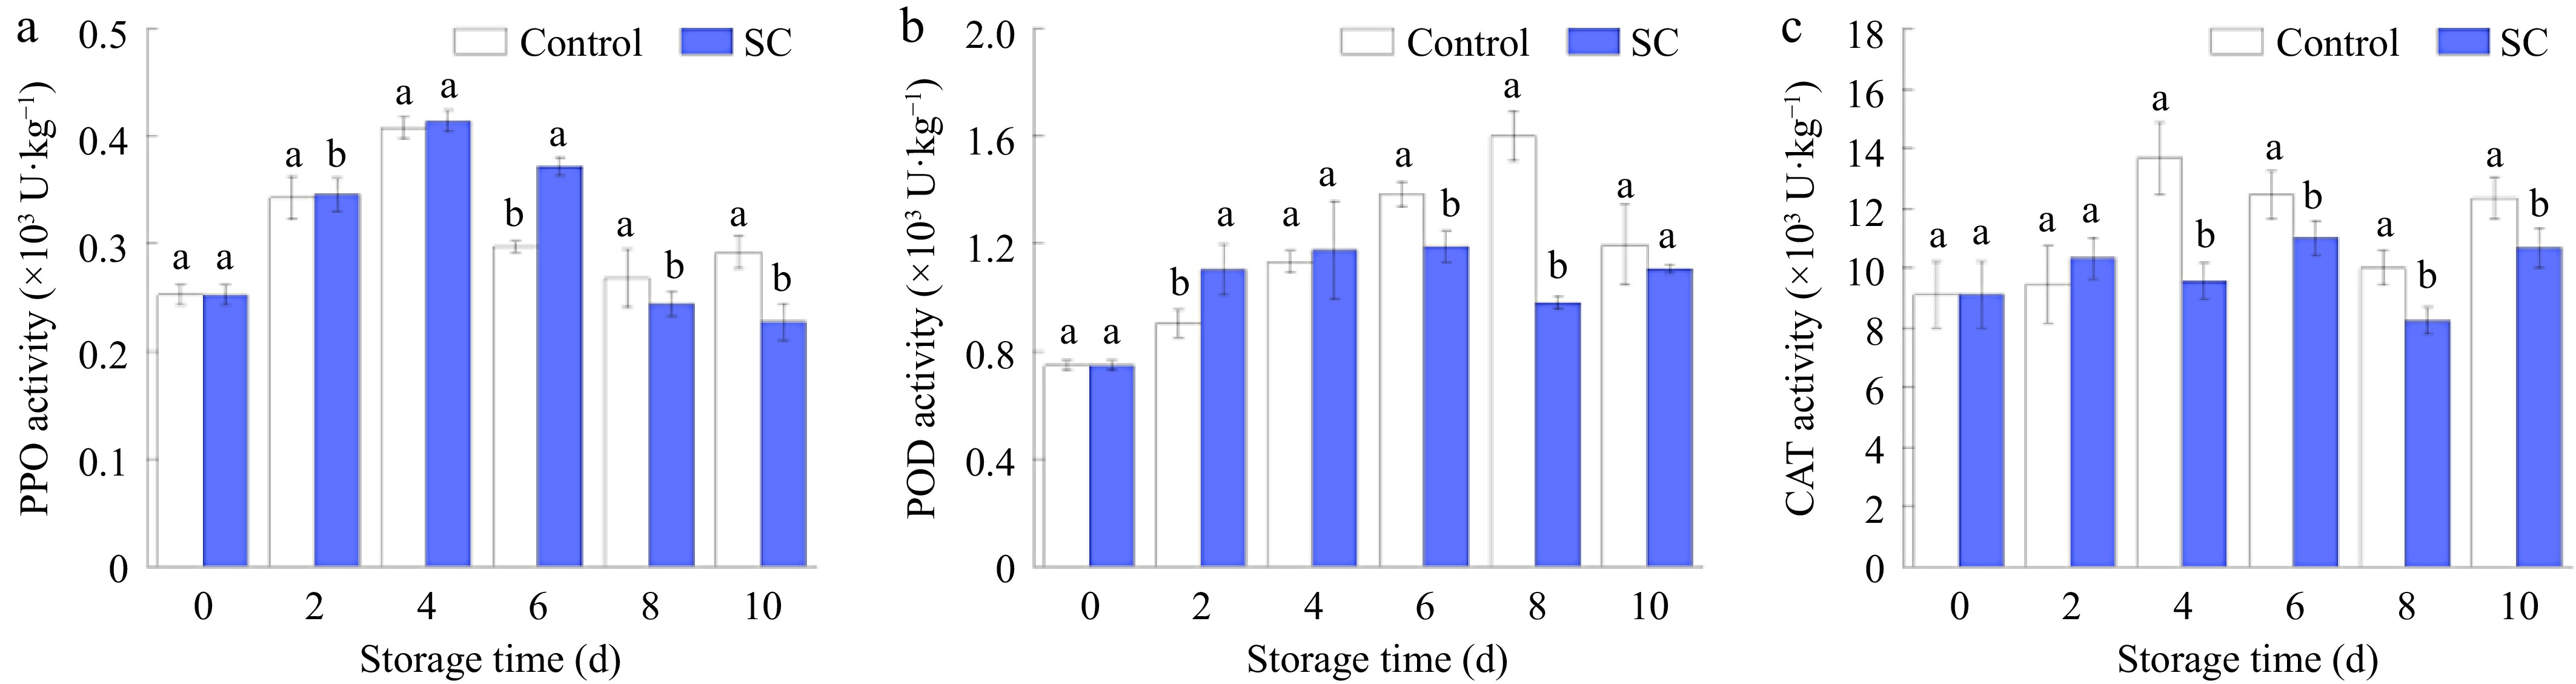
Figure 7.
Changes in (a) PPO activity, (b) POD activity, and (c) CAT activity of fresh-cut potatoes under SC storage and the control during storage of 10 d. Vertical bars show the standard errors. Different letters denote significant differences (p ≤ 0.05) between different storage conditions of the same storage time.
-
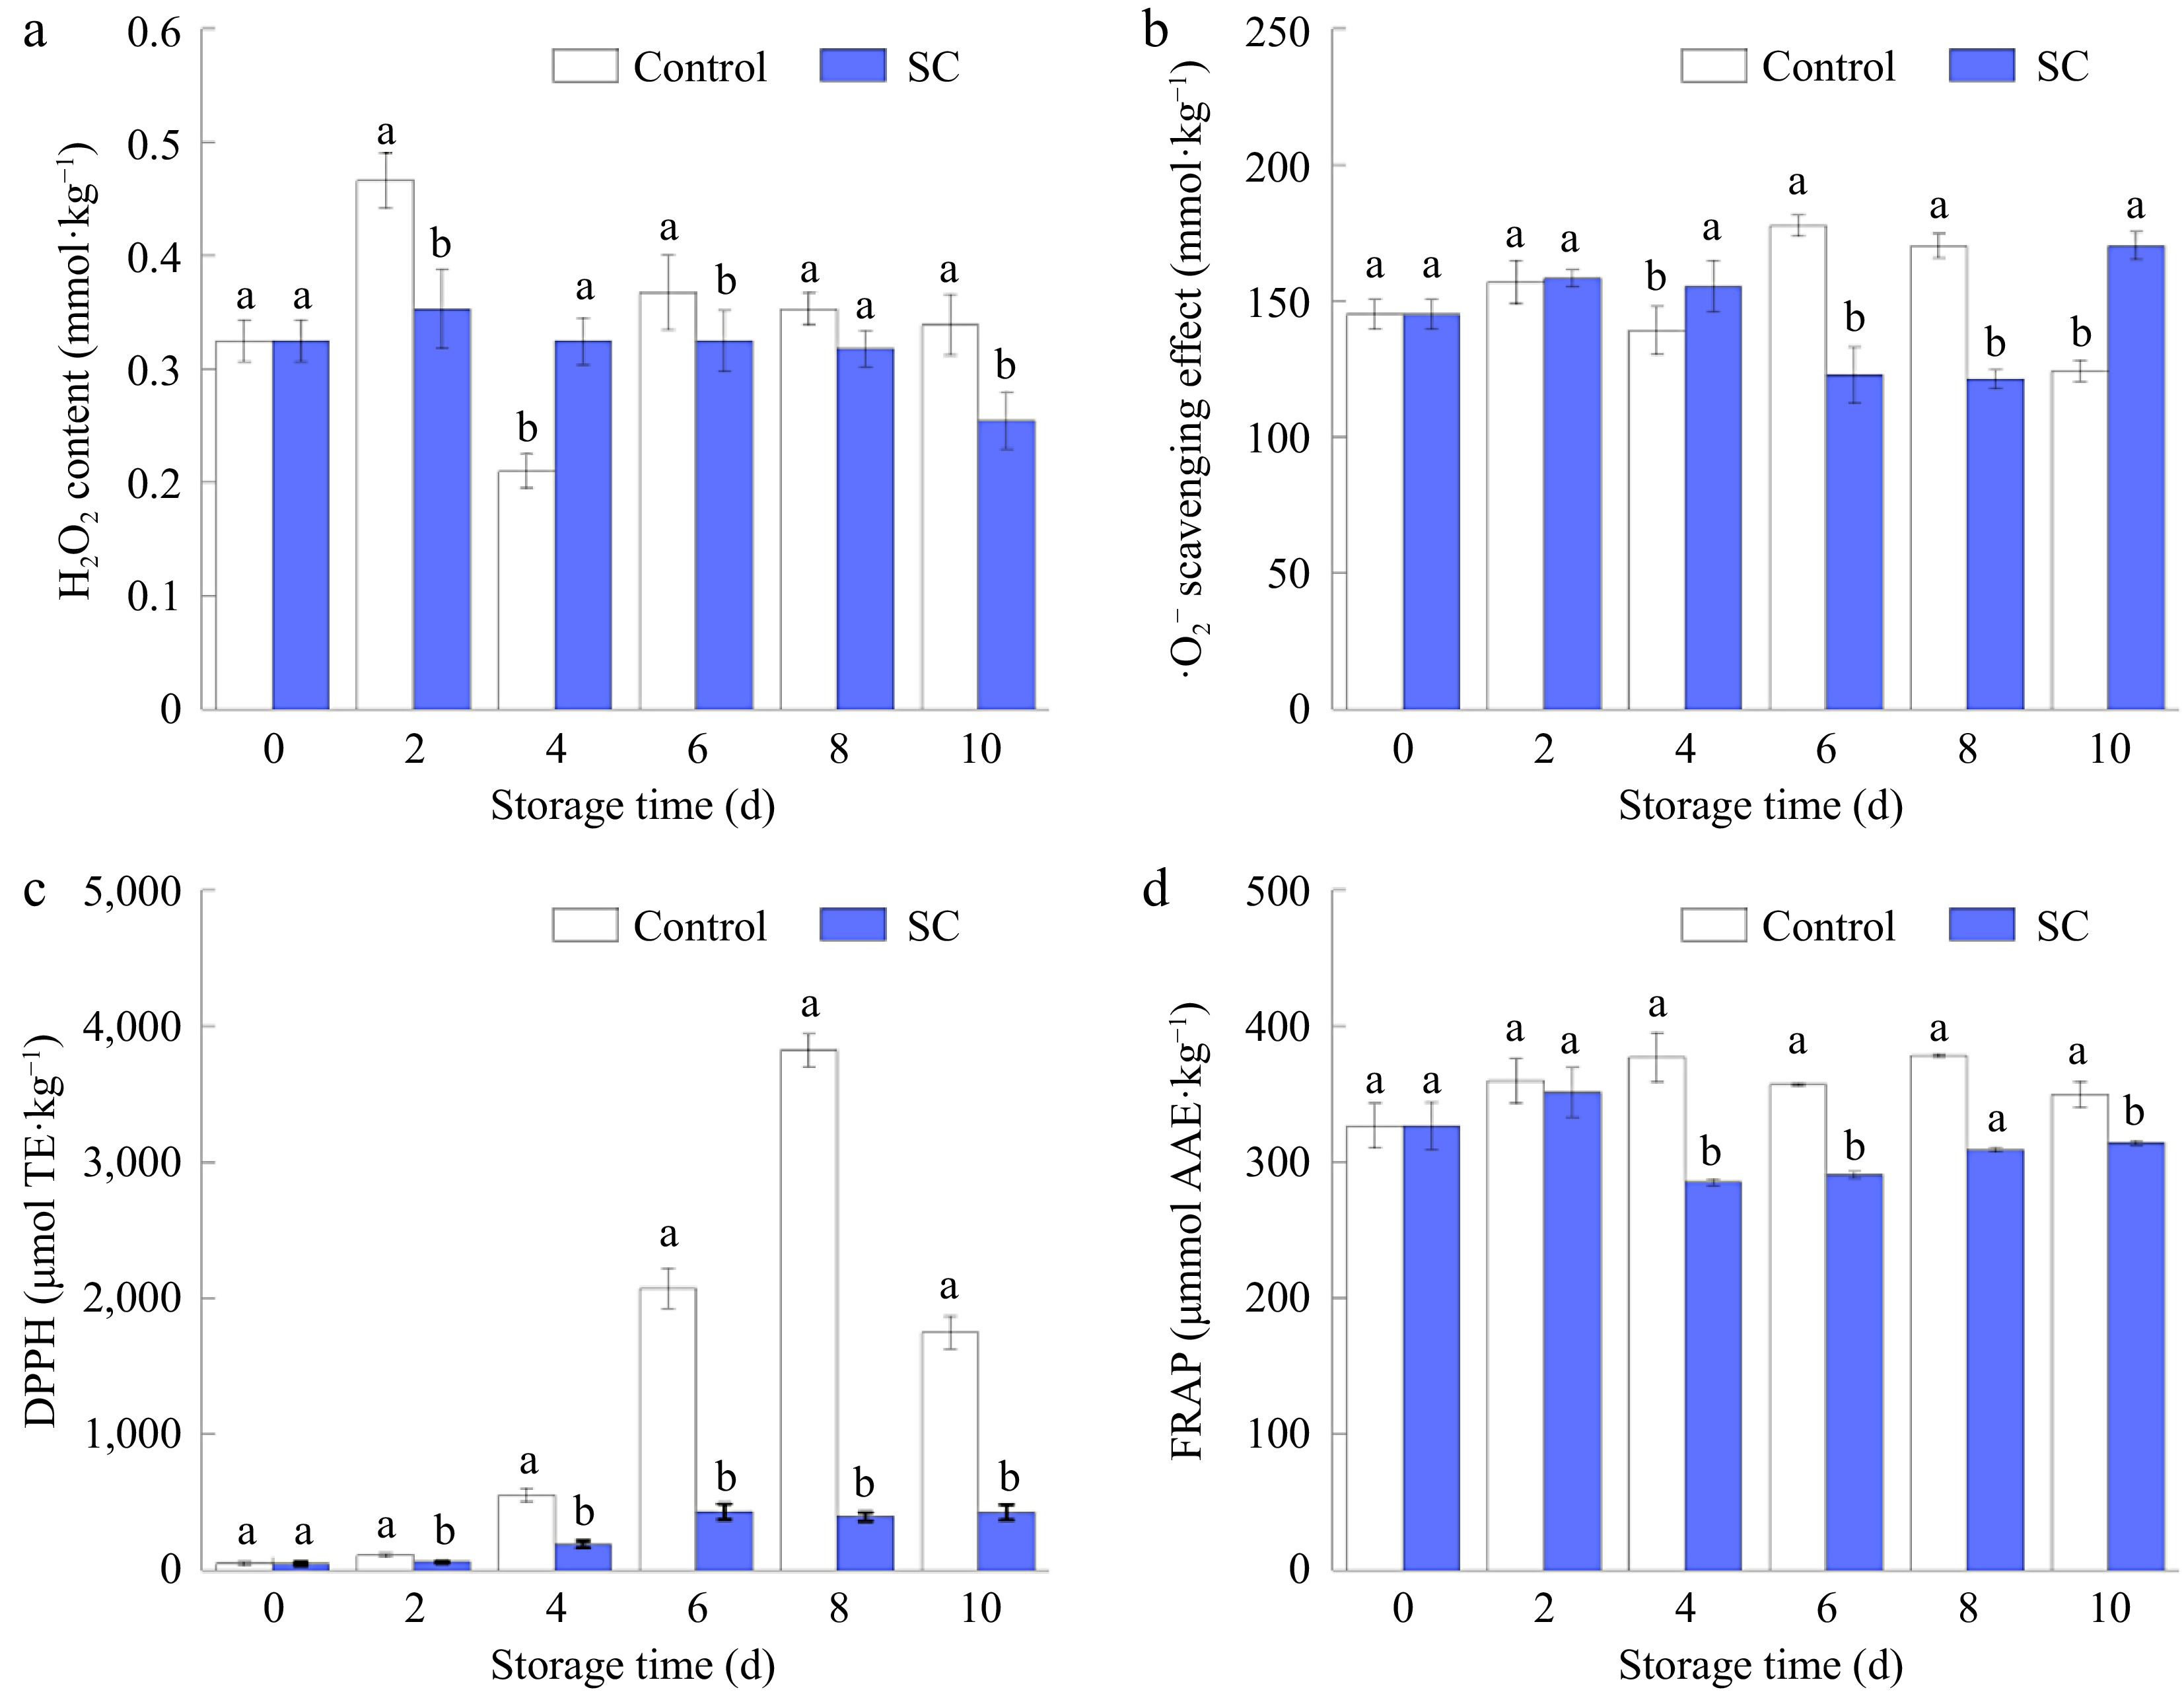
Figure 8.
Changes in (a) H2O2 content, (b) ·O2− scavenging effect, (c) DPPH scavenging effect, and (d) FRAP of fresh-cut potatoes under SC storage and the control during storage of 10 d. Vertical bars show the standard errors. Different letters denote significant differences (p ≤ 0.05) between different storage conditions of the same storage time.
-
Initial freezing point (°C) SC point (°C) Mean −1.7 −3.9 SD 0.4 0.9 SE 0.1 0.2 Min −2.8 −5.4 Max −1.5 −2.2 Initial freezing point: the temperature at which water in potatoes begins to freeze; SC point: between the freezing temperature (FT) and nucleation temperature (NT) without forming ice crystals. Table 1.
Initial freezing point and SC point of fresh-cut potatoes.
Figures
(8)
Tables
(1)