-
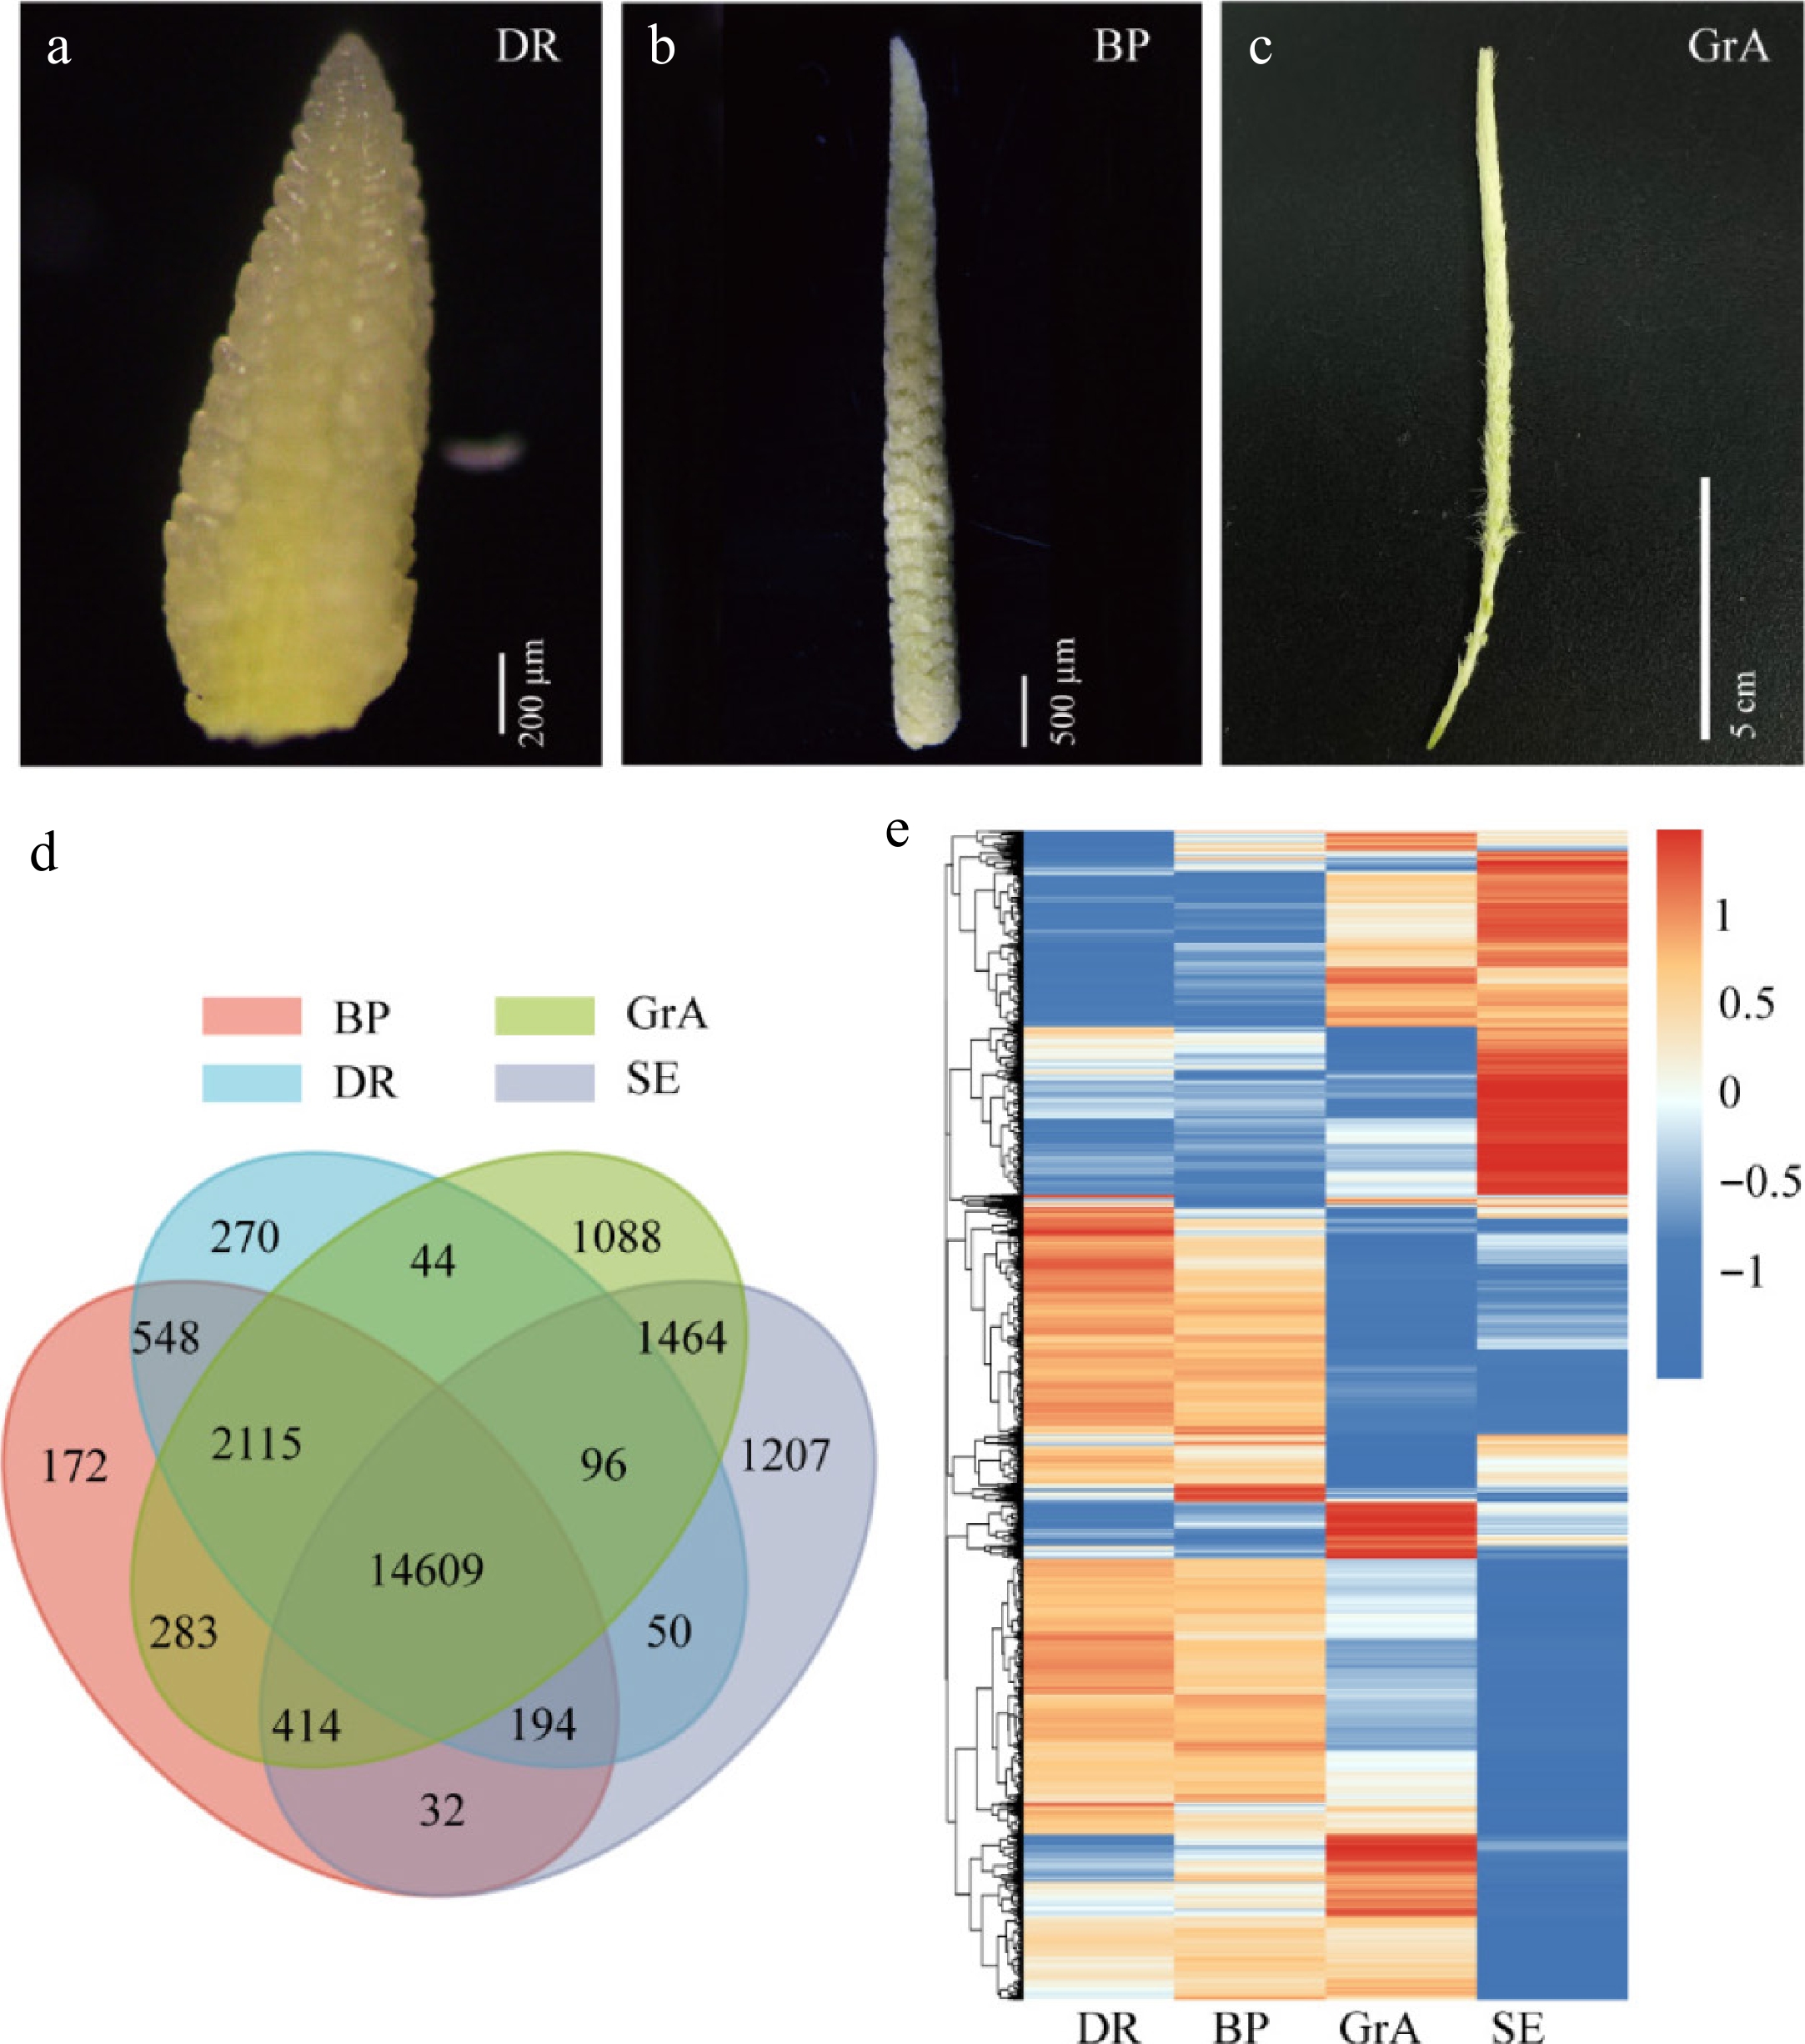
Figure 1.
Global gene expression profiling. (a)–(c) Phenotypic map of three periods of inflorescence development. (a) Scale bar = 200 µm. (b) Scale bar = 500 µm. (c) Scale bar = 5 cm. (d) Venn diagram of the four groups. (e) Hierarchical cluster analysis of genes expressed in four groups.
-
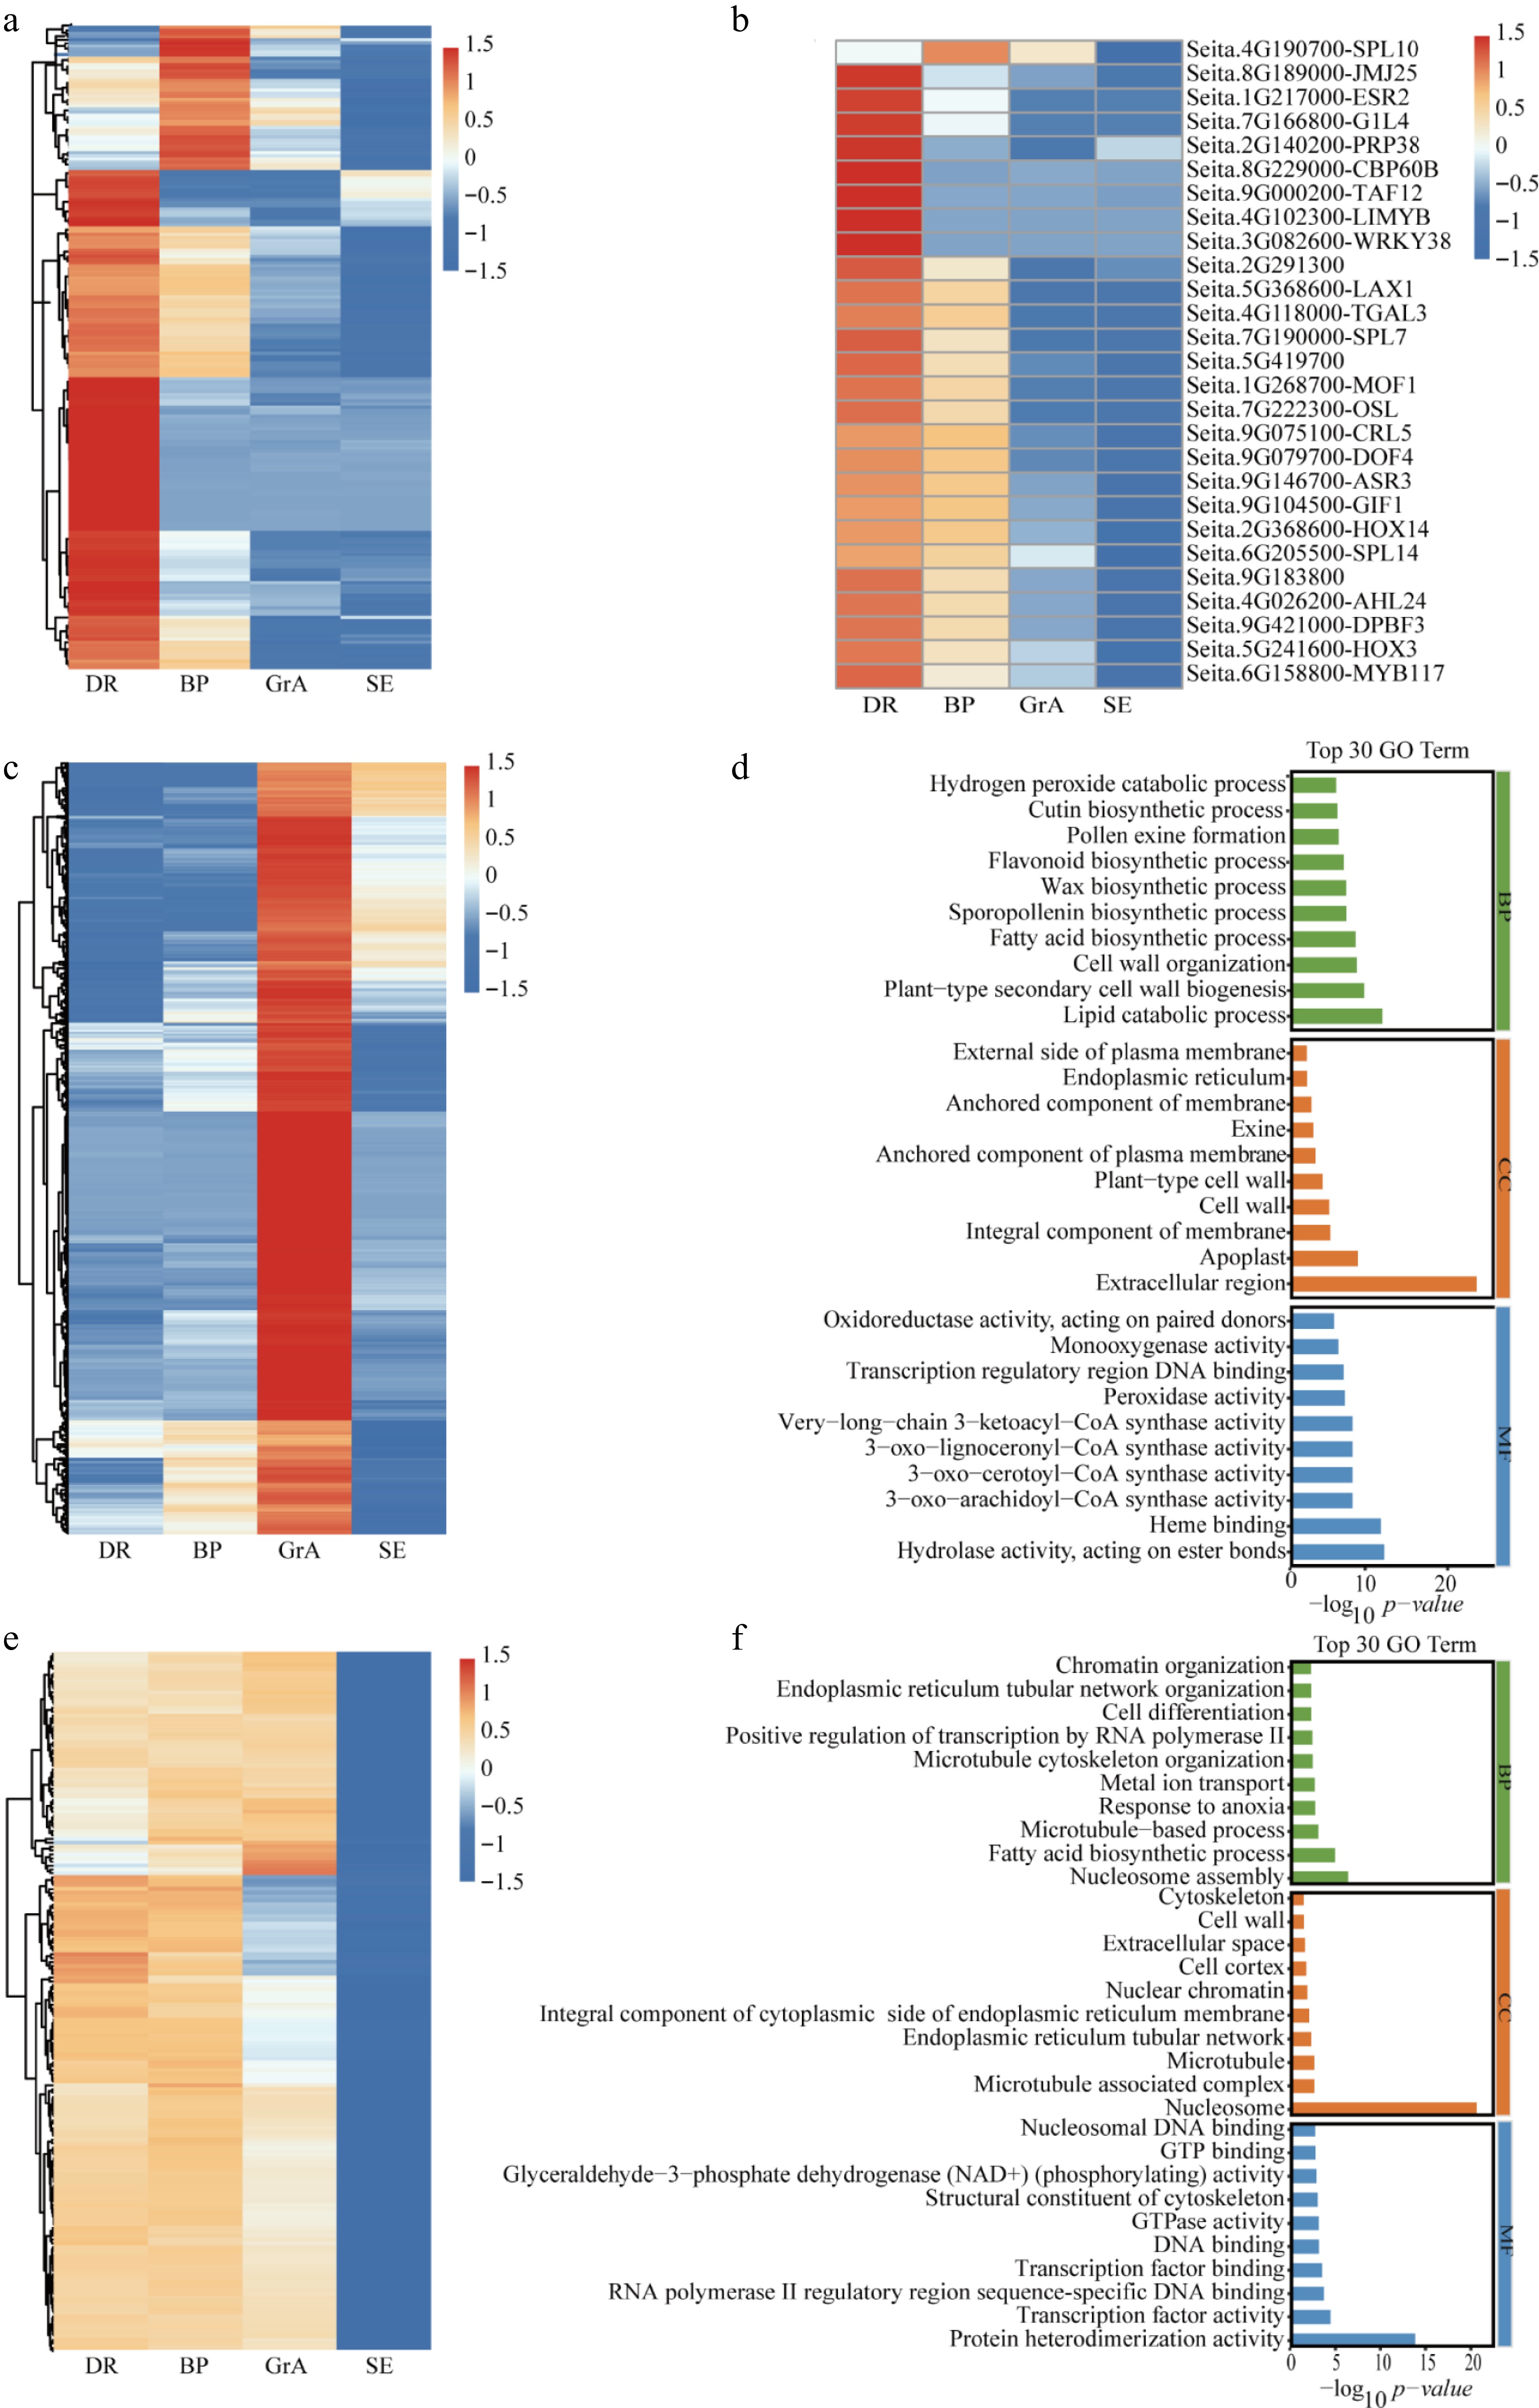
Figure 2.
Analysis of highly expressed genes in each period. (a) Hierarchical cluster analysis of highly expressed in the BP and DR periods. (b) Hierarchical cluster analysis of TFs highly expressed in the BP and DR periods. (c) Hierarchical cluster analysis of highly expressed genes in the GrA period. (d) GO enrichment analysis of the high-expression of genes at GrA stage. (e) Differential expression analysis of the three developmental stages. (f) GO enrichment analysis of the high-expression of genes in three developmental stages. BP: biological process; CC: cellular component; MF: molecular function.
-
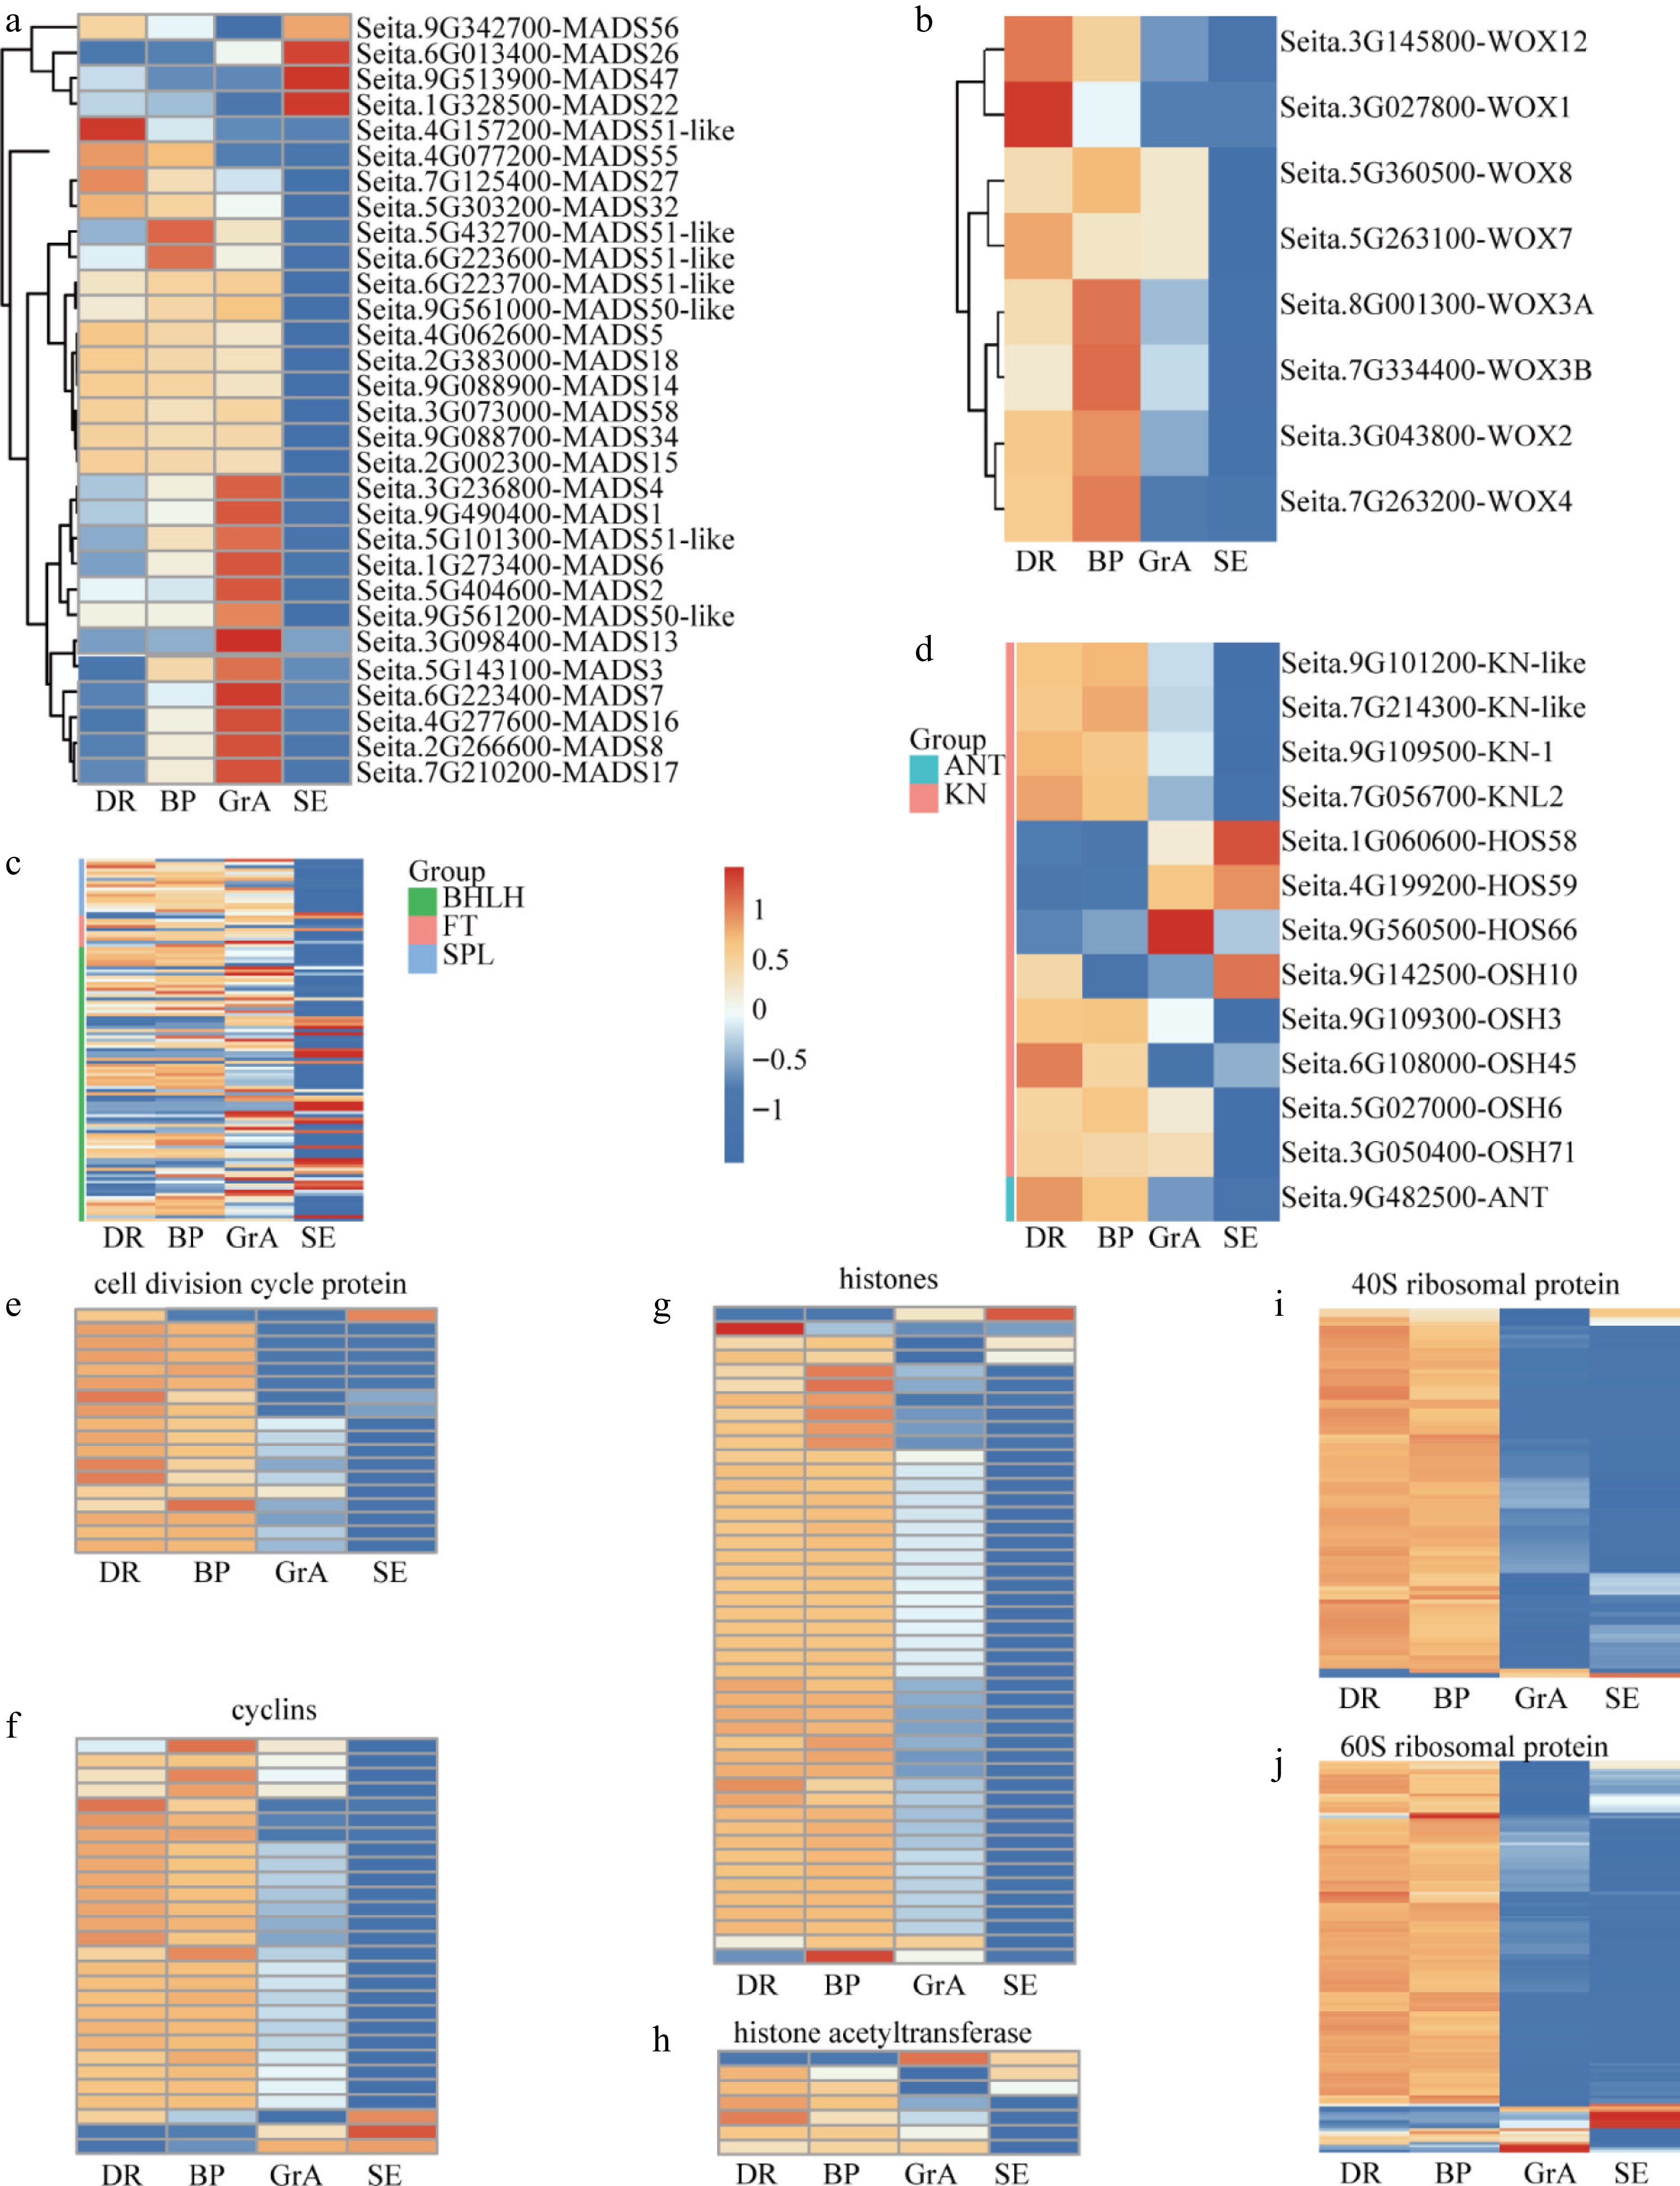
Figure 3.
Expression feature of the key genes in the foxtail millet developing inflorescence. (a) Hierarchical cluster analysis of the SiMADS gene family in foxtail millet developing inflorescence. Hierarchical cluster analysis of genes regulating (b) meristem signaling, (c) meristem identity, and (d) floral organ development, respectively. Hierarchical cluster analysis of (e) cell division cycle protein, (f) cyclins, (g) histones, (h) histone acetyltransferase, (i) 40S ribosomal protein and (j) 60S ribosomal protein during the development of foxtail millet inflorescence and seedlings.
-
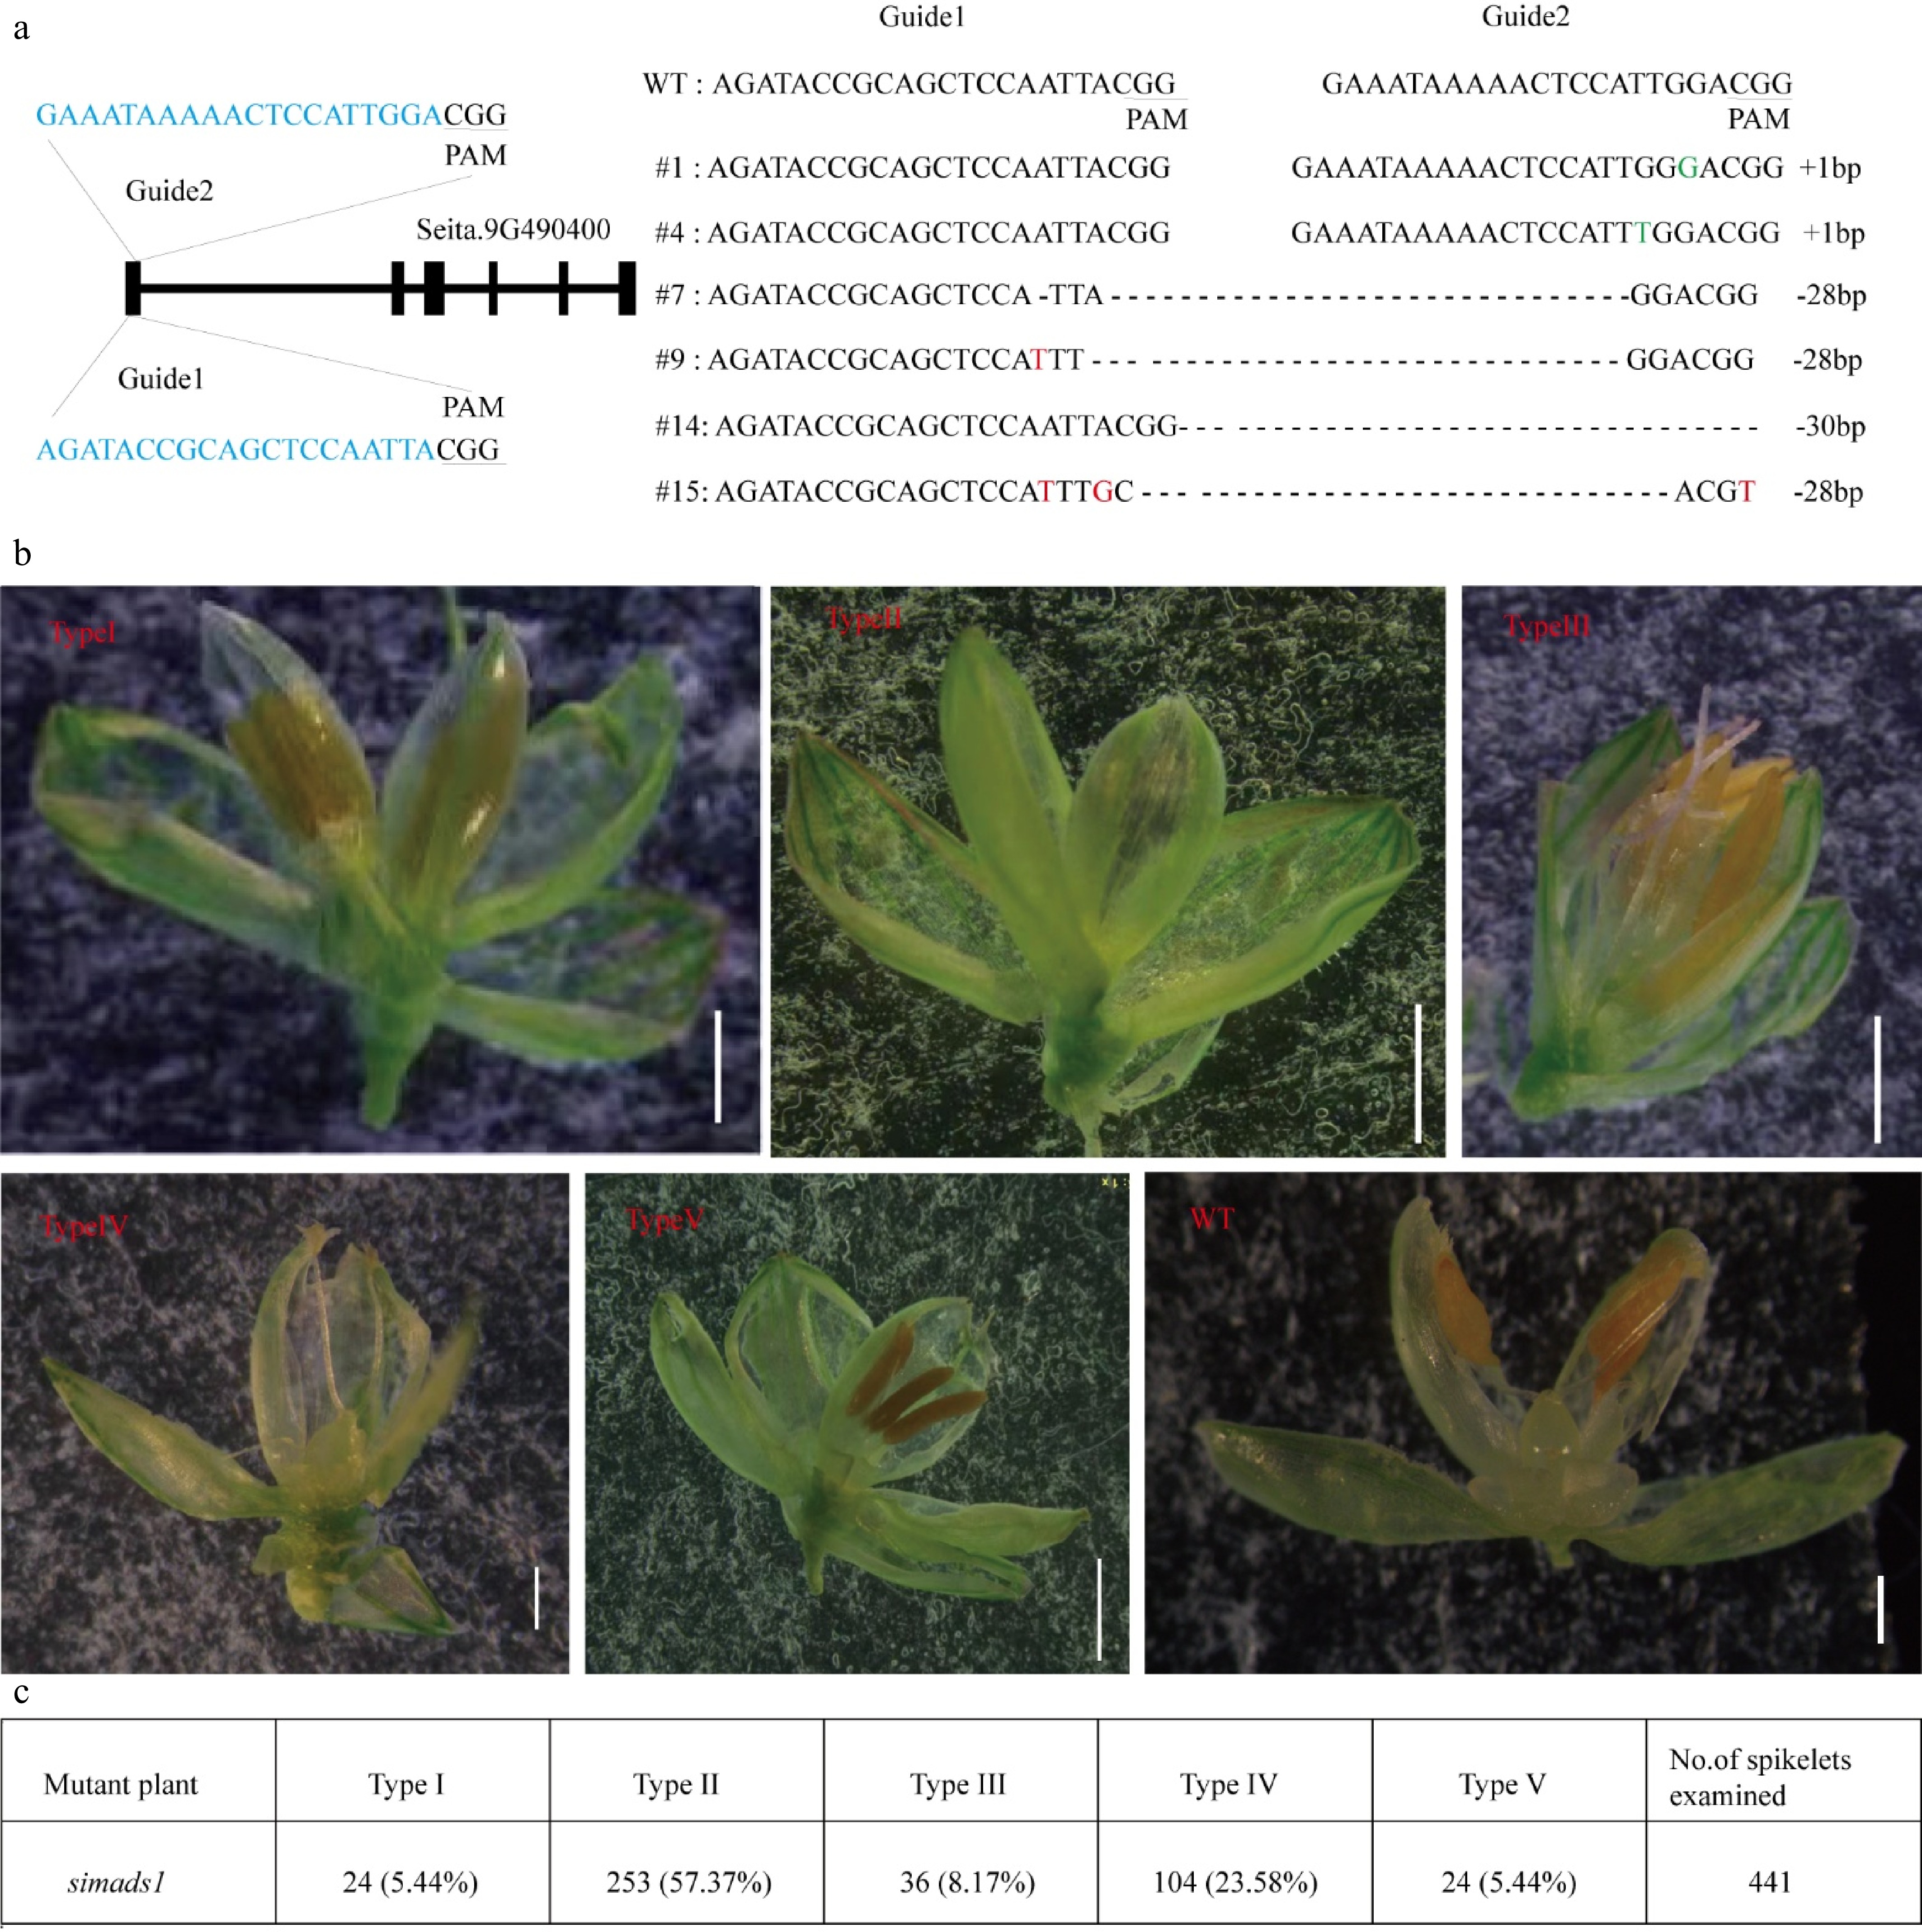
Figure 4.
Gene structure diagram and phenotype analysis of WT and simads1 knockout line. (a) Gene structure map and identification of mutation site. (b) Phenotype analysis of simads1 and WT flower. Type I: double flower (Scale bar = 1 mm); Type II: empty shell (Scale bar = 1 mm); Type III: stigma dysplasia (Scale bar = 1 mm); Type IV: anther deletion (Scale bar = 500 μm); Type V: Ovule deletion (Scale bar = 1 mm); WT (Scale bar = 500 μm). (c) The number and percentage of five types in simads1 flowers.
-
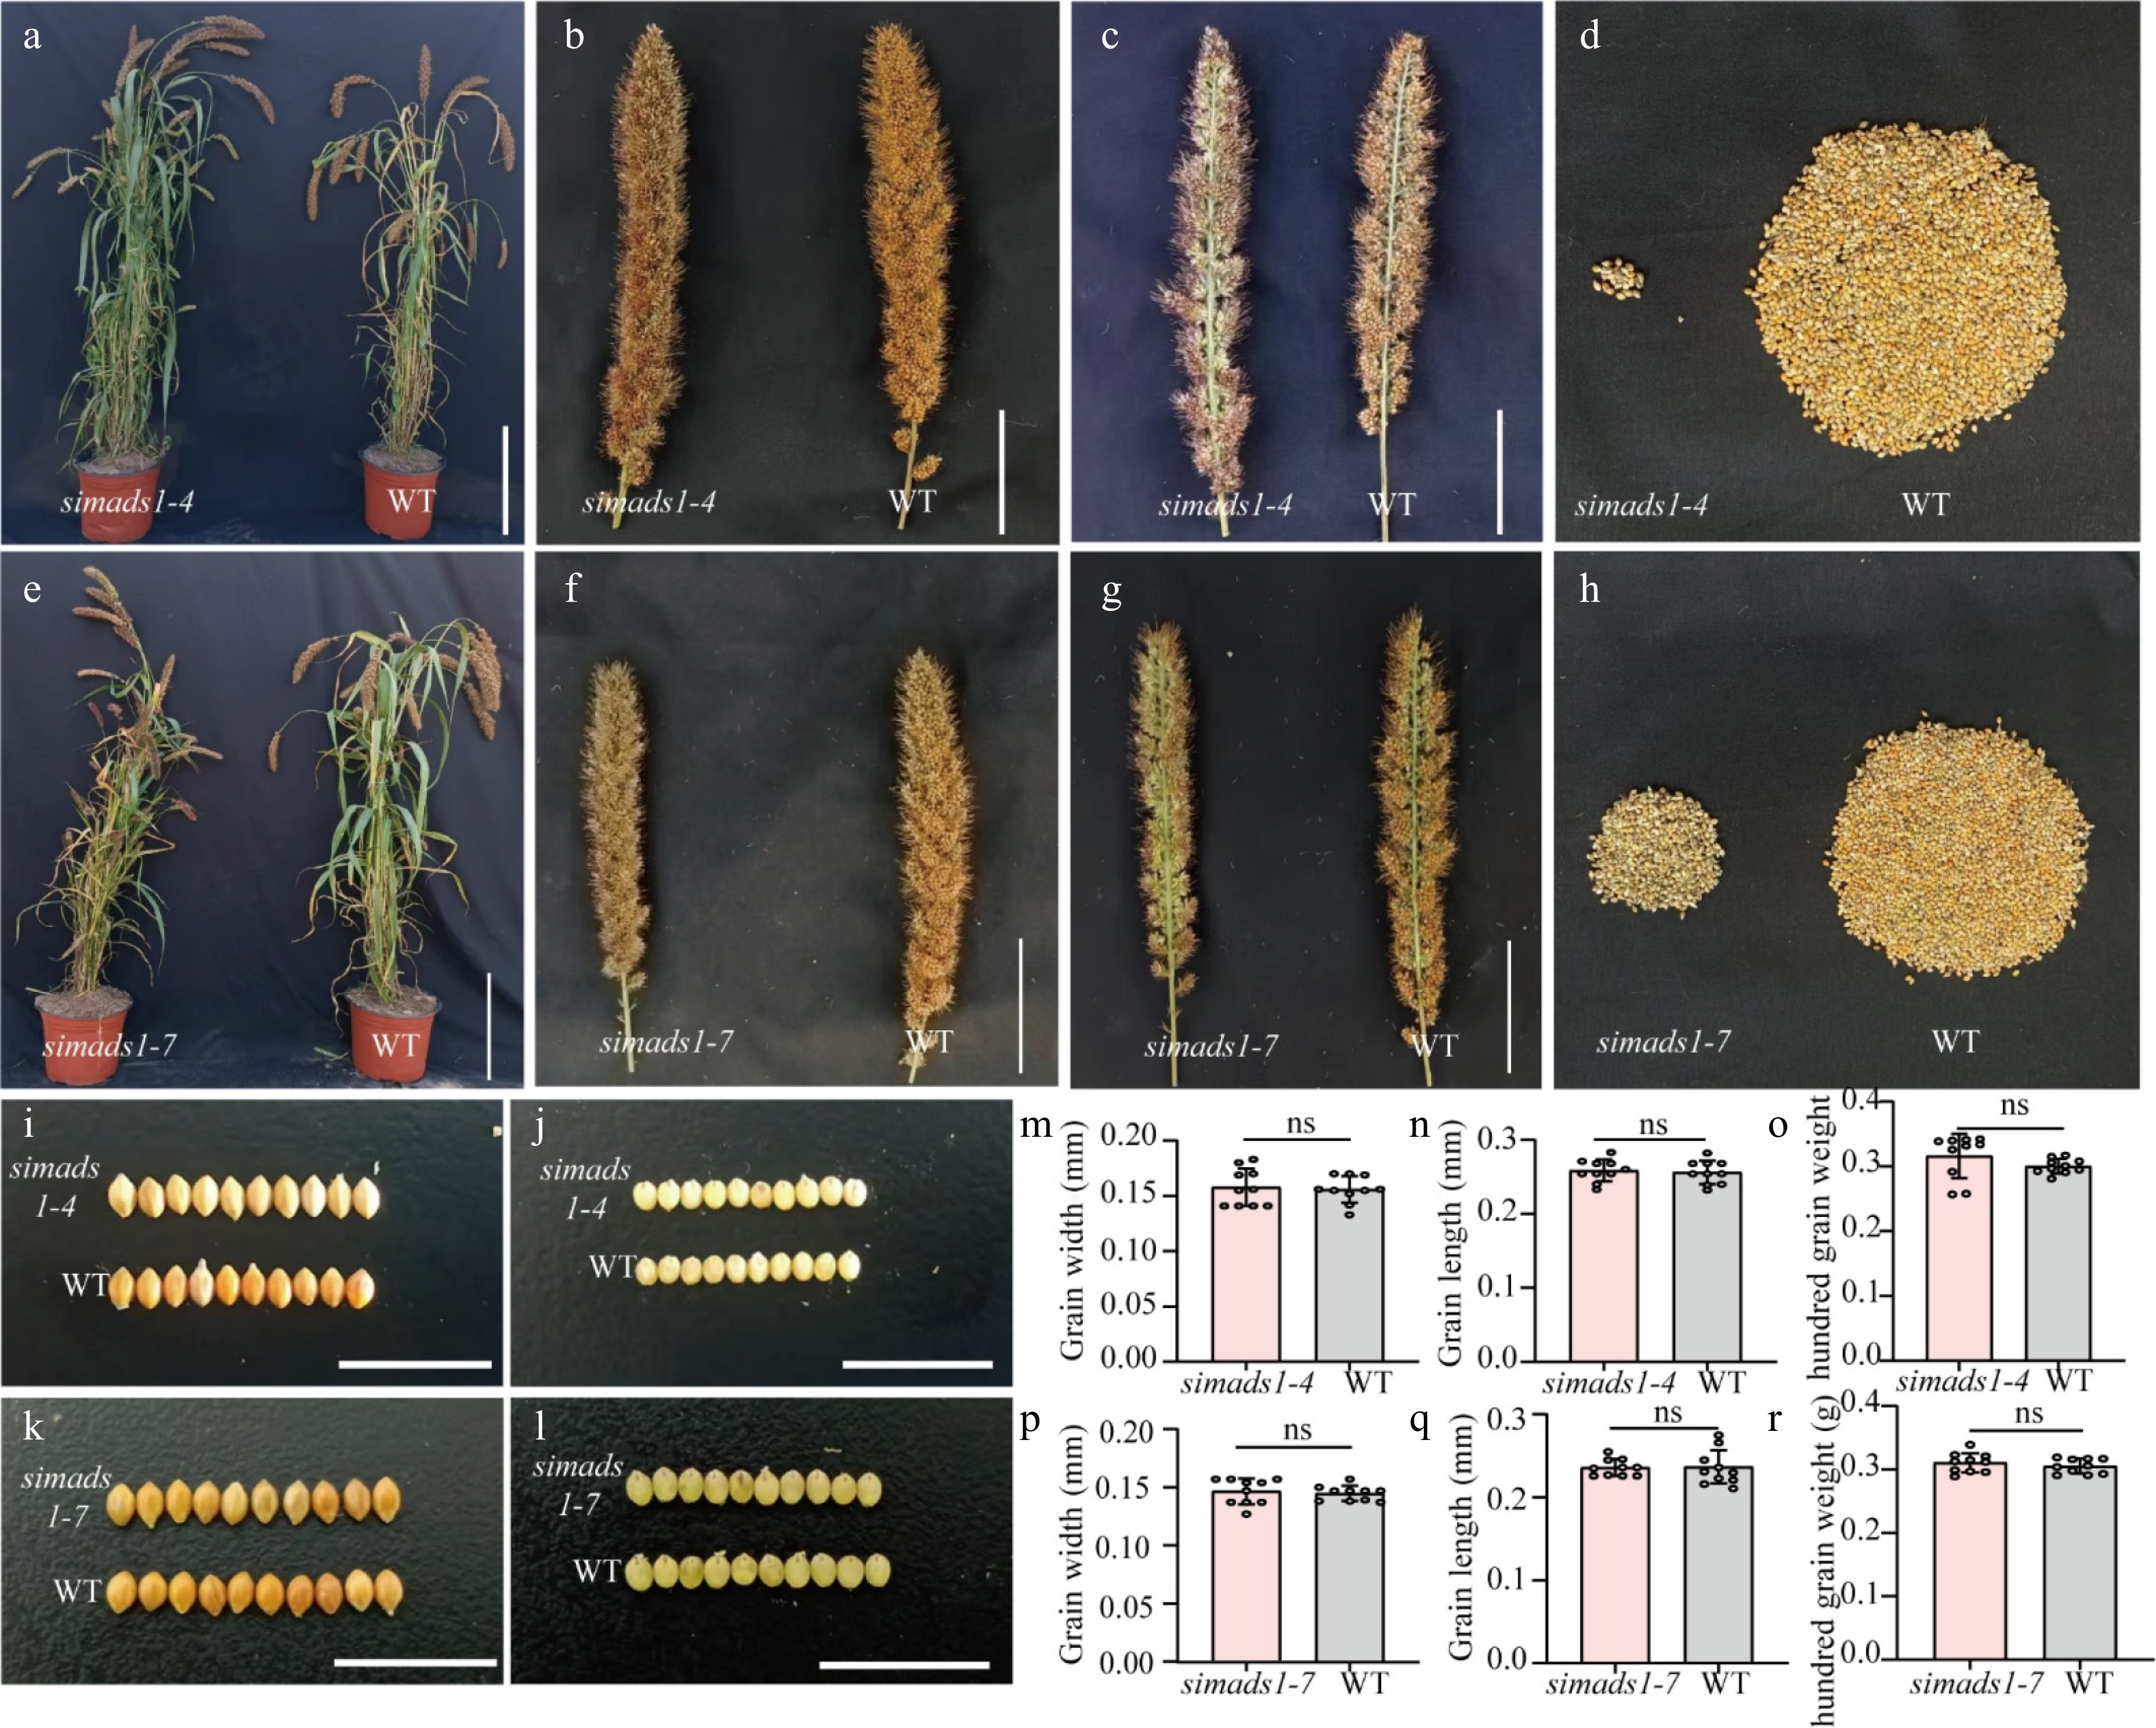
Figure 5.
Phenotypic analysis of simads1 and WT. (a)–(d) Phenotypic analysis of WT and simads1-4. (e)–(h) Phenotypic analysis of WT and simads1-7. (a) and (e) Scale bar = 25 cm. (b), (c), (f) and (g) Scale bar = 5 cm. (i) and (j) Grain size of WT and simads1-4. (k) and (l) Grain size of WT and simads1-7. Scale bar = 1 cm. (m)–(o) Grain width, grain length and hundred grain weight of WT and simads1-4. (p)–(r) Grain width, grain length, and hundred grain weight of WT and simads1-7. Statistically significant differences between samples are represented by the number of asterisks on the column (* p-value < 0.05, ns: not significant).
-
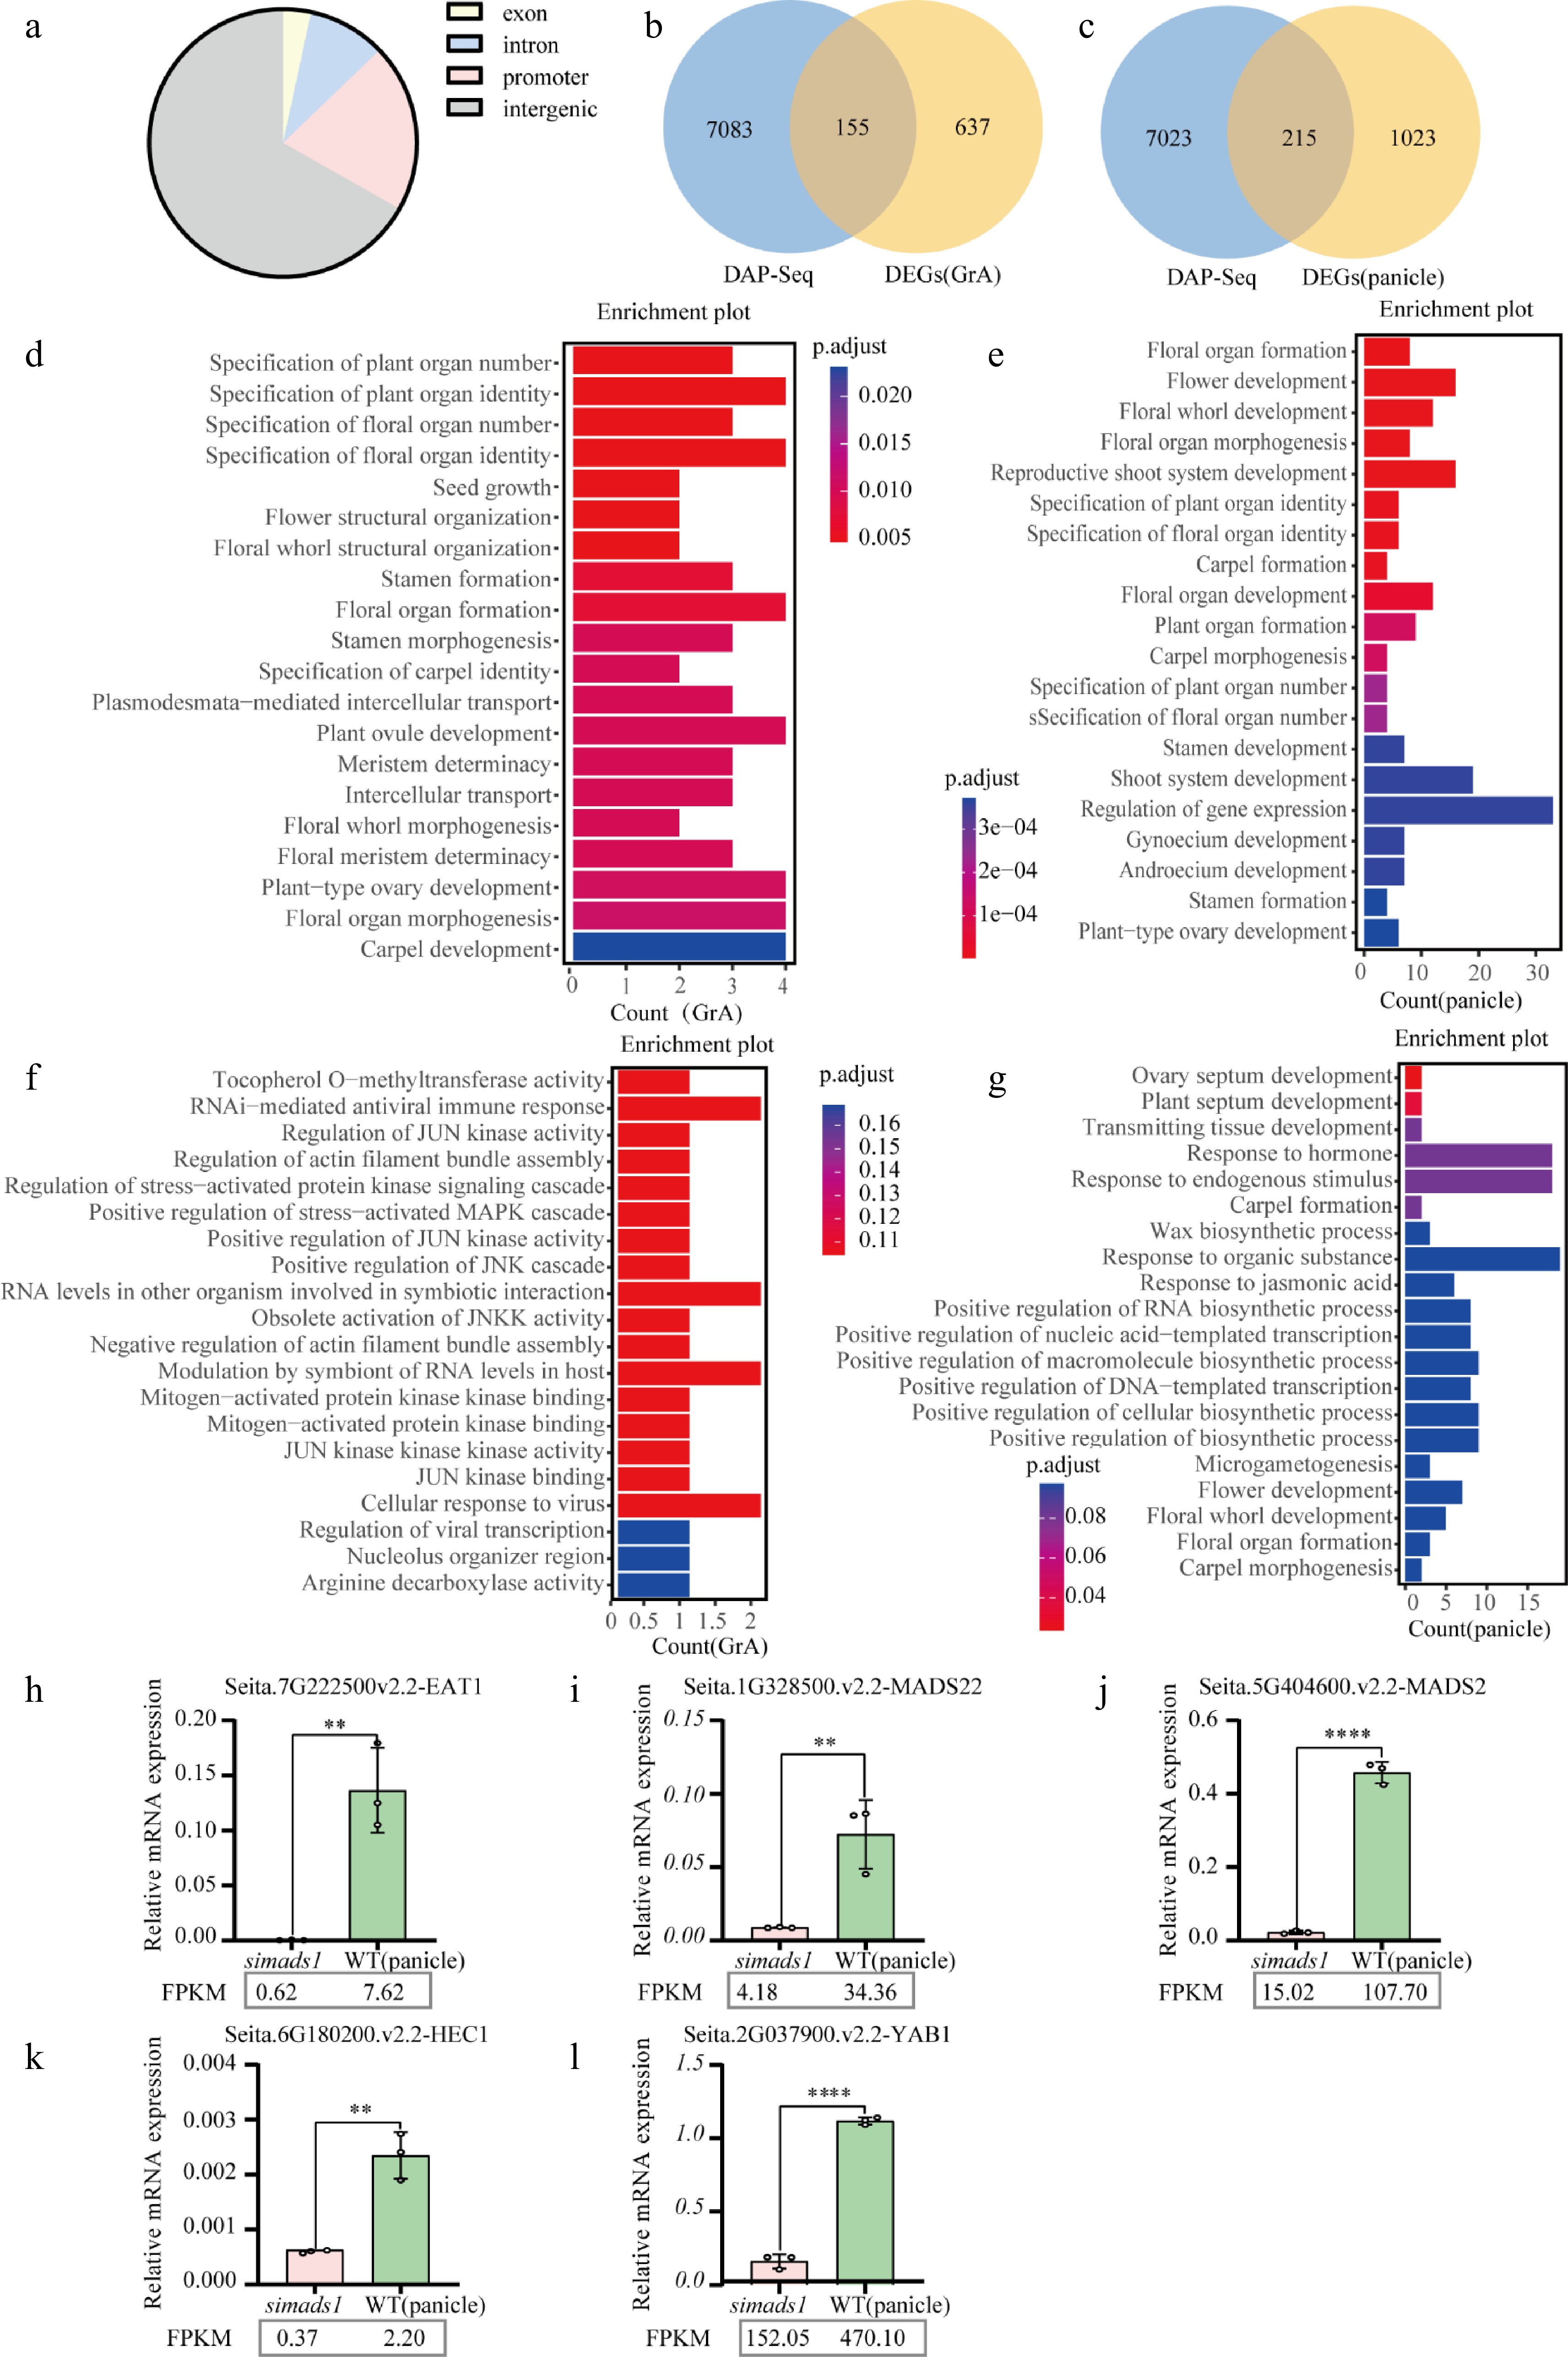
Figure 6.
Combined analysis of RNA-seq and DAP-seq. (a) Distribution of SiMADS1 binding regions in the foxtail millet genome. (b) and (c) The Venn diagram shows the overlapping genes of SiMADS1 binding genes and DEGs. (d) and (e) Gene ontology (GO) enrichment analysis was performed for genes with overlap between SiMADS1 binding genes and DEGs. (f) and (g) Gene ontology (GO) enrichment was used to analyze the overlapping genes between SiMADS1 binding genes, and DEGs in the promoter region. (h)–(l) The representative genes related to inflorescence development at spikelet period were quantitatively confirmed by RT-qPCR. The ACTIN gene served as the internal control in this study. The error bars represent the standard deviation of three biological replicates. Statistically significant differences between samples are represented by the number of asterisks on the column (** p < 0.01, **** p < 0.0001).
Figures
(6)
Tables
(0)