-
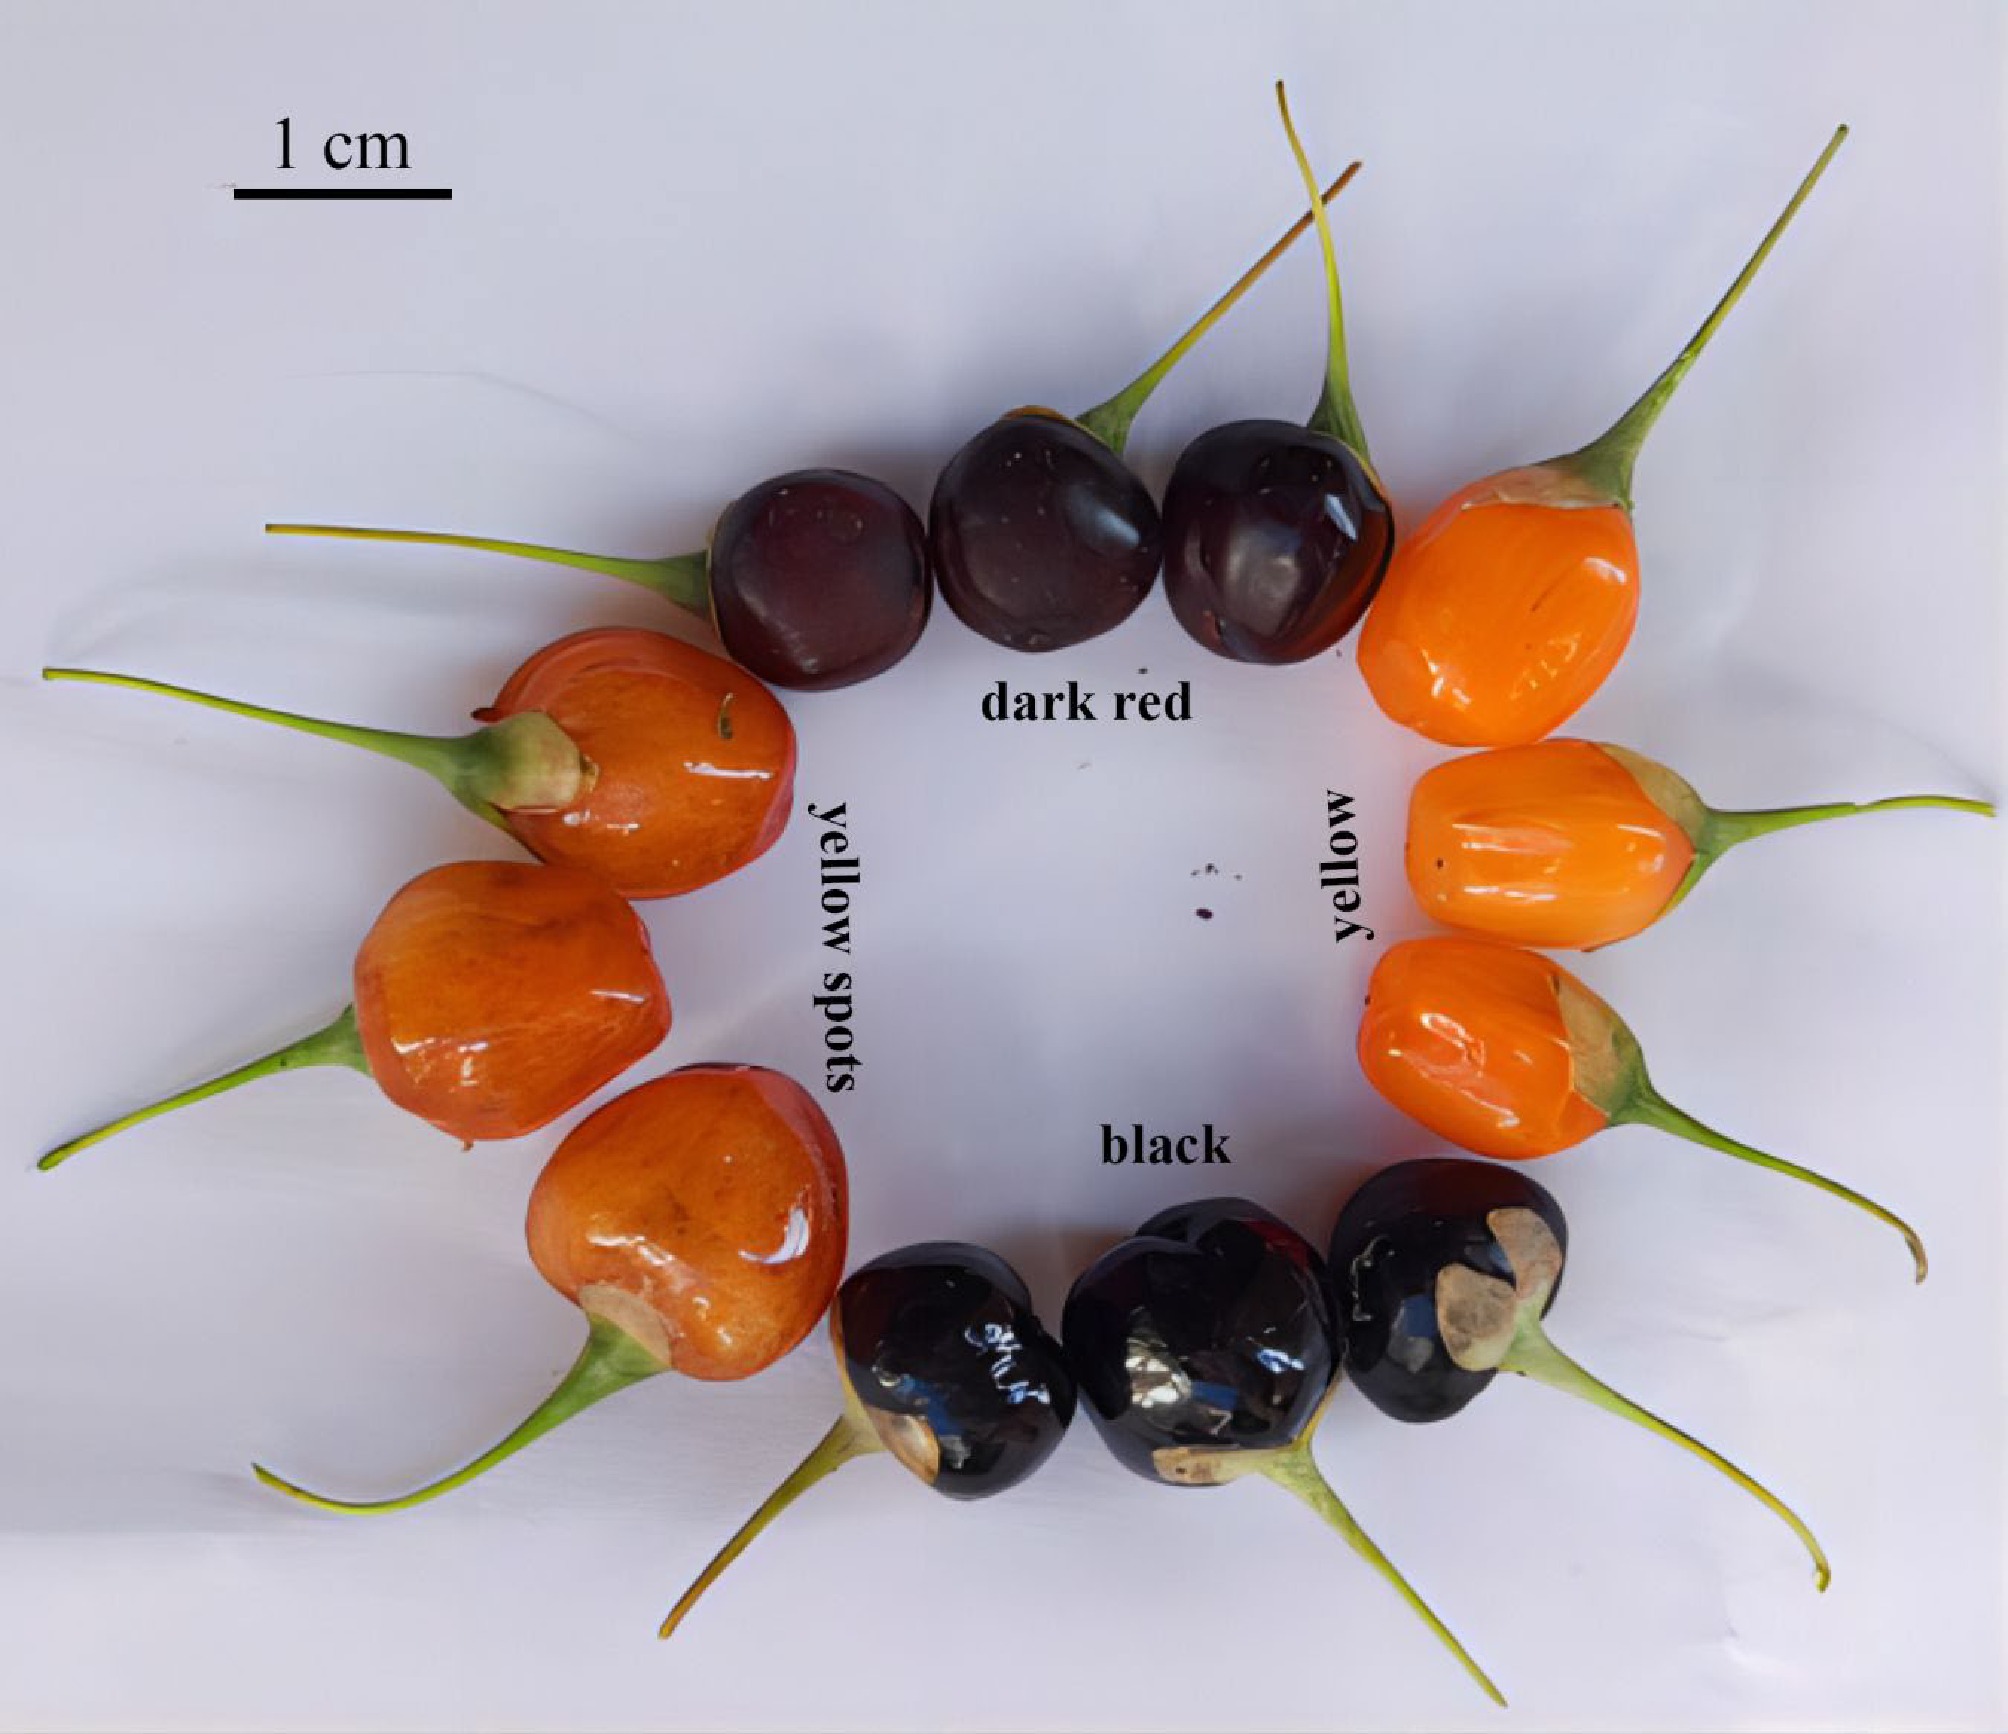
Figure 1.
The four fruit colors of hybrids collected in the field.
-
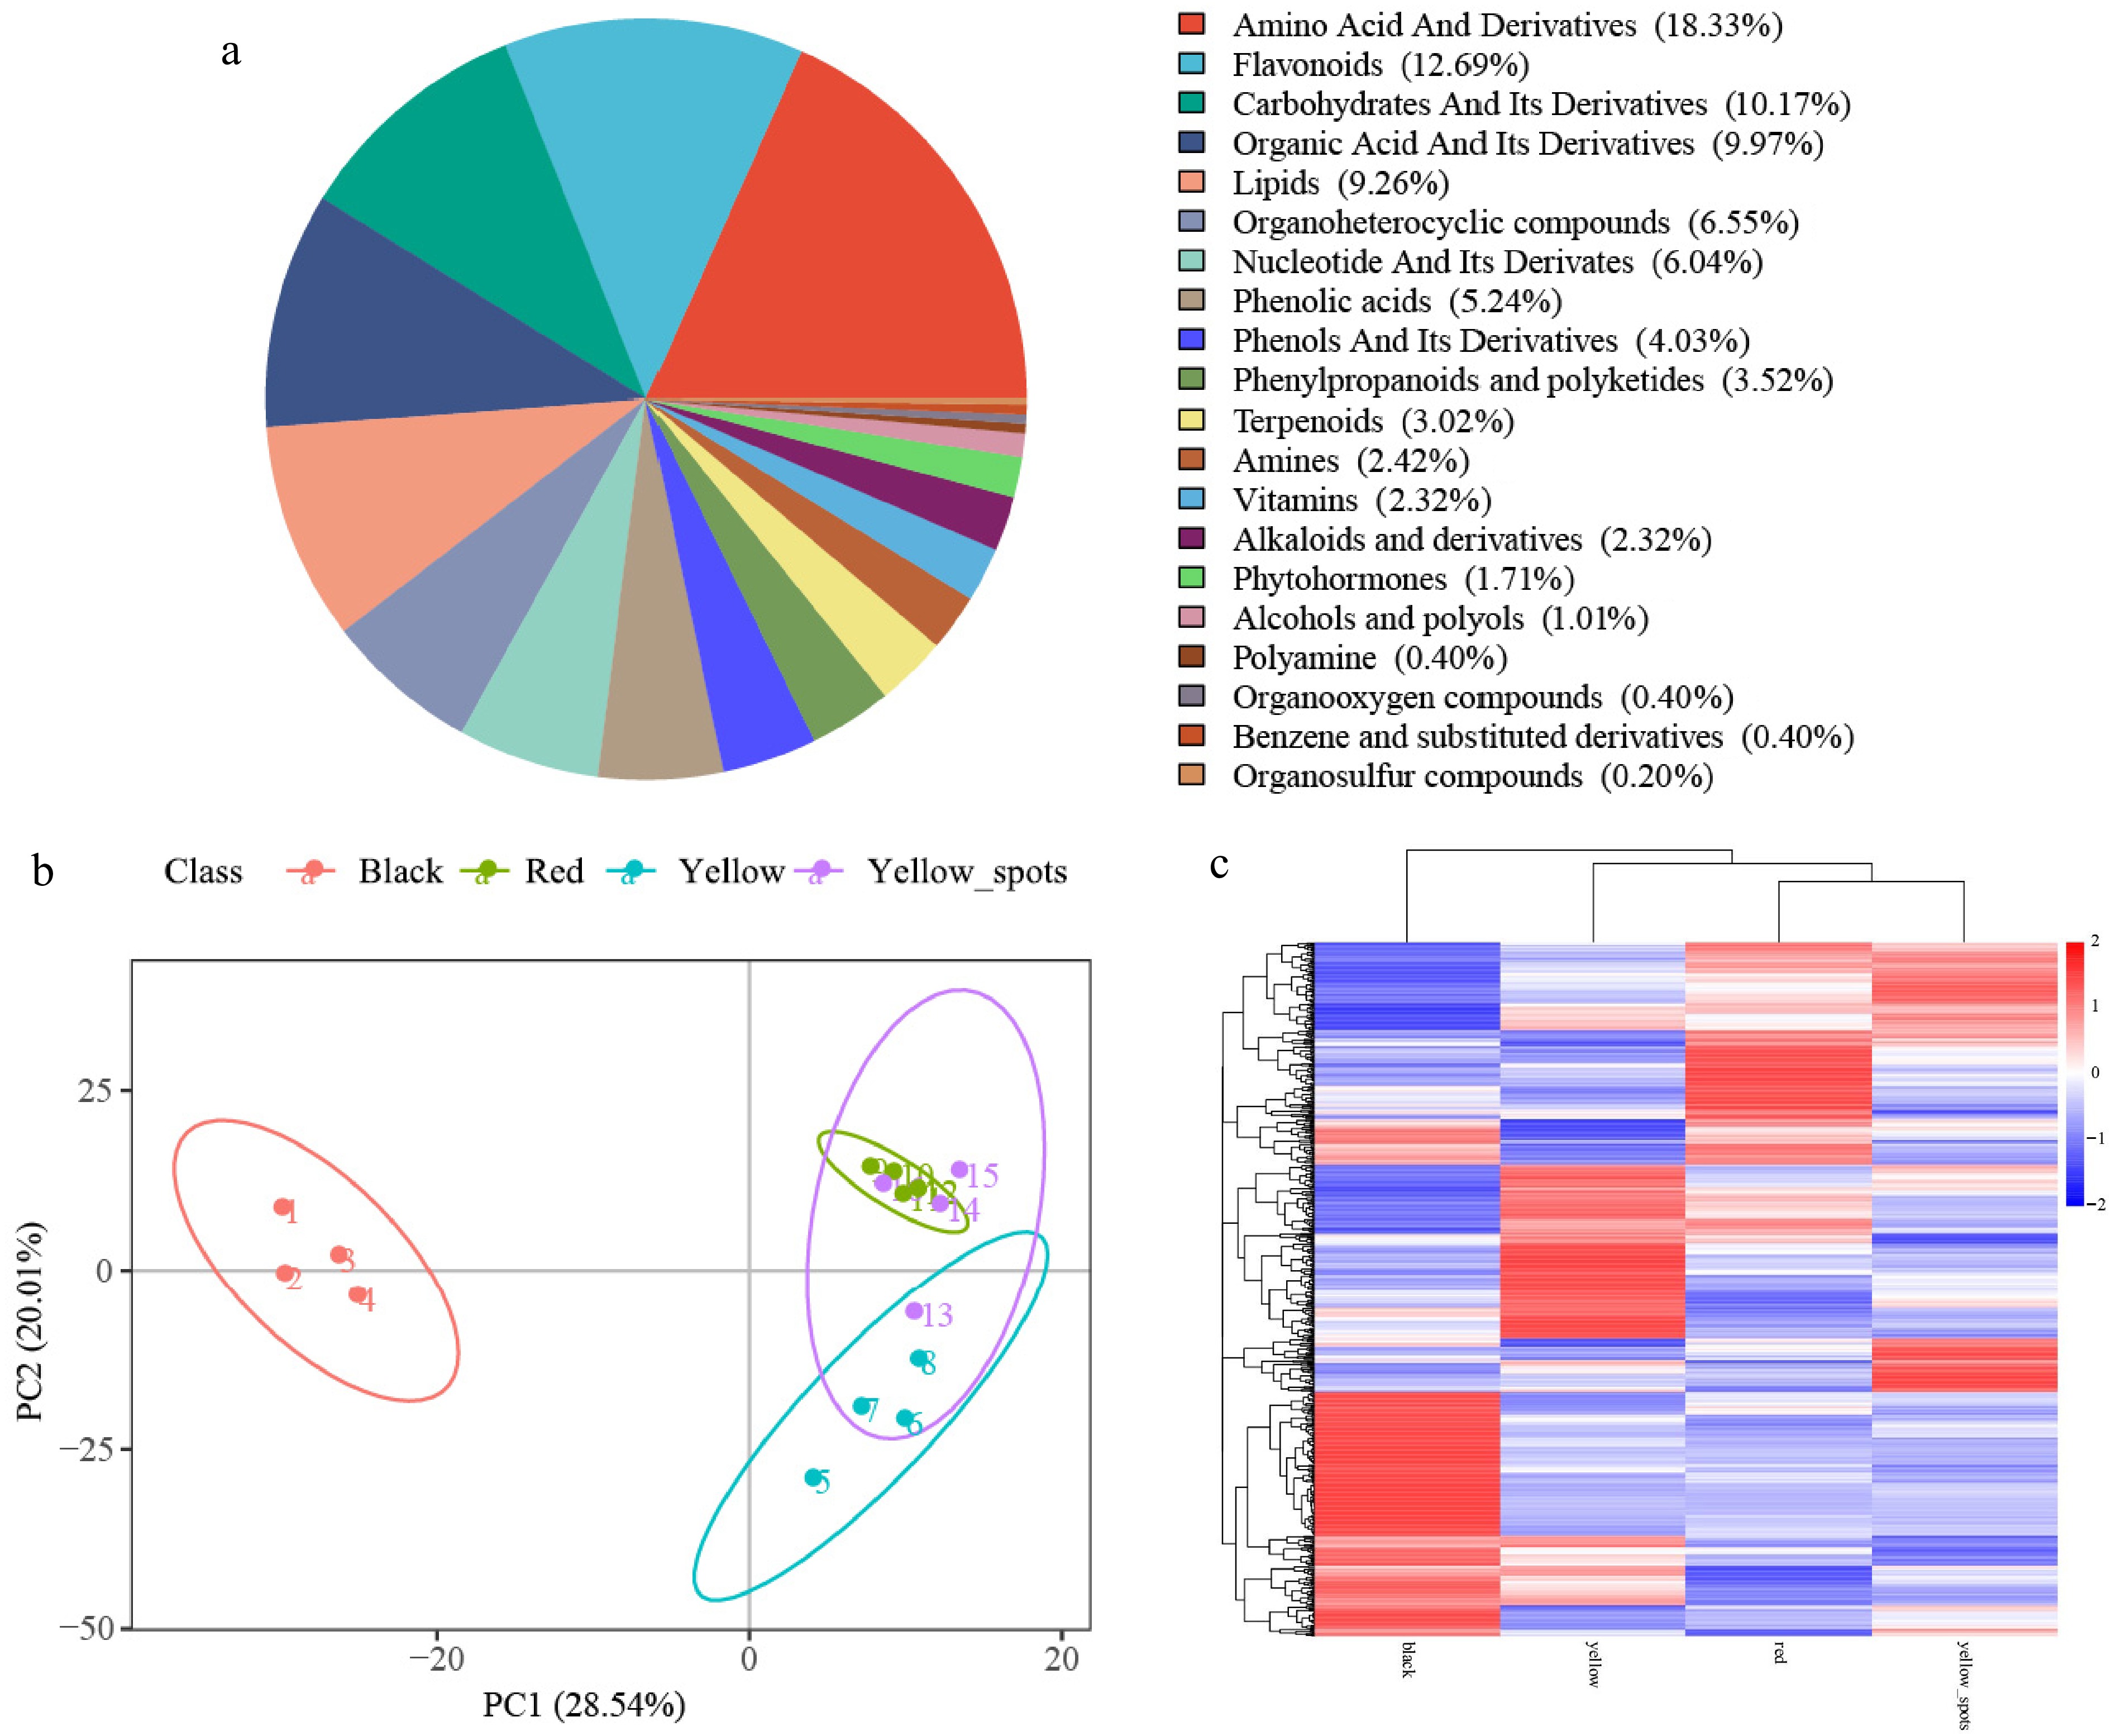
Figure 2.
Metabolomic profiling of four fruit types. (a) Pie chart of metabolite class distribution. (b) PCA analysis of metabolites. (c) Heatmap of all detected metabolites.
-
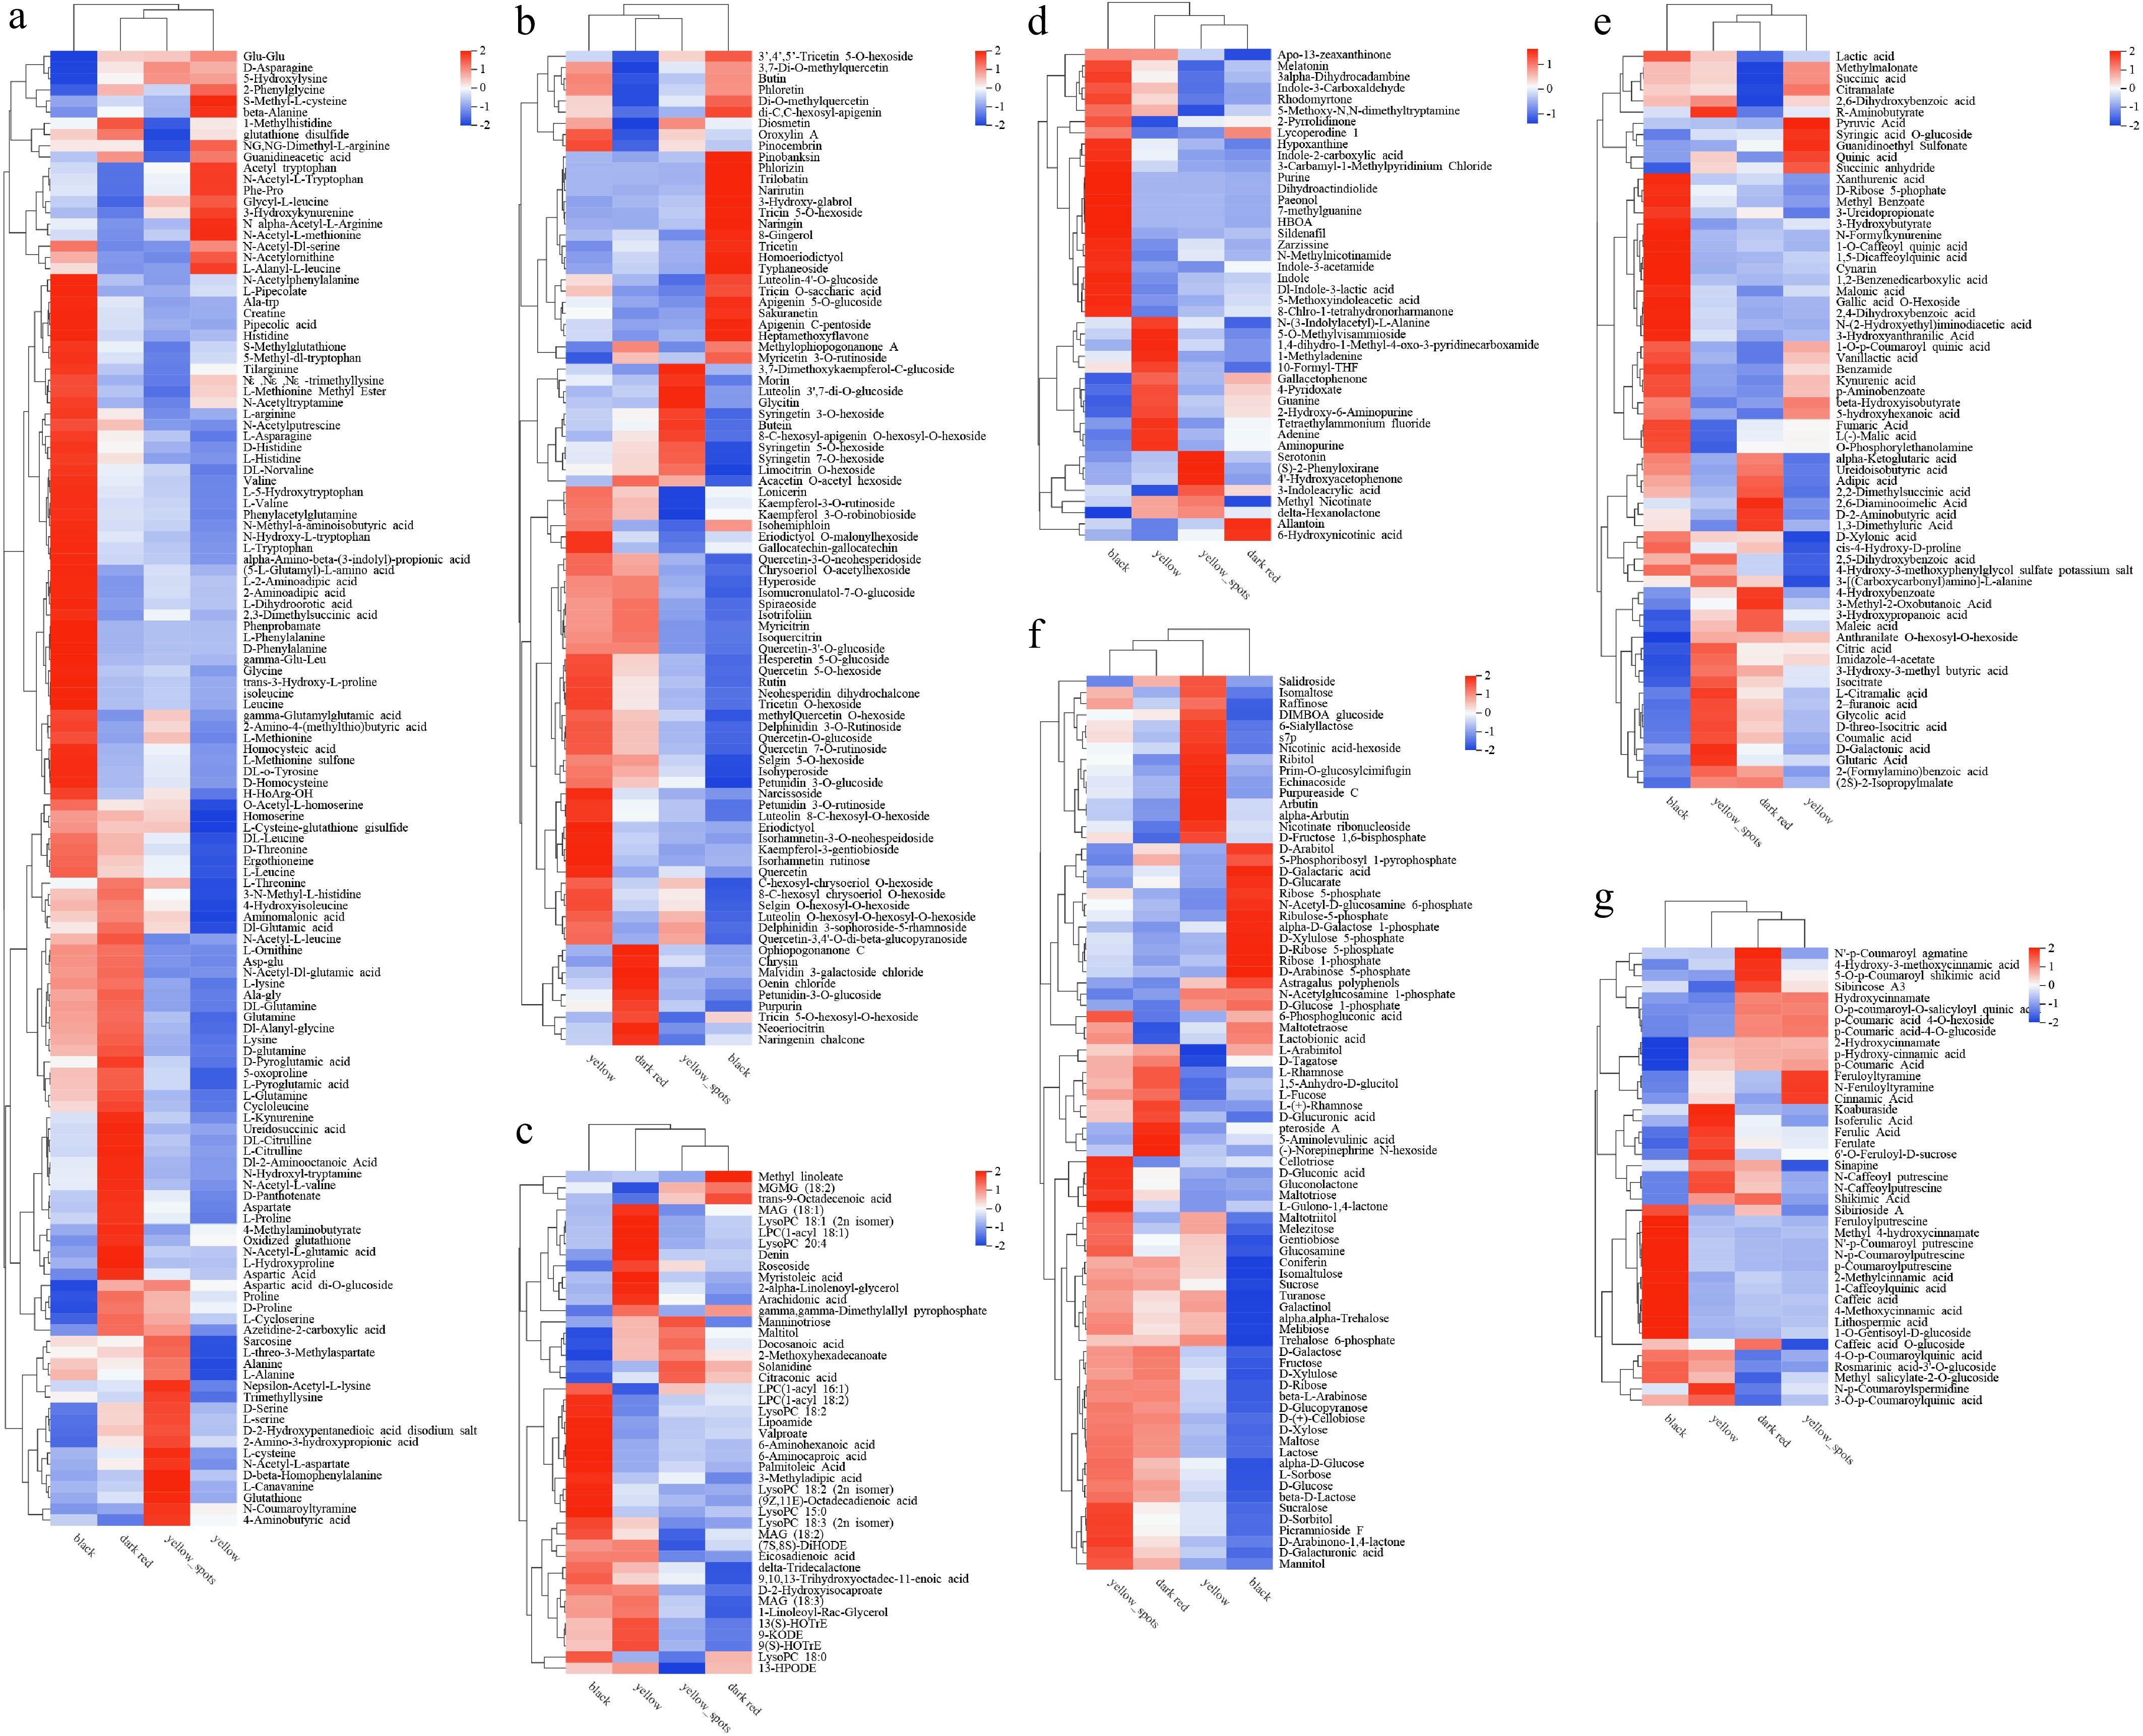
Figure 3.
Heat map of main metabolite types related to fruit color and quality. (a) Amino acids, (b) flavonoids, (c) lipids, (d) organoheterocyclic compounds, (e) organic acids and their derivatives, (f) carbohydrates and their derivatives, (g) phenolic acids, in four fruit types.
-
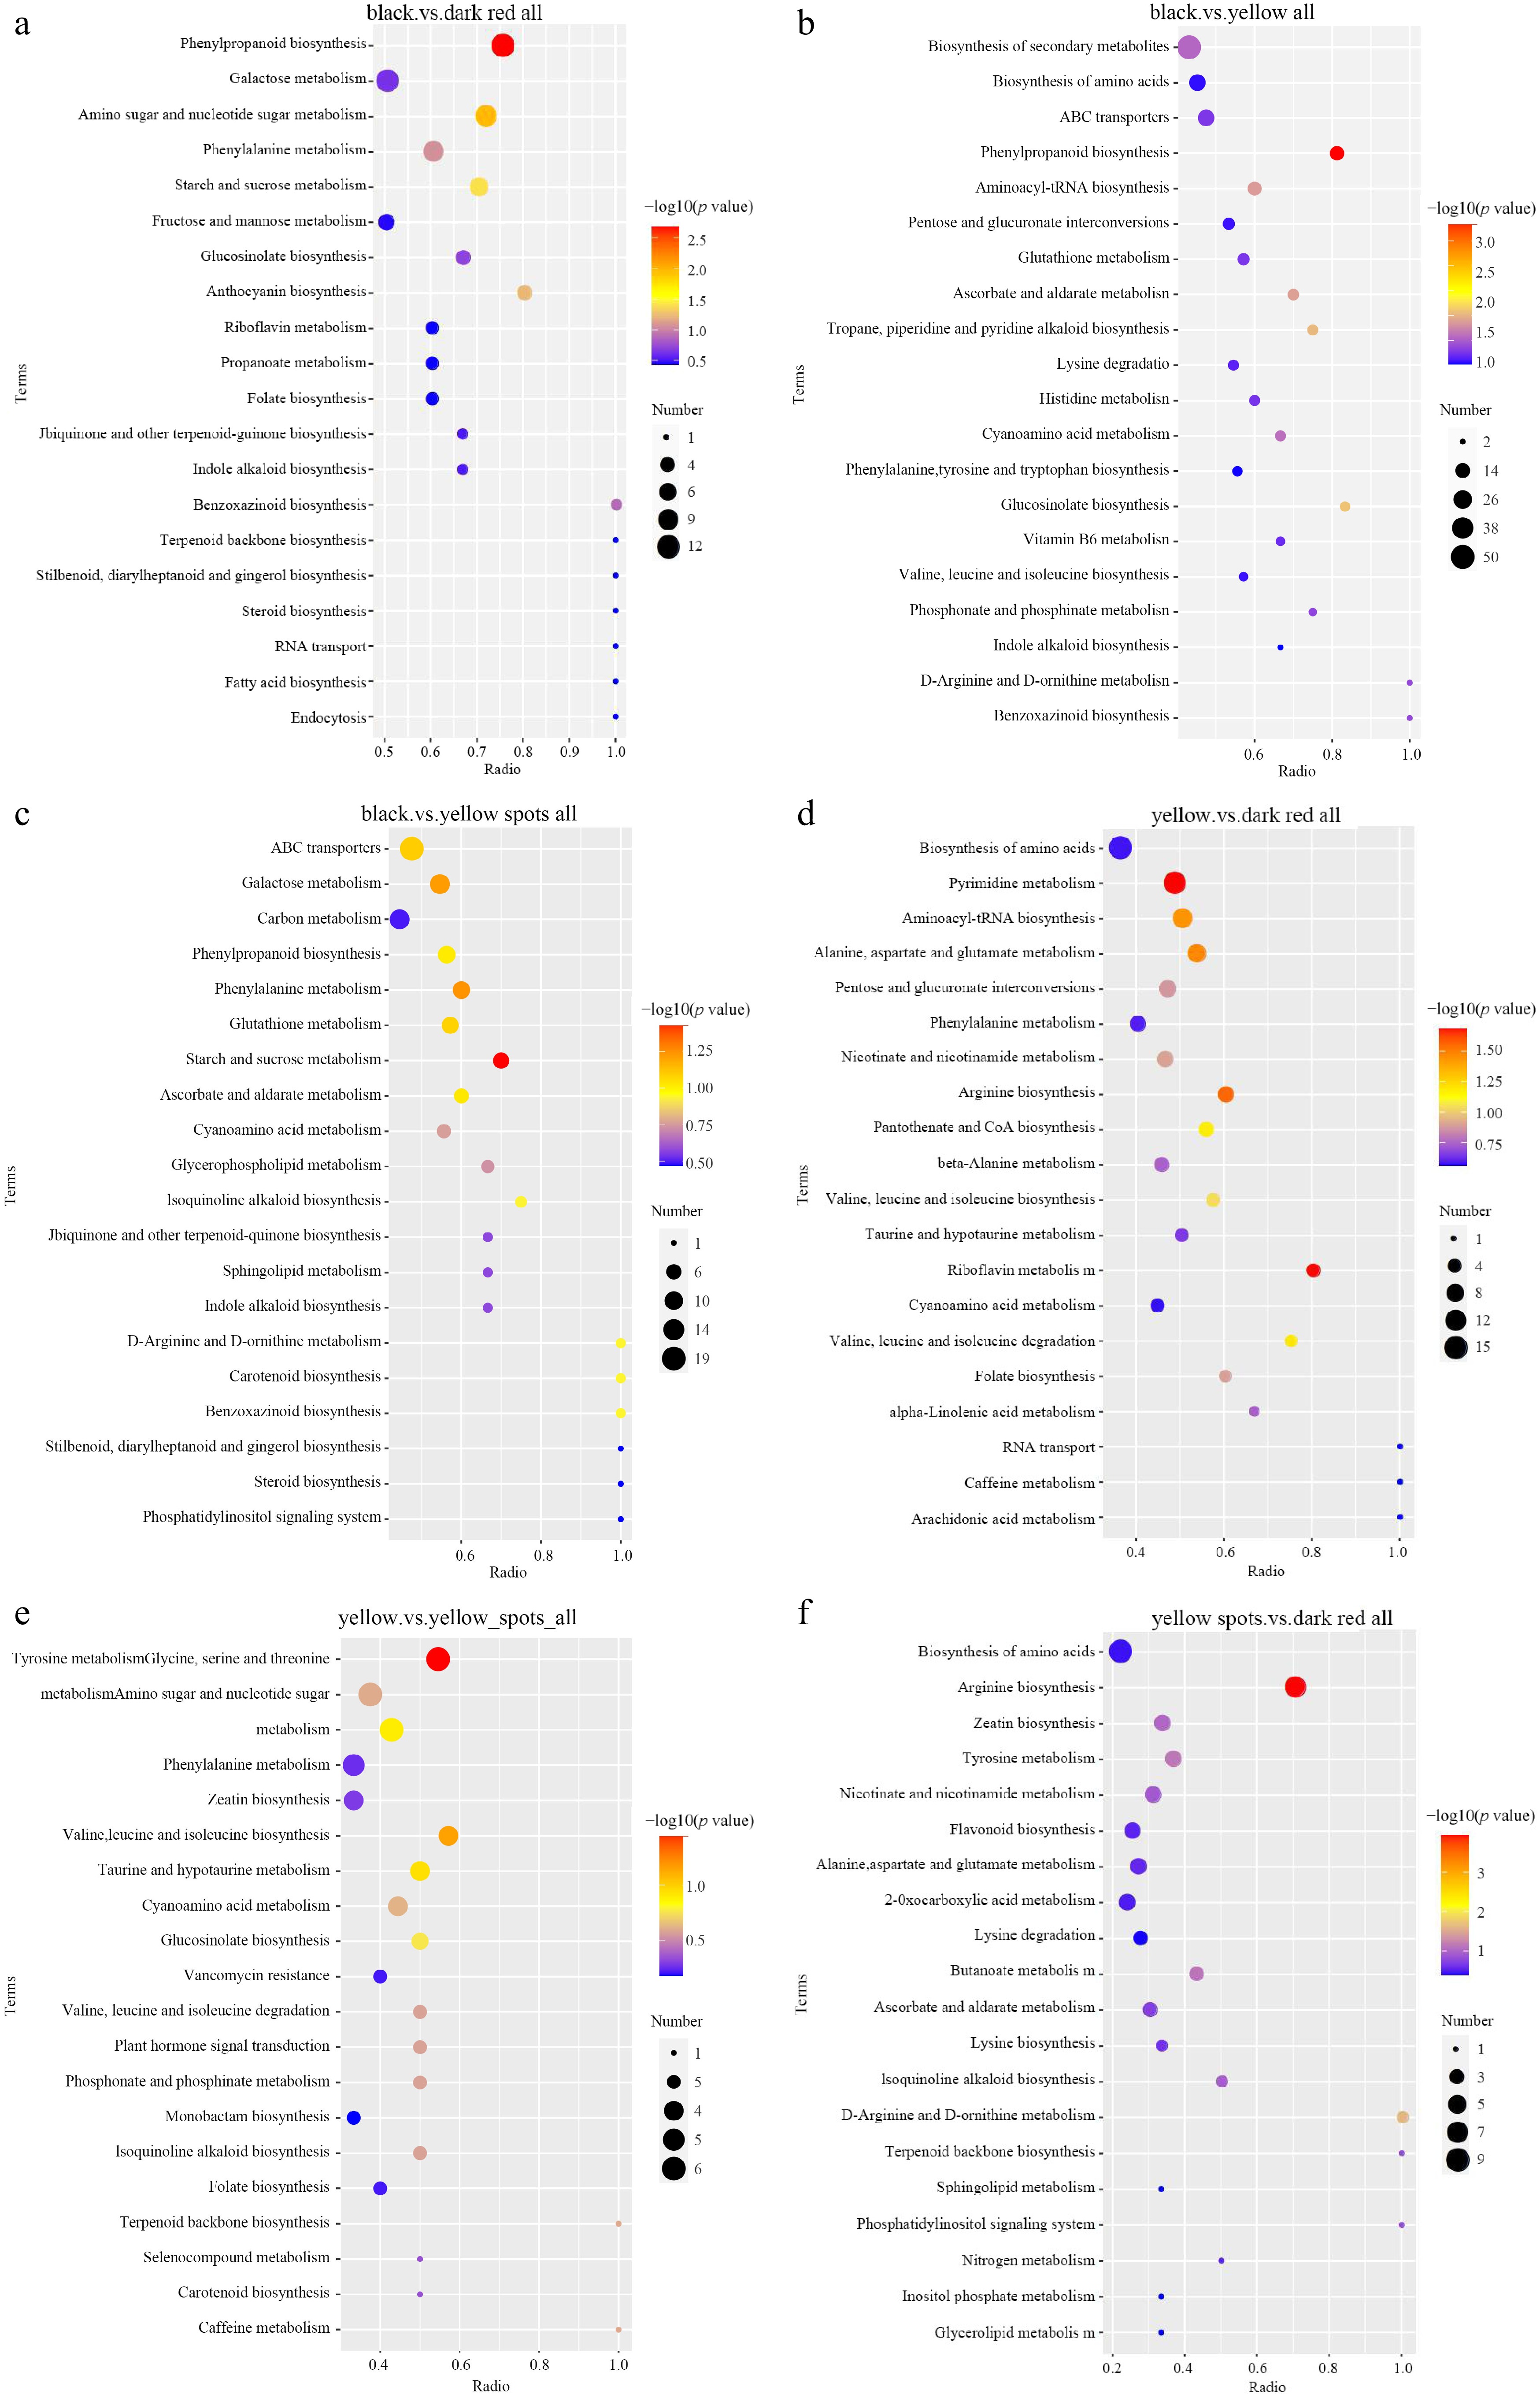
Figure 4.
KEGG enriched scatterplot of DAMs in four comparisons. (a) Black vs dark red, (b) black vs yellow, (c) black vs yellow spot, (d) yellow vs dark red, (e) yellow vs yellow spot, (f) yellow spot vs dark red.
-
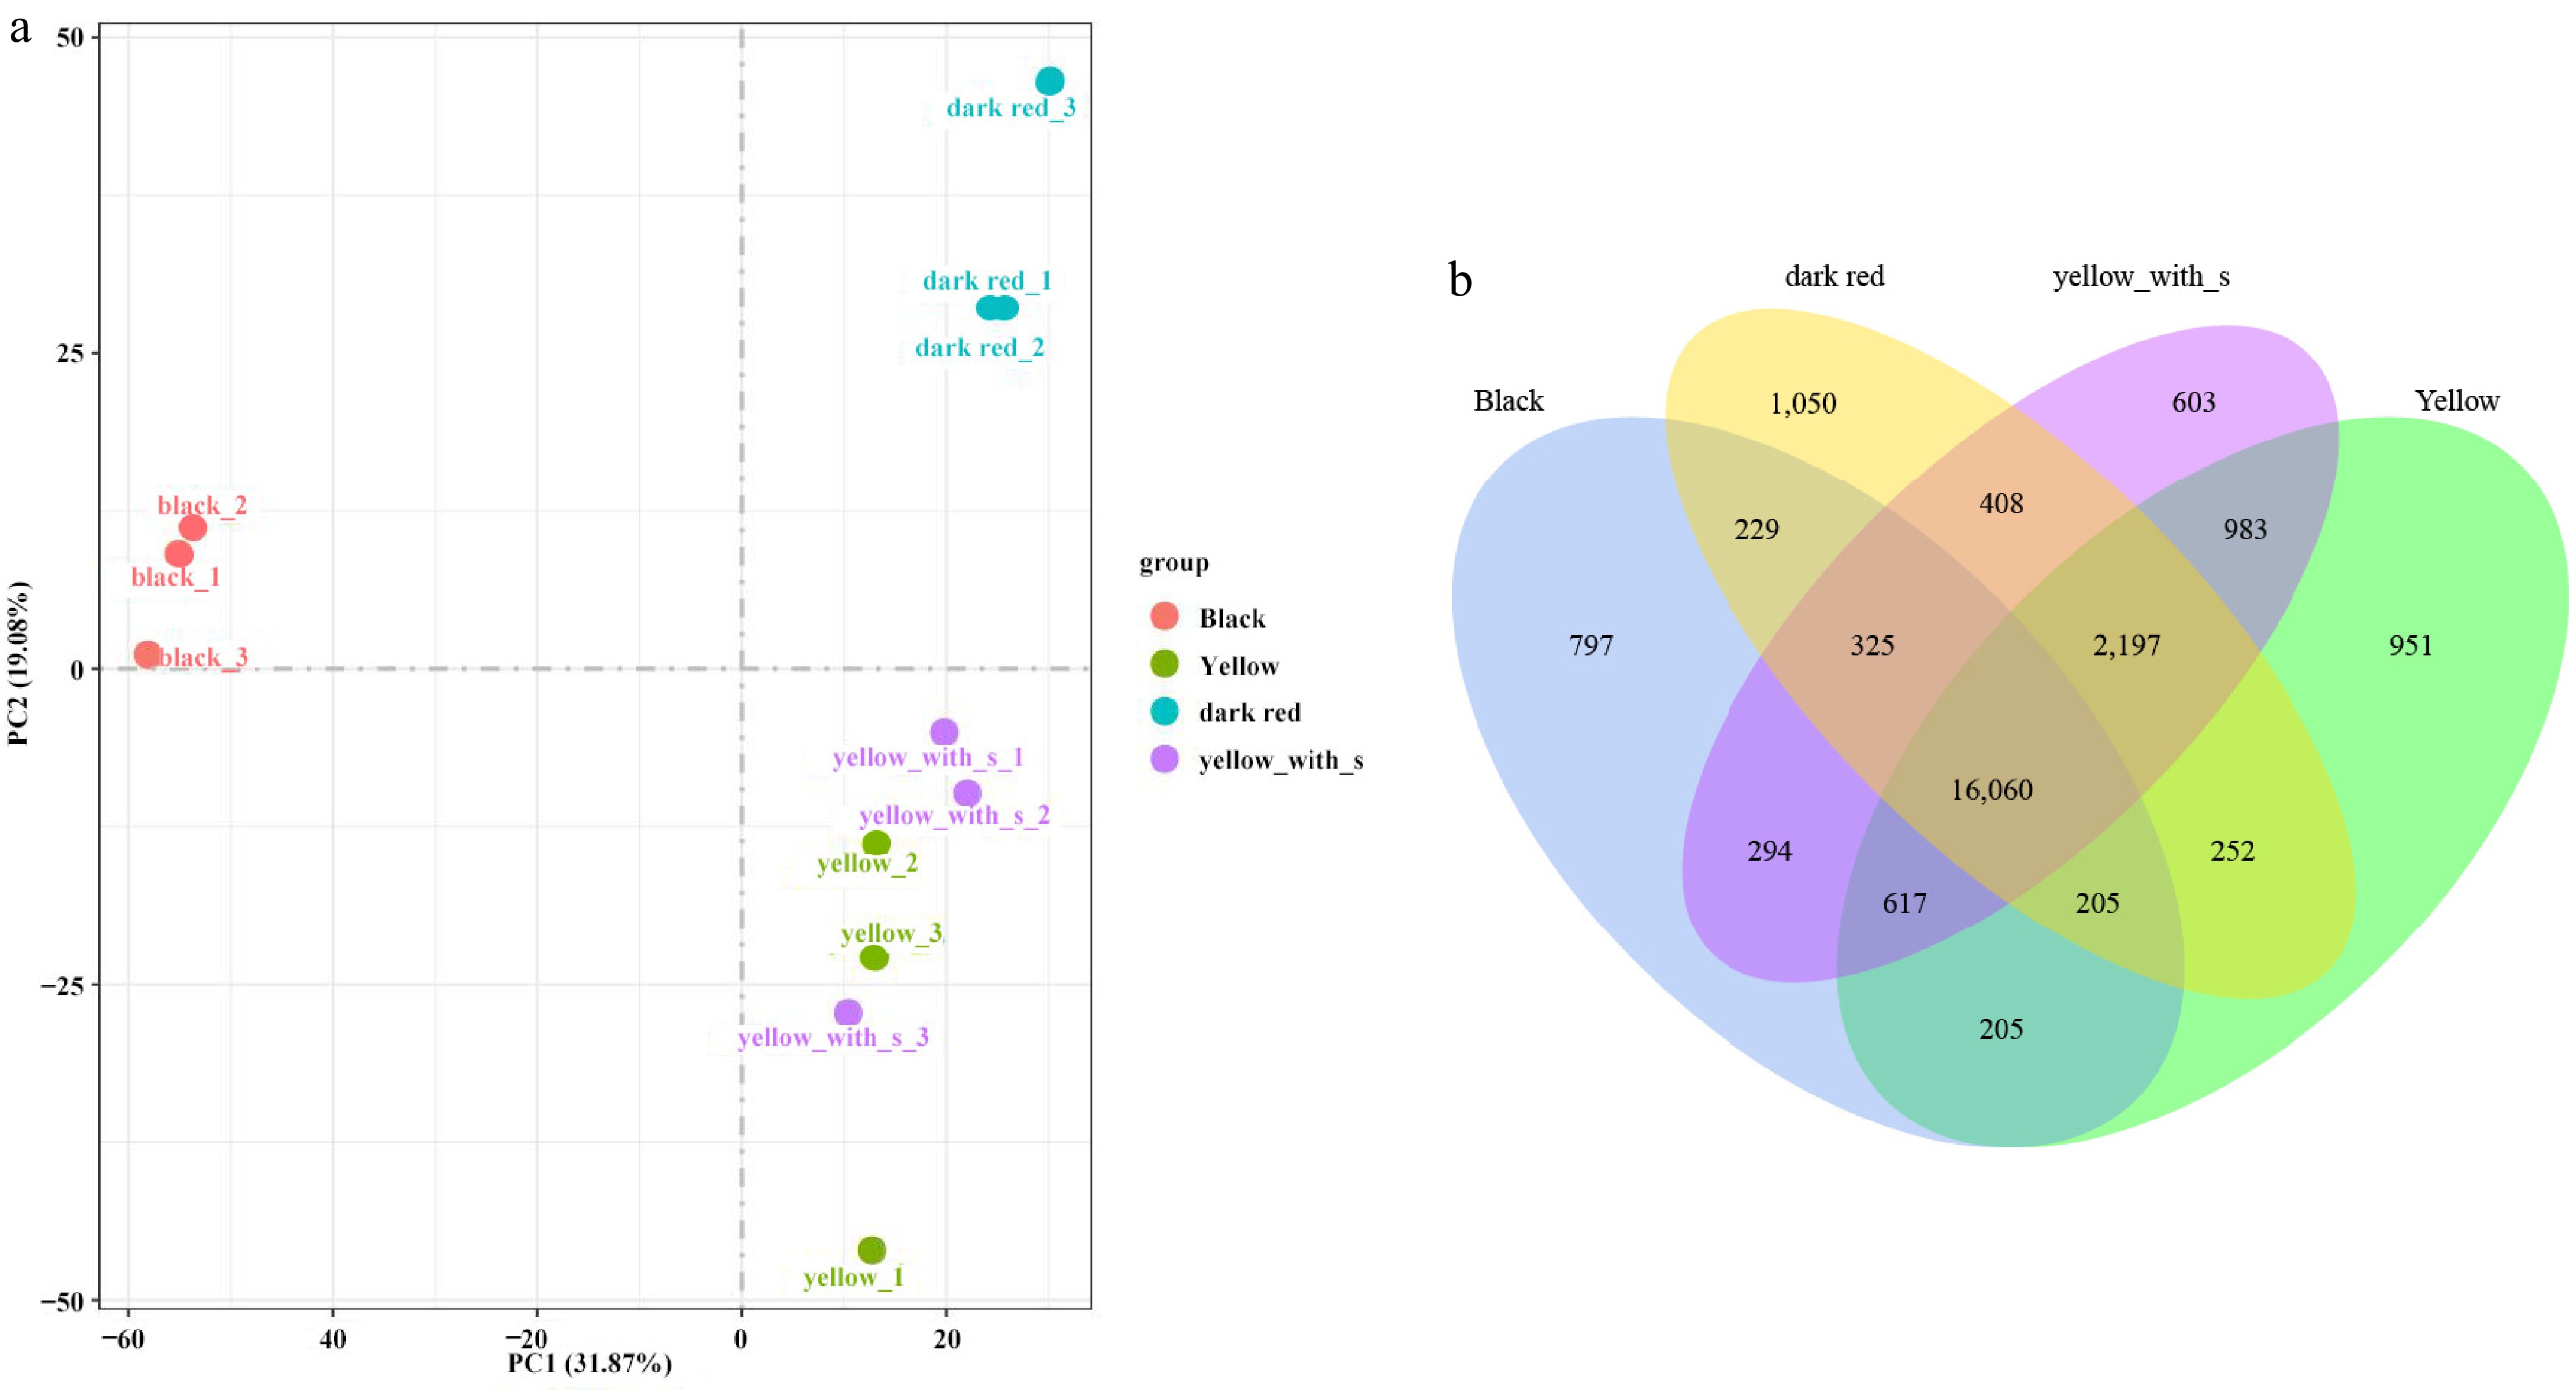
Figure 5.
PCA and Venn profiling of four fruit types in transcriptome. (a) PCA analysis of transcriptome. (b) Venn plot of DEGs.
-
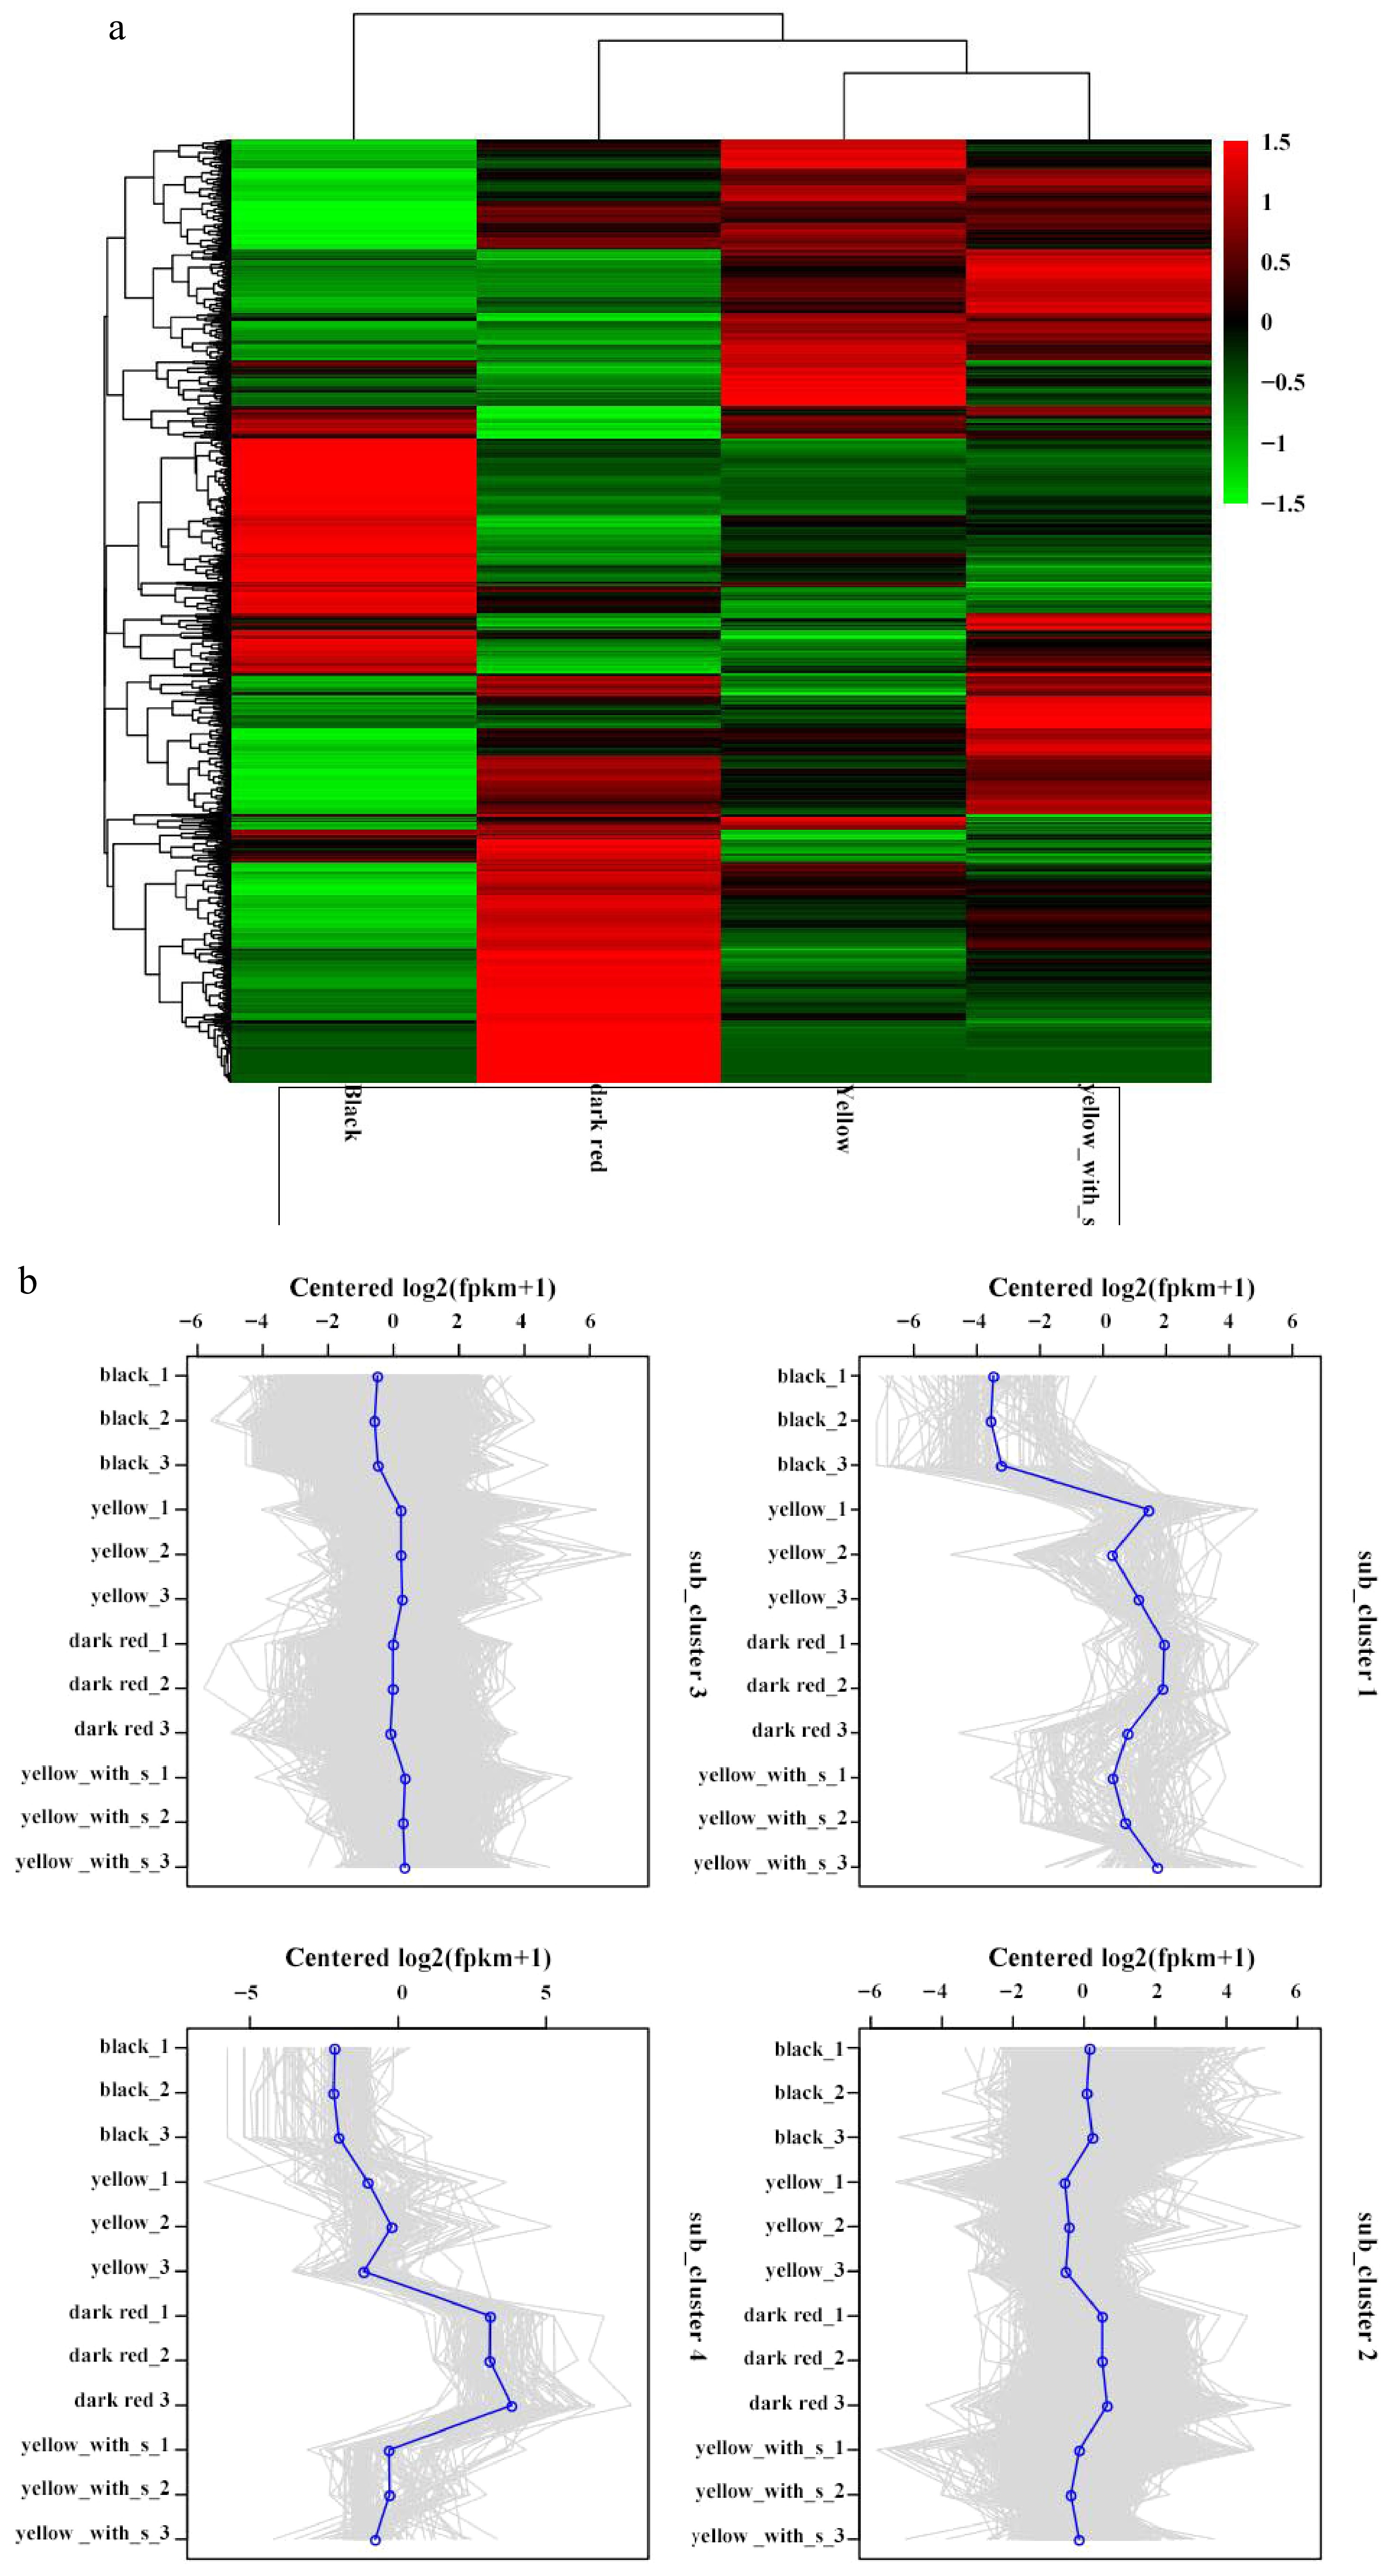
Figure 6.
Differential genes classed in heatmaps, subclusters, and expressions in four fruit types. (a) Heatmap of DEGs. (b) Subcluster plots of DEGs.
-
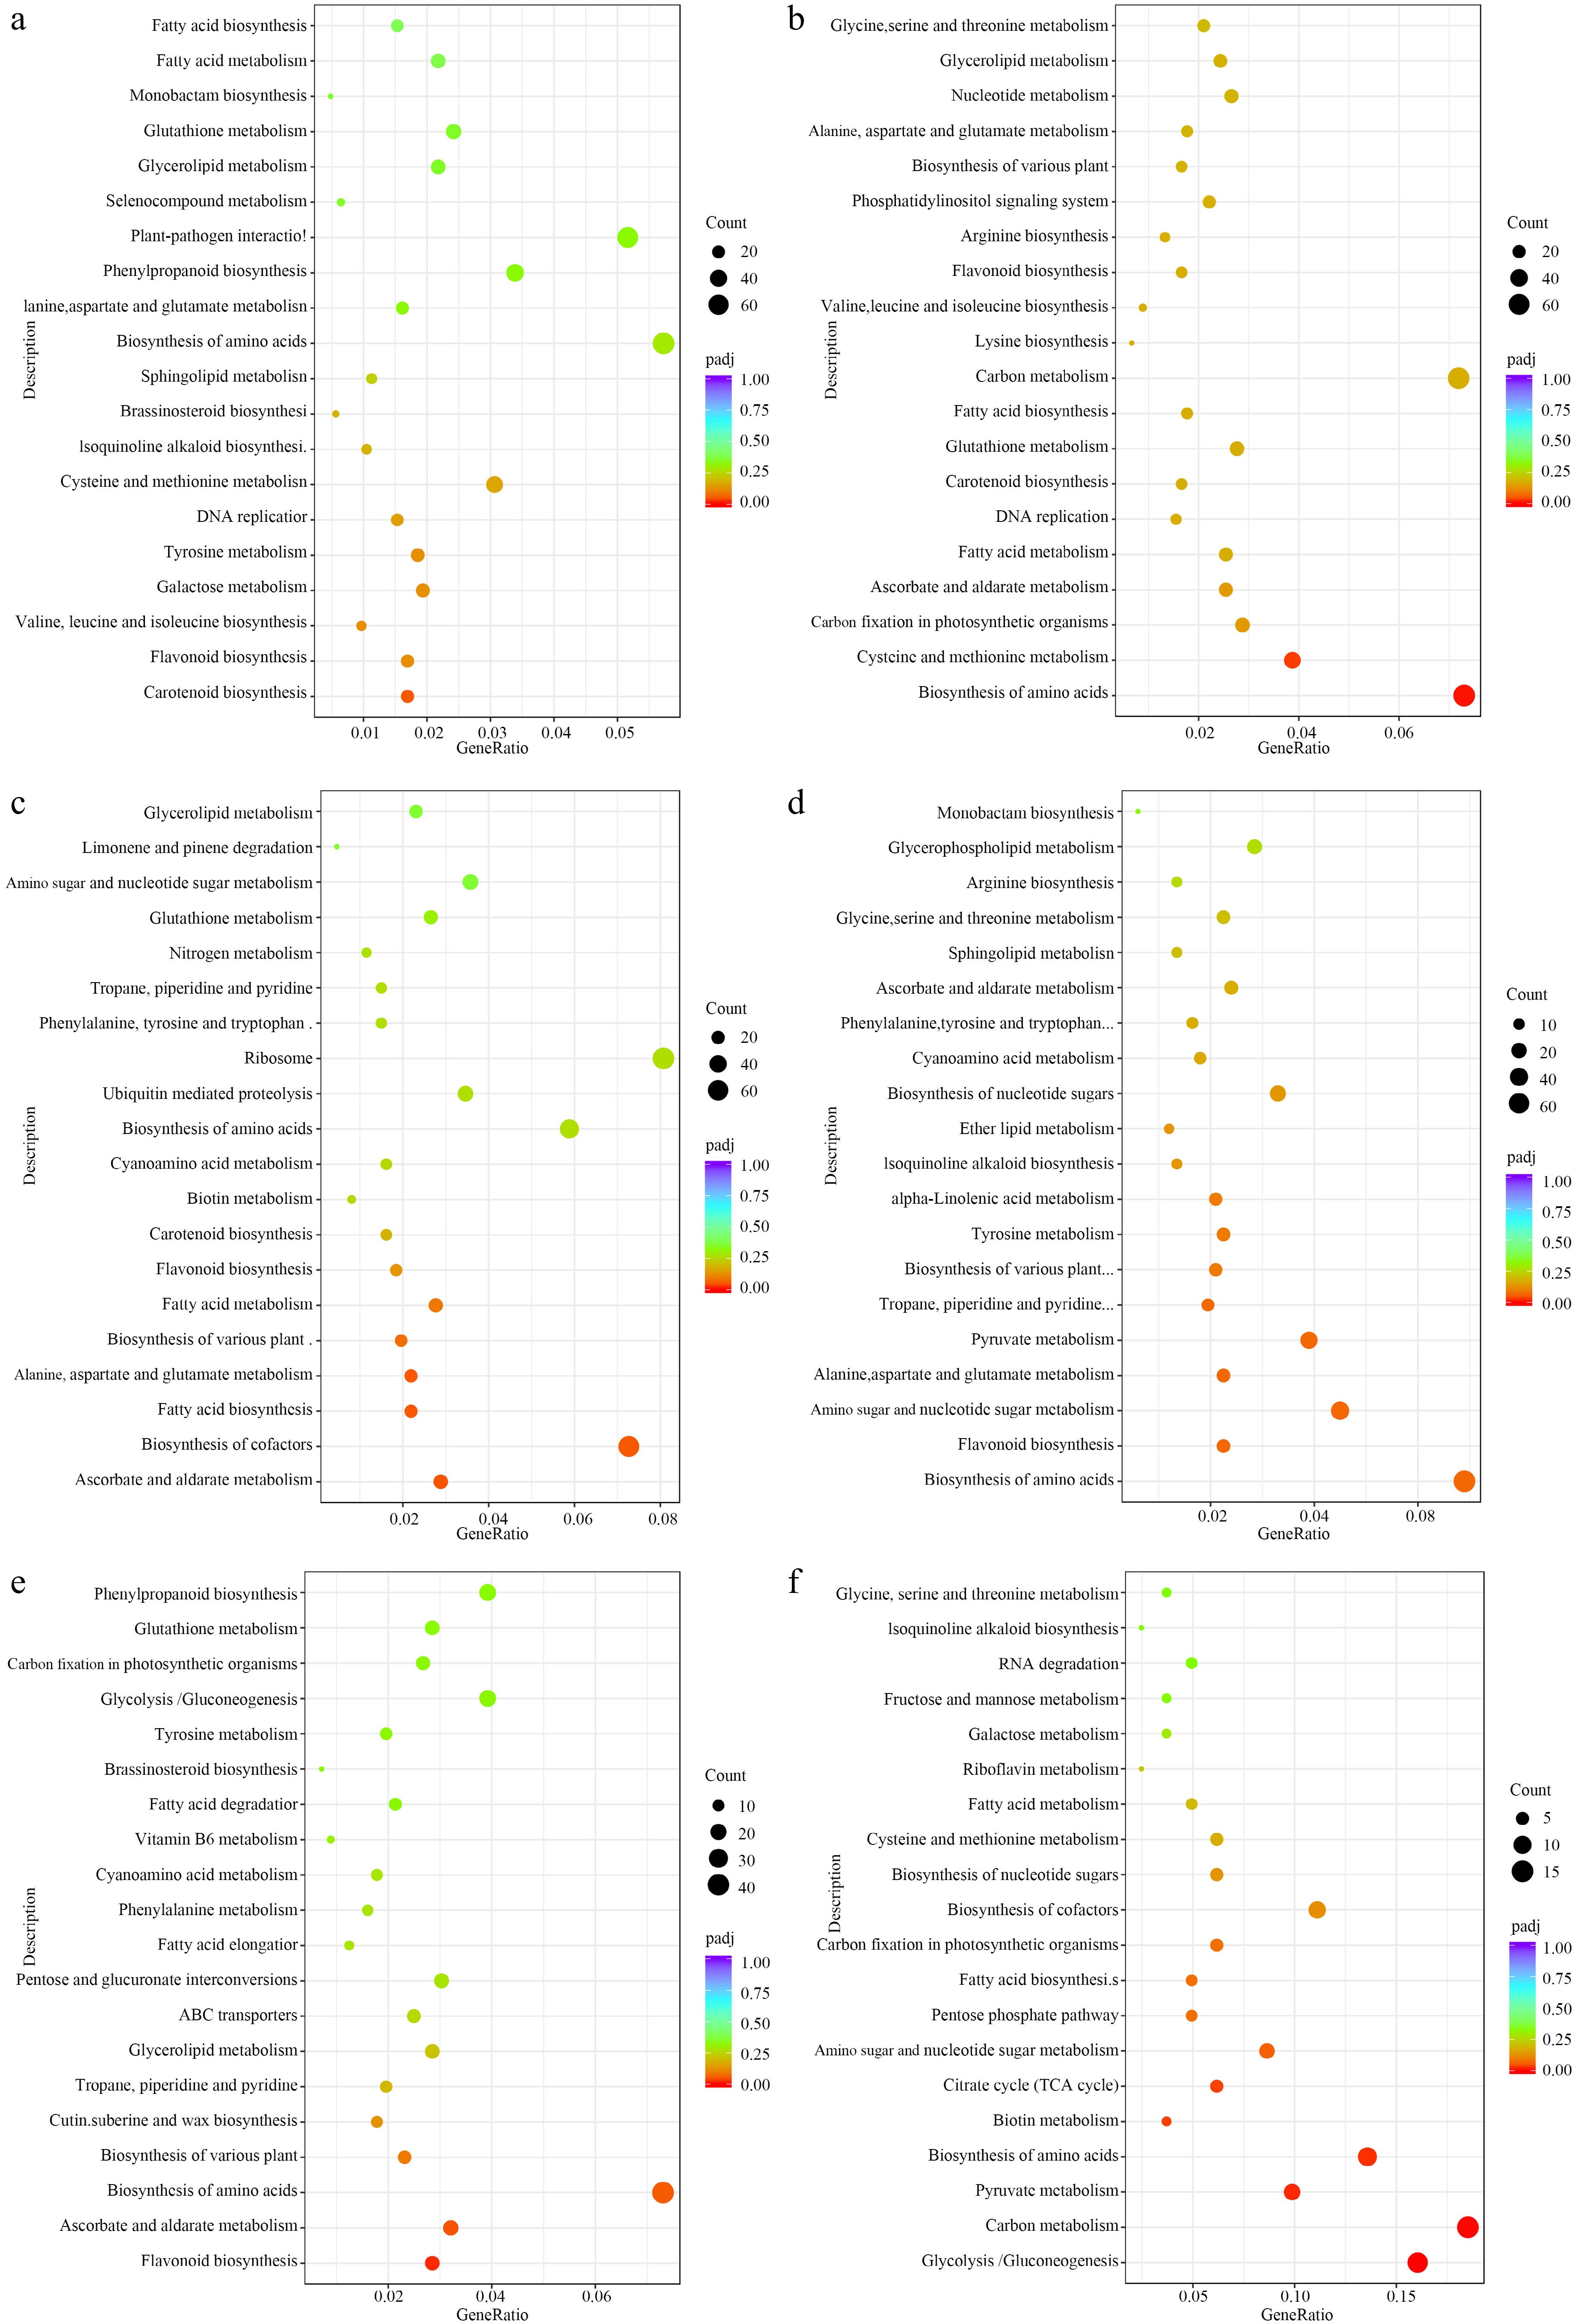
Figure 7.
KEGG enriched scatterplot of DEGs in four comparisons. (a) Black vs dark red, (b) black vs yellow, (c) black vs yellow spot, (d) dark red vs yellow, (e) dark red vs yellow spot, (f) yellow vs yellow spot.
-
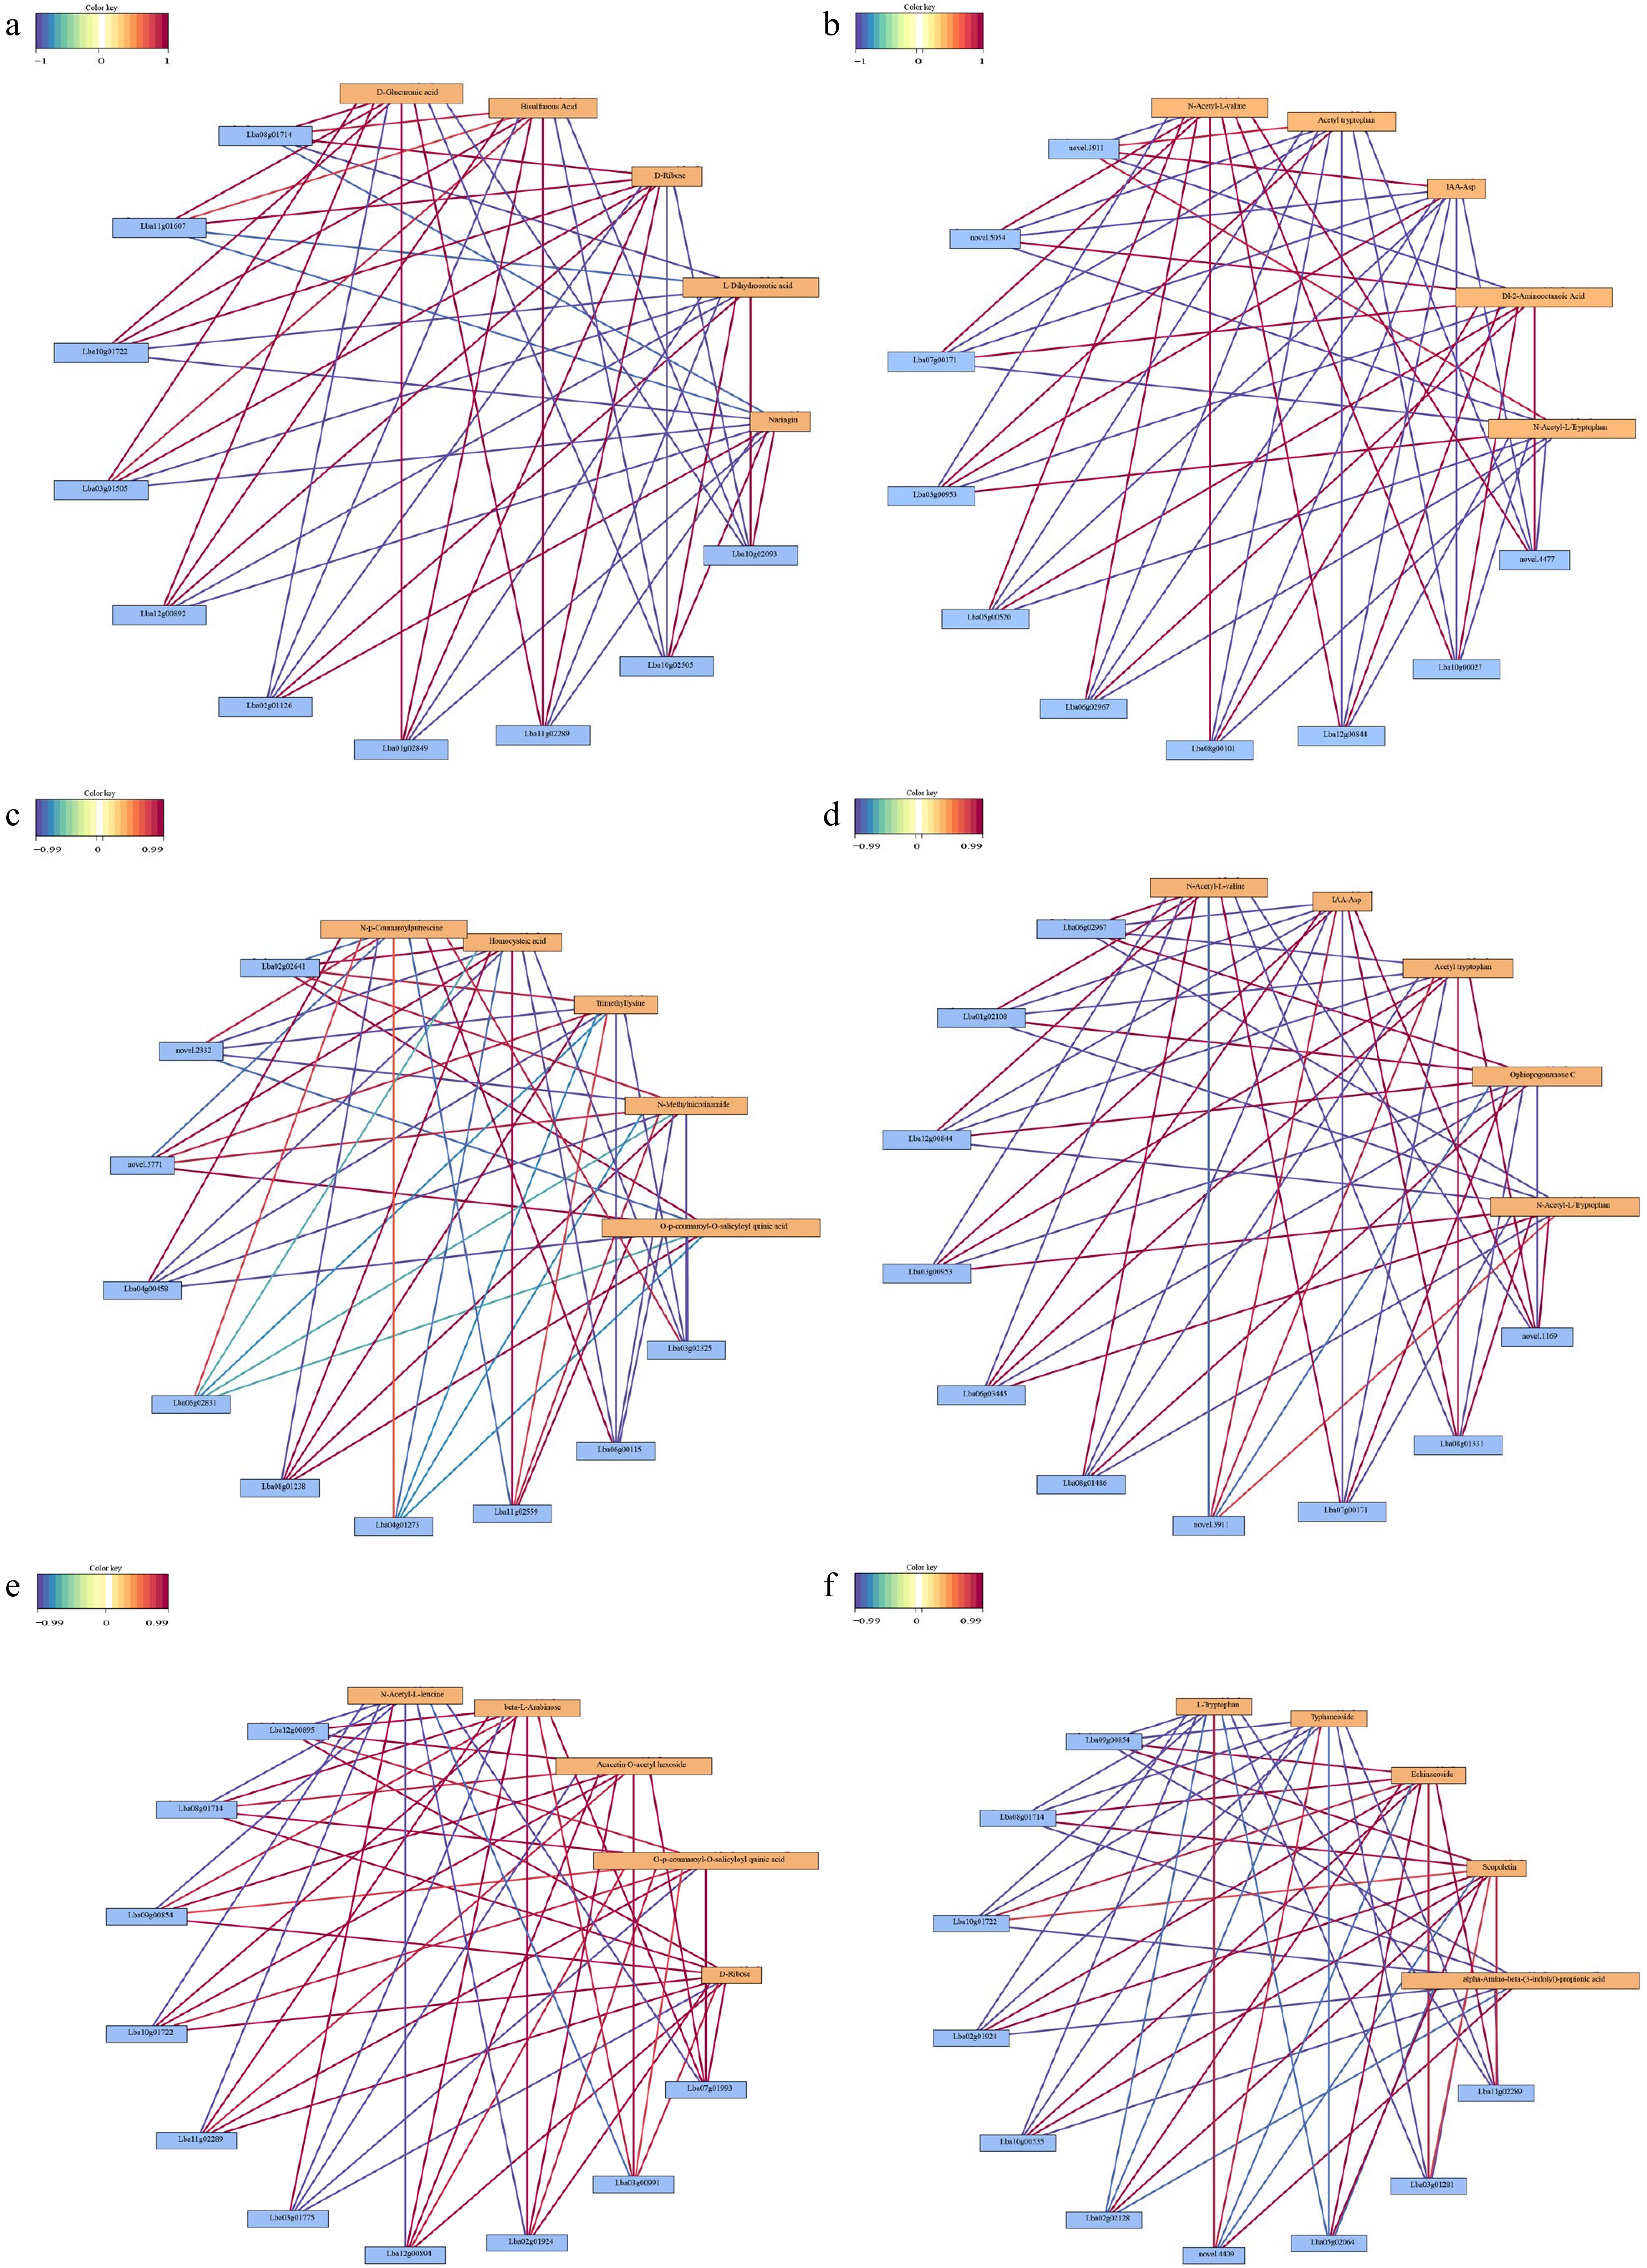
Figure 8.
Correlation network of the top metabolites and genes in four comparisons. (a) Black vs dark red, (b) yellow spots vs dark red, (c) yellow vs yellow spot, (d) yellow vs dark red, (e) black vs yellow spot, (f) black vs yellow.
-
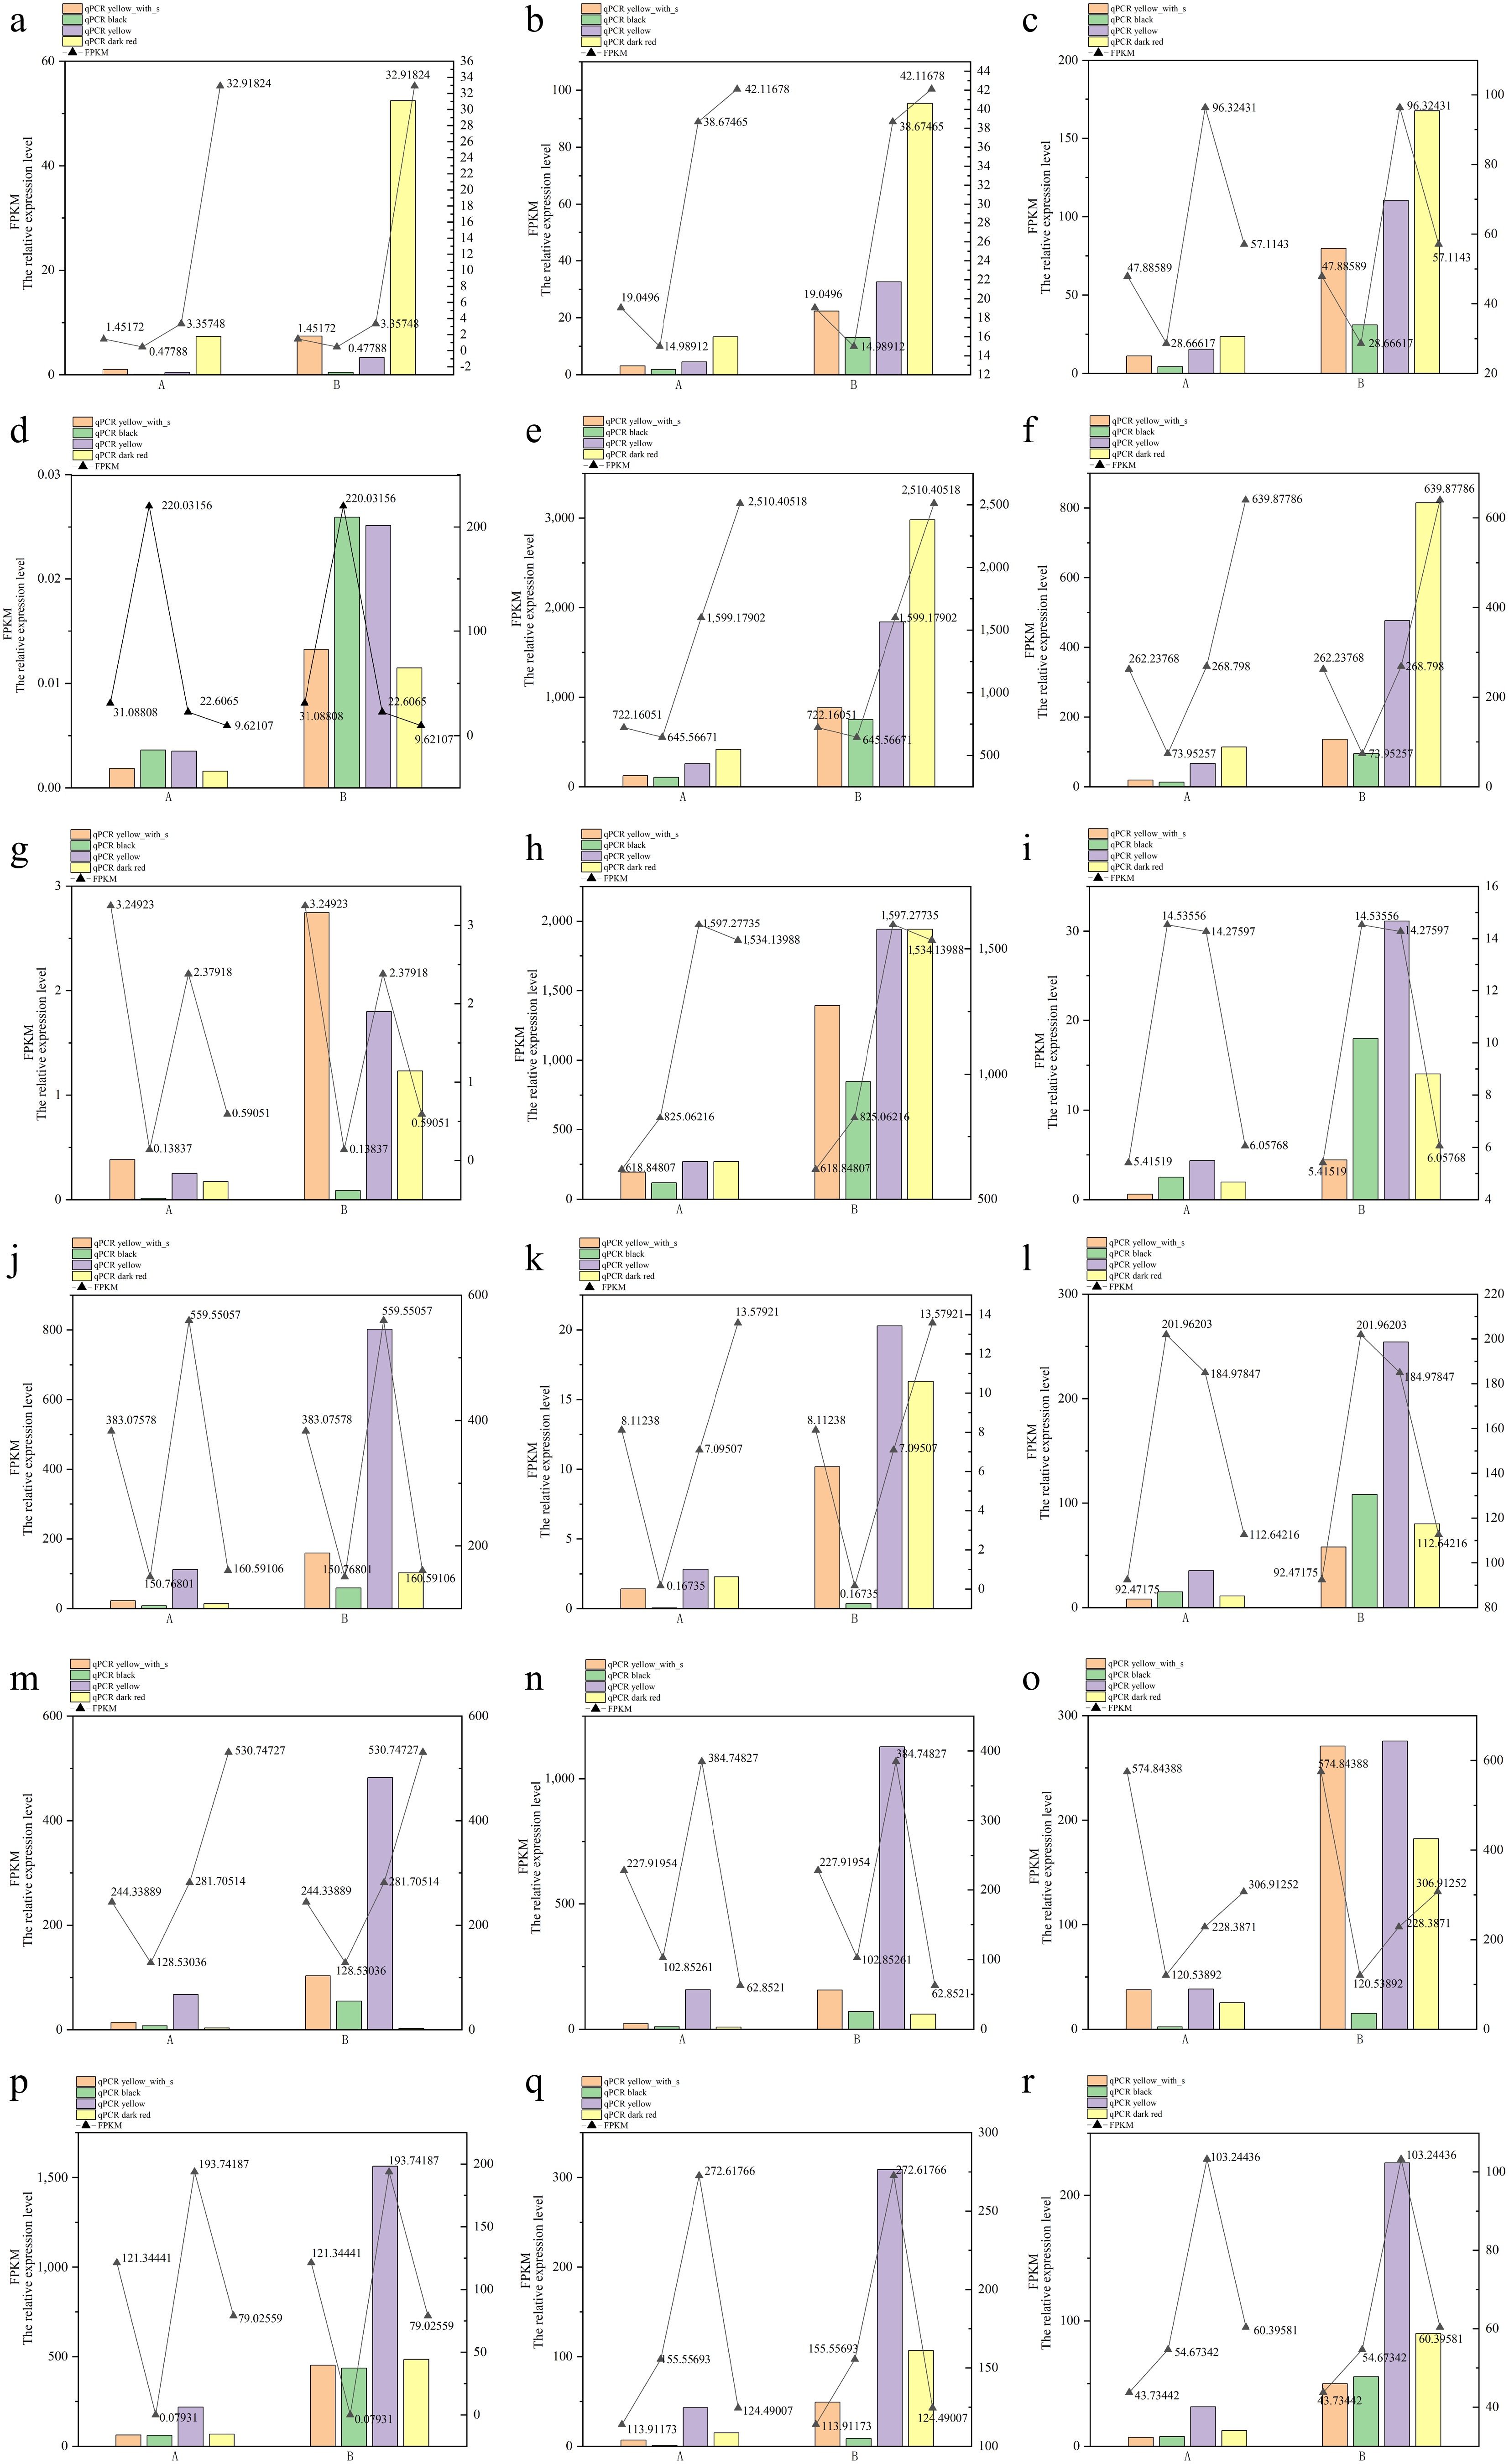
Figure 9.
RT-PCR validation of key DEGs in four fruit types. (a) Lba01g01874, (b) Lba01g02344, (c) Lba02g00136, (d) Lba02g00994, (e) Lba03g00118, (f) Lba03g01605, (g) Lba04g01211, (h) Lba05g01557, (i) Lba05g02210, (j) Lba06g01747, (k) Lba06g02033, (l) Lba07g00206, (m) Lba07g00818, (n) Lba07g02052, (o) Lba07g02085, (p) Lba08g02201, (q) Lba11g01391, (r) Lba11g01902. Note: (a)–(r) are the relative expression of 18 genes, A indicates LbaCML38 as the reference gene, B indicates the GAPDH as the reference gene.
-
Compared samples No. of total identified No. of total significantly different No. of significantly up No. of significantly down Black vs yellow 993 331 171 160 Black vs dark red 993 357 187 170 Black vs yellow_spots 993 313 164 149 Yellow_spots vs dark red 993 143 59 84 Yellow vs yellow_spots 993 205 97 108 Table 1.
Detected DAMs in different comparisons.
-
Comparison/DAM Black vs
dark redBlack vs
yellowBlack vs
yellow_spotYellow vs
dark redYellow vs
yellow_spotYellow_spot vs
dark redAmino acid and derivatives 55 75 55 60 46 33 Flavonoids 52 51 36 18 21 20 Carbohydrates and its derivatives 48 38 50 26 20 11 Organic acid and its derivatives 37 29 37 25 21 14 Phenolic acids 30 23 25 14 11 7 Organoheterocyclic compounds 22 24 20 13 18 8 Lipids 19 20 18 20 12 8 Nucleotide and its derivates 18 9 9 23 15 11 Phenylpropanoids and polyketides 13 13 7 12 6 1 Phenols and its derivatives 11 10 12 5 12 11 Vitamins 11 6 9 9 3 4 Alkaloids and derivatives 9 8 9 3 0 1 Phytohormones 8 6 5 8 3 3 Amines 6 6 8 4 10 3 Terpenoids 6 2 3 5 6 5 Alcohols and polyols 5 5 6 3 0 2 Polyamine 3 3 1 2 0 1 Benzene and substituted derivatives 2 1 2 2 1 0 Organooxygen compounds 2 2 1 0 0 0 Total 357 331 313 252 205 143 Table 2.
Differential metabolites in six comparisons.
-
KEGG term No. meta Black vs red Biosynthesis of secondary metabolites 43 Phenylpropanoid biosynthesis 12 Galactose metabolism 11 Amino sugar and nucleotide sugar metabolism 10 Arginine and proline metabolism 10 Black vs yellow Biosynthesis of secondary metabolites 50 ABC transporters 19 Biosynthesis of amino acids 19 Phenylpropanoid biosynthesis 13 Aminoacyl-tRNA biosynthesis 12 Black vs yellow spot Metabolic pathways 80 Biosynthesis of secondary metabolites 42 ABC transporters 19 Biosynthesis of amino acids 16 Galactose metabolism 12 Yellow vs dark red Biosynthesis of amino acids 15 Pyrimidine metabolism 13 ABC transporters 12 Aminoacyl-tRNA biosynthesis 10 Alanine, aspartate and glutamate metabolism 8 Yellow vs yellow_spot Metabolic pathways 58 Pyrimidine metabolism 7 Carbon metabolism 7 Tyrosine metabolism 6 Amino sugar and nucleotide sugar metabolism 6 Yellow_spot vs dark red Biosynthesis of amino acids 9 Arginine biosynthesis 7 ABC transporters 7 Tyrosine metabolism 4 Zeatin biosynthesis 4 No. meta means Number of Metabolites. Table 3.
Top enriched KEGG term and metabolites number in six comparisons.
-
Compare All Up Down Black vs yellow 4,955 1,551 3,404 Black vs dark red 7,259 2,524 4,735 Black vs yellow_spot 5,382 1,334 4,048 Yellow vs dark red 3,642 1,740 1,902 Yellow vs yellow_spot 321 163 158 Dark red vs yellow_spot 3,453 1,507 1,946 Table 4.
The number of detected DEGs in six comparisons.
Figures
(9)
Tables
(4)