-

Figure 1.
(a) Appearance of curcumin emulsions stabilized by LSPI at different temperatures. (b) Loading efficiency and particle size of curcumin emulsions stabilized by heat-treated LSPI at various temperatures, including the control, LSPI-70, LSPI-90, LSPI-120, and LSPI-140 emulsions. (c) EAI, ESI, and (d) interfacial load content of the control, LSPI-70, LSPI-90, LSPI-120, and LSPI-140 emulsions. "Native" indicates the control emulsion. Samples labeled with different lowercase letters (a–d; A–C) indicate significant differences (p < 0.05) among different treatments.
-
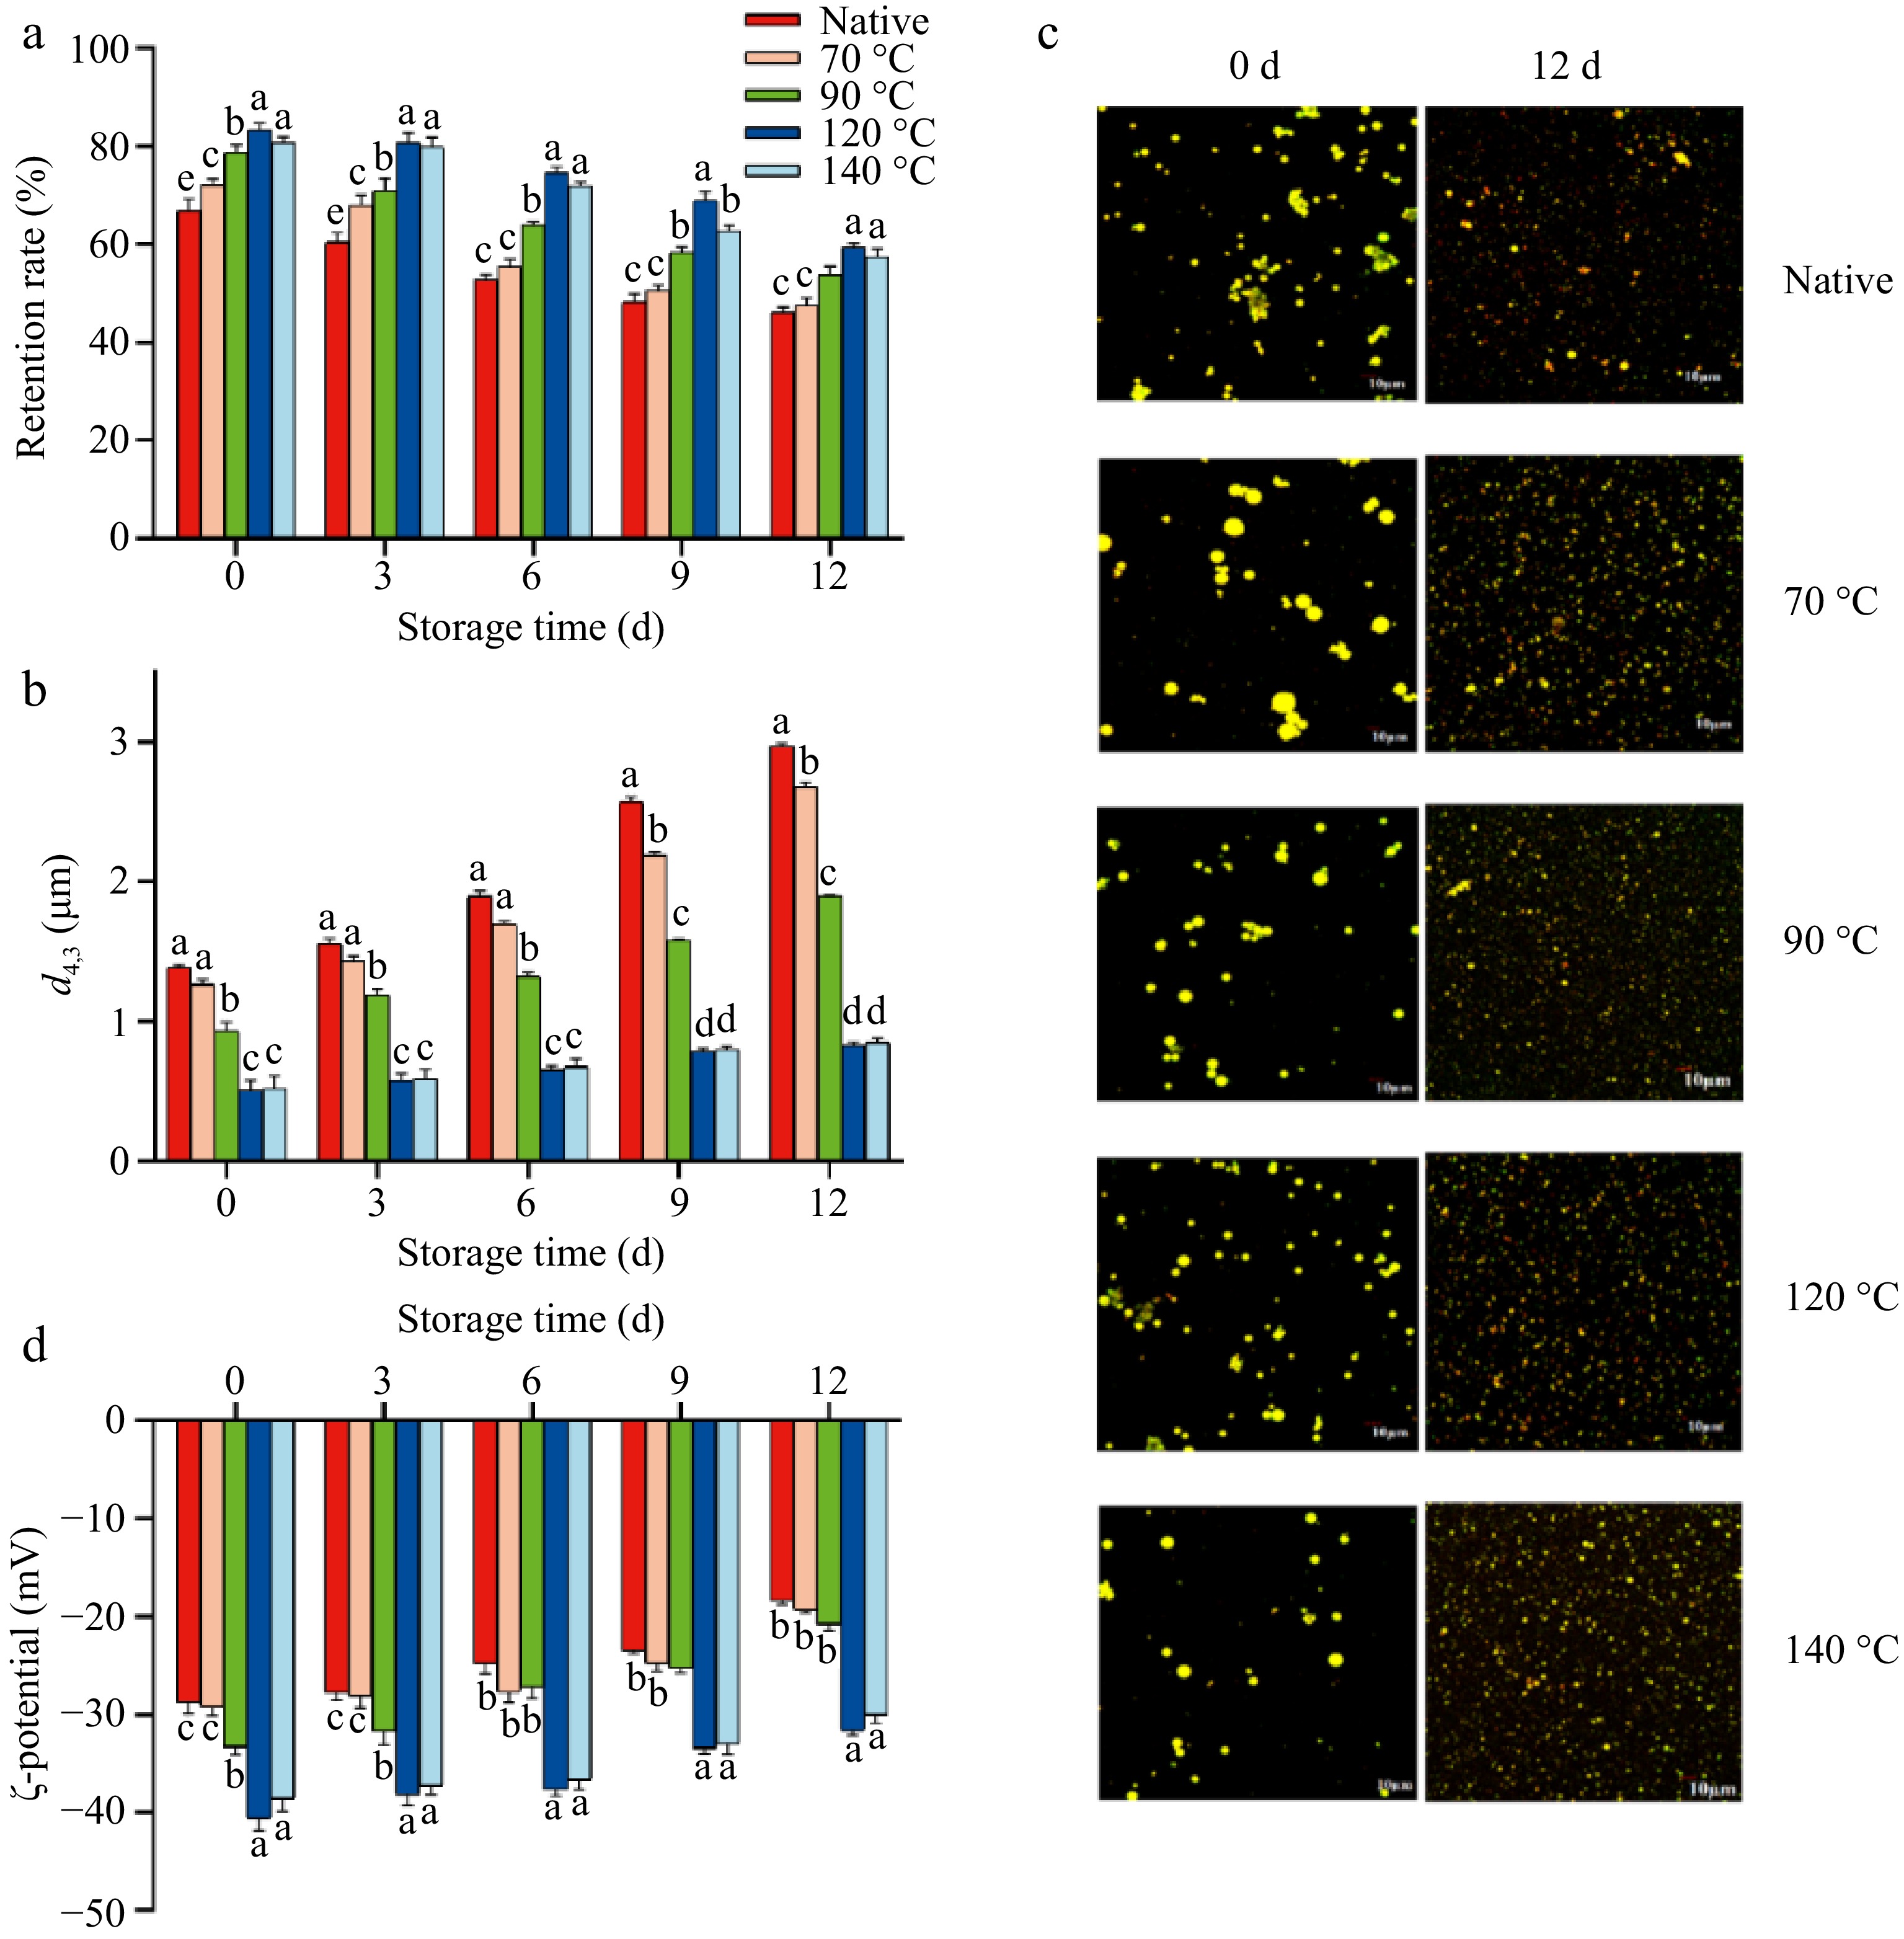
Figure 2.
(a) Retention rate of curcumin during storage. Changes in (b) particle size, (c) microstructure, and (d) ζ-potential of the control, LSPI-70, LSPI-90, LSPI-120, and LSPI-140 emulsions. "Native" indicates the control emulsion. Samples labeled with different lowercase letters (a–d) indicate significant differences (p < 0.05) among different treatments.
-
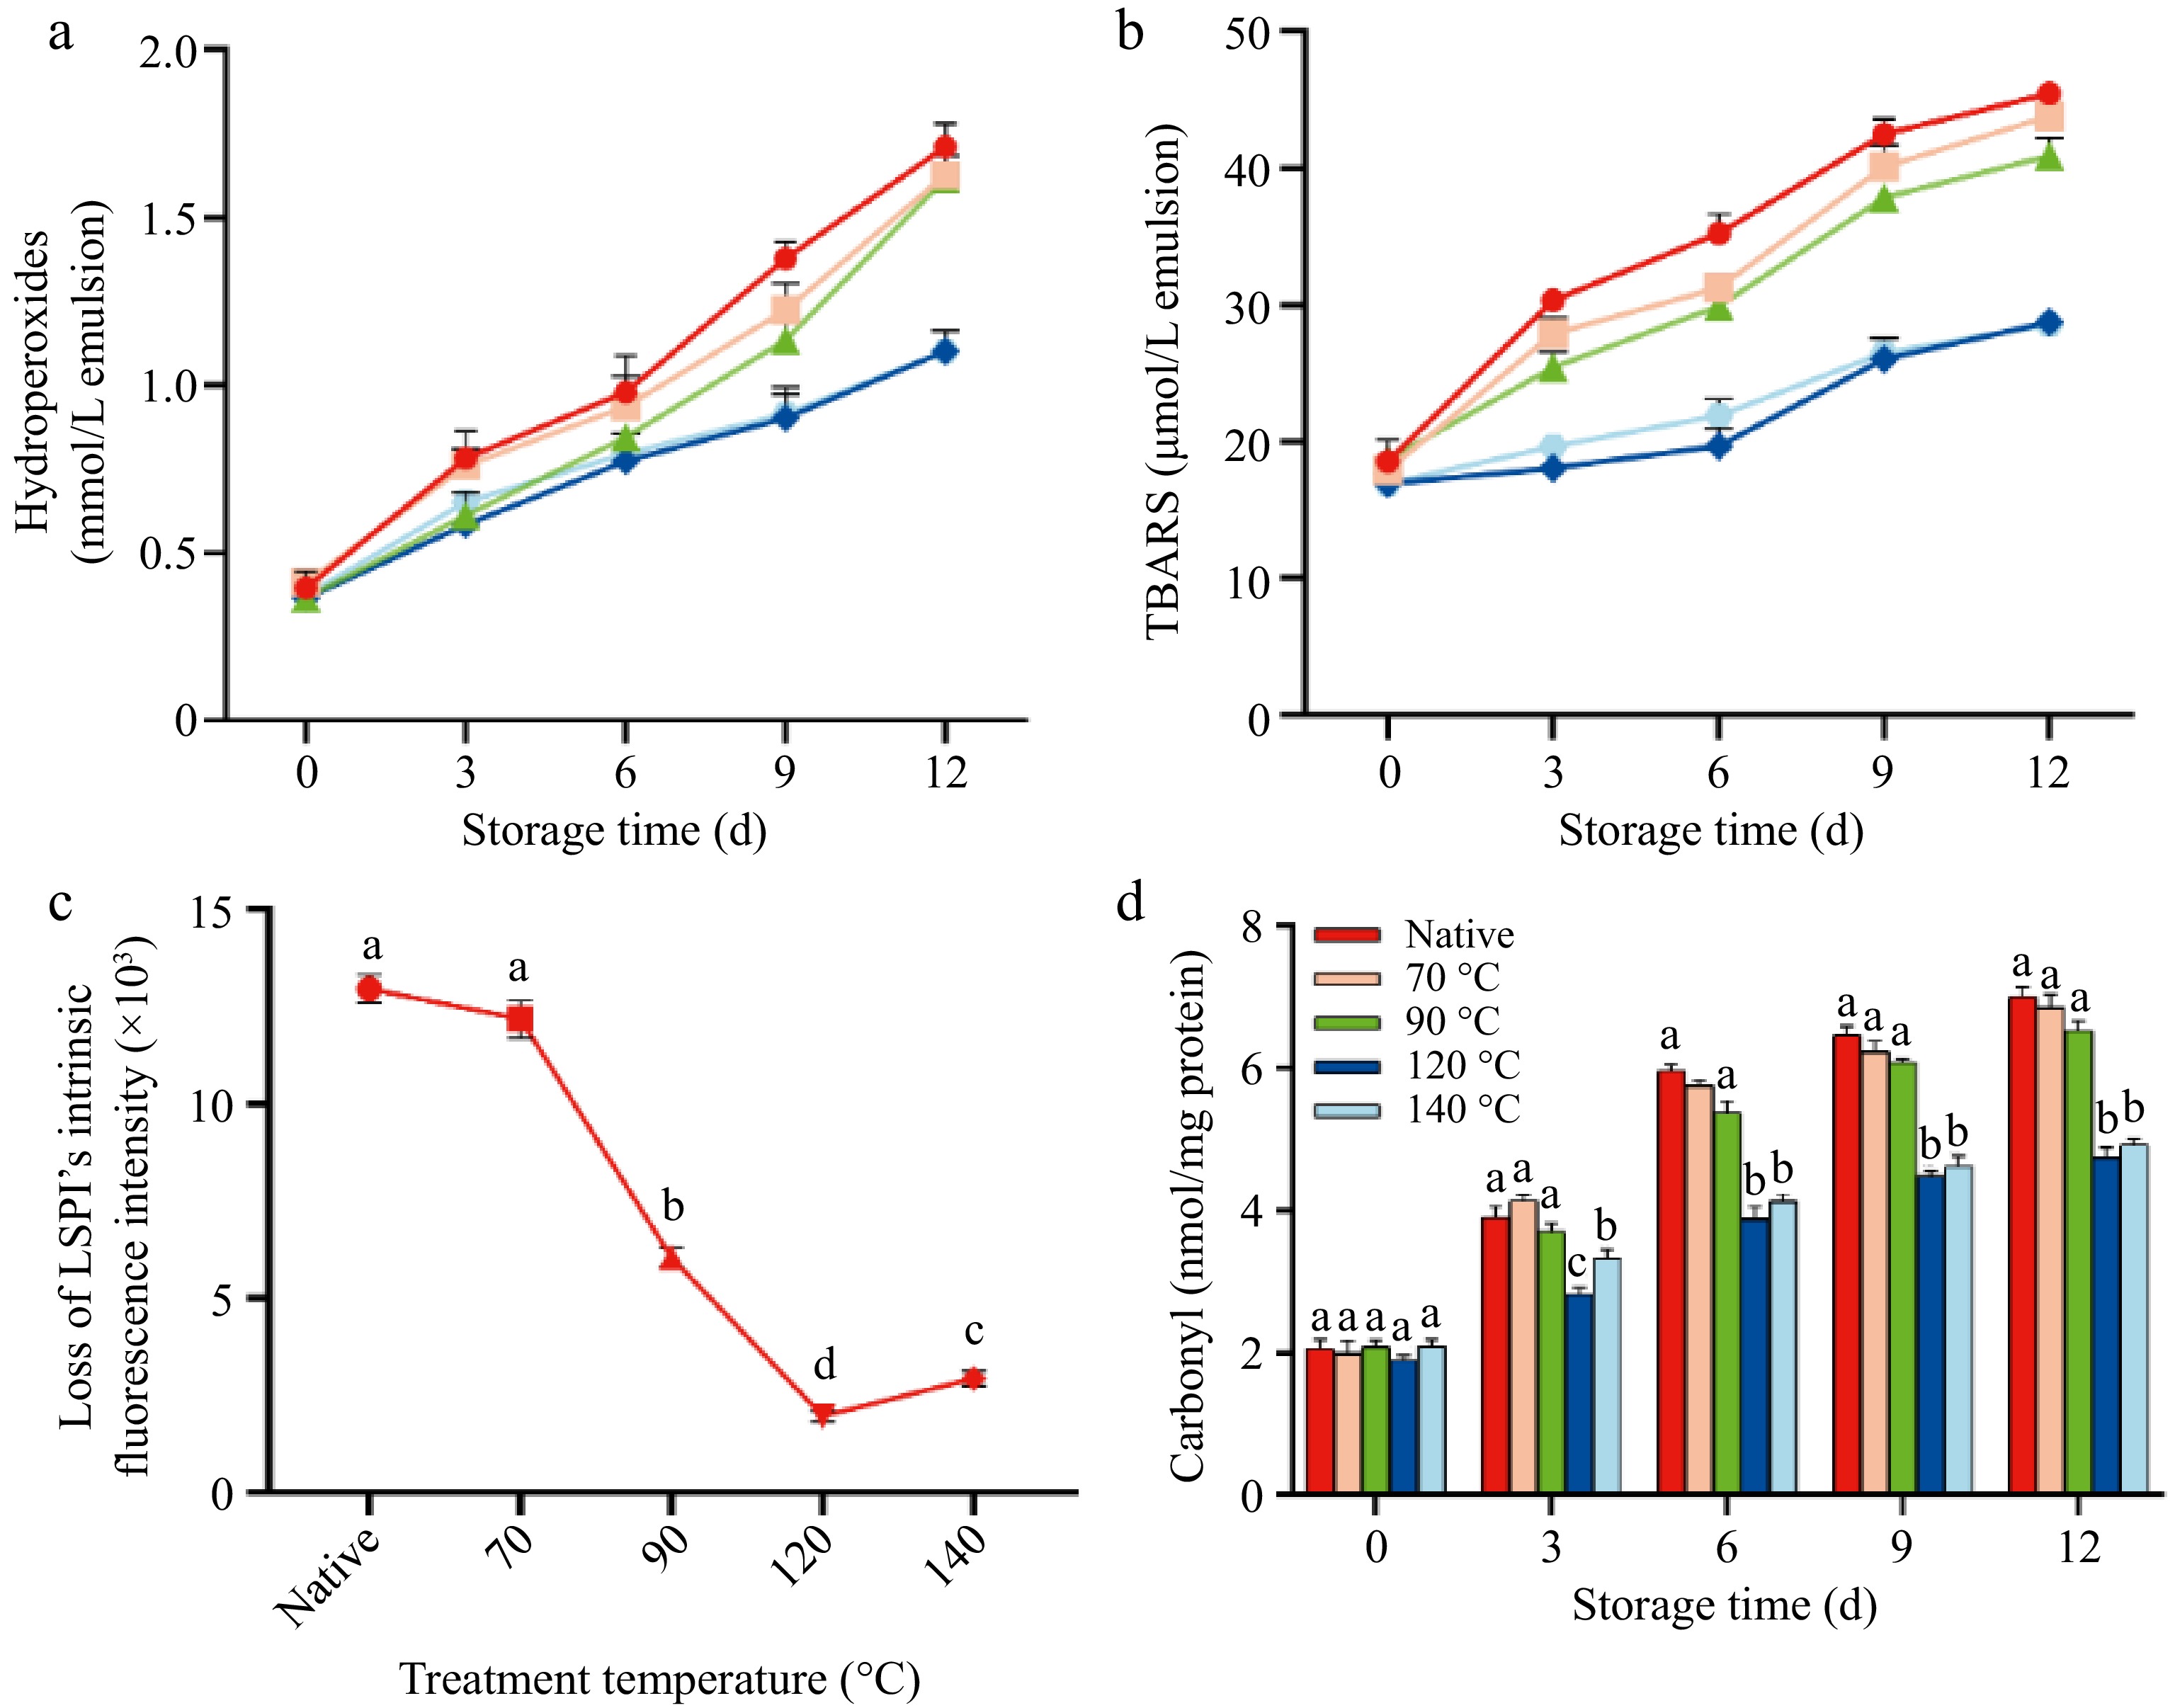
Figure 3.
Lipid–protein co-oxidation of the control, LSPI-70, LSPI-90, LSPI-120, and LSPI-140 emulsions during storage. (a) Hydroperoxide content, (b) TBARS content, (c) the intrinsic fluorescence loss, and (d) carbonyl formation of the control, LSPI-70, LSPI-90, LSPI-120, and LSPI-140 emulsions over a 12-d storage period. "Native" indicates the control emulsion. Samples labeled with different lowercase letters (a–d) indicate significant differences (p < 0.05) among different treatments.
-
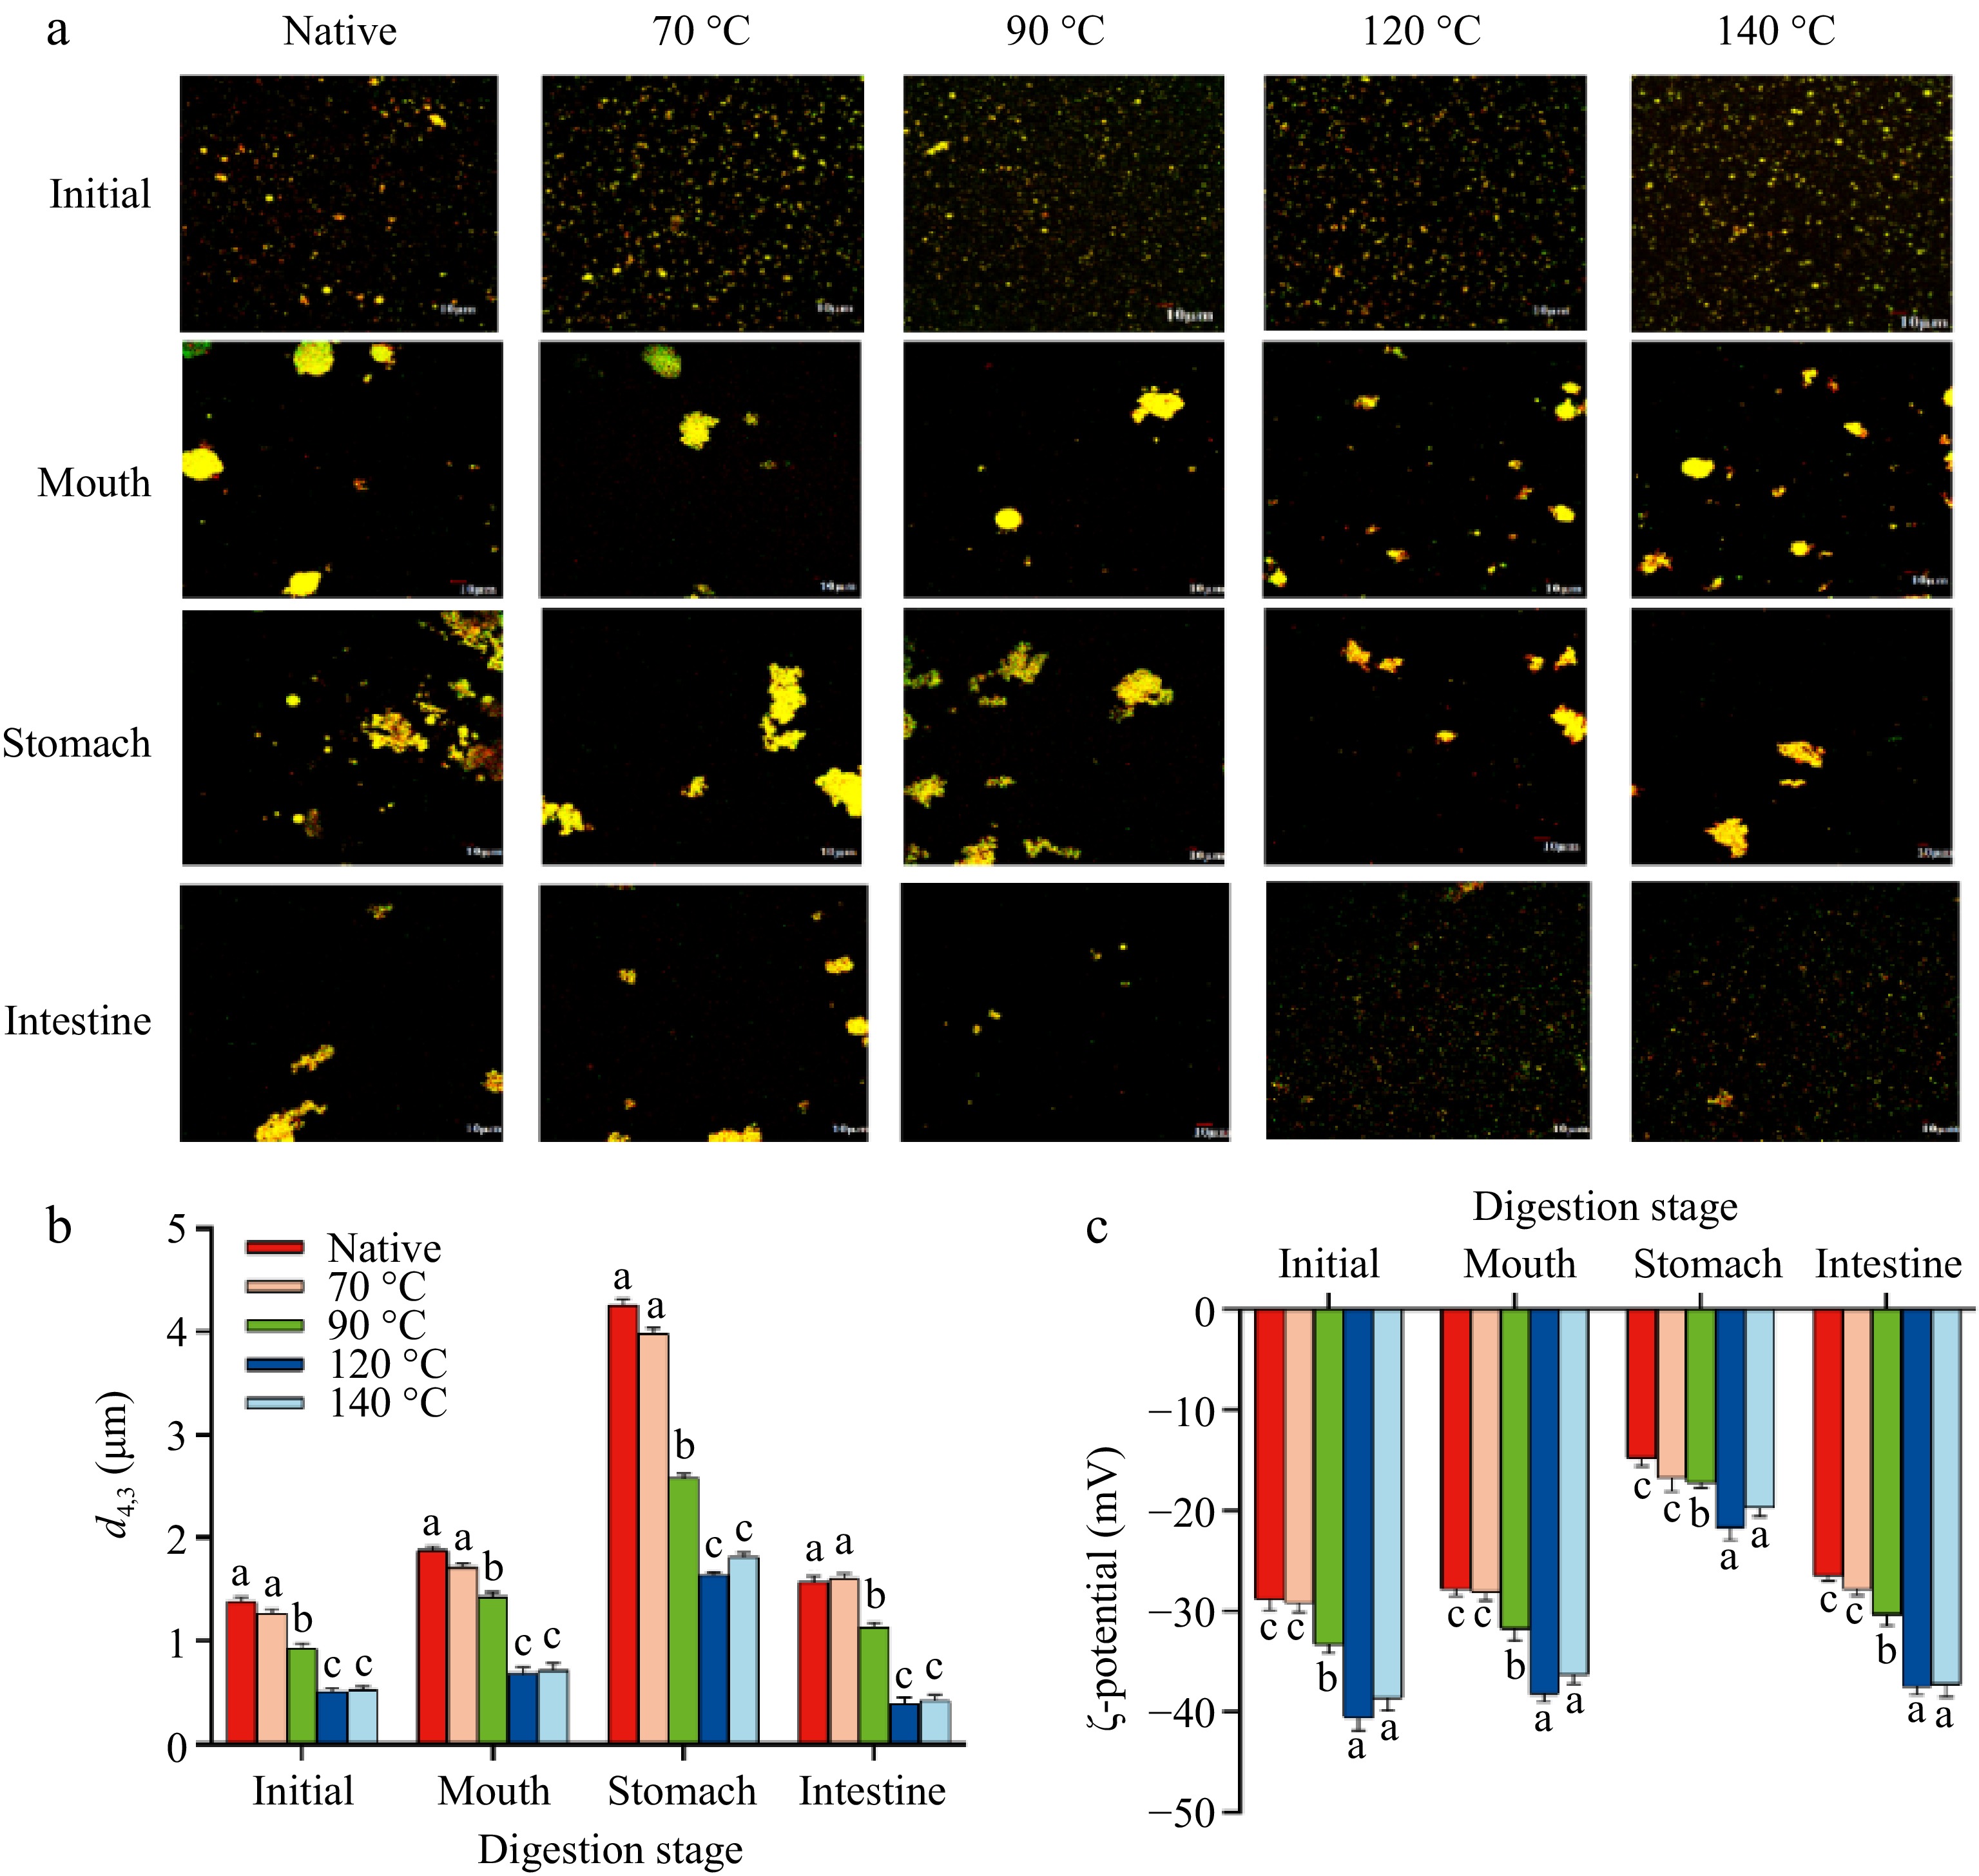
Figure 4.
Changes in (a) the microstructure, (b) particle size, and (c) ζ-potential of the control, LSPI-70, LSPI-90, LSPI-120, and LSPI-140 emulsion after oral, gastric, and intestinal digestion. "Native" indicates the control emulsion. Samples labeled with different lowercase letters (a–d) indicate significant differences (p < 0.05) among different treatments.
-
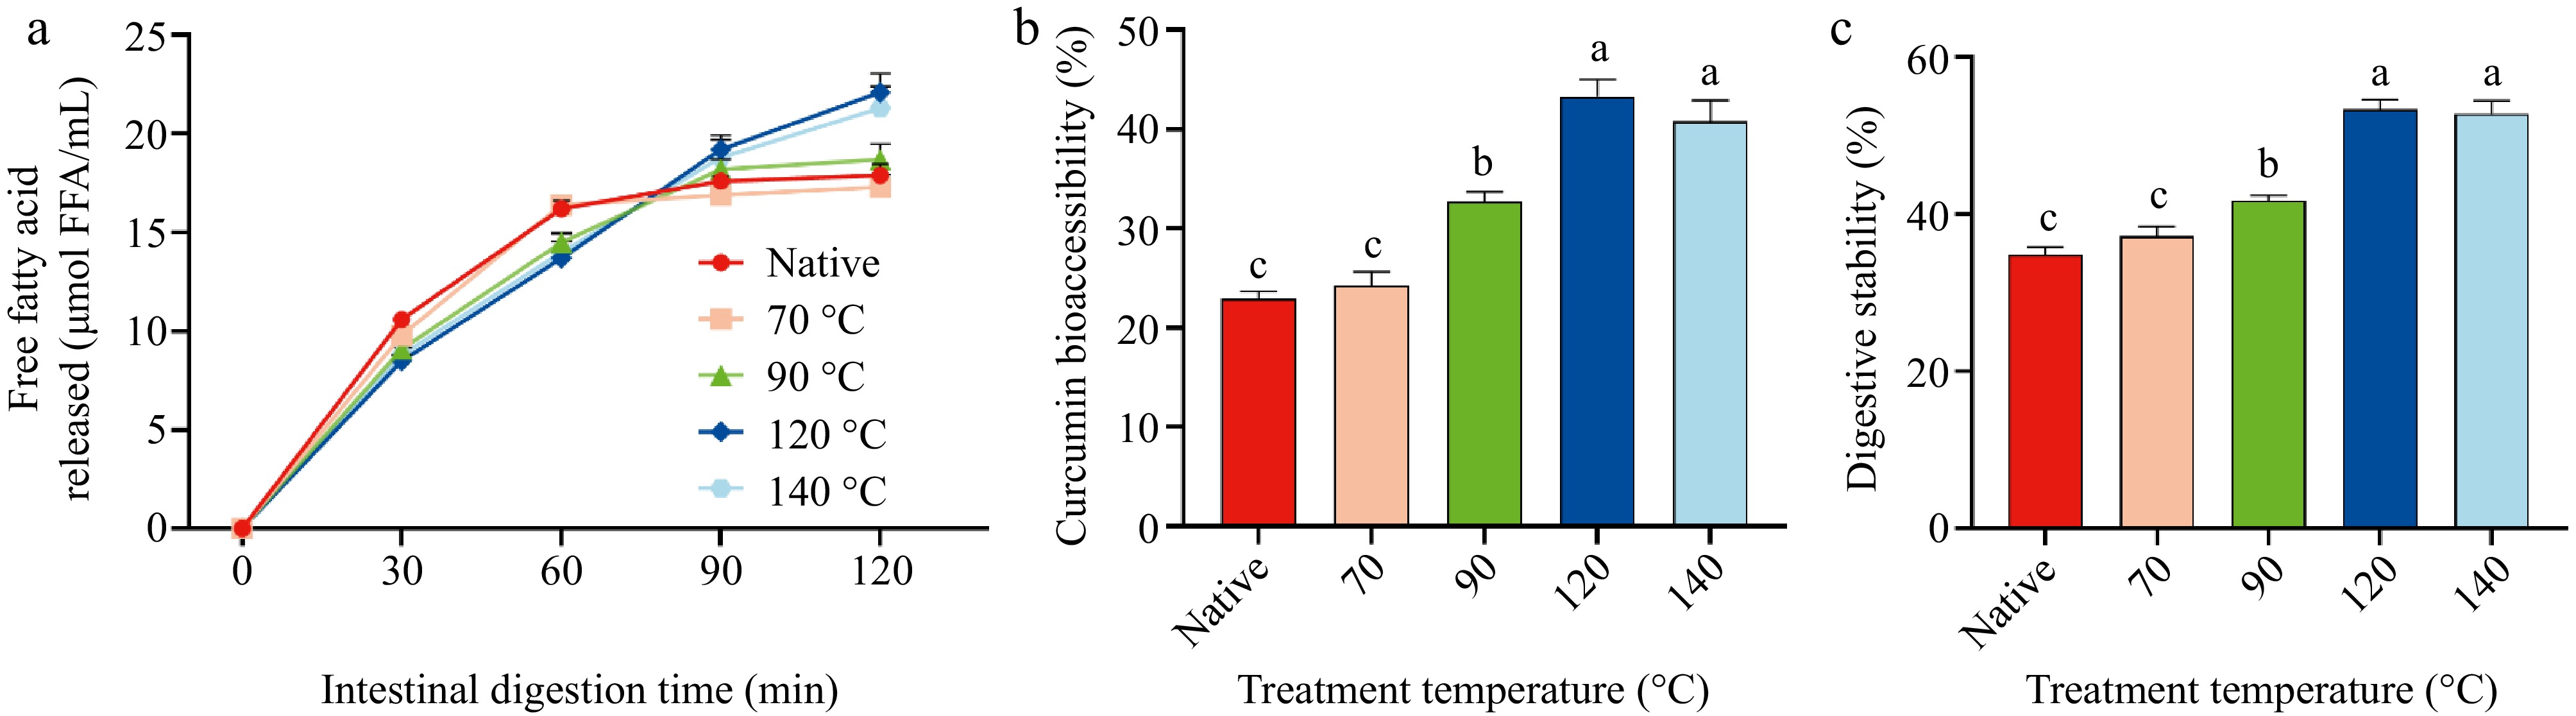
Figure 5.
Effectiveness of delivery by the control, LSPI-70, LSPI-90, LSPI-120, and LSPI-140 emulsions. (a) Changes in the release rate of free fatty acids (FFA) during simulated in vitro digestion. (b) Bioaccessibility of curcumin determined at the end of intestinal digestion (120 min). (c) Digestive stability of curcumin during simulated in vitro digestion. "Native" indicates the control emulsion. Samples labeled with different lowercase letters (a–d) indicate significant differences (p < 0.05) among different treatments.
-

Figure 6.
(a) Apparent viscosity and (b) the effect of frequency on the G' and G'' of emulsions stabilized by LSPI at different temperatures. "Native" indicates the control emulsion. Samples labeled with different lowercase letters (a–d) indicate significant differences (p < 0.05) among different treatments.
Figures
(6)
Tables
(0)