-
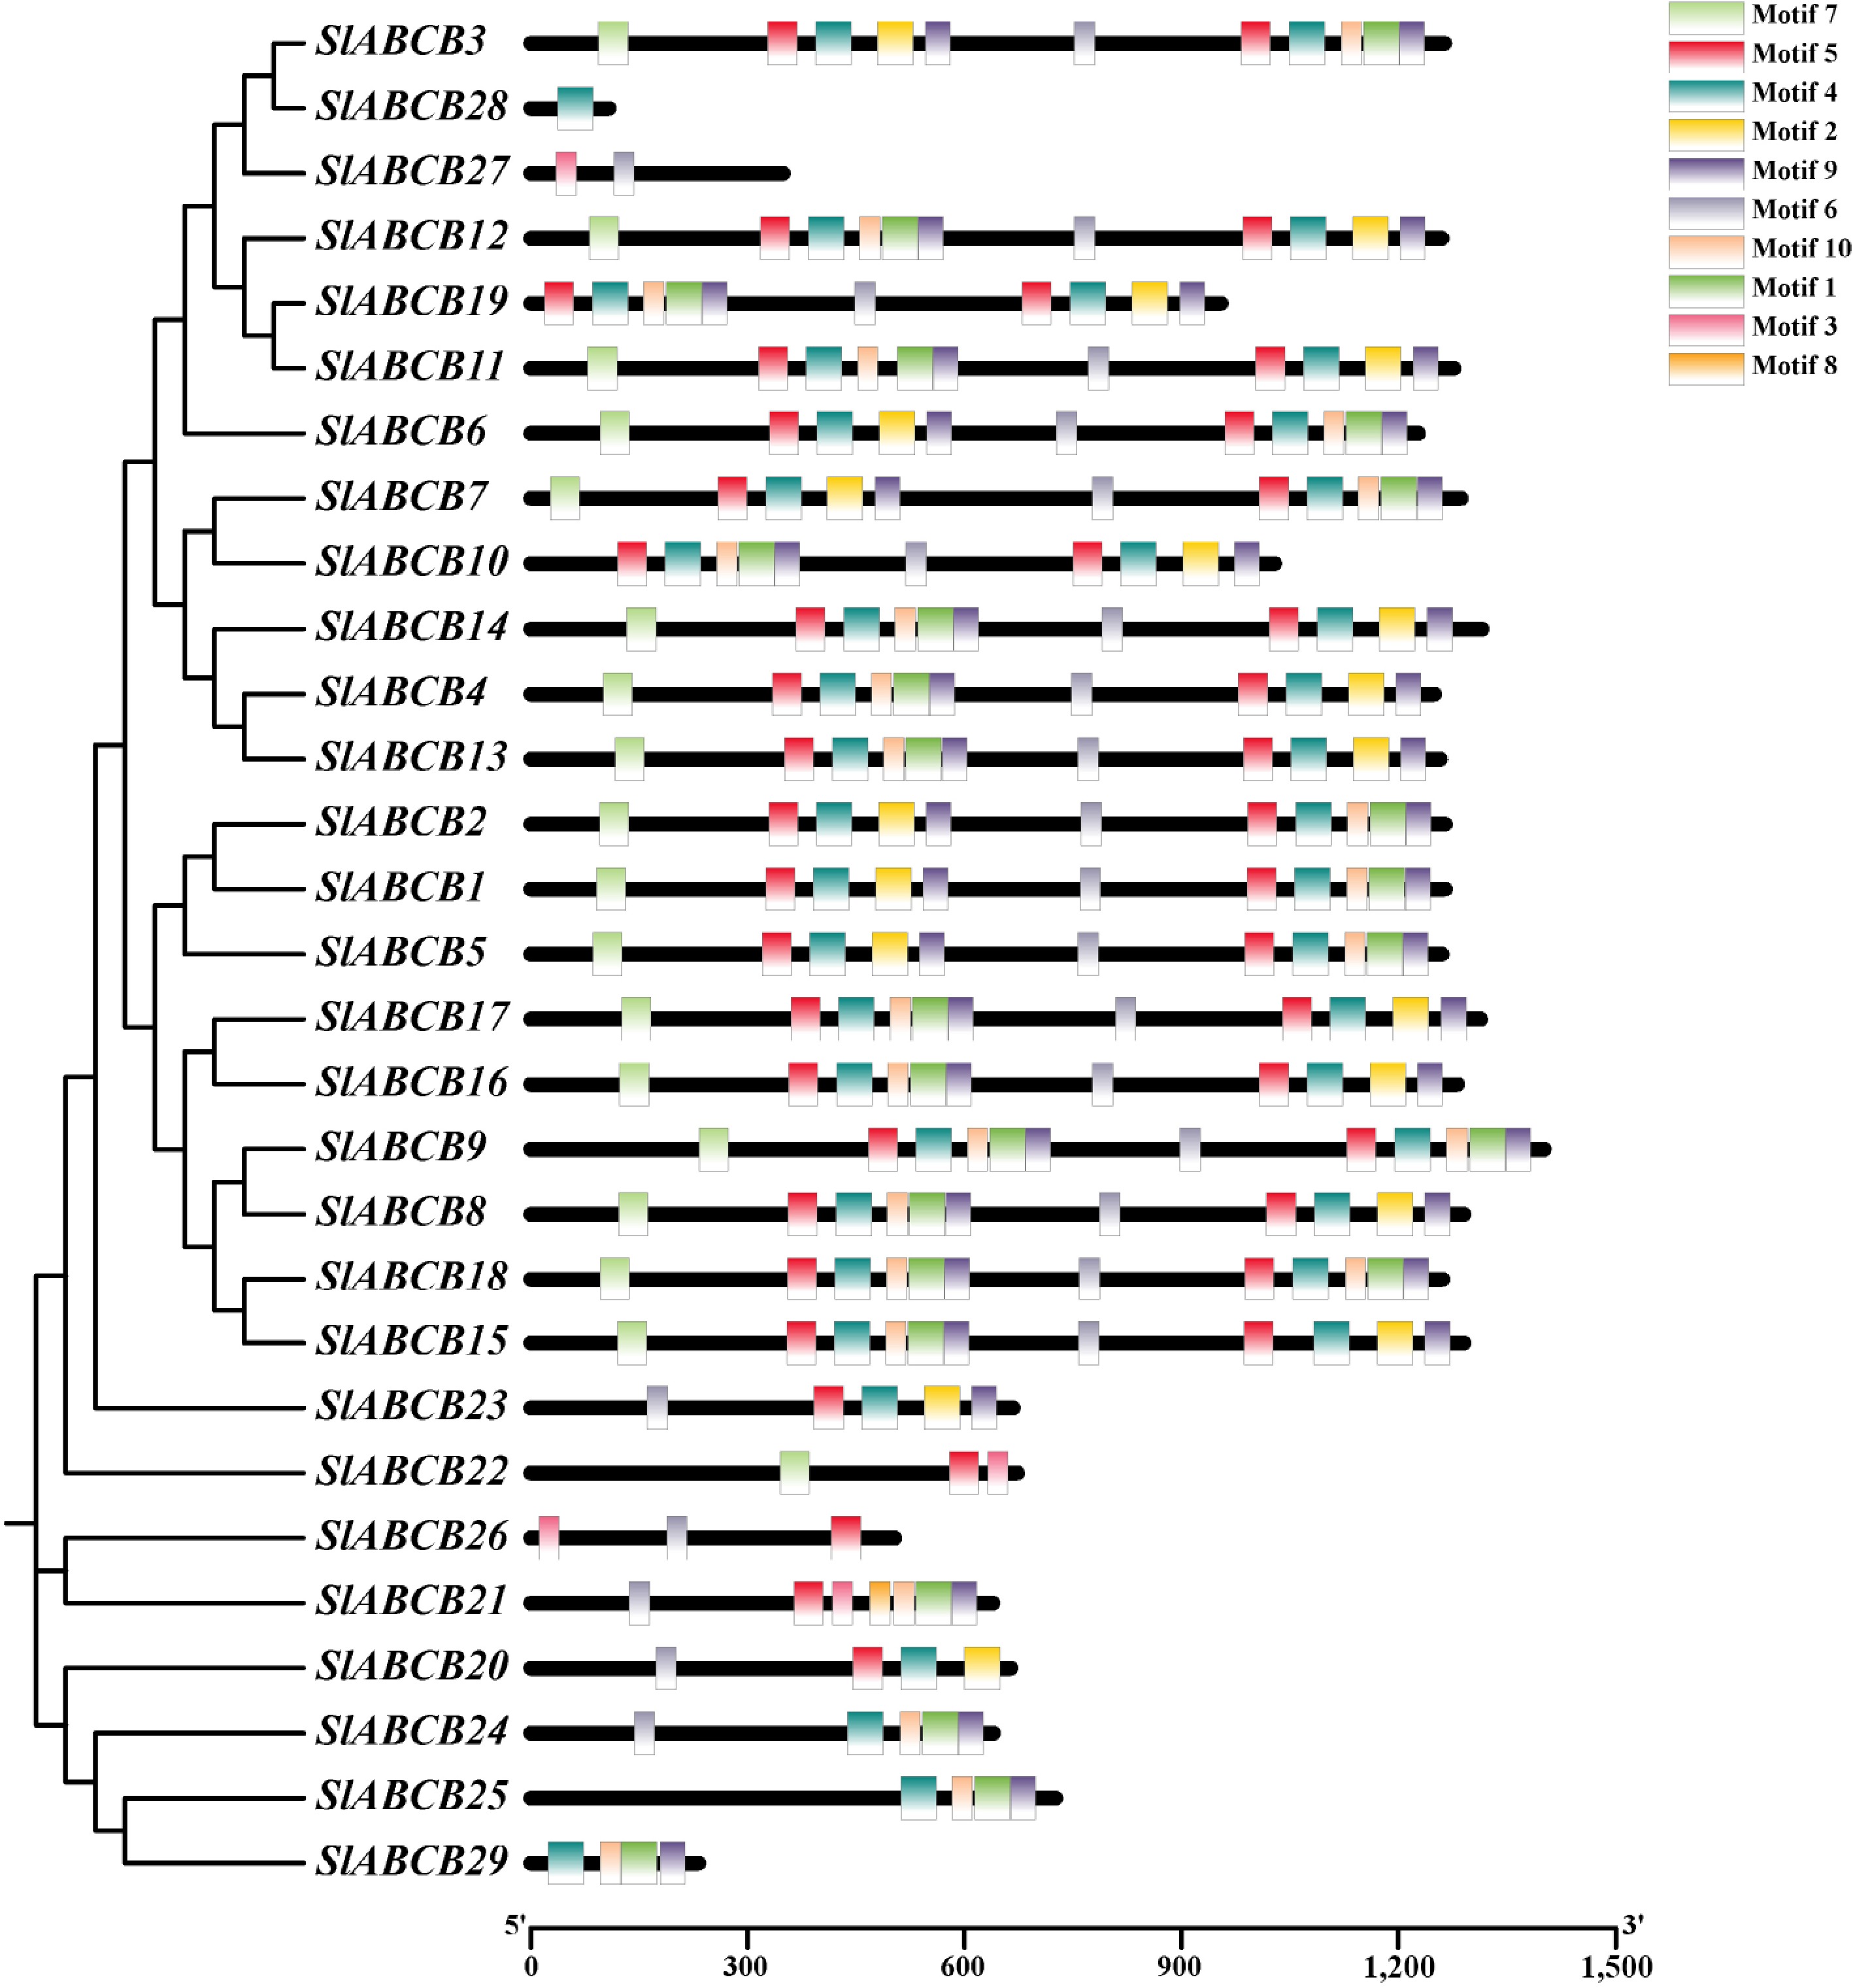
Figure 1.
Phylogenetic tree of ABCB family genes and distribution of conserved protein motifs.
-
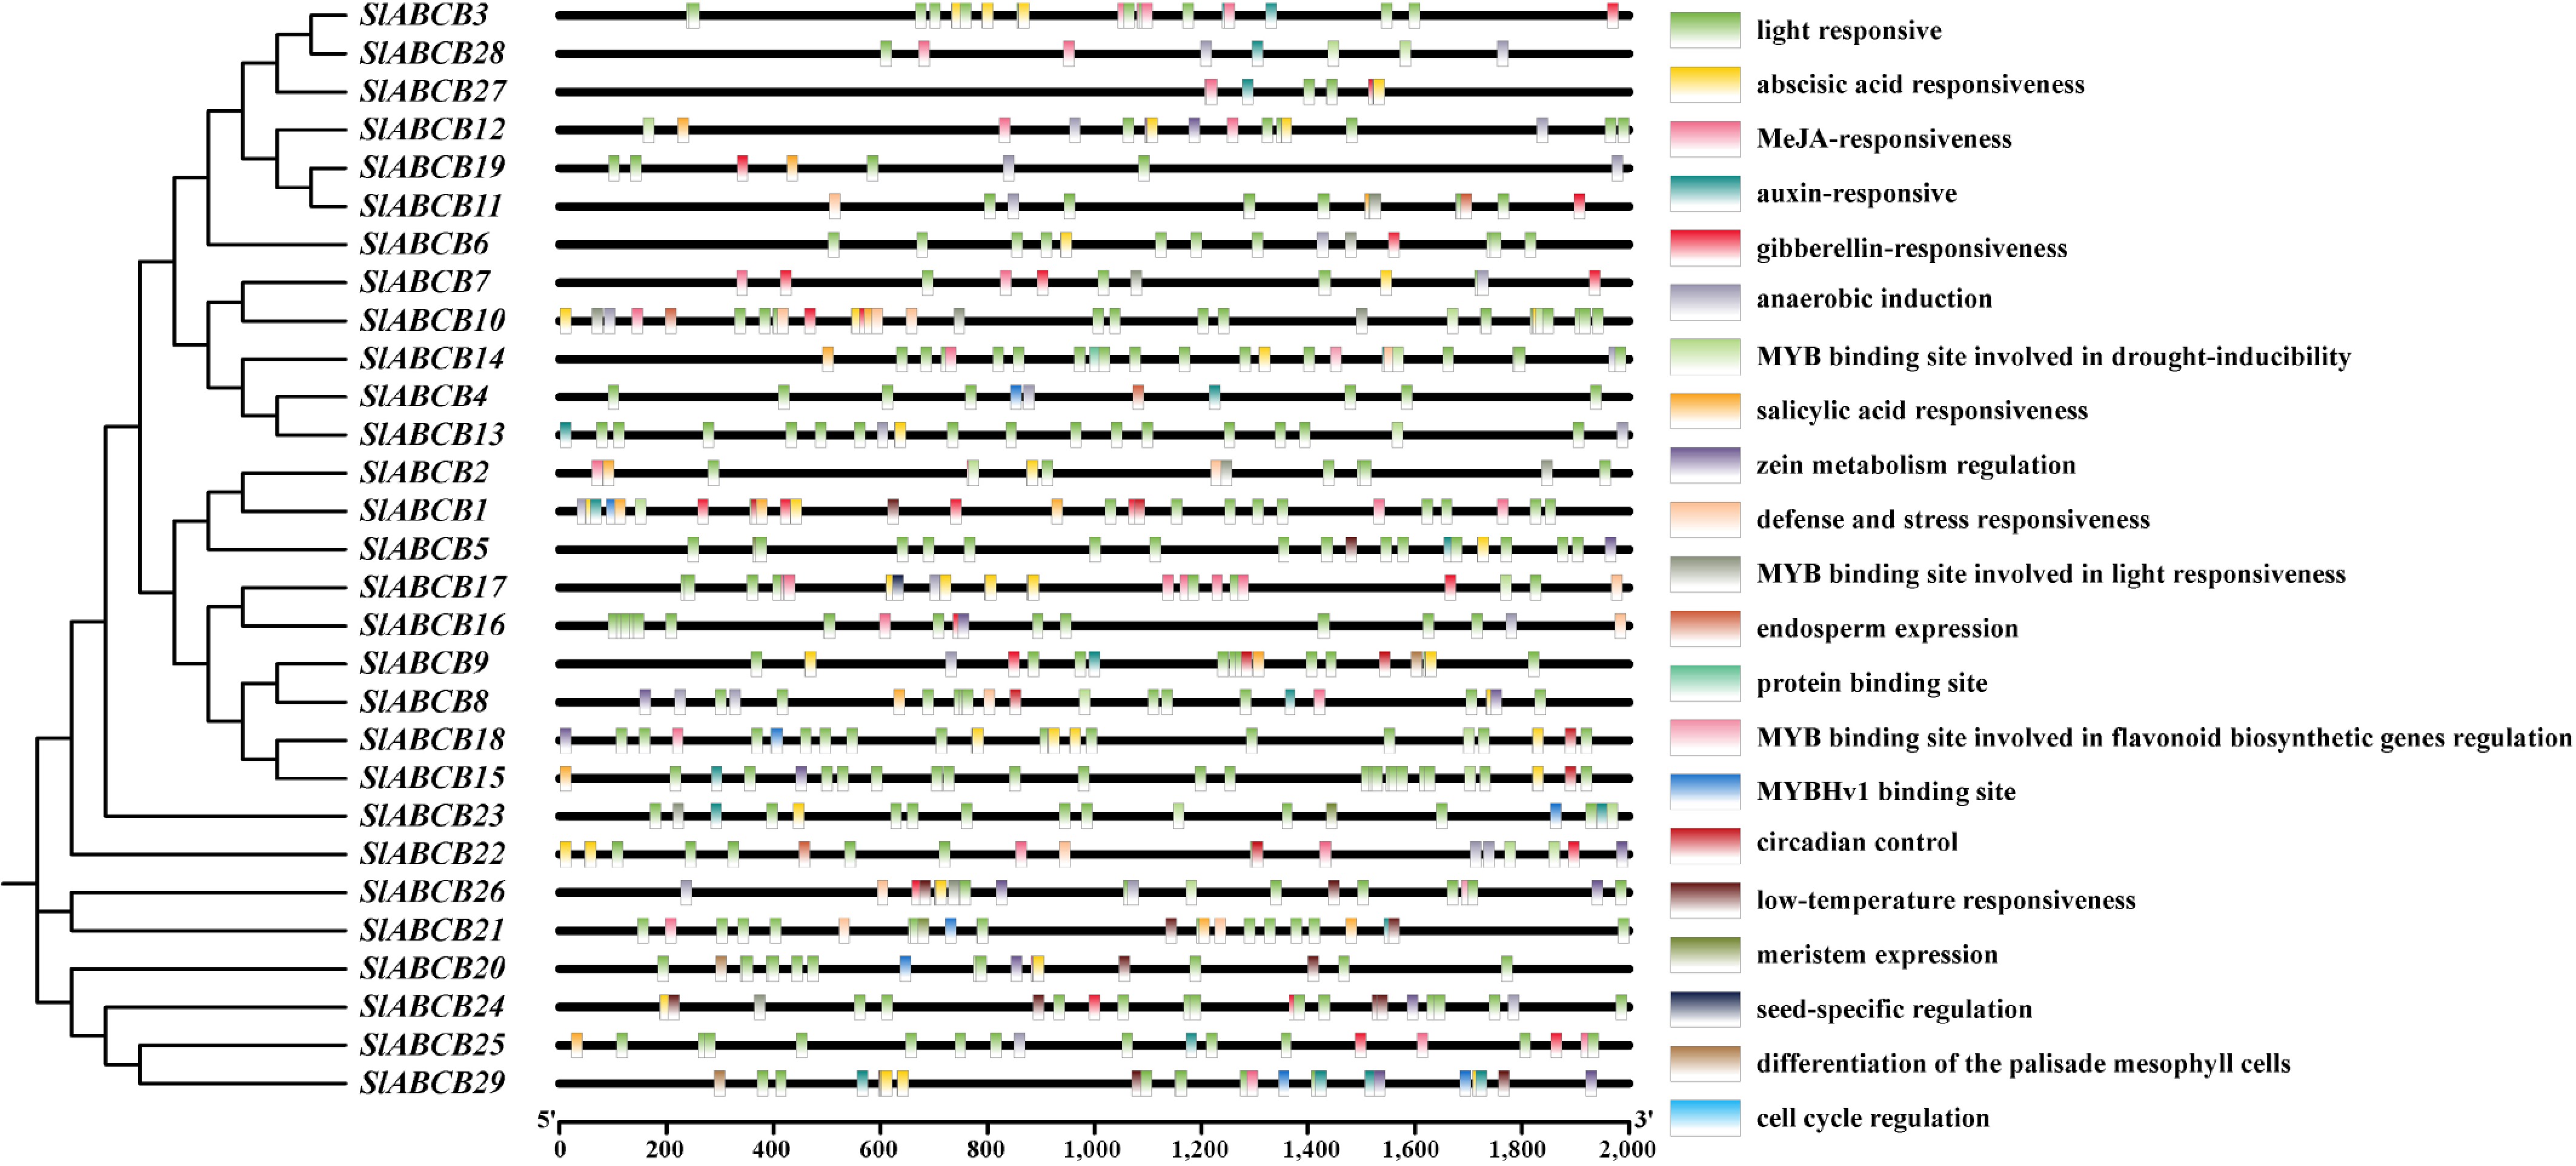
Figure 2.
Location of cis-elements in the ABCB genes' promoter sequences.
-
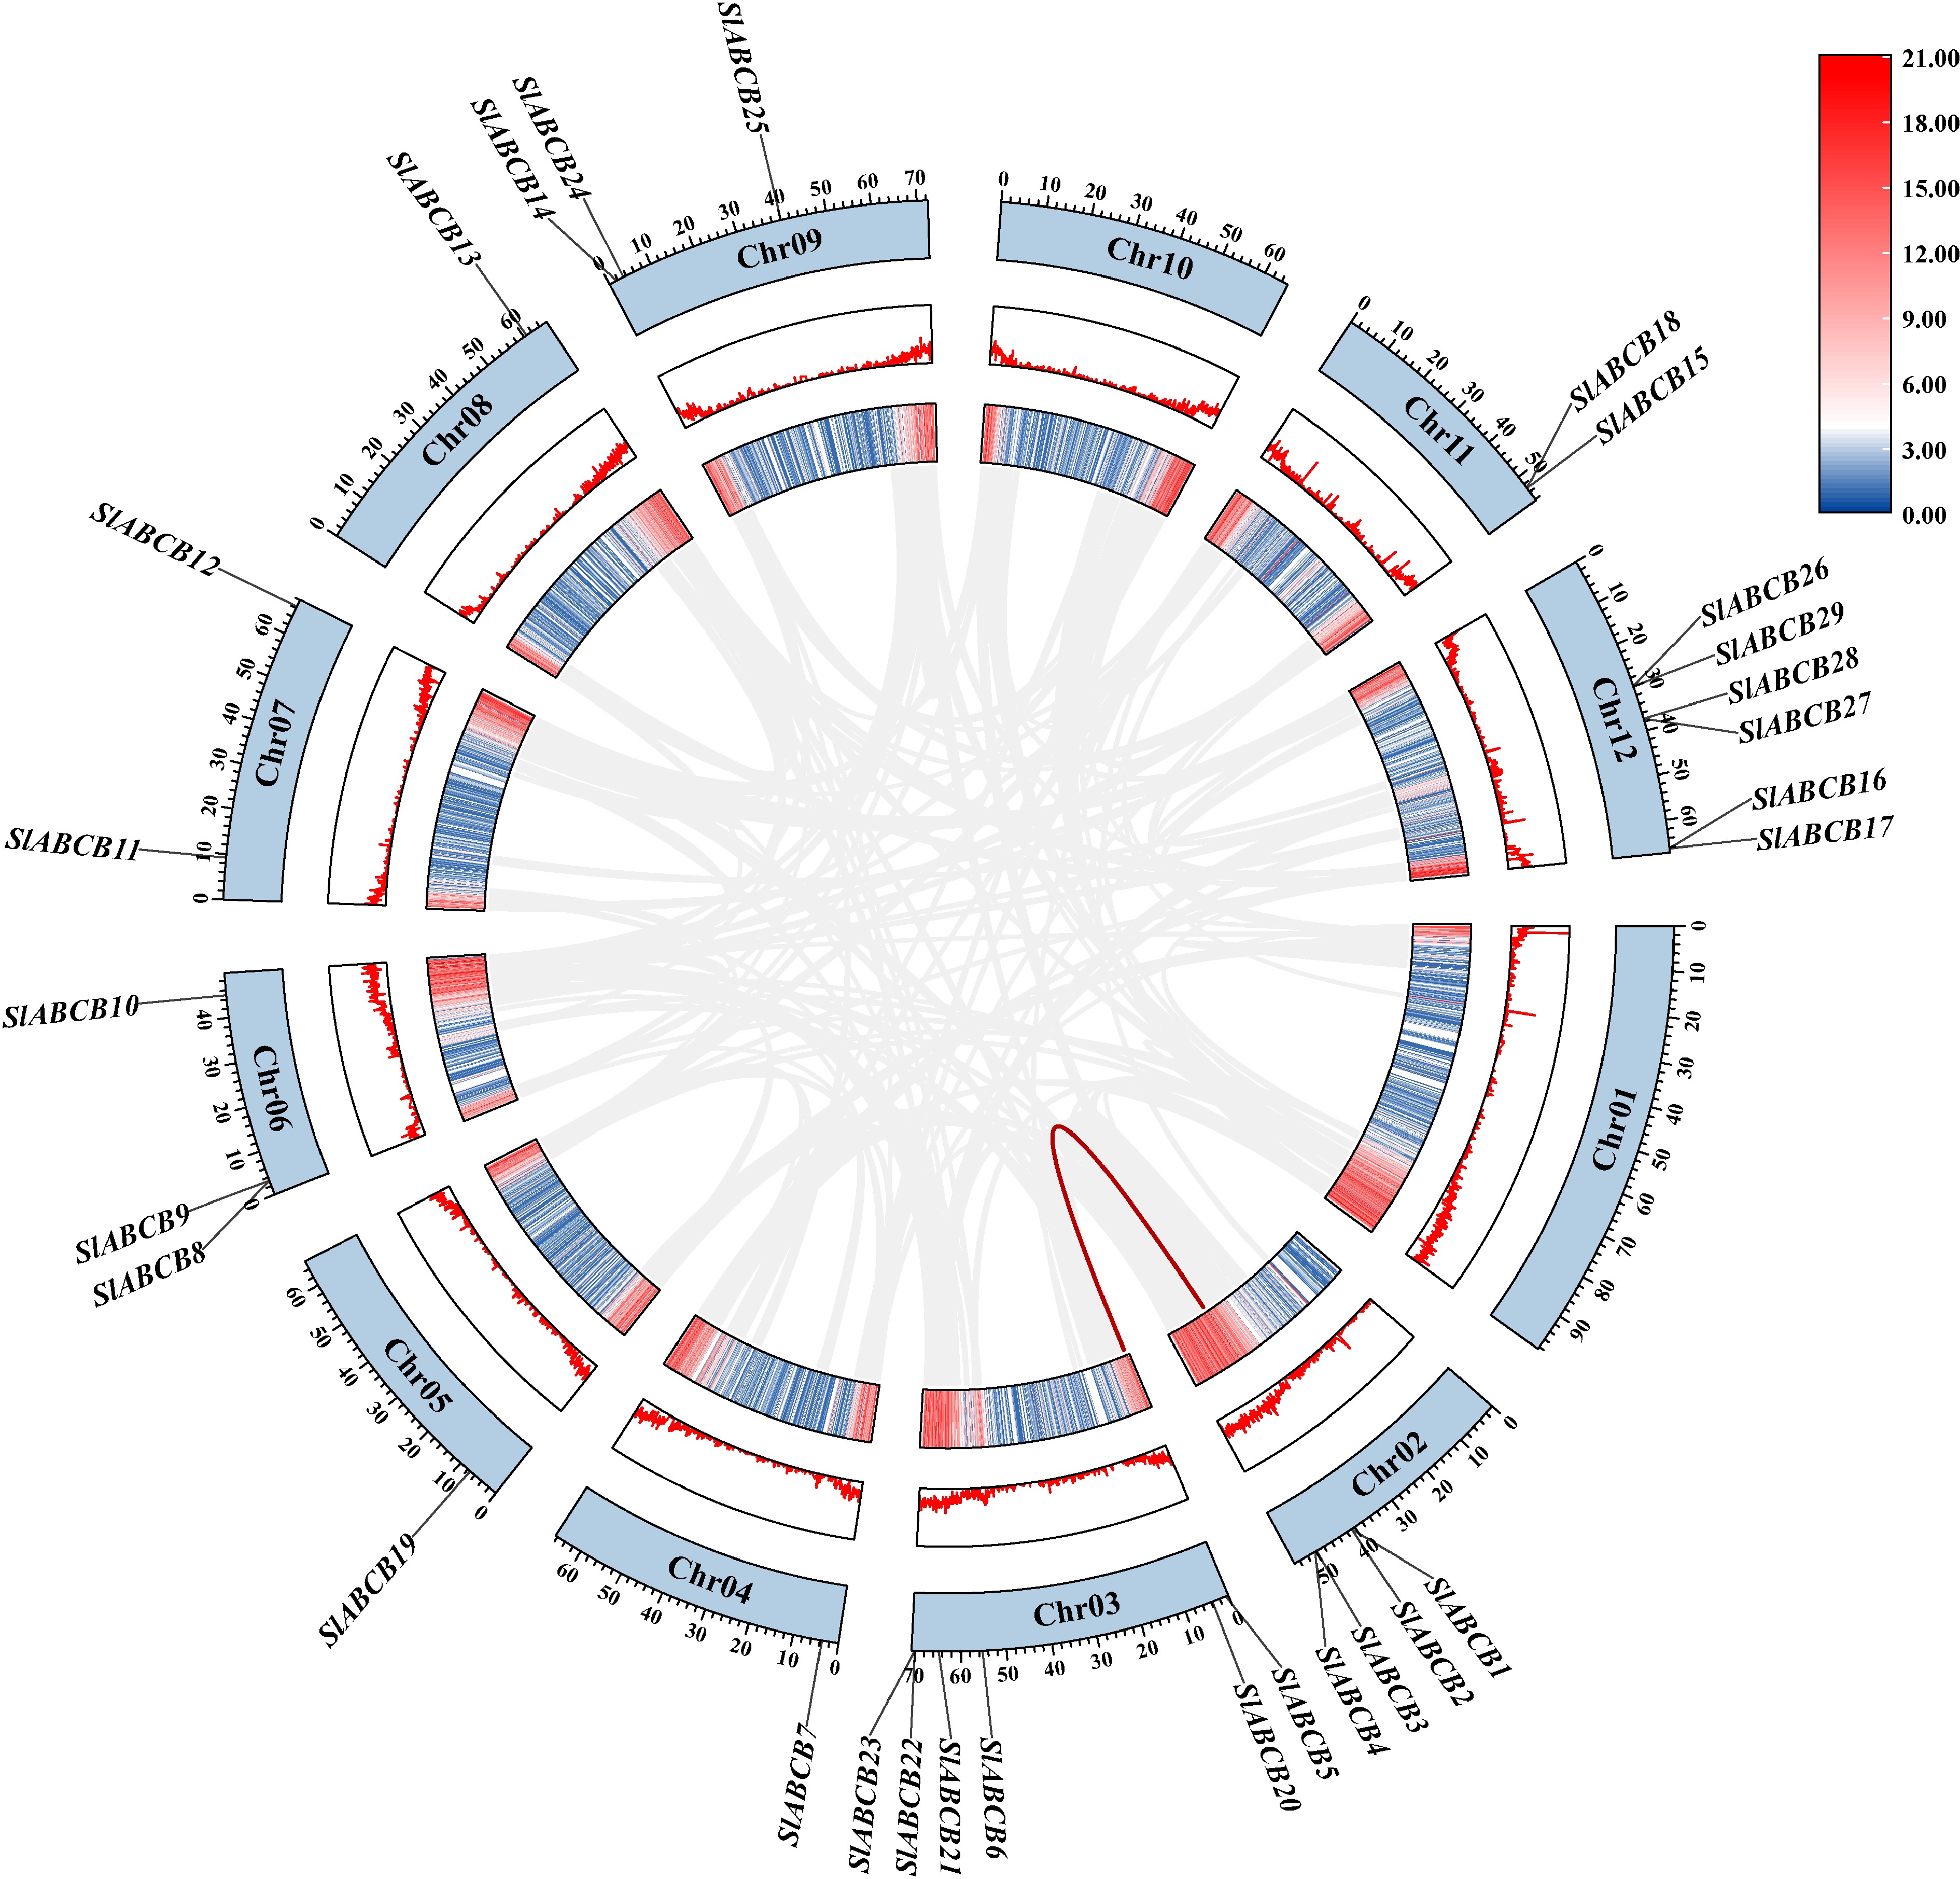
Figure 3.
Collinearity analysis of ABCB genes in tomato species from chromosome 1 to 12.
-
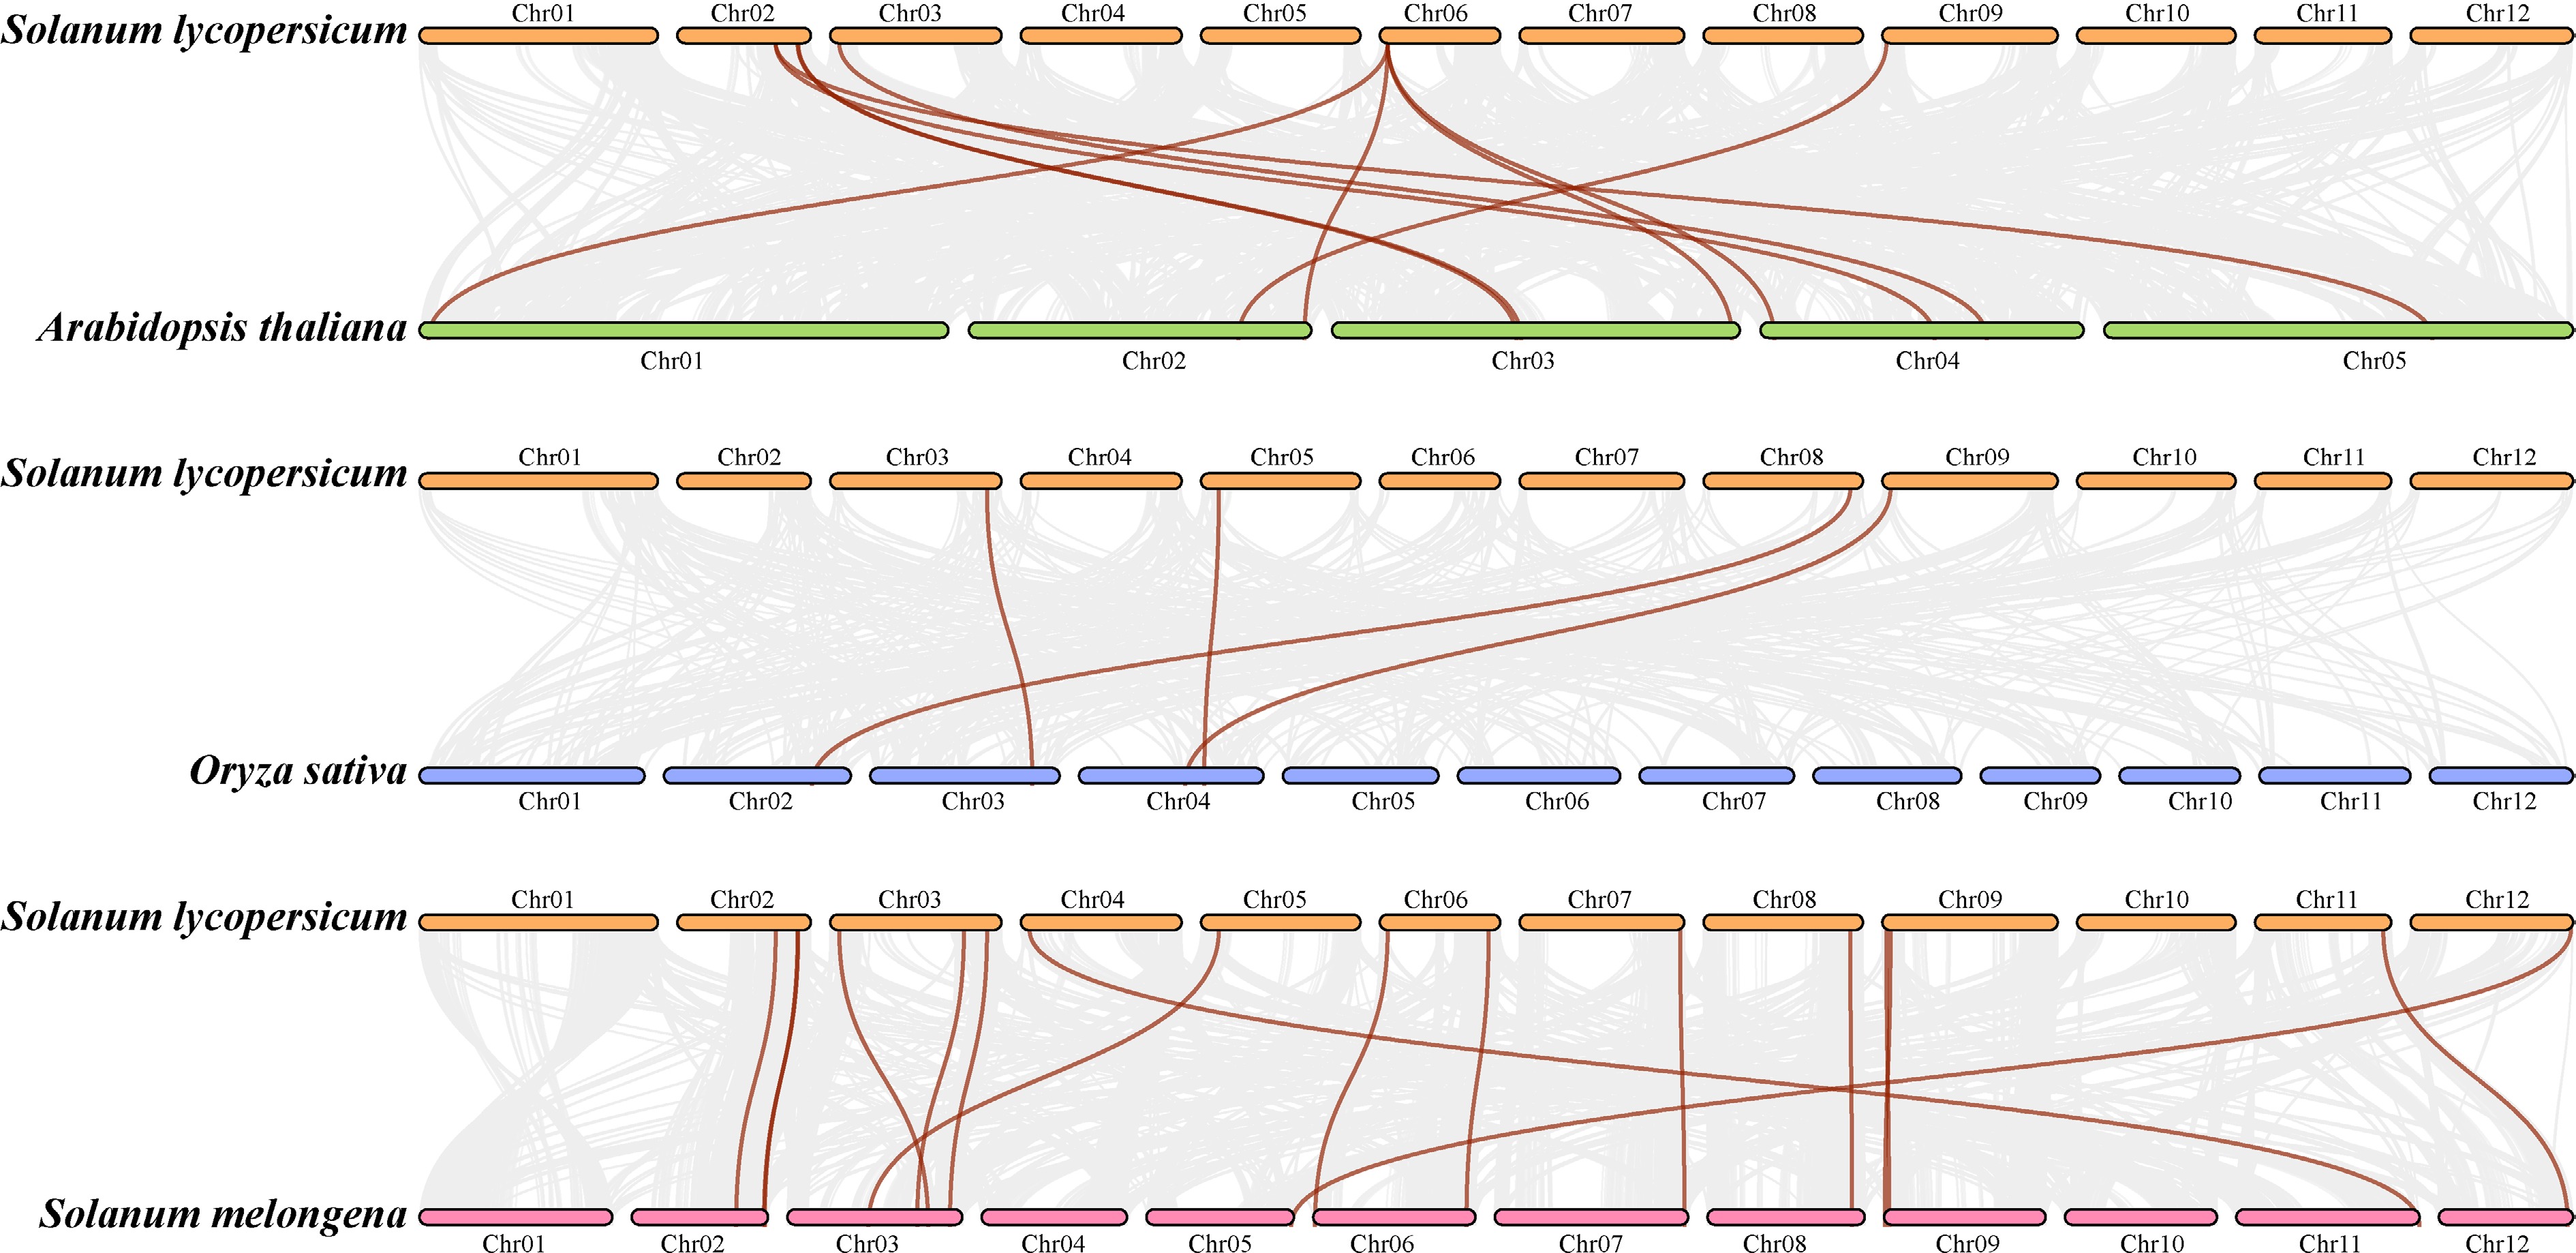
Figure 4.
Collinear correlation of the ABCB gene family between Solanum lycopersicum L. and (a) Arabidopsis thaliana, (b) Oryza sativa, and (c) Solanum melongena.
-
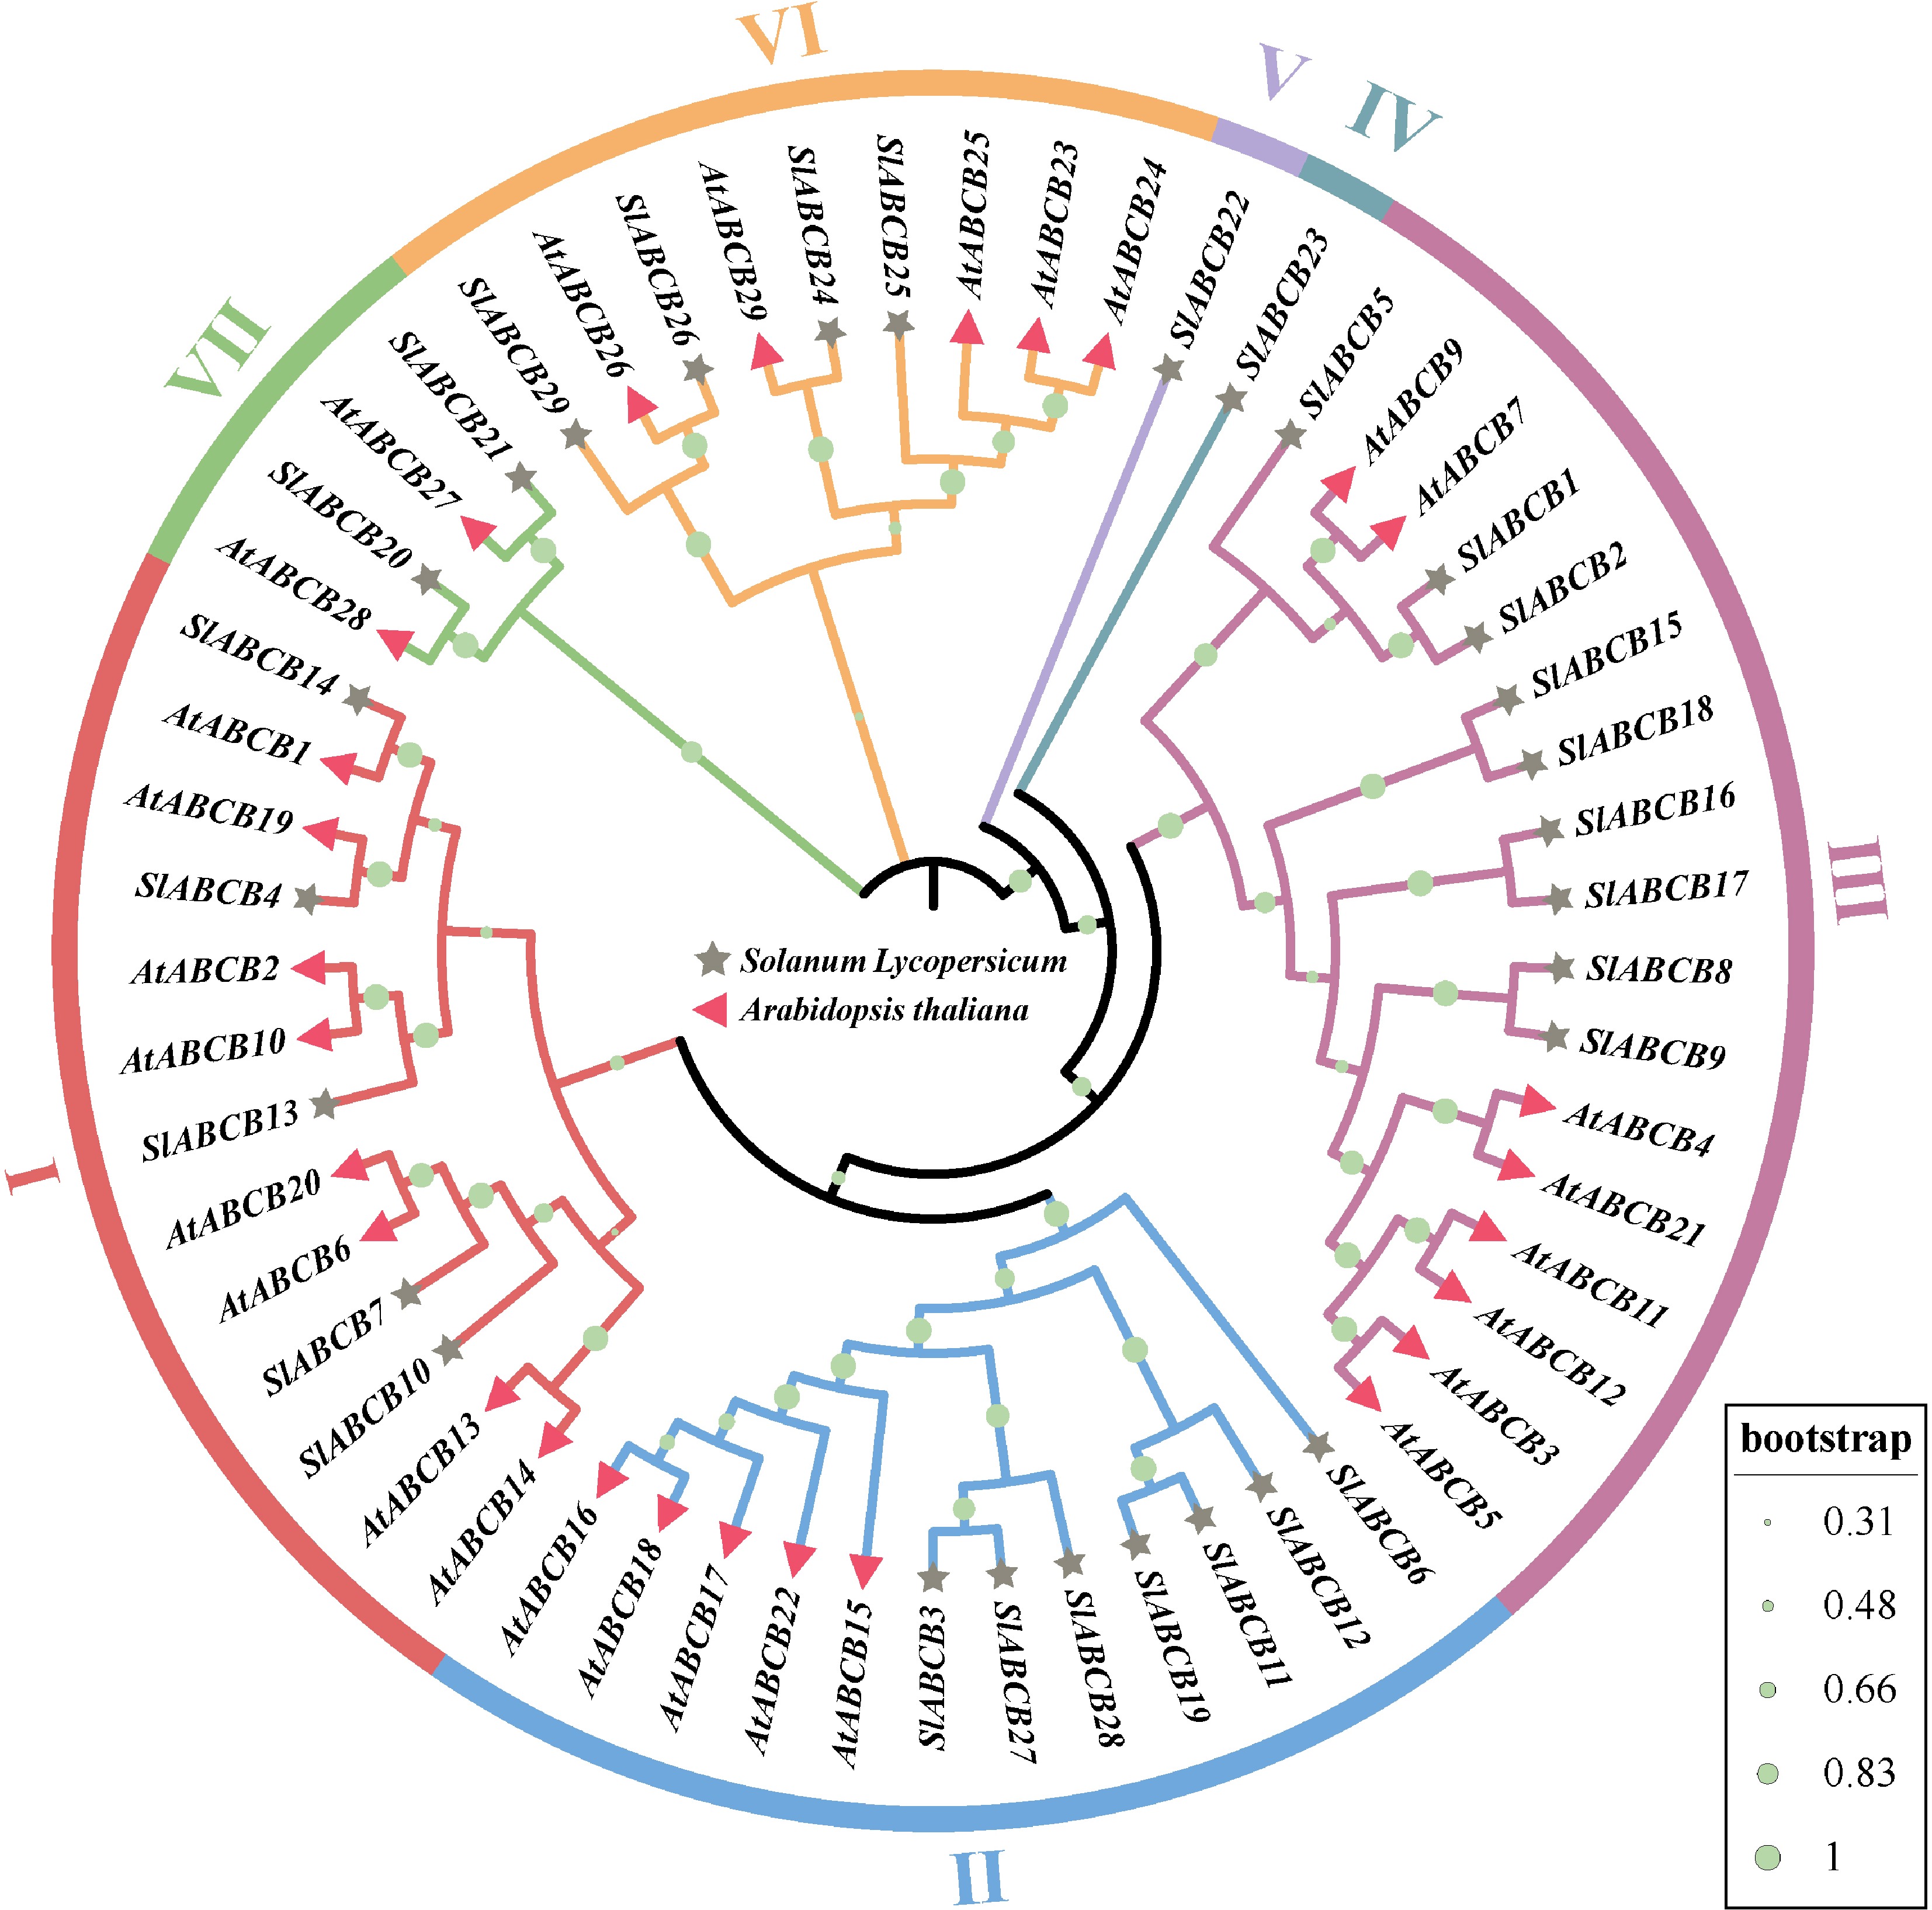
Figure 5.
Phylogenetic tree constructed using MEGA 6.0 by NJ the method based on a total of 58 ABCB proteins comprising 29 S. lycopersicum and 29 Arabidopsis ABCB proteins. The phylogenetic tree reveals seven main clusters (1–7).
-
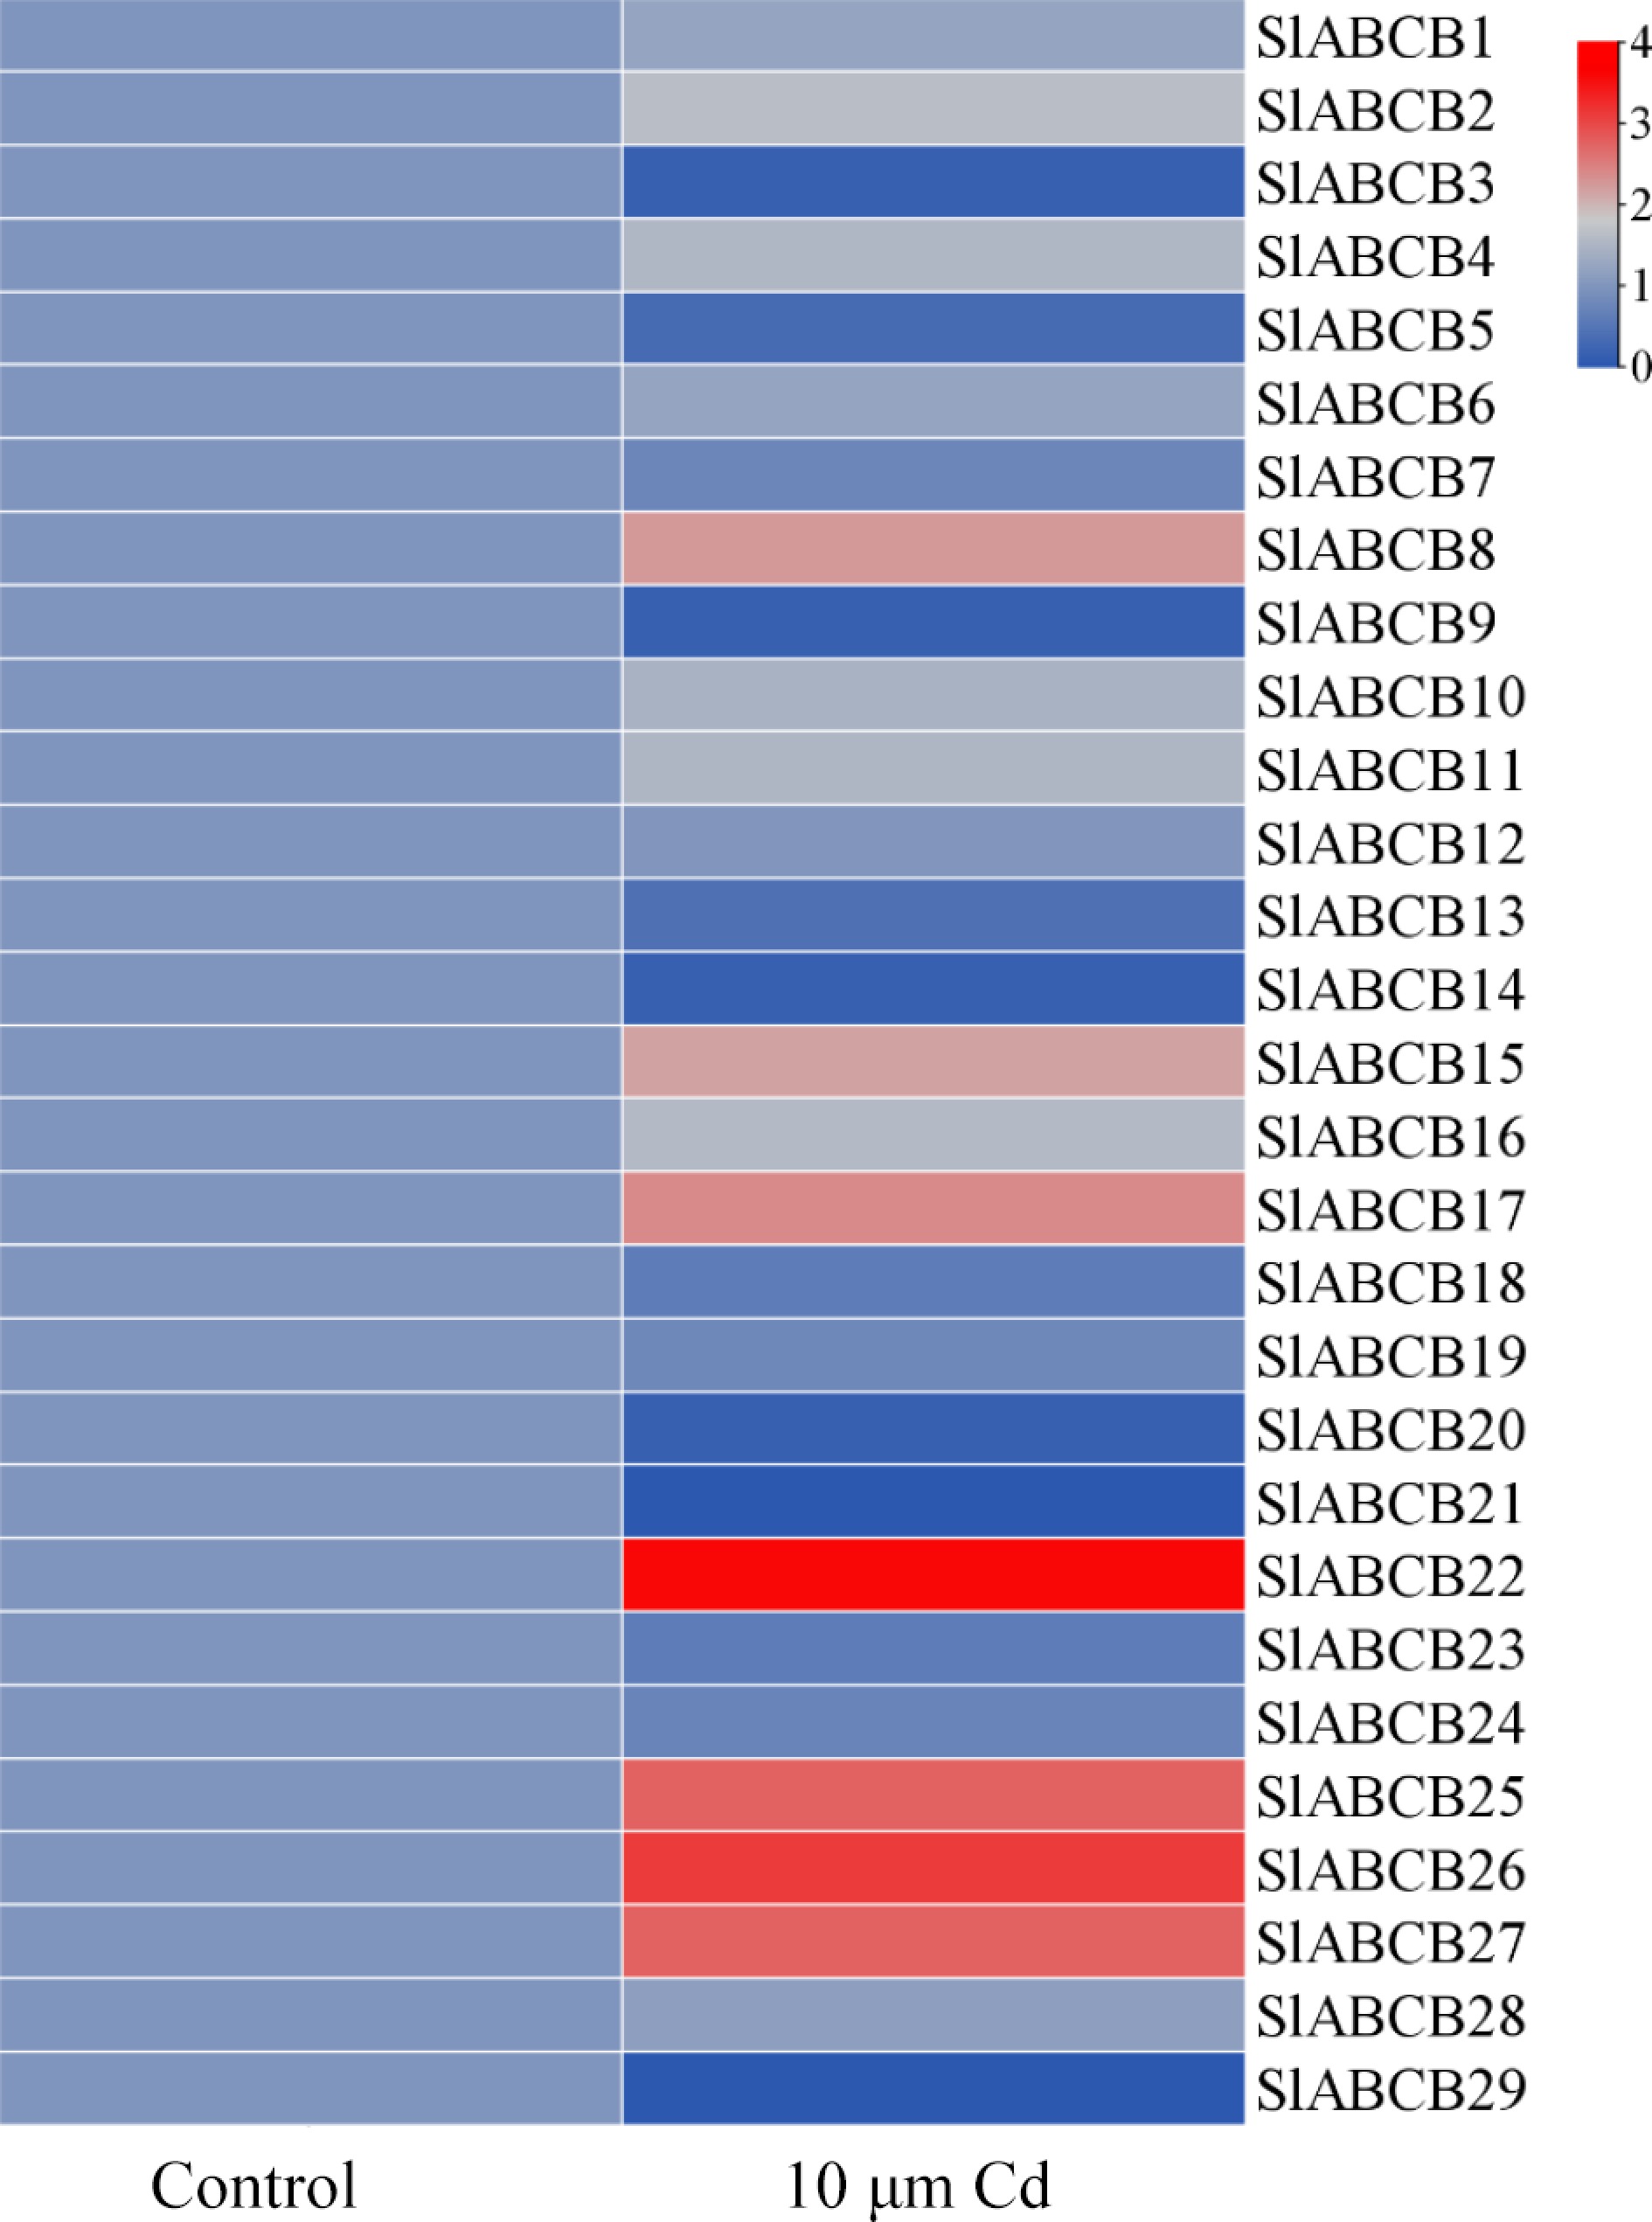
Figure 6.
Heatmap of SlABCB genes determined by microarray analysis and RNA-Seq data. The heatmap was generated using TBtools software using the RNA-Seq data.
-
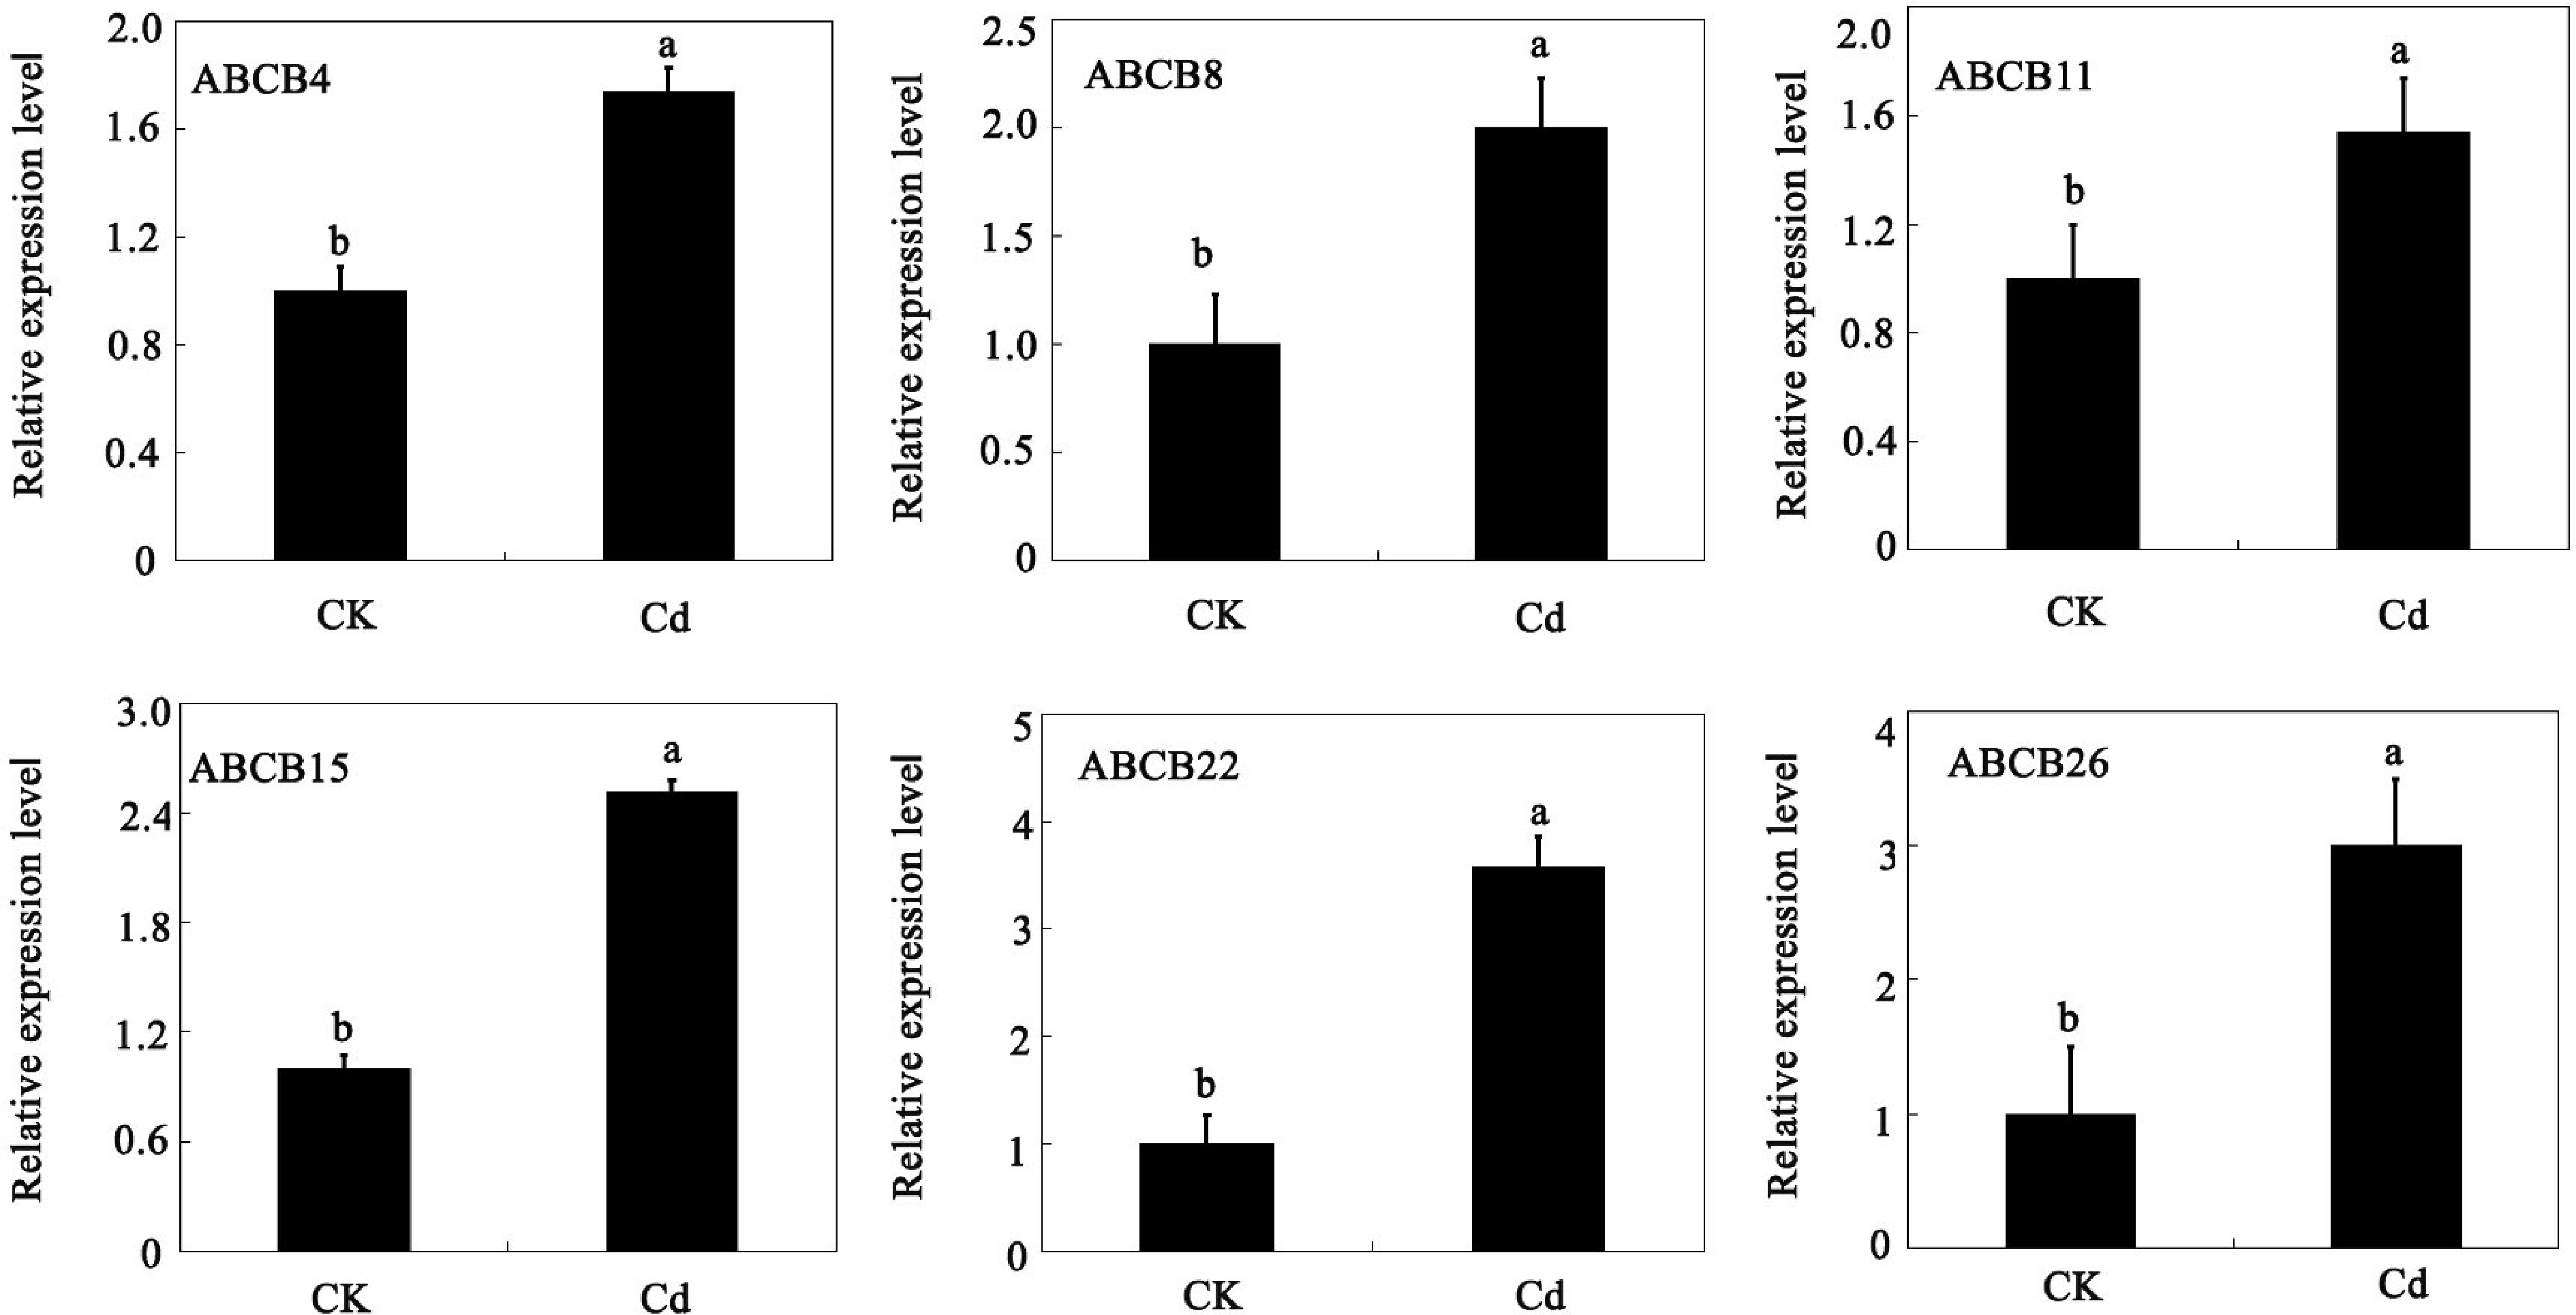
Figure 7.
Expression of ABCB genes in tomato under cadmium stress, determined by qRT-PCR. The data in the figure were obtained from three biological replicates (n = 3), presented as the means + standard error (SE). Significance differences are denoted by different lowercase letters (p < 0.05), according to Duncan's multiple range test.
-
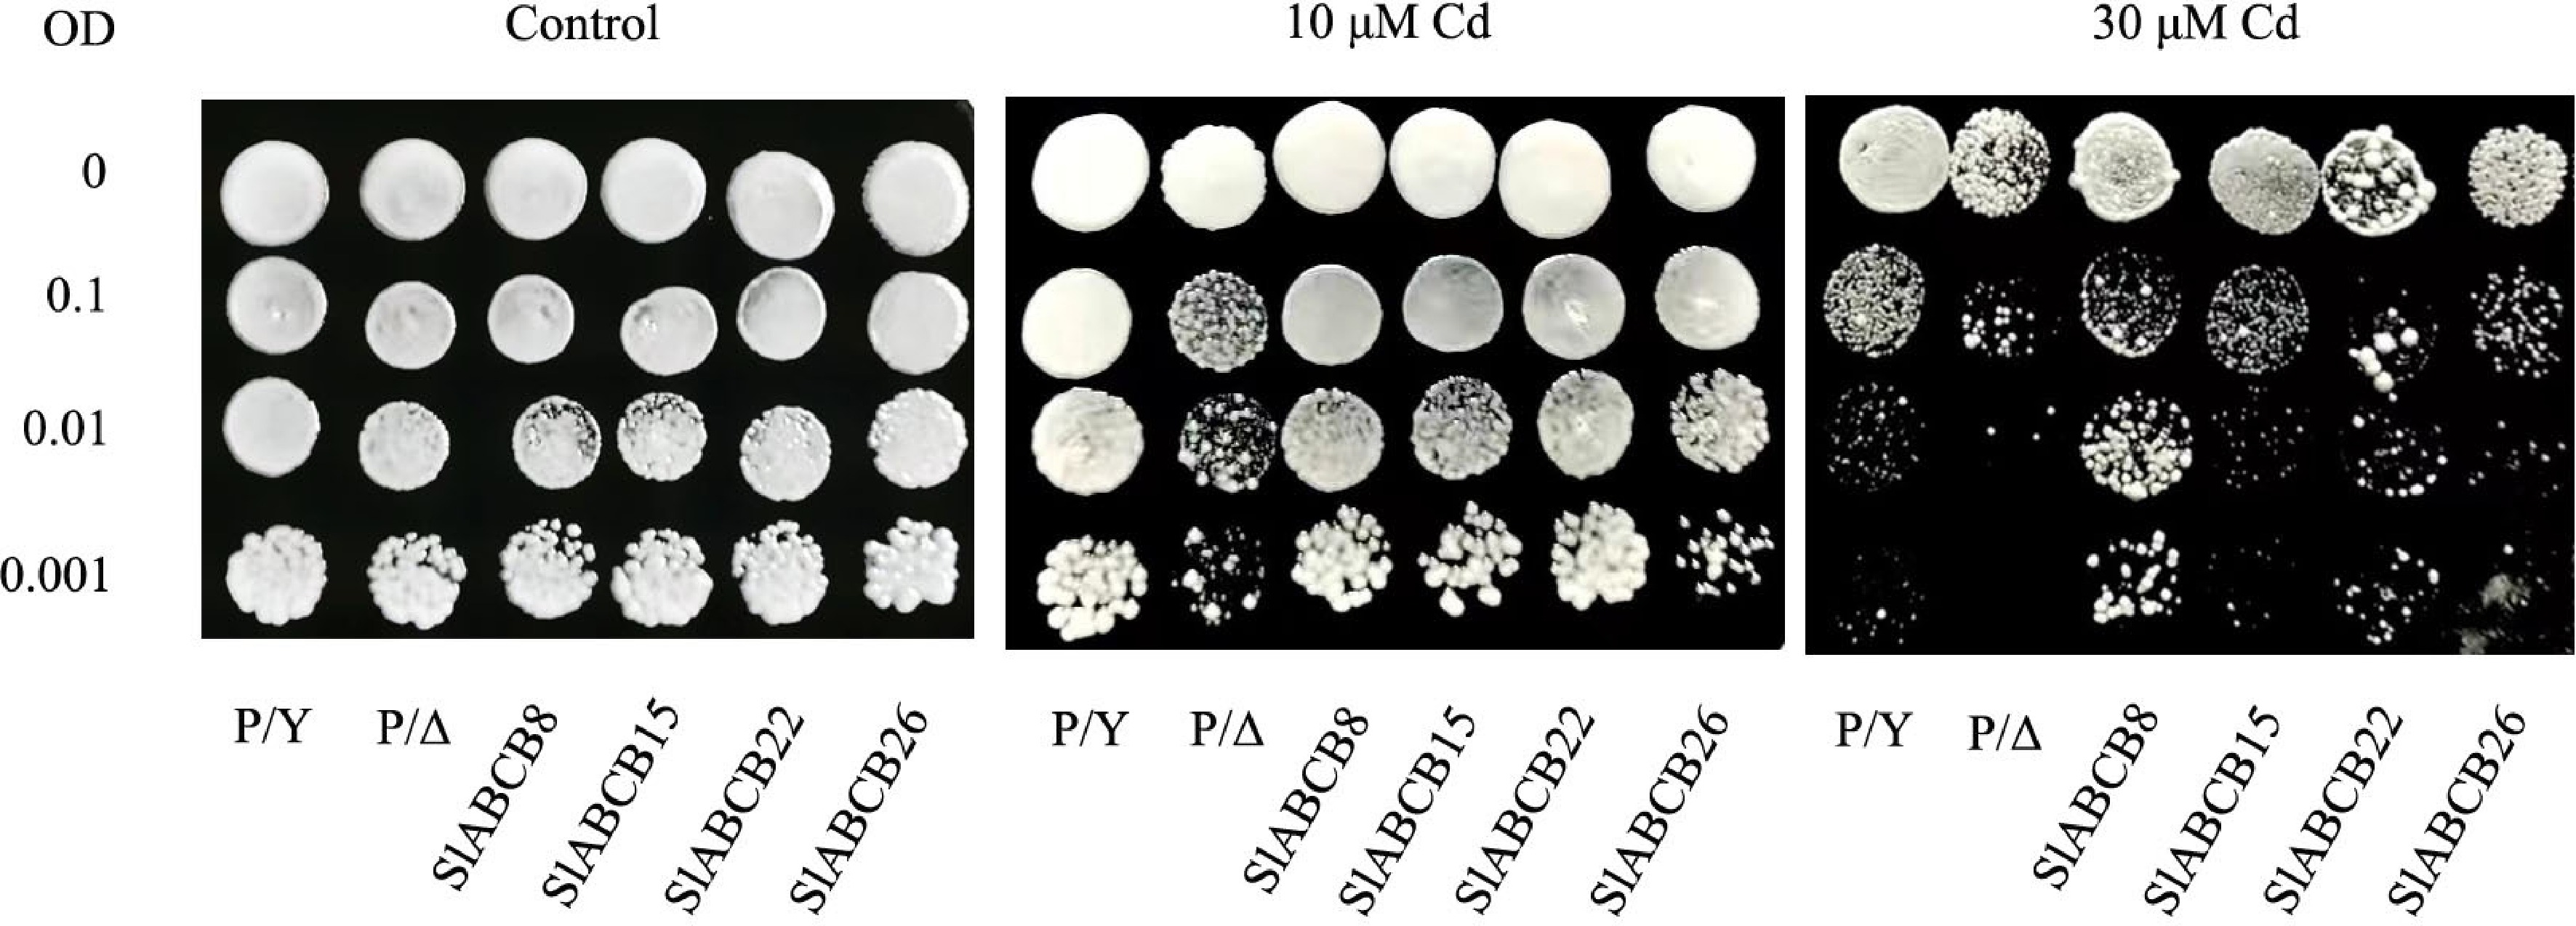
Figure 8.
Functional verification of SlABCB genes in yeast. SlABCB8, SlABCB15, SlABCB22, and SlABCB26 were transformed into Cd-sensitive strains of Saccharomyces cerevisiae Δyap1 to test their function of mediating tolerance to excess Cd. P/Y, wild-type Y252 transformed with the empty pYES2 vector; P/Δ, the cadmium-sensitive yeast mutant Δyap1 transformed with the empty pYES2 vector.
-
Genes Locus Forward primers (5'→3') Reverse primers (5'→3') ABCB4 Solyc02g087870.2.1 CTACTATACAAATCCCGCAA TGCCAACATCATCCTCCGAA ABCB8 Solyc03g114950.2.1 AACCGTTCTTGTCATAGC GTCATCATGTGTGCCACT ABCB11 Solyc04g010310.2.1 CGTTCAATCTGCAAATCGGAA AAACTCACTGTTAGGACGACT ABCB15 Solyc06g009290.2.1 GGCTTTTGATGGGGGCATTG GATTTTCGCGTAGAGGGCCT ABCB18 Solyc06g009290.2.1 AACAAGCCTGAAATACCTG GAAGGCAATAAAAGTTACA ABCB20 Solyc09g008240.3.1 TCTTCATACGGTCGATCACC CGGCCAAACGAACTAGCTTG ABCB22 Solyc09g055350.2.1 GCCAGAATTATAAGCACTCT CATTCACAACCTTTGCACCA ABCB26 Solyc12g098840.3.1 GCATCTTTACTAGCGACACC TCTCCAATCATACCTCGGAC Ubiquitin Solyc10g005560.2.1 CACCAAGCCAAAGAAGATCA TCAGCATTAGGGCACTCCTT Table 1.
Primers used in RT-qPCR analysis
-
Gene Name Gene ID AA MW (kD) pI Instability index Aliphatic index Structural model SlABCB1 Solyc02g071340.1 1,264 137.7 5.84 35.80 103.71 Whole-molecular transporter SlABCB2 Solyc02g071350.2 1,264 137.1 8.09 35.41 103.32 Whole-molecular transporter SlABCB3 Solyc02g087410.2 1,263 137.5 7.97 40.60 99.70 Whole-molecular transporter SlABCB4 Solyc02g087870.2 1,250 136.1 8.08 36.86 99.42 Whole-molecular transporter SlABCB5 Solyc03g005860.2 1,260 136.7 7.20 36.03 105.92 Whole-molecular transporter SlABCB6 Solyc03g093650.2 1,228 134.3 8.35 33.30 102.94 Semi-molecular transporter SLABCB7 Solyc04g010310.2 1,286 142.3 6.33 46.36 101.18 Whole-molecular transporter SLABCB8 Solyc06g009280.1 1,290 139.3 7.80 36.82 101.57 Whole-molecular transporter SLABCB9 Solyc06g009290.2 1,401 138.6 8.18 35.65 100.28 Semi-molecular transporter SLABCB10 Solyc06g072960.1 1,029 113.1 7.01 38.56 104.26 Semi-molecular transporter SLABCB11 Solyc07g018130.1 1,276 140.2 8.73 36.13 101.71 Semi-molecular transporter SLABCB12 Solyc07g064120.1 1,260 138.0 8.88 37.83 93.87 Semi-molecular transporter SLABCB13 Solyc08g076720.2 1,258 138.2 8.75 35.64 103.51 Semi-molecular transporter SLABCB14 Solyc09g008240.2 1,315 140.0 8.63 36.18 95.56 Whole-molecular transporter SLABCB15 Solyc11g067310.1 1,290 141.4 7.05 35.48 103.07 Whole-molecular transporter SLABCB16 Solyc12g098840.1 1,281 138.6 6.38 34.90 101.88 Semi-molecular transporter SLABCB17 Solyc12g098870.1 1,313 142.72 6.76 37.95 100.58 Whole-molecular transporter SLABCB18 Solyc11g067300.1 1,261 138.47 7.50 32.90 102.02 Whole-molecular transporter SLABCB19 Solyc05g013890.1 955 105.16 9.10 43.42 96.12 Whole-molecular transporter SLABCB20 Solyc03g026310.2 664 67.51 8.94 41.69 102.73 Whole-molecular transporter SLABCB21 Solyc03g114950.2 639 68.34 8.45 36.24 104.42 Semi-molecular transporter SLABCB22 Solyc03g122050.1 673 74.69 7.34 34.75 80.97 Semi-molecular transporter SLABCB23 Solyc03g122070.1 667 73.02 9.45 38.67 101.94 Whole-molecular transporter SLABCB24 Solyc09g009910.2 640 71.08 9.14 34.76 113.40 Whole-molecular transporter SLABCB25 Solyc09g055350.2 726 80.37 9.40 28.52 98.52 Semi-molecular transporter SLABCB26 Solyc00g304030.1 1,081 111.53 9.24 44.24 87.73 Whole-molecular transporter SLABCB27 Solyc12g049120.1 349 38.62 9.03 41.41 103.68 Quarter-molecular transporter SLABCB28 Solyc12g049130.1 108 11.8 8.79 35.36 101.12 Quarter-molecular transporter SLABCB29 Solyc12g070280.1 232 25.82 8.63 29.5 113.55 Quarter-molecular transporter Table 2.
Characterization of SlABCBs protein in tomato
-
Motif number Motif sequence Motif 1 AAKLANAHNFISGLPQGYETQVGERGVQLSGGQKQRIAIARAILKNPKILLLDEATSALDAESERIVQEALDR Motif 2 EIELKBVYFSYPSRPDVQILNGFSLKIPSGKTVALVGGSGSGKSTVISLJERFYDPQSGZVLJDGVBJKELQLKW Motif 3 MVGERGTQLSGGQKQRIAIARAILKBPRILLLDEATSALDAESERIVQEALDRIMINRTTVIVAH Motif 4 TVALVGESGSGKSTVISLJZRFYDPDSGEIYJDGIDIRKFNLKWLRQQMGLVSQEPVLFNDTIRENIAYGKEGAAEEE Motif 5 AGEKLIRRIRSMMFEKVLRMEIGWFDEEENSSGAJGARLSTDAATVRSLVGDRLALJVQBLATAIVALVIAFIASWRLALVMJAVQPL Motif 6 MVNRTTVVVAHRLSTIKGADVIAVIKBGVIVEKGTHDTLLN Motif 7 JRQQIGLVSQEPVLFATTIKENIAYGKEDATEEEIKEAIKLANAAKFIDKLPZGLDT Motif 8 KVSLKFVYLAIGVGVASFLZVACWTVTGERQASRIRCLYLKSVLRQDIGFFDTZTNT Motif 9 GMTLDVIKGBIEFKHVSFAYPTRPDVQILKDLSLTIPAGK Motif 10 AYEEASQIANEAVGNIRTVASFSAEEKVLELYK Table 3.
The sequences of conserved protein motifs in the ABCB gene family of the tomato genome.
Figures
(8)
Tables
(3)