-
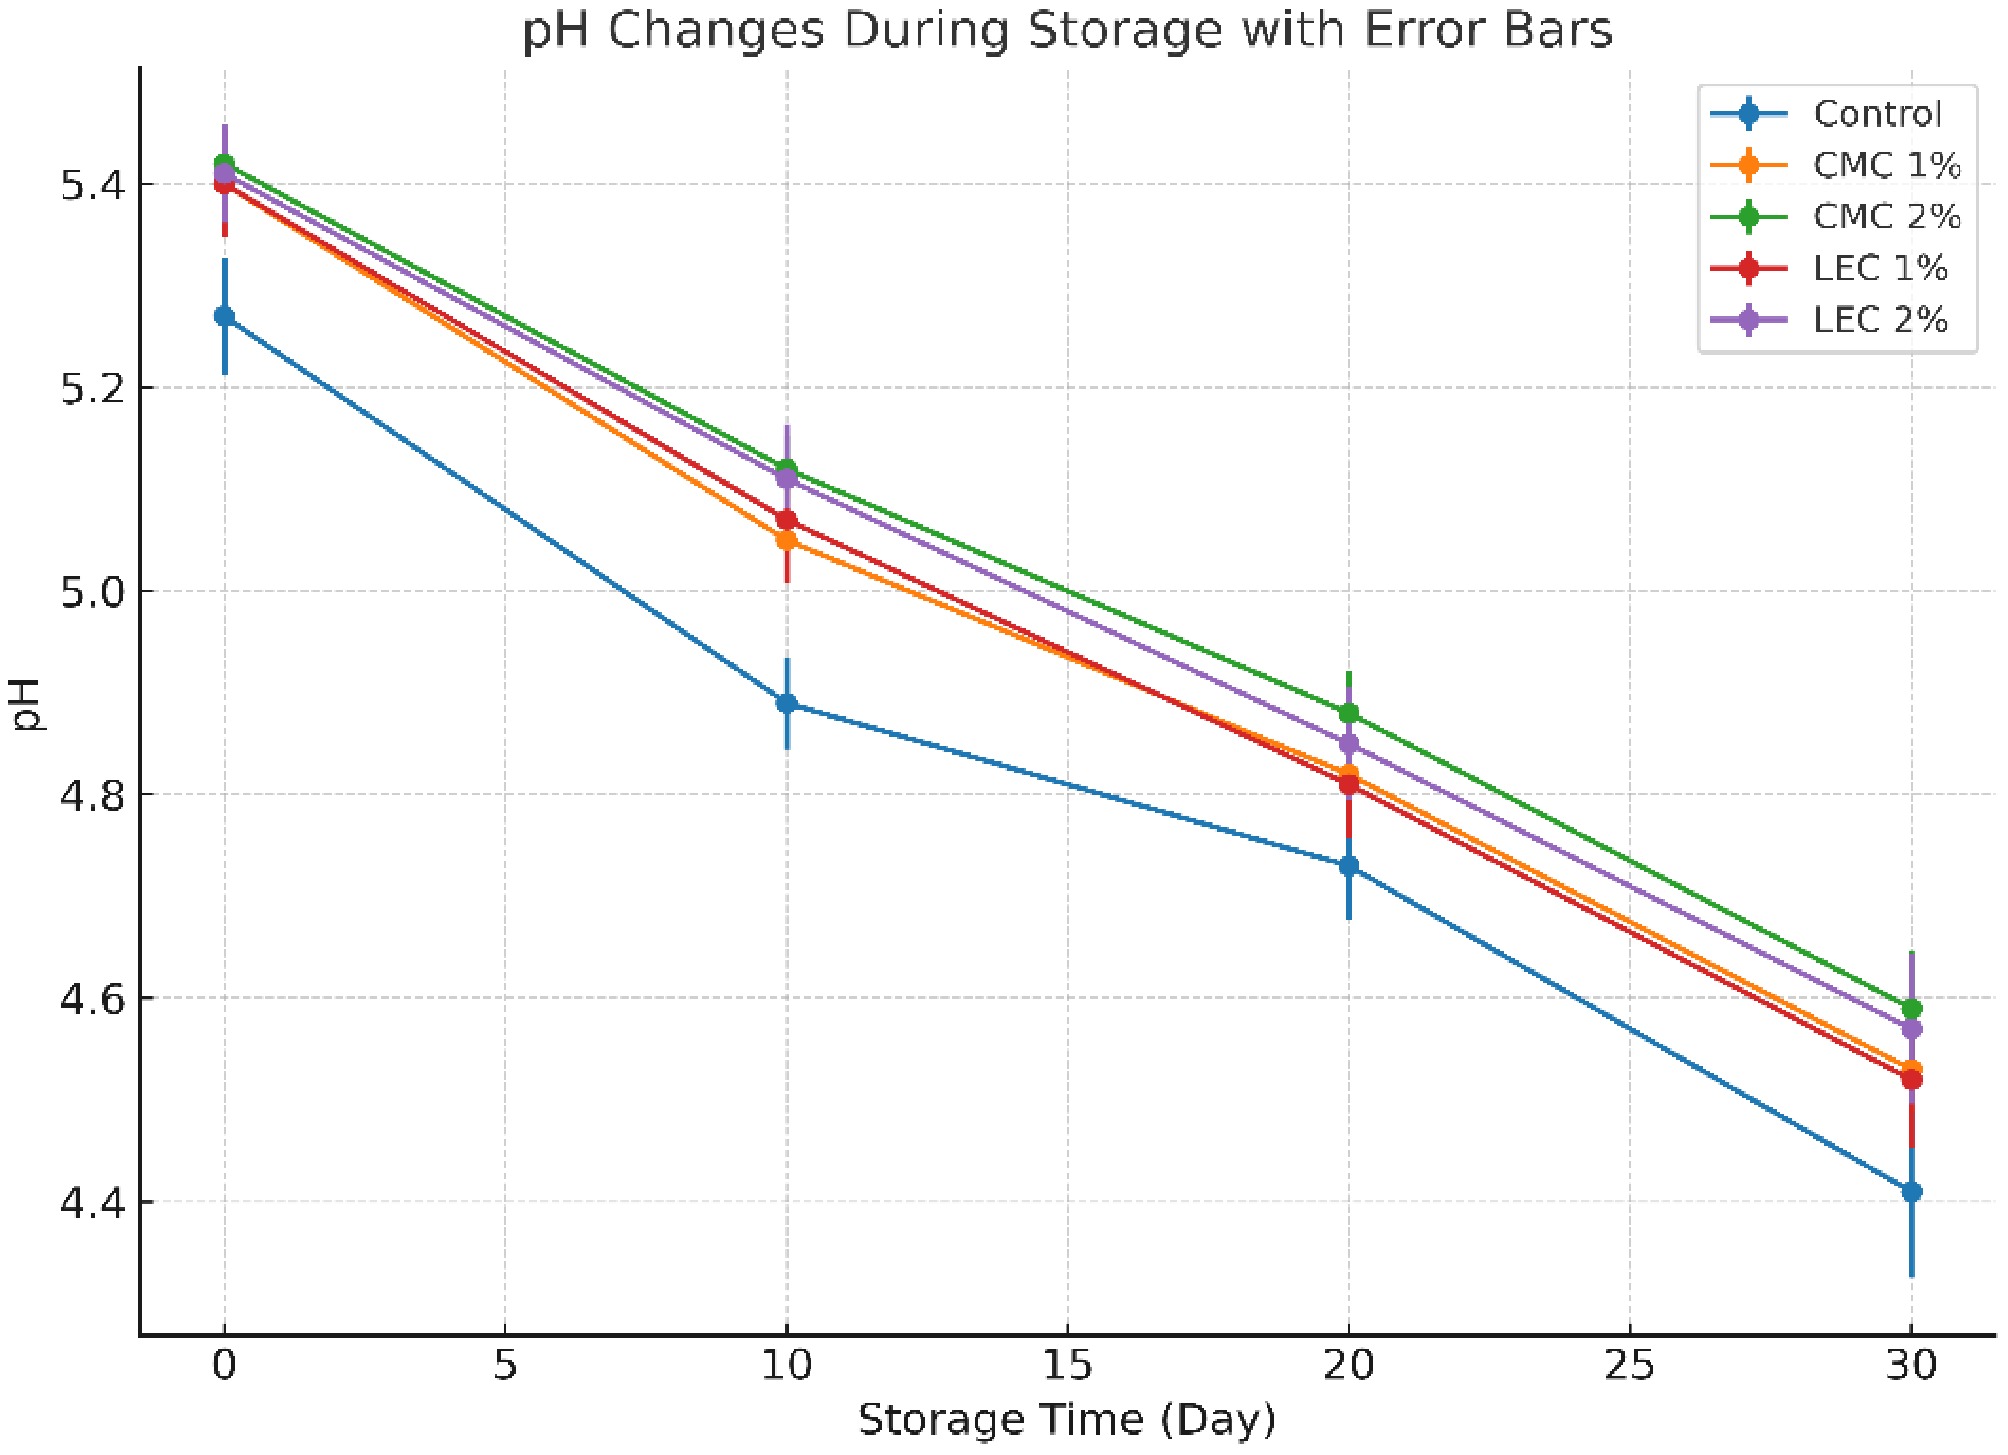
Figure 1.
Change in pH value of IMC samples during the storage period.
-
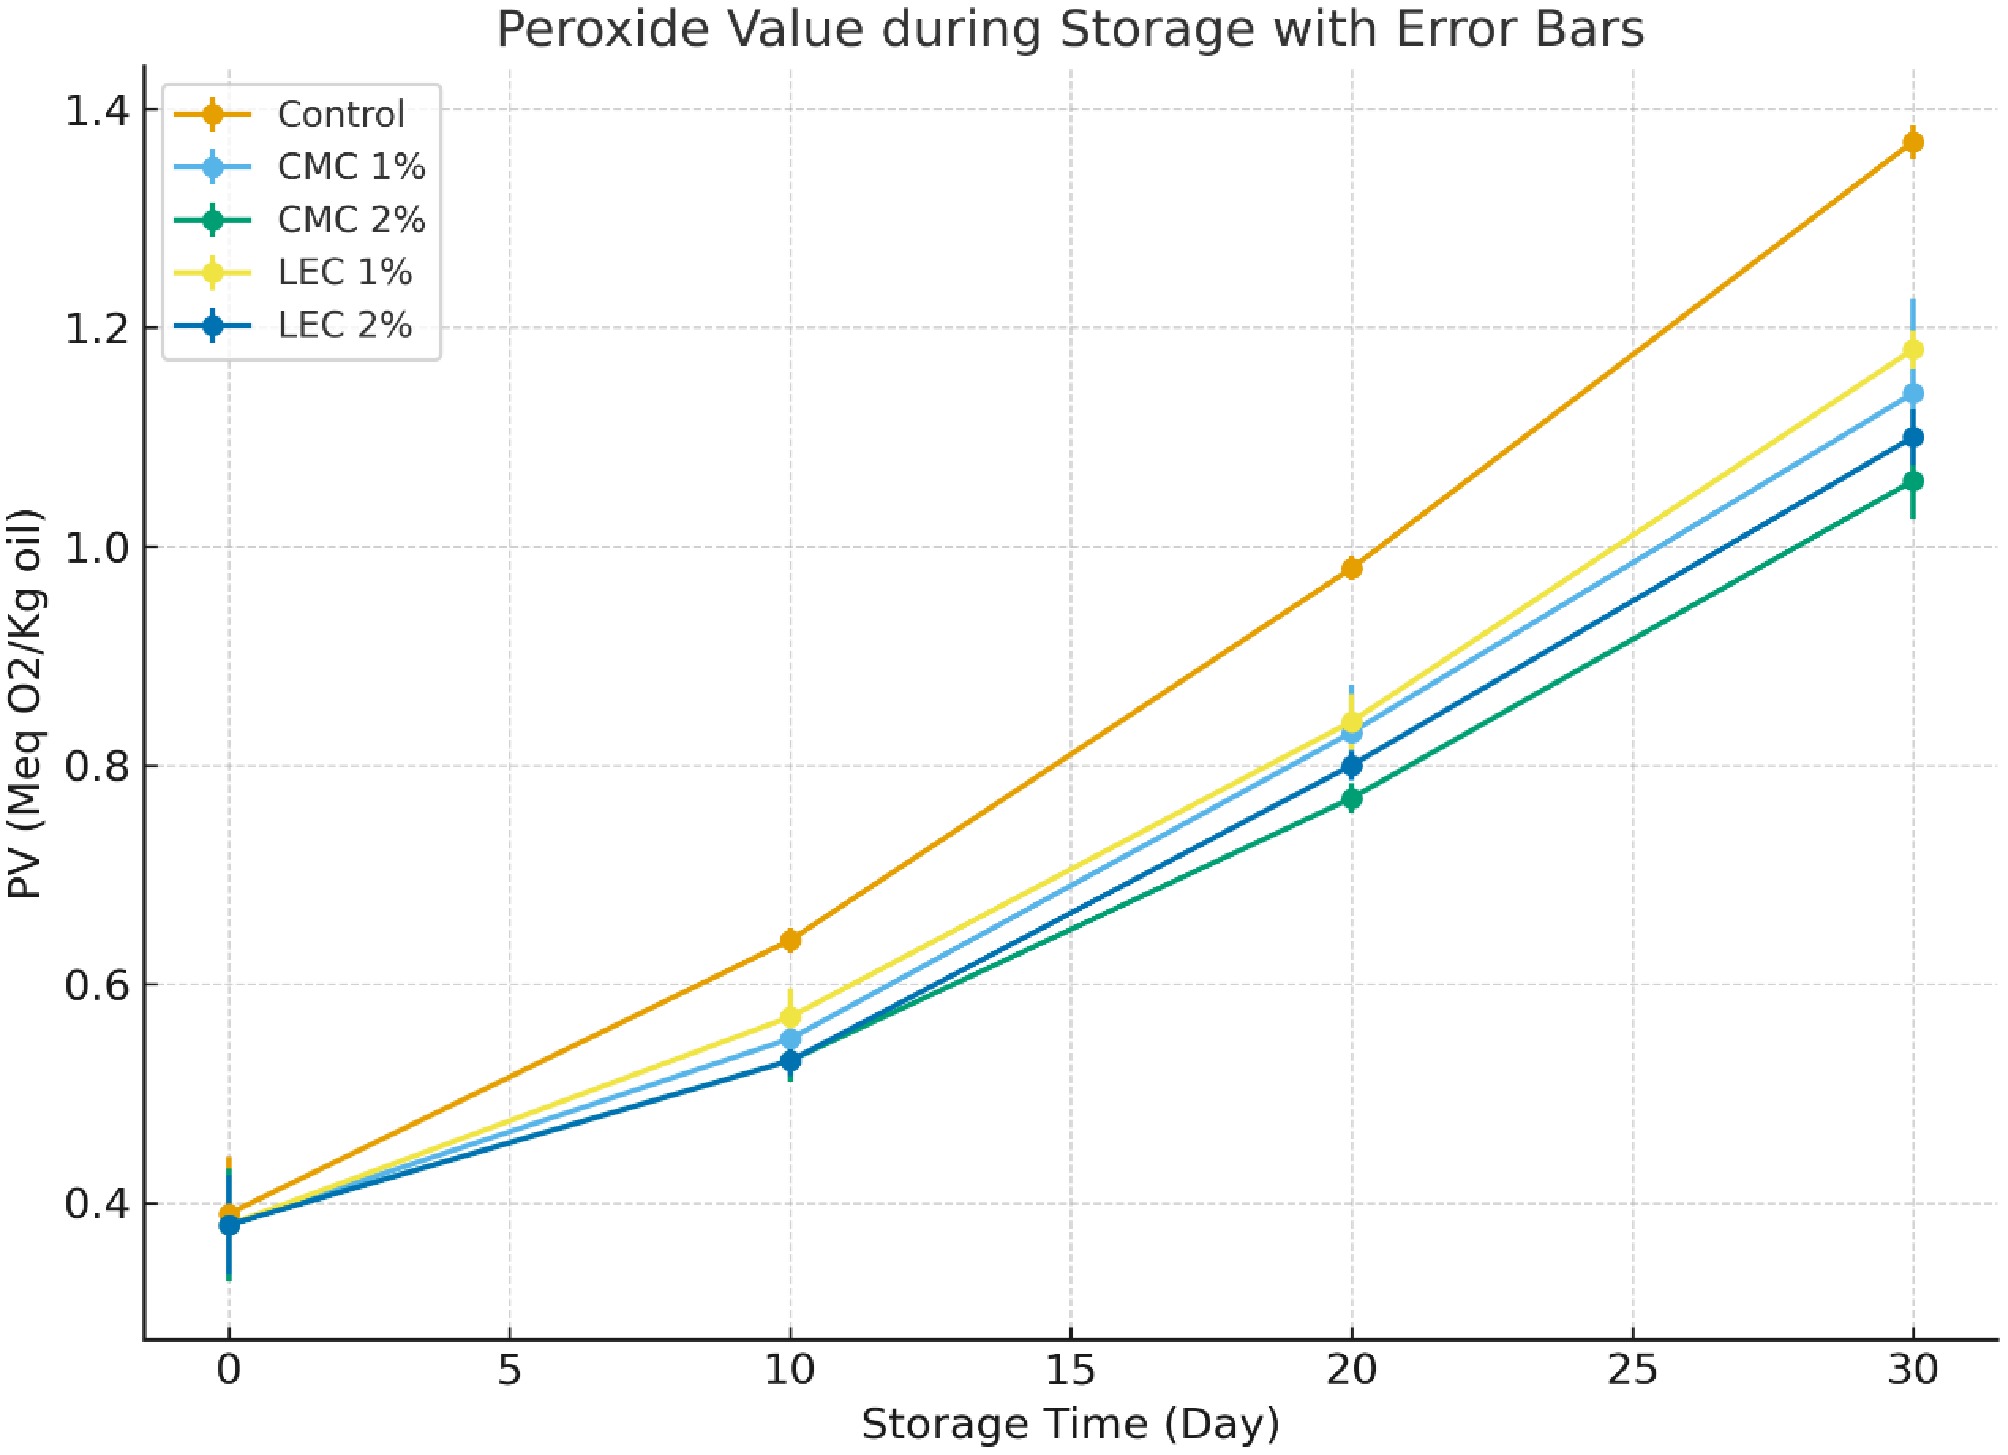
Figure 2.
Peroxide in IMC samples (Meq.O2/ kg oil) during the storage period.
-
Product Concentration Main constituent Ref. Low-fat Domiati cheese 0%−1% CMC [11] Cheese 8%−25% Modified starch [42] Tofu 1%−2% Chia seed [43] Symbiotic Cheddar cheese analog 0−4% Inulin [44] Cheddar cheese analog 0−2% Canola oil [45] Cheese 10%−20% Maltodextrin [46] Processed cheese analog 25%−100% Lupine [14] Tofu 10%−50% Buffalo milk [47] Processed cheese analog 0%−50% Vegetable fat [48] Plant-based cheese analogs Ratios of 1:3, 1:3.5, 1:4, 1:4.5, and 1:5 (w/w) Boiled peas and water [49] Probiotic soy-based product − Mixed product with milk cream and soy [50] Soy cream cheese Hard tofu with 5% of palm oil (w/w) Tofu, palm oil [51] Wheyless feta cheese Levels of 12:0, 10:2, 9:3, 8:4, 7:5, and 6:6 w/v dry basis MPC and SPI [52] MPC: milk protein concentrate, SPI: soy protein isolate. Table 1.
Examples of research on IMC formulations.
-
Type 1th day 10th day 20th day 30th day Control 60.43 ± 0.03c 60. 22 ± 0.024c 59. 87 ± 0.016c 59. 35 ± 0.029c CMC 1% 63.66 ± 0.01b 63.49 ± 0.017b 63.15 ± 0.029b 62.69 ± 0.052b CMC 2% 71.70 ± 0.03a 71.65 ± 0.040a 71.12 ± 0.034a 70.77 ± 0.023a LEC 1% 63.48 ± 0.011b 63.32 ± 0.026b 62.99 ± 0.035b 61.58 ± 0.017b LEC 2% 71.54 ± 0.056a 71.38 ± 0.013a 71.08 ± 0.017a 70.69 ± 0.084a Values are given as the mean and standard deviation (n = 3). Different letters in the same column indicate significant differences between data (p < 0.05). Table 2.
Moisture content (%DW basis) of IMC samples during the storage period.
-
Type 1th day 10th day 20th day 30th day Control 1.67 ± 0.025a 3.45 ± 0.023a 4.89 ± 0.064a 6.75 ± 0.081a CMC 1% 1.61 ± 0.015b 3.21 ± 0.020b 4.37 ± 0.029b 6.22 ± 0.036b CMC 2% 1.60 ± 0.029b 3.07 ± 0.040c 4.11 ± 0.033c 6.07 ± 0.040c LEC 1% 1.61 ± 0.035b 3.19 ± 0.031b 4.34 ± 0.063b 6.25 ± 0.018b LEC 2% 1.60 ± 0.019b 3.02 ± 0.052c 4.13 ± 0.045c 5.10 ± 0.033d Values are given as the mean and standard deviation (n = 3). Different letters in the same column indicate significant differences between data (p < 0.05). Table 3.
Total count of IMC samples (log CFU/g) during the storage period.
-
Type Springiness (mm) Gumminess Cohesiveness Hardness (N) Control 2.38 ± 0.021c 8.46 ± 0.044c 4.96 ± 0.07c 11.64 ± 0.052c CMC 1% 4.65 ± 0.013b 9.31 ± 0.051b 6.69 ± 0.06b 16.87 ± 0.042b CMC 2% 6.75 ± 0.024a 11.70 ± 0.059a 8.09 ± 0.042a 22.15 ± 0.041a LEC 1% 4.68 ± 0.012b 9.22 ± 0.063b 6.75 ± 0.06b 16.79 ± 0.054b LEC 2% 6.59 ± 0.072a 11.34 ± 0.068a 7.96 ± 0.013a 21.86 ± 0.057a Values are given as the mean and standard deviation (n = 3). Different letters in the same column indicate significant differences between data (p < 0.05). Table 4.
Textural properties of different IMC samples during the storage period.
-
Composition Rice milk Chia seed Hazelnut oil IMC Dietary fiber (g/100 g) 0.74 ± 0.02c 32.59 ± 0.26a − 5.64 ± 0.13b Protein
(g/100 g)2.4 ± 0.07c 16.58 ± 0.31a − 5.37± 0.11b carbohydrate (g/100 g) 18.40 ± 0.34c 45.71± 1.15a − 21.58± 0.98b Energy (kcal) 56.72 ± 1.6d 473.82 ± 11.3c 820.34 ± 14.8a 176.69 ± 6.7b fat (g/100 g) 0.60 ± 0.14d 30.98 ± 1.12b 92.35 ± 1.87a 14.34 ± 0.89c Sodium (mg/100 g) 39.23± 0.84d 16.57± 0.73c − 30.82± 1.24b Potassium (mg/100 g) 65.48± 1.13c 407.22± 2.35a − 121.56 ± 0.98b Calcium (mg/100 g) 118.55± 1.07c 631.17 ± 2.37a − 199.04 ± 1.15b Iron
(mg /100g)0.35± 0.03a 7.72 ± 0.43a − 1.54± 0.18b Magnesium (mg /100g) 11.46 ± 0.74c 335.11± 2.12a − 67.54 ± 1.14b Manganese (mg/100 g) 0.27± 0.02c 2.77 ± 0.04a − 0.84 ± 0.035b Zn (mg/100 g) 0.19 ± 0.01c 4.67 ± 0.35a − 1.75± 0.13b Values are given as the mean and standard deviation (n = 3). Different letters in the same row indicate significant differences between data (p < 0.05). Table 5.
Chemical composition and mineral content (mg /100g) of rice milk, chia seeds, and the IMC sample.
-
Concentaration (g/100 g oil) Fatty acid 0.0093 C10:0 0.0103 C11:0 0.0123 C12:0 0.057 C14:0 0.999 C16:0 0.182 C16:1 0.0229 C17:0 0.0119 C17:1 2.04 C18:0 55.7 C18:1 14.8 C18:2 21.16 C18:3 0.050 C20:0 Table 6.
Fatty acids profile of the IMC.
Figures
(2)
Tables
(6)