-
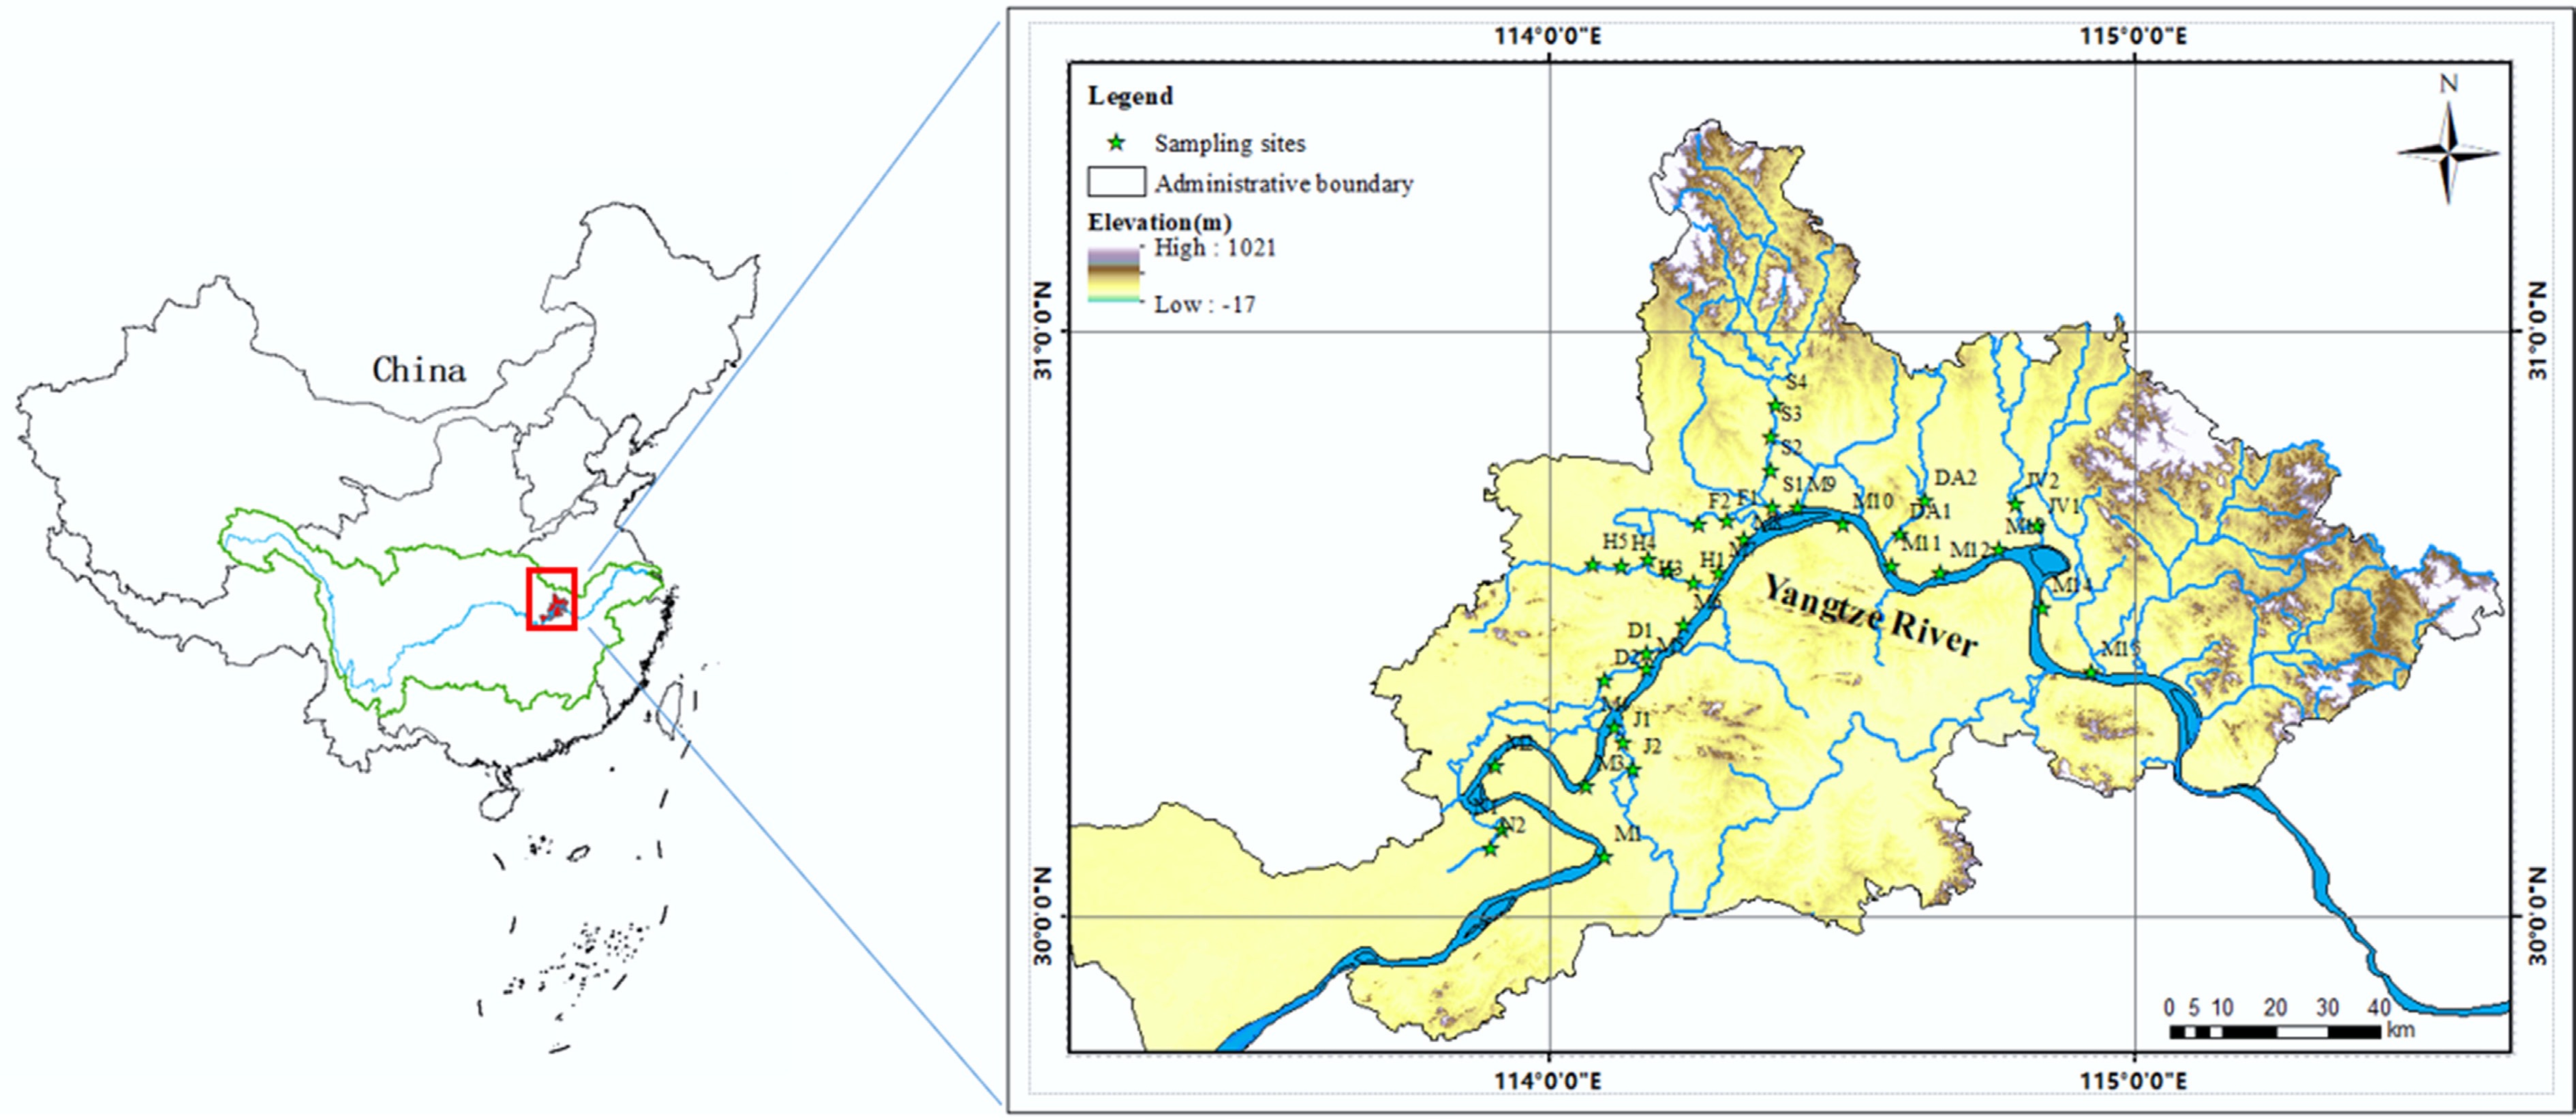
Figure 1.
Distribution of urban river sampling sites in Wuhan.
-
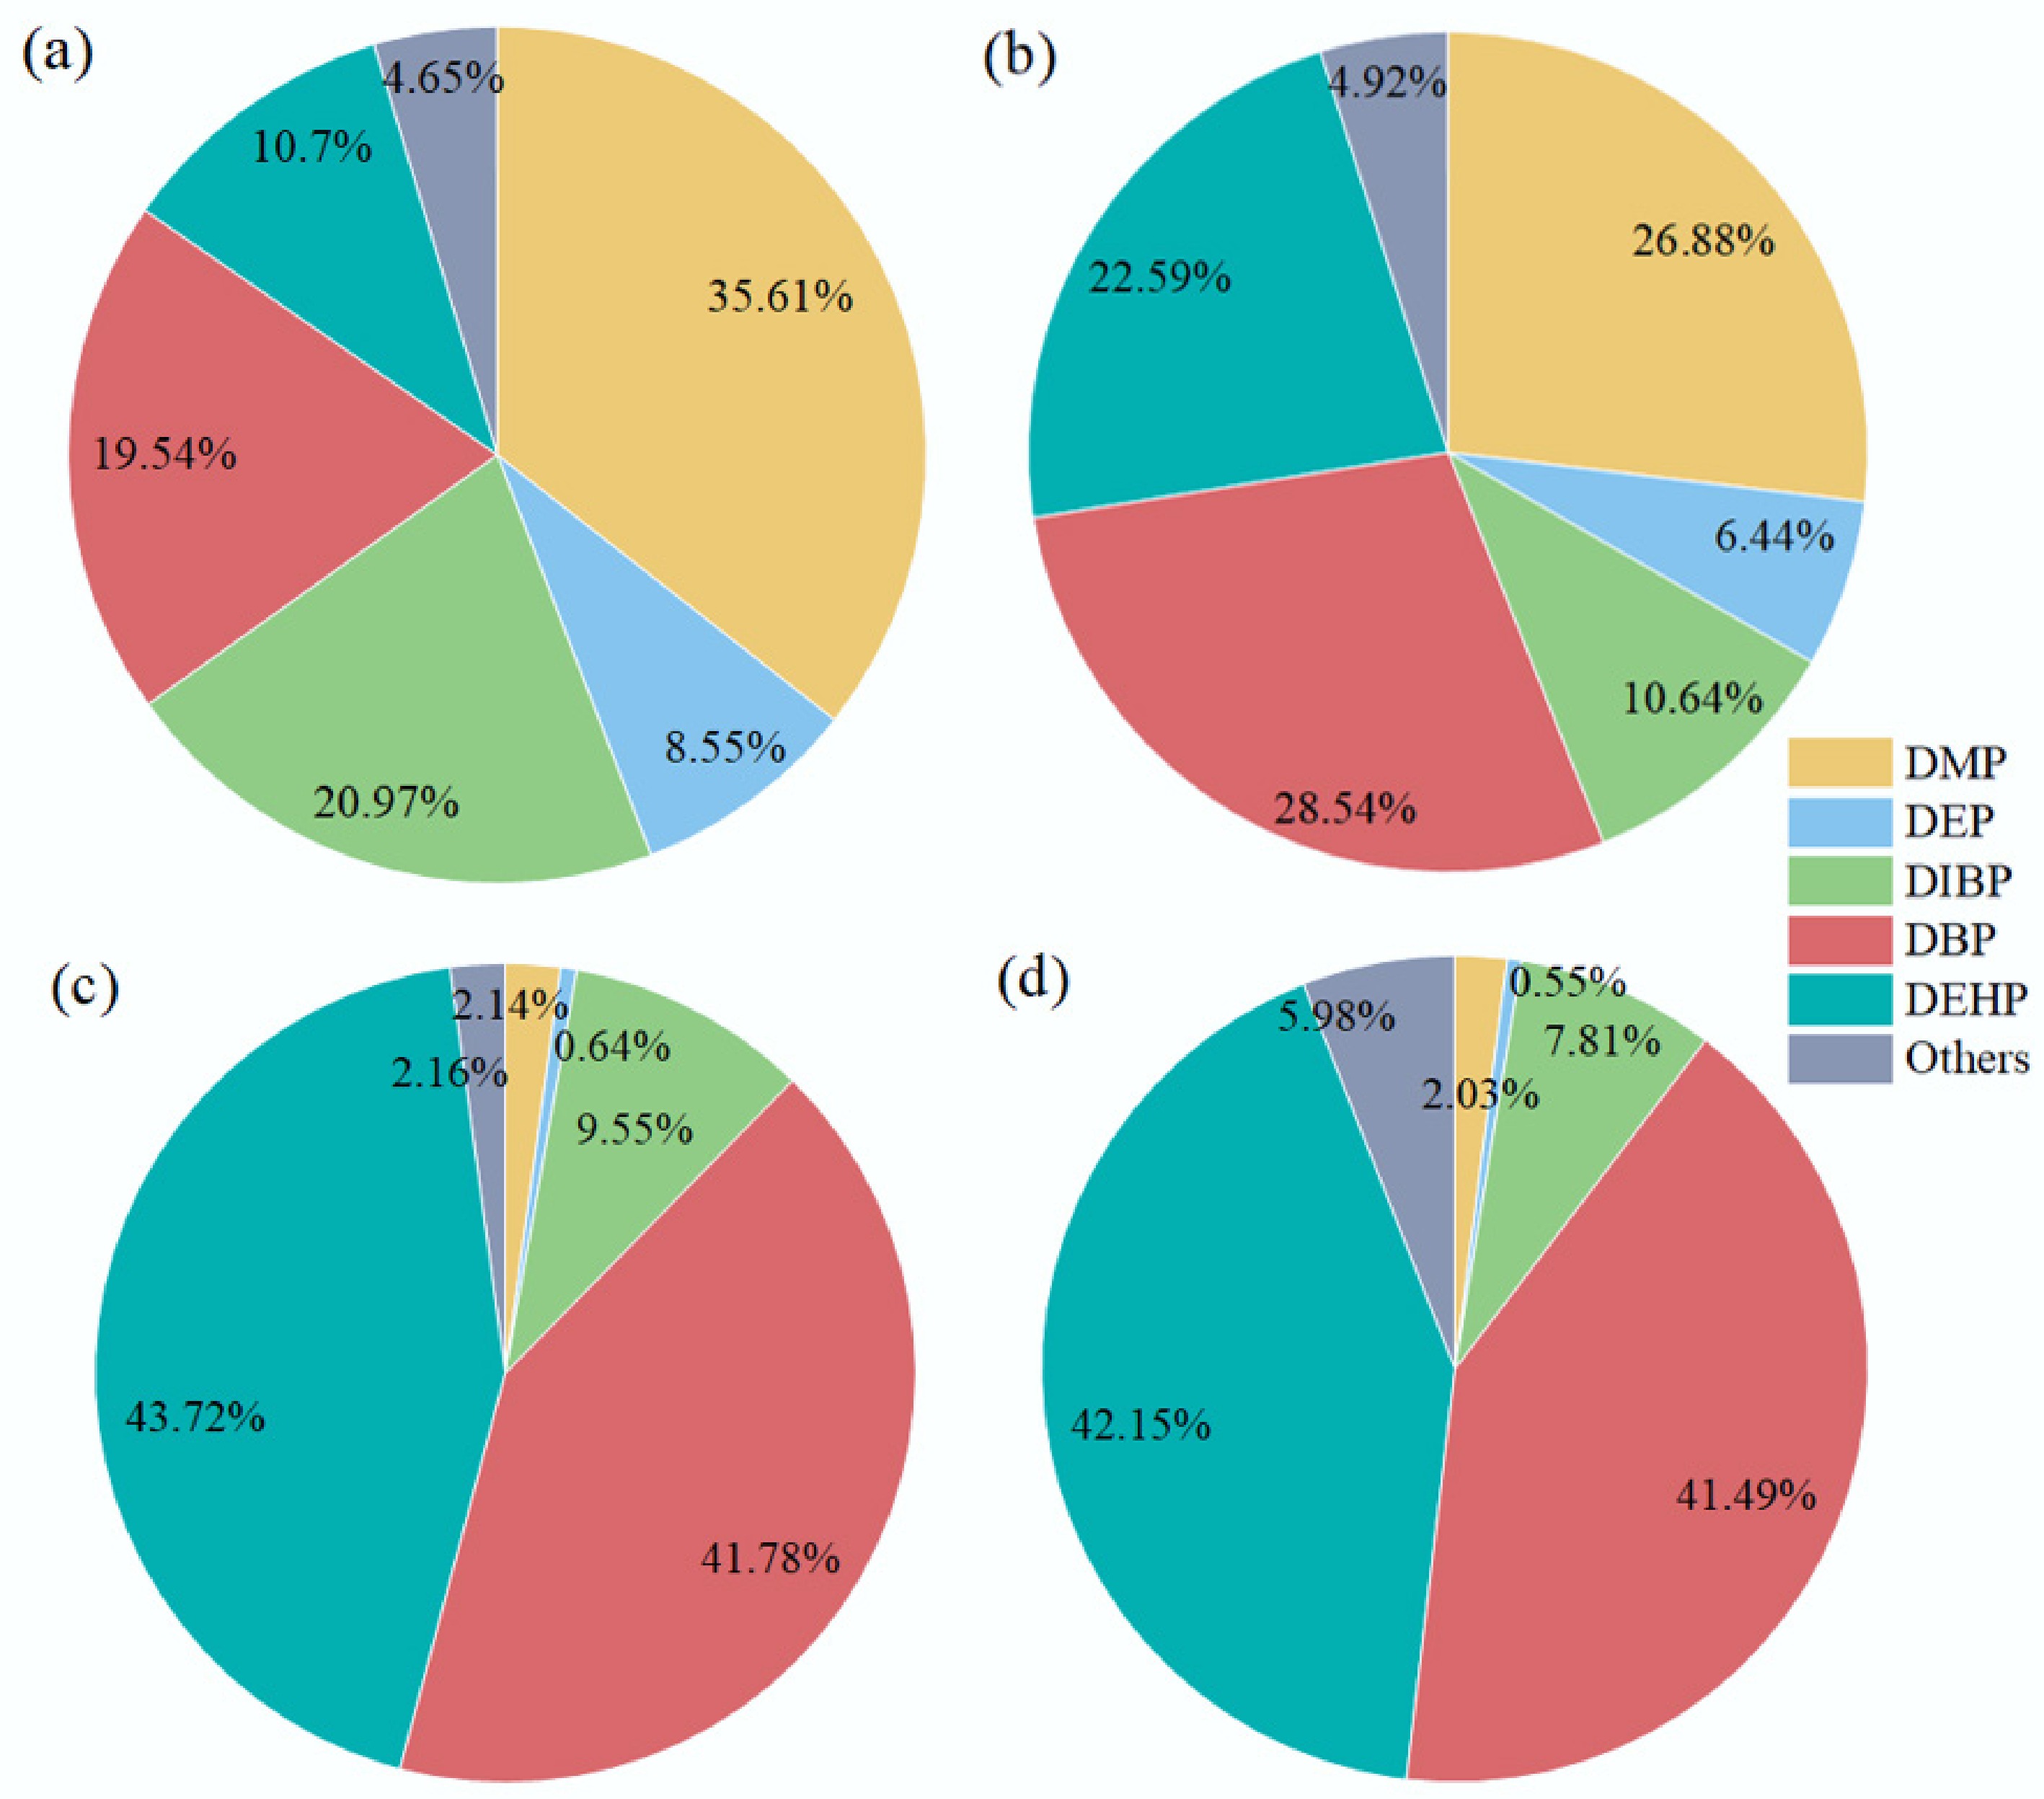
Figure 2.
Compositional characterization of five predominant PAEs and other components in urban rivers. (a) PAEs congeners in water samples during the dry season; (b) PAEs congeners in water samples during the wet season; (c) PAEs congeners in river sediments during the dry season; (d) PAEs congeners in river sediments during the wet season.
-
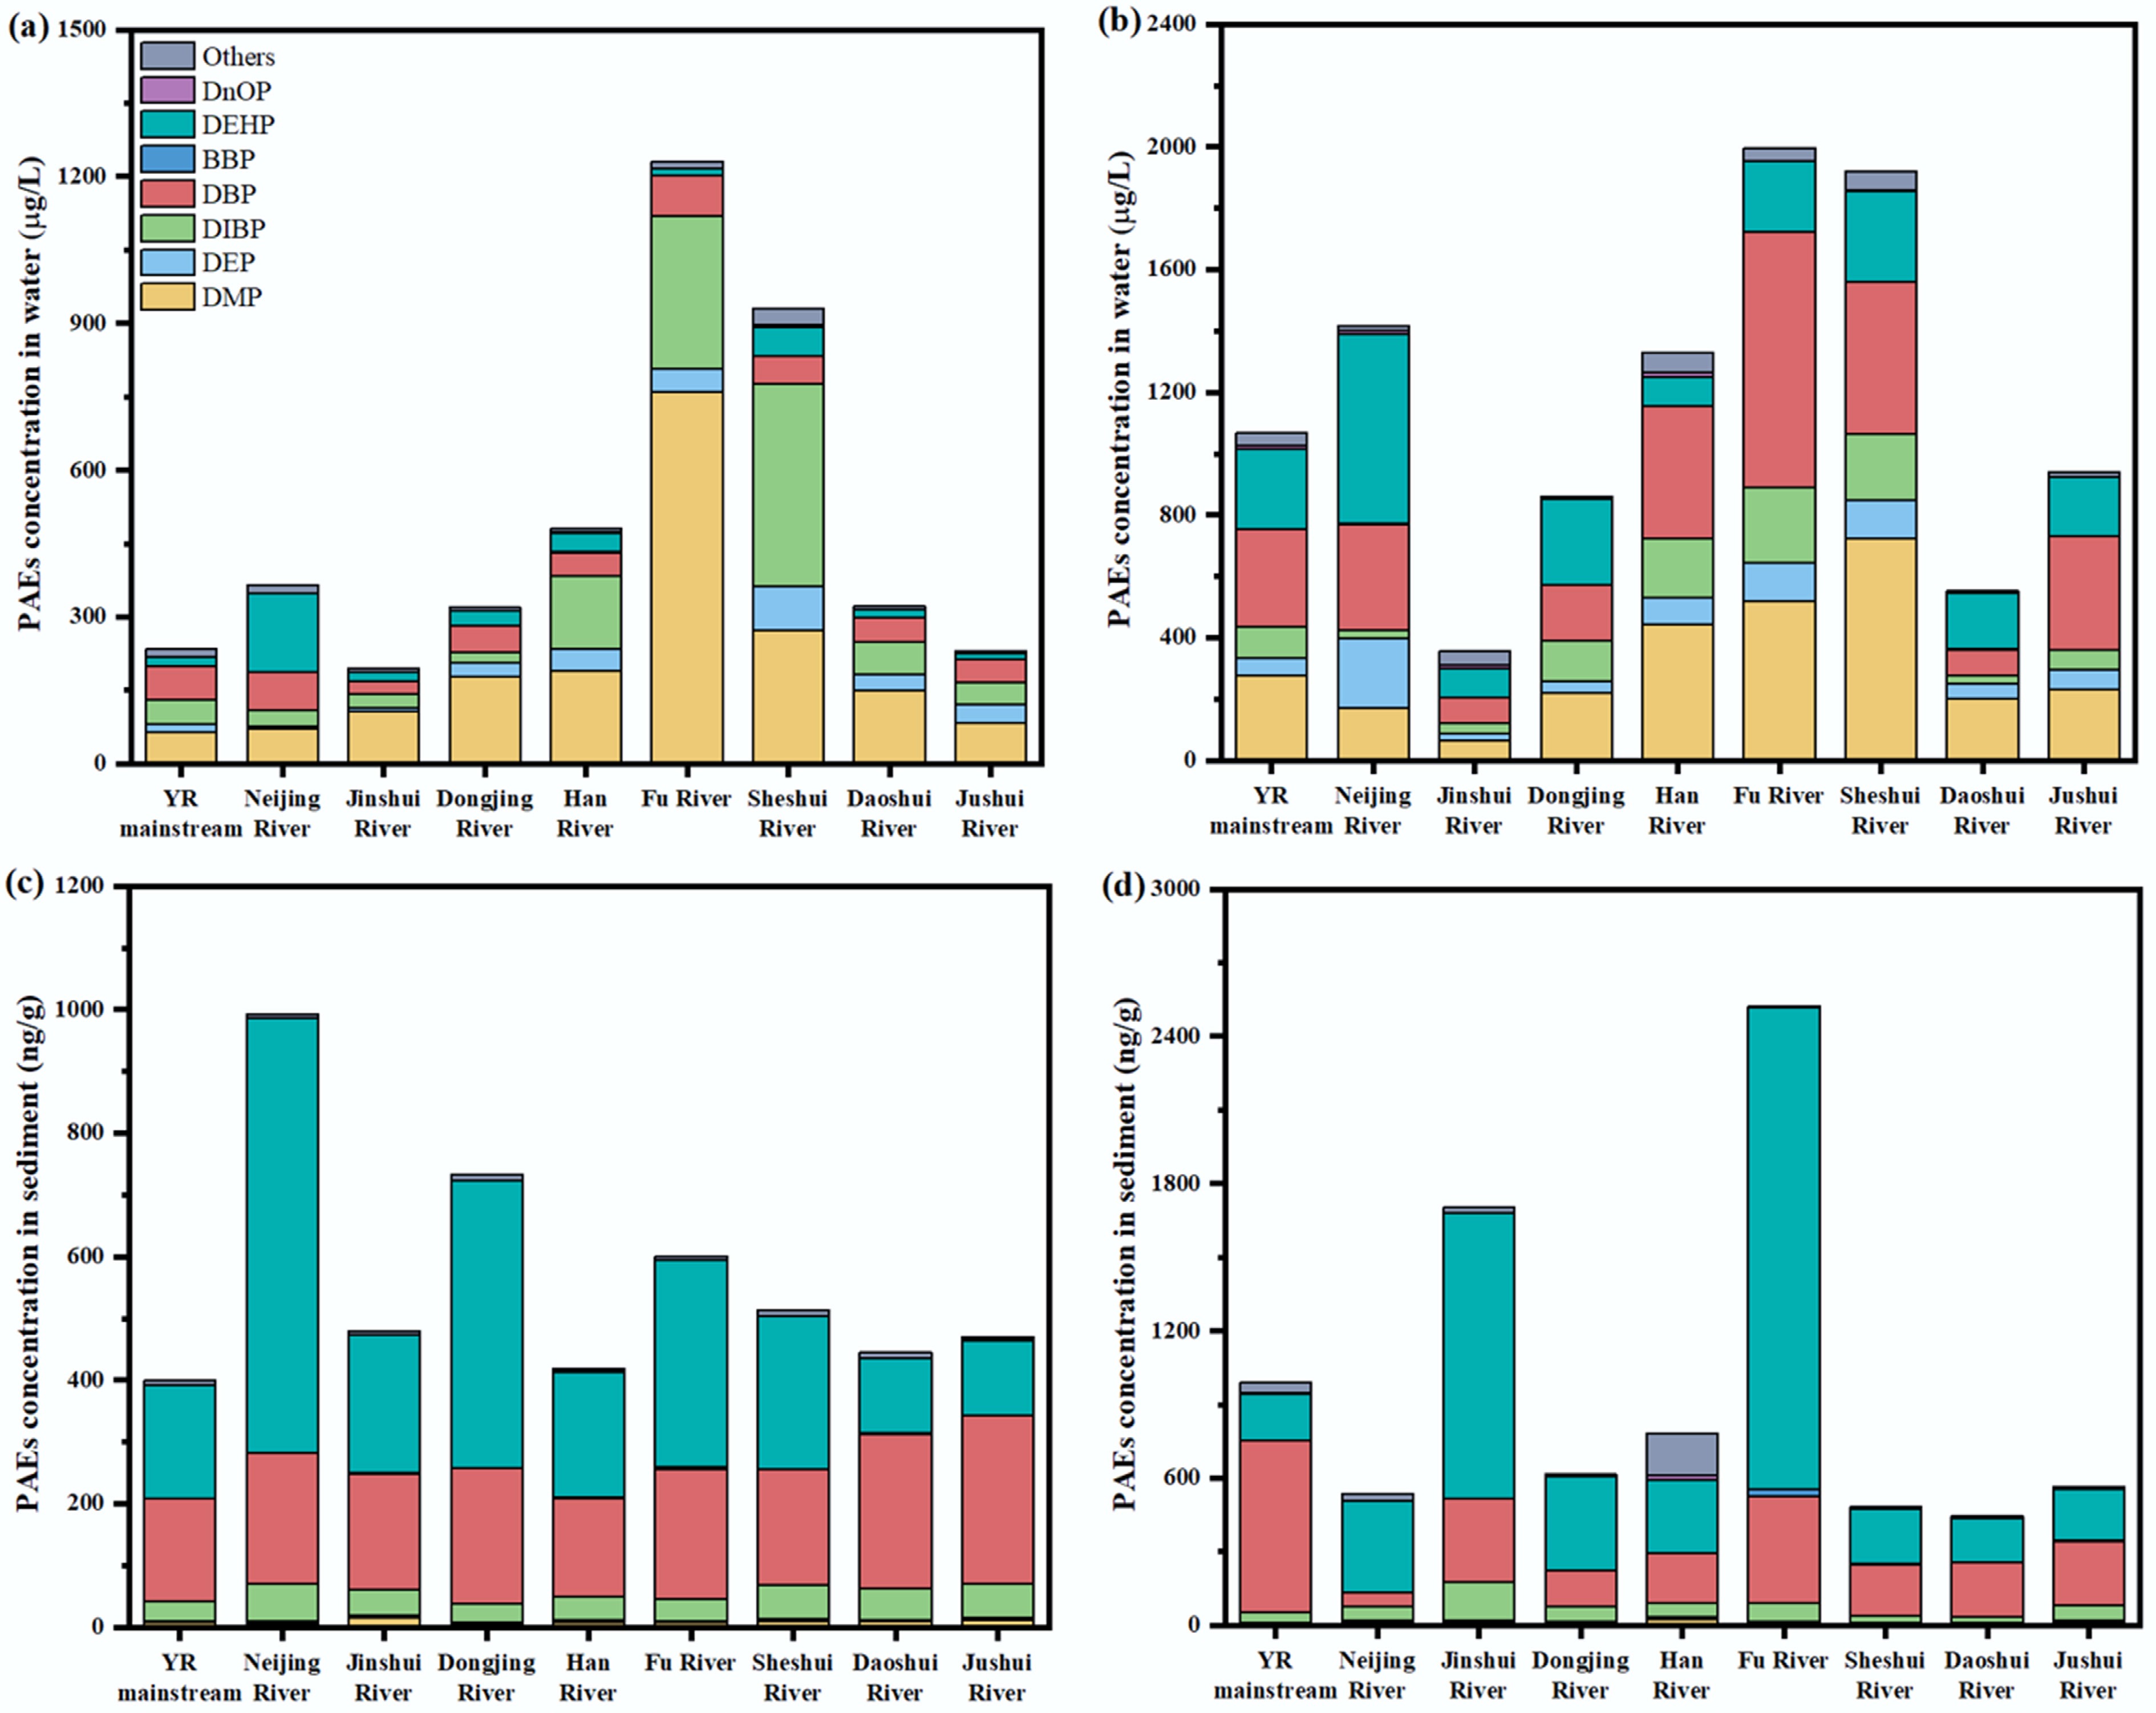
Figure 3.
The mean concentration of PAEs in eight tributaries and the mainstream of the Yangtze River in the Wuhan section. (a) PAEs concentrations in river water during the dry season; (b) PAEs concentrations in river water during the wet season; (c) PAEs concentrations in river sediments during the dry season; (d) PAEs concentrations in river sediments during the wet season.
-
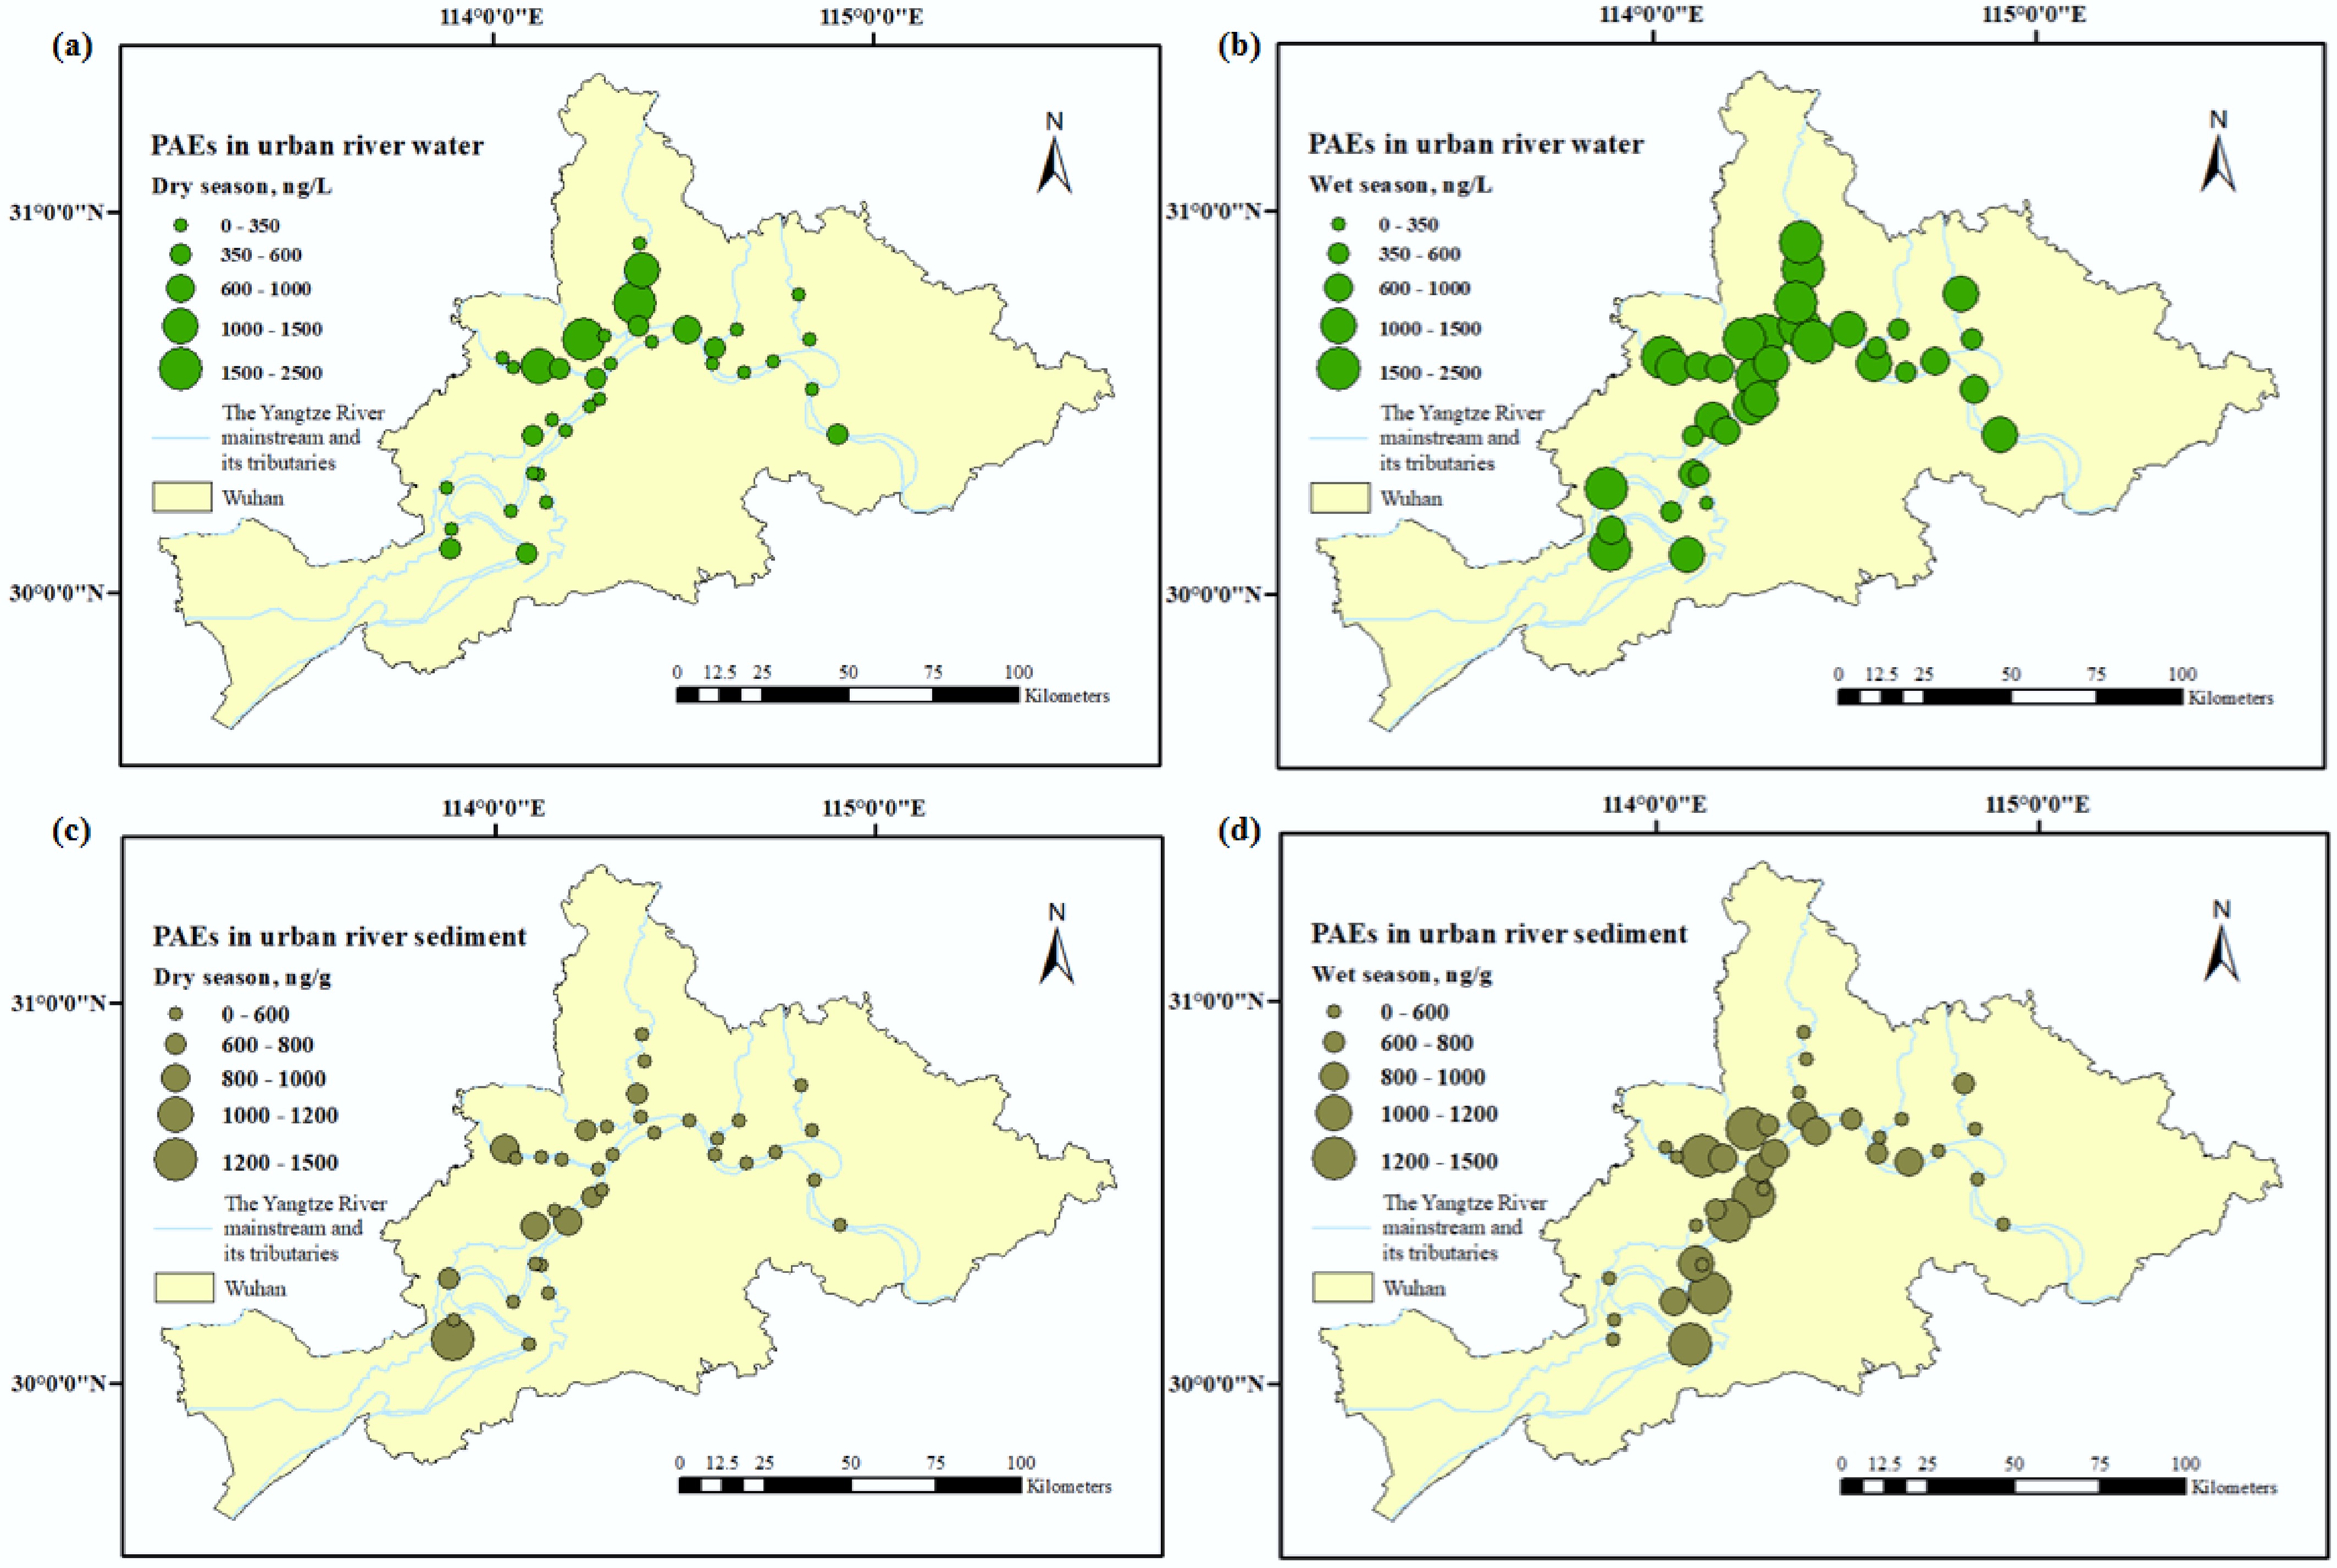
Figure 4.
Spatiotemporal characteristics of PAEs in eight tributaries and the mainstream of the Yangtze River in the Wuhan section. (a) Distribution of PAEs in urban river water during the dry season; (b) Distribution of PAEs in urban river water during the wet season; (c) Distribution of PAEs in urban river sediments during the dry season; (d) Distribution of PAEs in urban river sediments during the wet season.
-
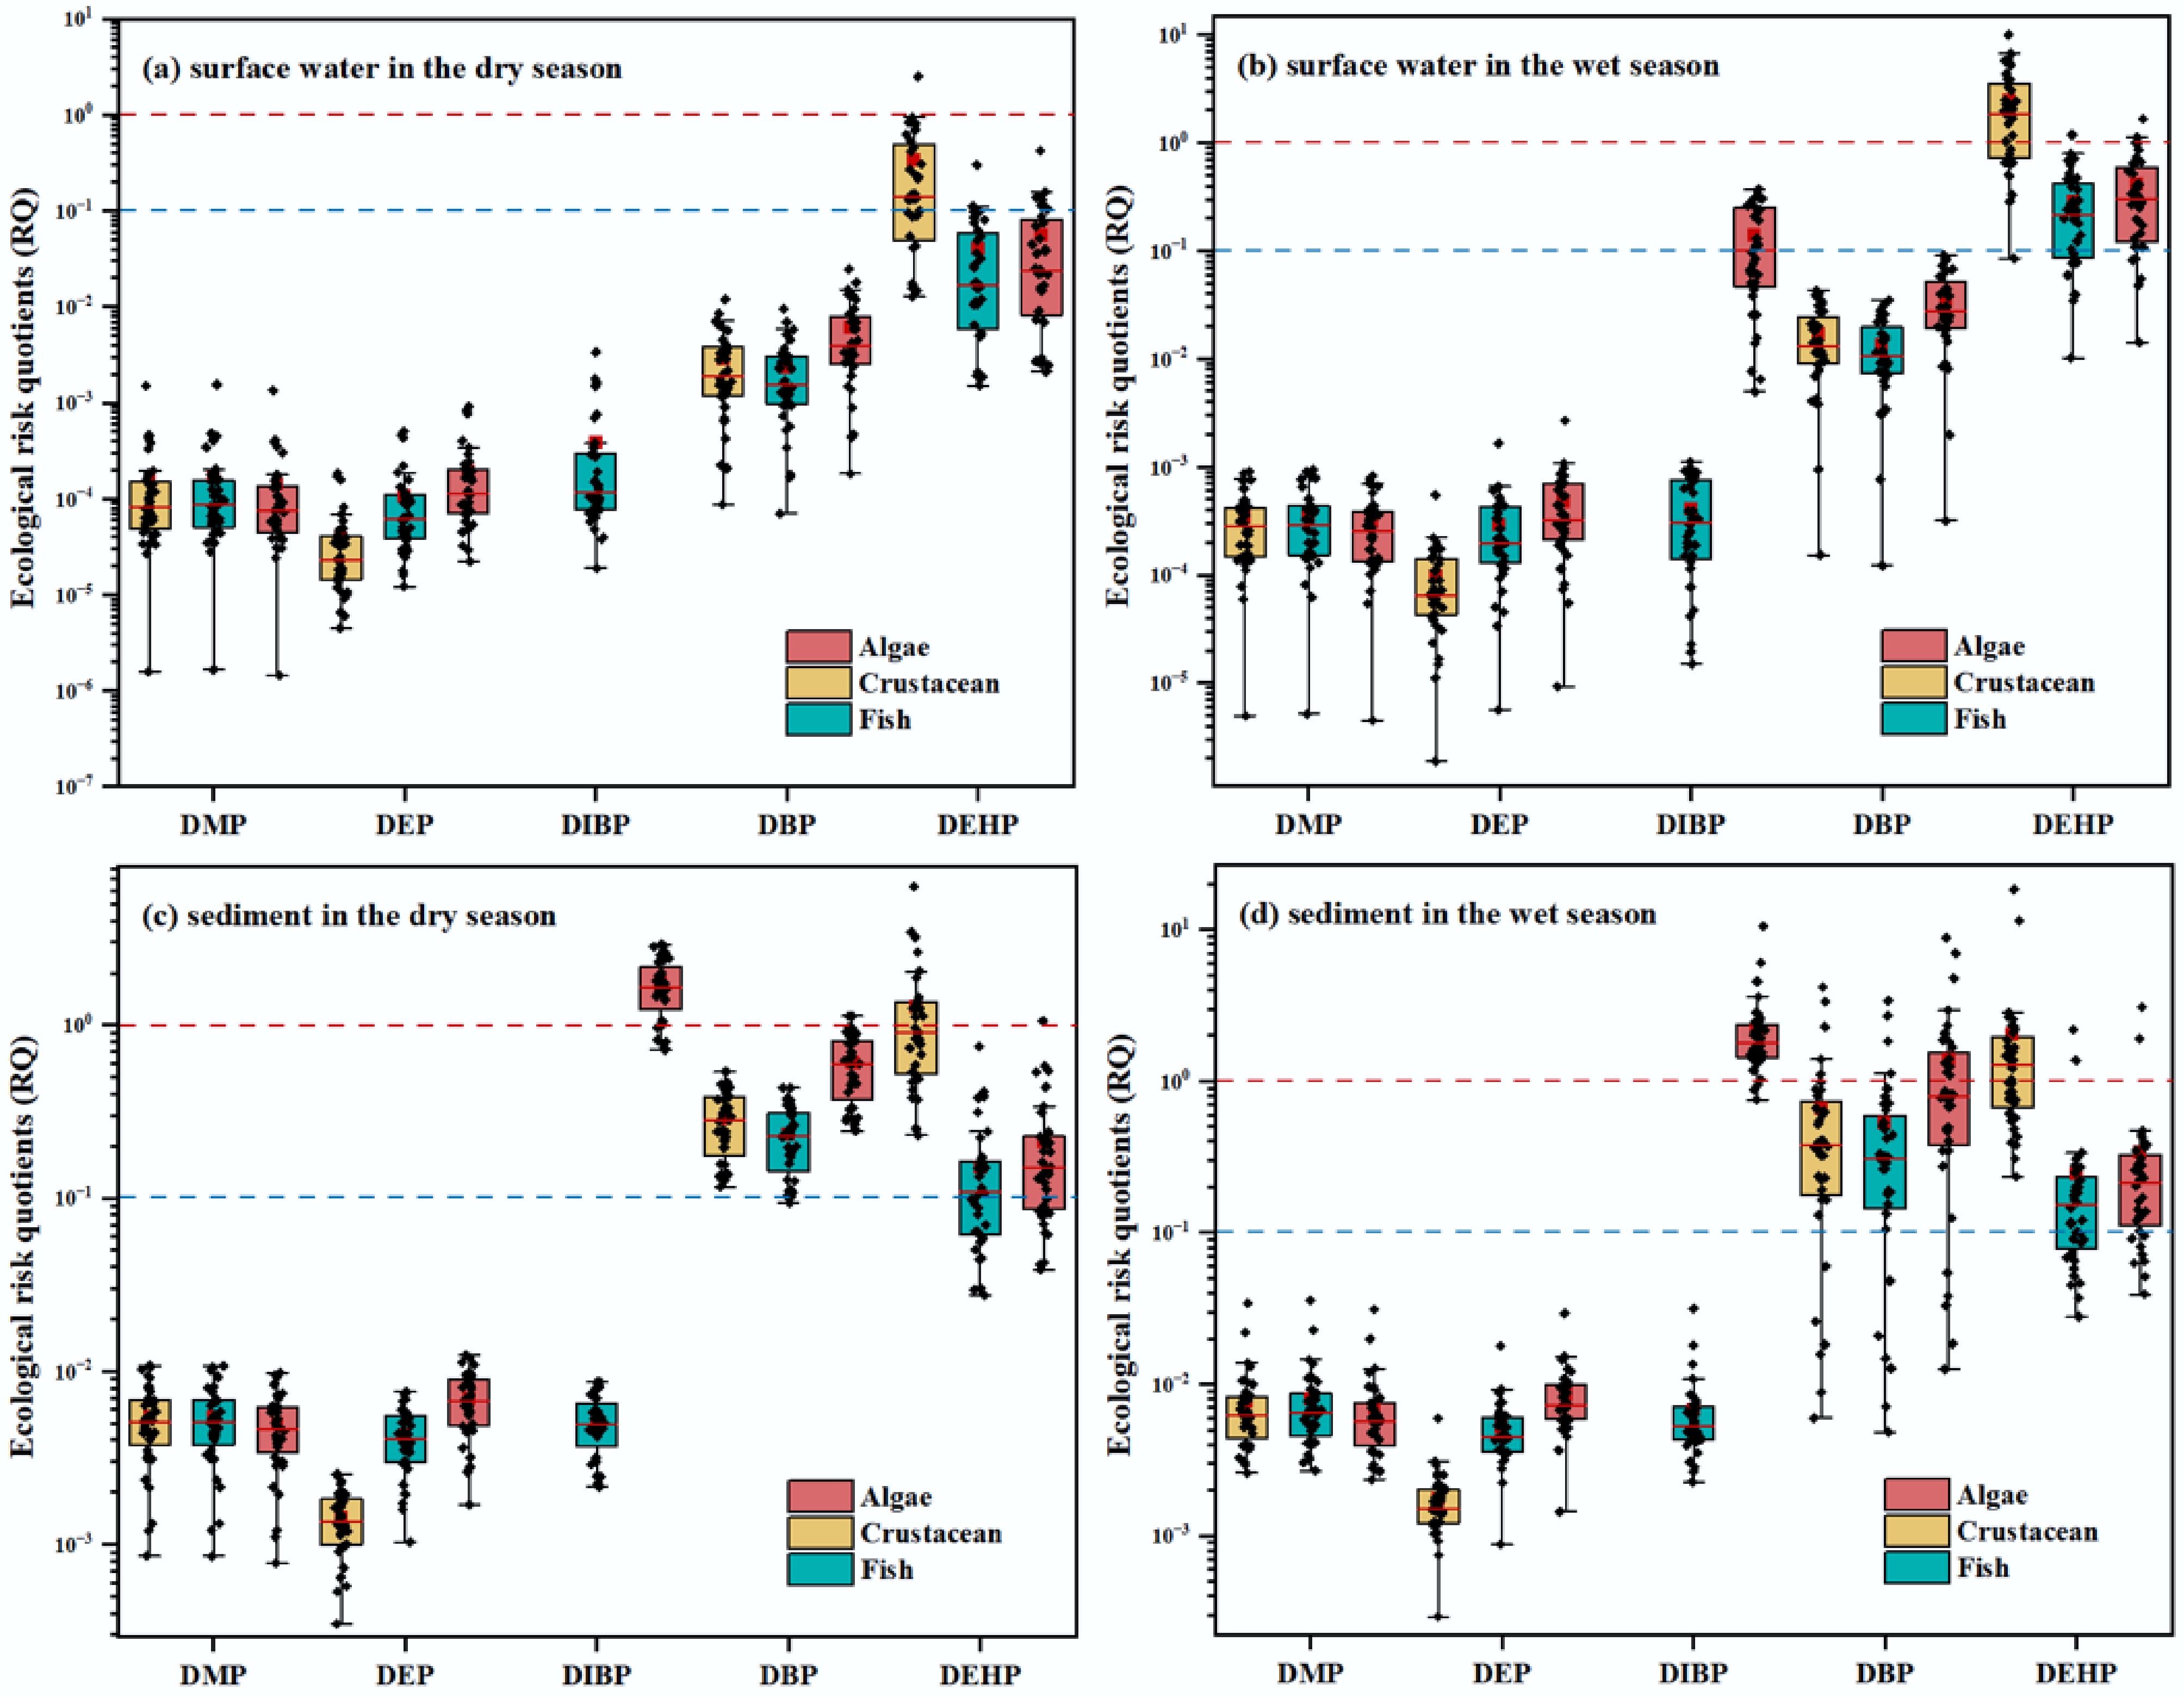
Figure 5.
Ecological risk quotients (RQ) of five predominant PAEs for three indicator species. The blue dashed line represents the threshold values between the low- and moderate-risk potential, while the red one denotes the threshold values between the moderate- and high-risk potential. (a) RQ results of predominant PAEs in river waters during the dry season; (b) RQ results of predominant PAEs in river waters during the wet season; (c) RQ results of predominant PAEs in river sediments during the dry season; (d) RQ results of predominant PAEs in river sediments during the wet season.
-
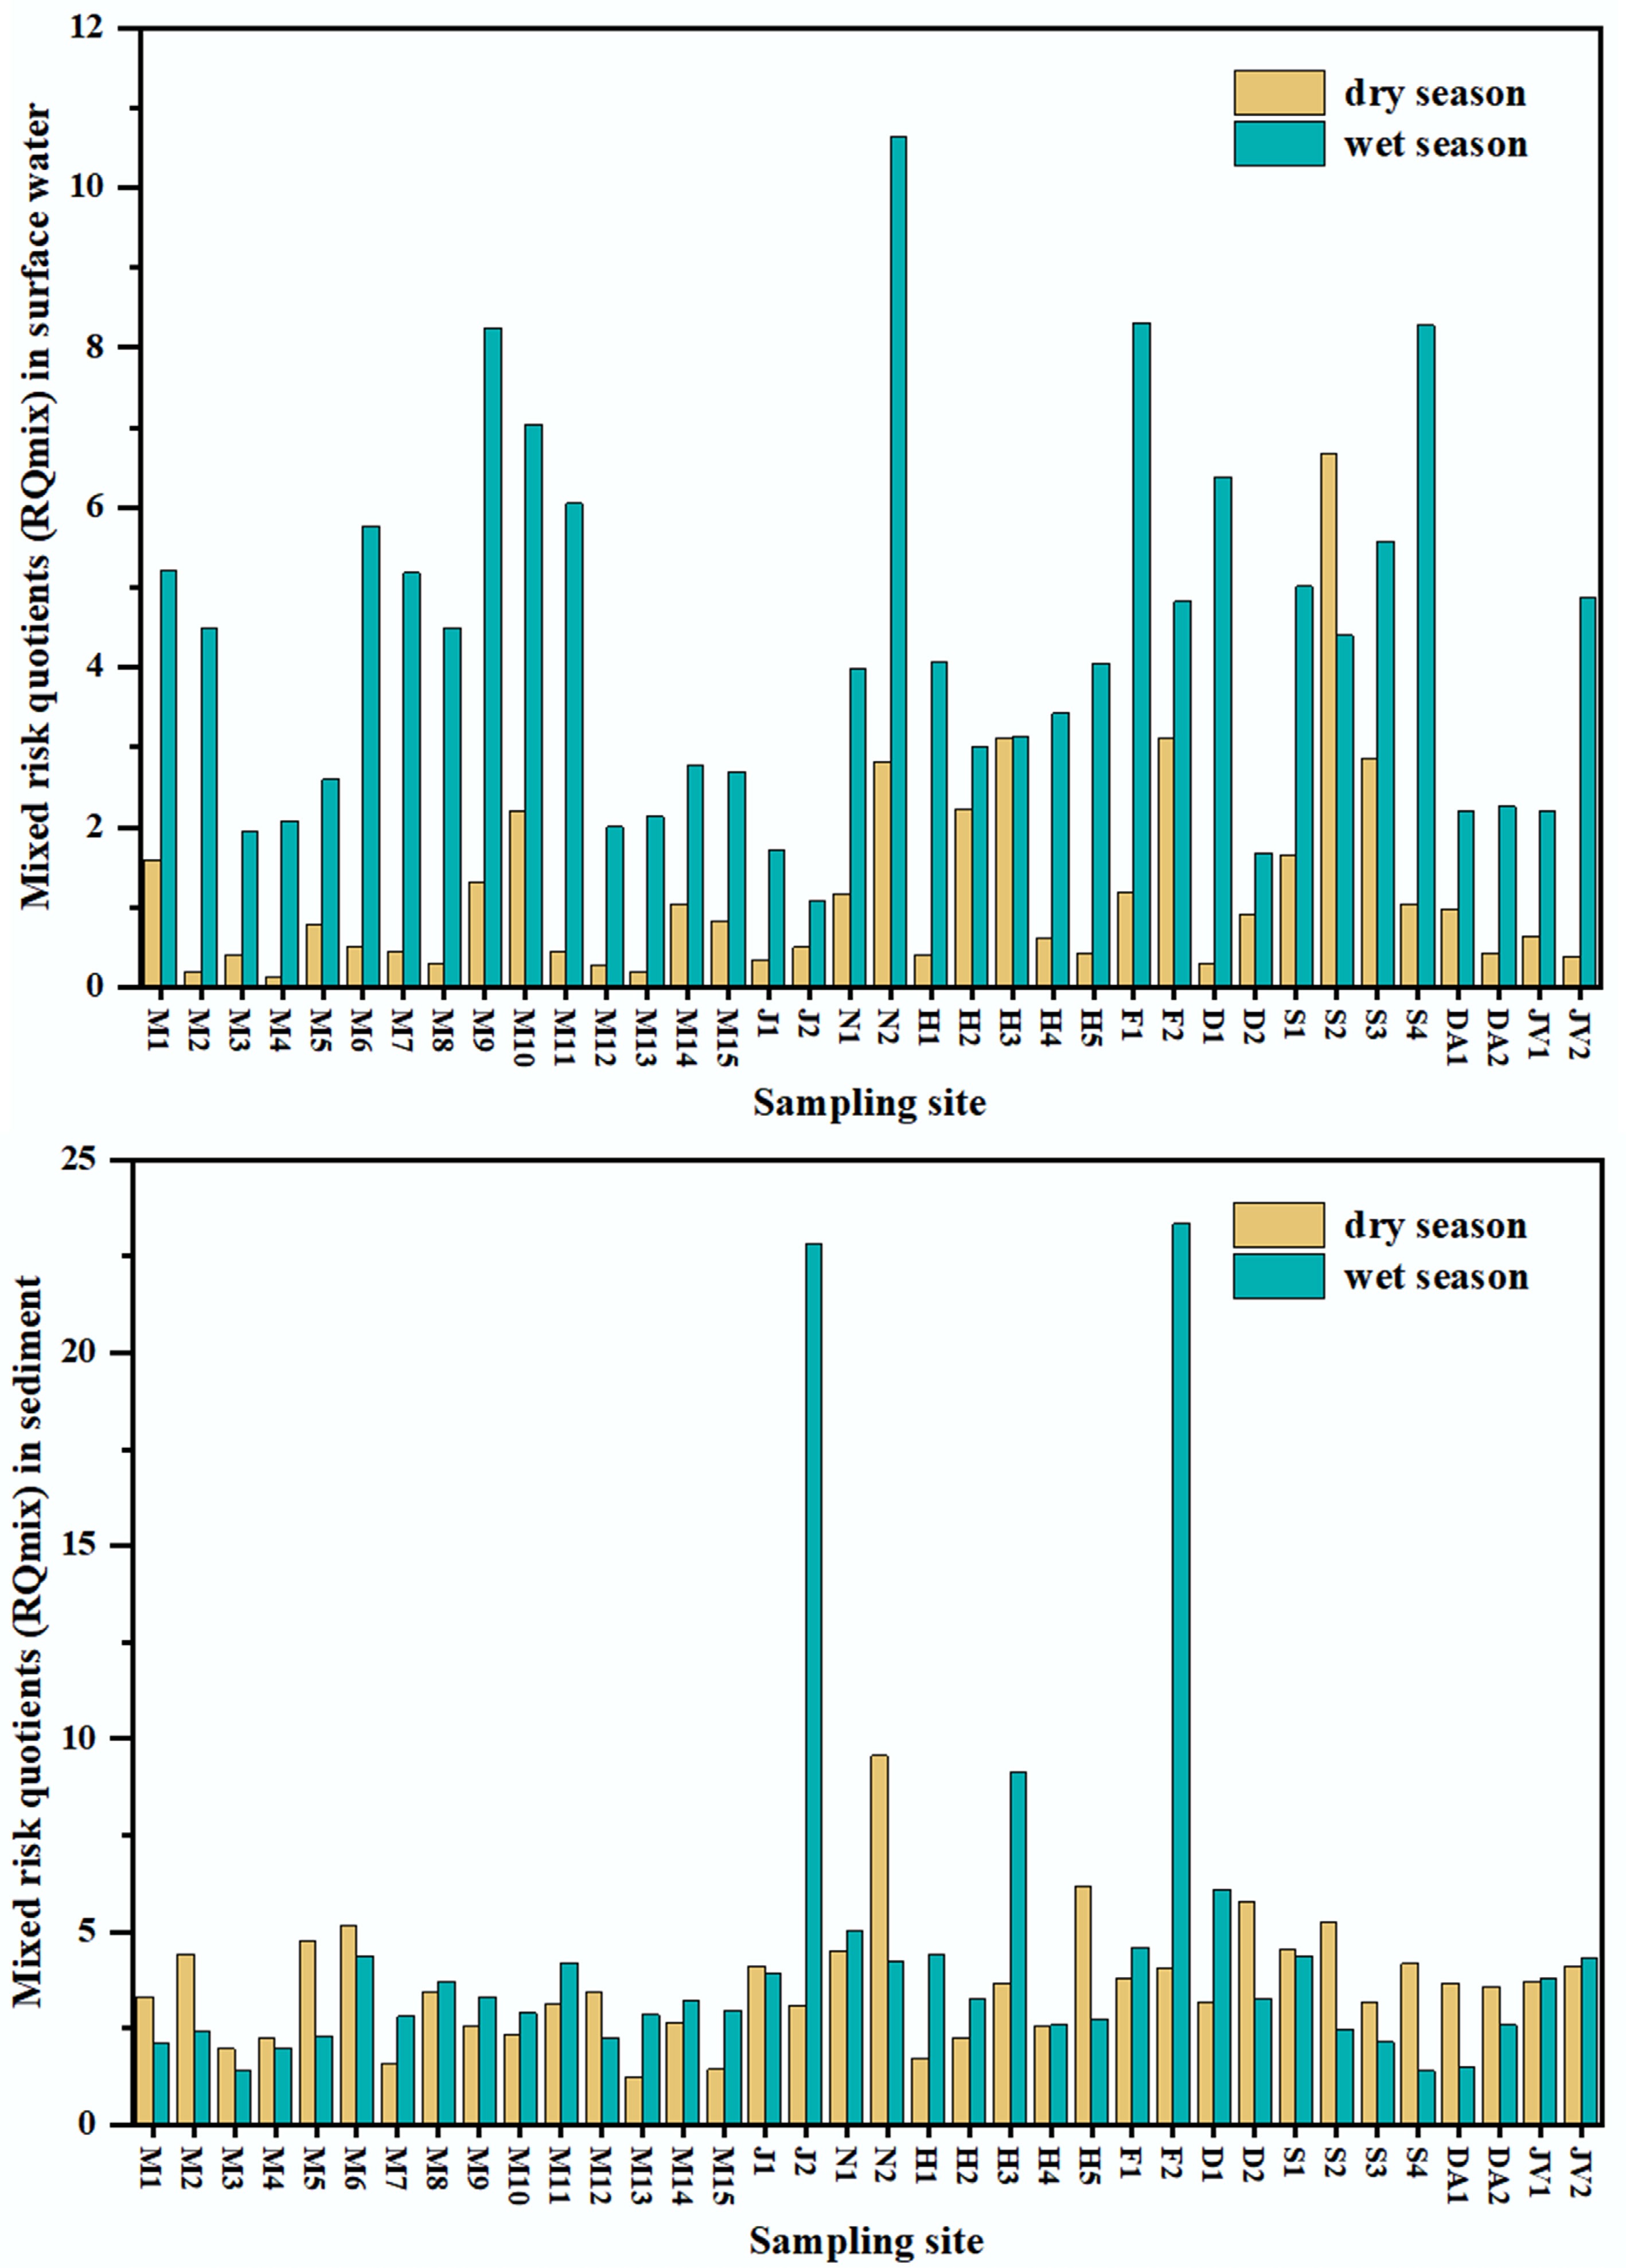
Figure 6.
Mixed risk quotients (RQmix) in surface water and sediment.
-
River Sampling time DMP DEP DBP BBP DEHP DNOP ∑PAEs Ref. Water (ng/L) Urban rivers, Wuhan Jan. 2024 1.58–1,489 3.64−150.9 1.83−248.3 n.d. 1.27−251.6 n.d.−17.85 40.57−2,135 This study May 2024 4.95−902.1 4.52−444.6 3.18−910.0 n.d. 8.54−996.6 n.d.−40.10 224.9−2,464 Yangtze River, Wuhan section 2022 10.51−338.7 1.12−26.75 n.d.−323.4 n.d.−33.79 5.00−471.6 n.d.−113.2 74.21−869.4 [17] Hangzhou Bay Summer 2019 1.66−55.6 31.2−426 n.d.−260 57.4−9,738 n.d.−1,386 7,305−22,861 [22] Autumn 2019 1.18−110 19.5−2,404 3.28−76 79−1,649 7.13−274 8,100−33,329 Poyang Lake Jun. 2019 n.d.−116 n.d.−127 121−744 n.d. 12−352 n.d. 288−1,033 [28] Dec. 2018 n.d.−253 n.d.−119 254−1,297 n.d. 88−896 n.d.−18 46−2,079 Bohai Sea May 2015 n.d.−2,310 n.d.−20,450 40−30,200 n.d.−1,210 n.d.−1,080 610−39,620 [23] Aug. 2015 n.d.−4,430 n.d.−6,830 n.d.−2,660 1,080−2,580 160−2,620 1,670−22,400 Jan. 2016 n.d.−33,810 n.d.−2,540 n.d.−440 n.d.−150 n.d.−2,520 10 - 52580 Pearl River Jan. 2013 n.d.−3,390 n.d.−490 42−1,010 n.d.−800 150−1,360 n.d.−130 500−5,030 [24] Apr. 2013 44−140 n.d.−950 60−2,040 790−5,320 1,080−8,840 79−4,300 2,780−20,700 Lake Chao Aug. 2011 21−193 78−174 463−11,200 1−3 n.d.−67 1,540−13,200 [25] Nov. 2011 n.d.−111 24−160 426−3,650 1−11 n.d.−86 1,280−5,390 Feb. 2012 6−99 10−102 98−465 1−4 2−217 370−1,480 Sediment (ng/g) Urban rivers, Wuhan Jan. 2014 1.41−17.76 0.64−4.68 74.92−347.0 n.d.−8.18 43.66−1,196 n.d.−3.18 159.6−1,542 This study May 2014 4.27−56.63 0.54−11.01 3.87−2,707 n.d.−55.53 44.36−3,494 n.d.−51.65 141.7−4,315 Yangtze River, Wuhan section 2022 3.28−26.87 0.72−4.91 22.35−107.1 n.d.−1.56 30.66−359.4 n.d.−12.37 106.1−486.0 [17] Hangzhou Bay Summer 2019 6.08−1,483 2.48−1,778 0.31−2.23 0.31−2,414 n.d.−28.9 118−5,888 [22] Autumn 2019 4.02−189 3.17−219 0.29−5.01 61.3−1,114 n.d.−3.07 145−4,746 Haihe River Apr. 2019 n.d.−0.97 0.54−4.70 19.91−229.8 n.d.−13.30 40.84−1,146 0.16−16.10 62.27−1,242 [12] Dec. 2018 0.12−1.30 0.18−3.32 9.01−55.05 0.13−4.66 23.42−337.6 0.12−1.60 35.83−395.0 Jul. 2018 0.24−1.82 0.2−4.38 12.75−65.10 0.14−3.83 27.09−754.9 0.24−7.94 40.88−825.6 Pearl River Jan. 2013 90−750 20−170 280−1,160 10−160 810−2,110 40−230 1,600−4,620 [24] Apr. 2013 n.d.−220 n.d.−180 150−2,500 n.d.−120 470−2,720 10−310 880−5,690 Table 1.
Comparison of PAEs concentrations in this study with other aquatic media cited from relevant studies
Figures
(6)
Tables
(1)