-
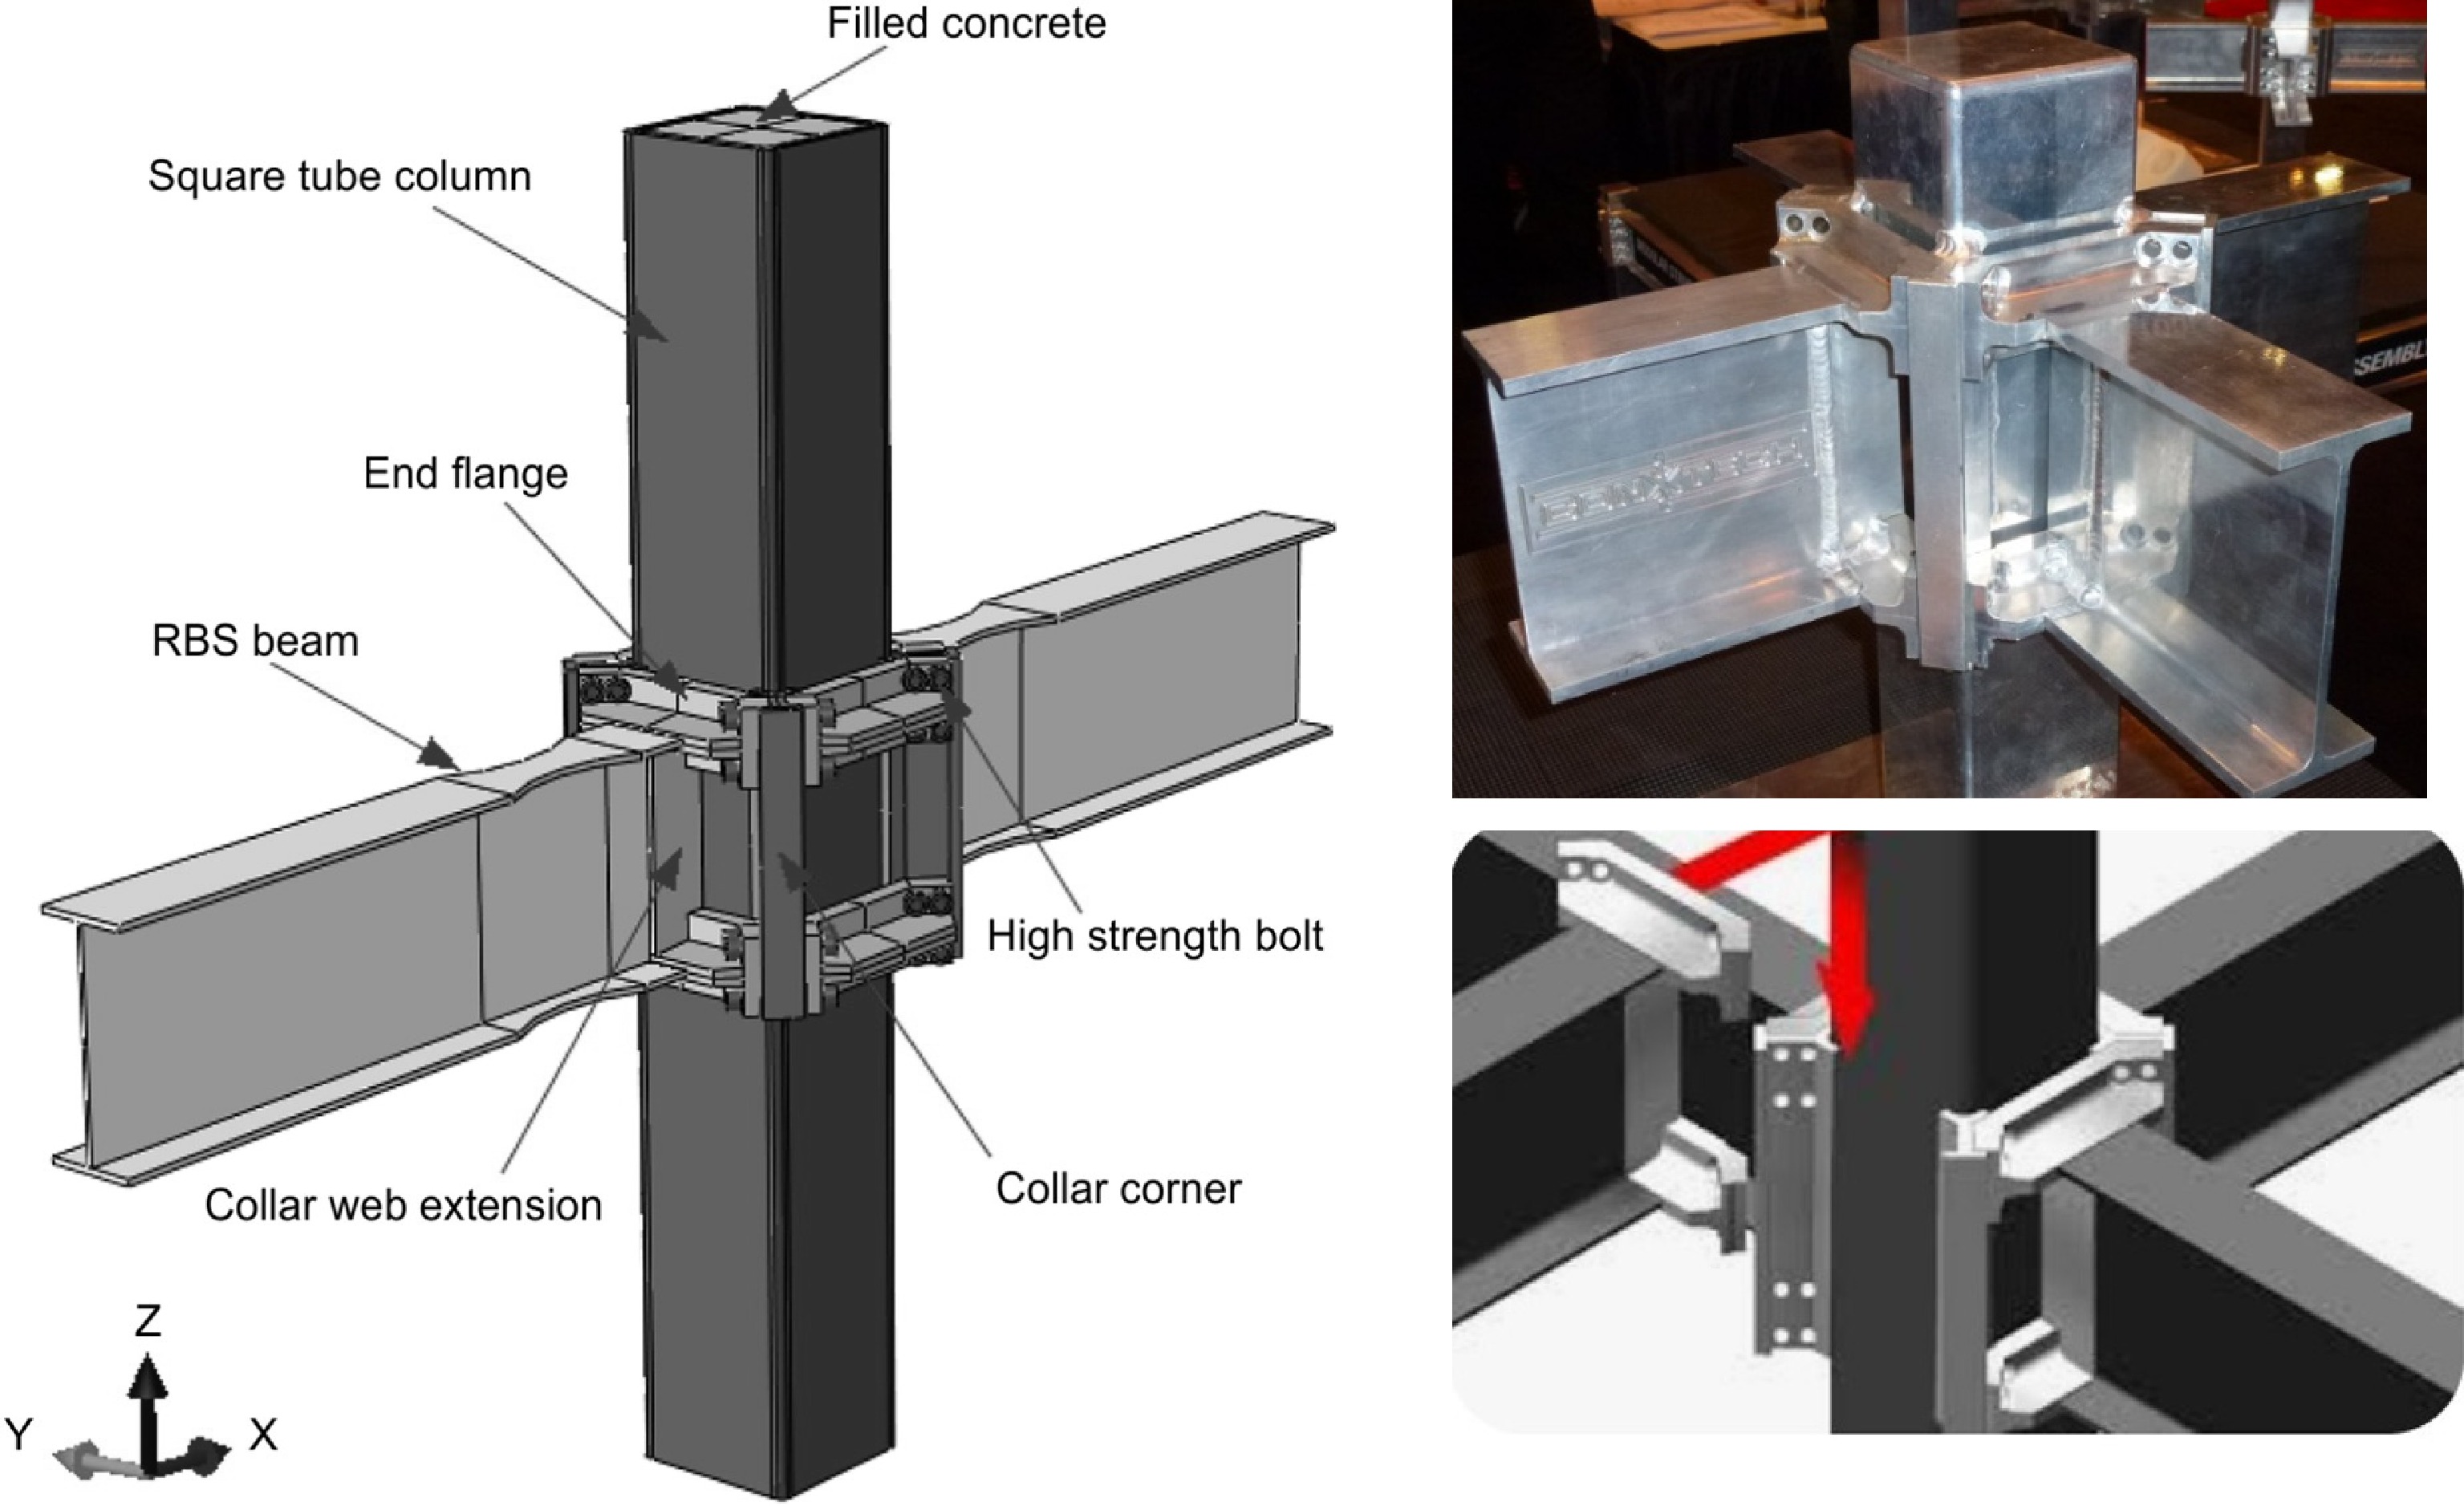
Figure 1.
Details of the ConXL connection with concrete infill, based on AISC 358-10[10]. Figure constructed by the authors.
-
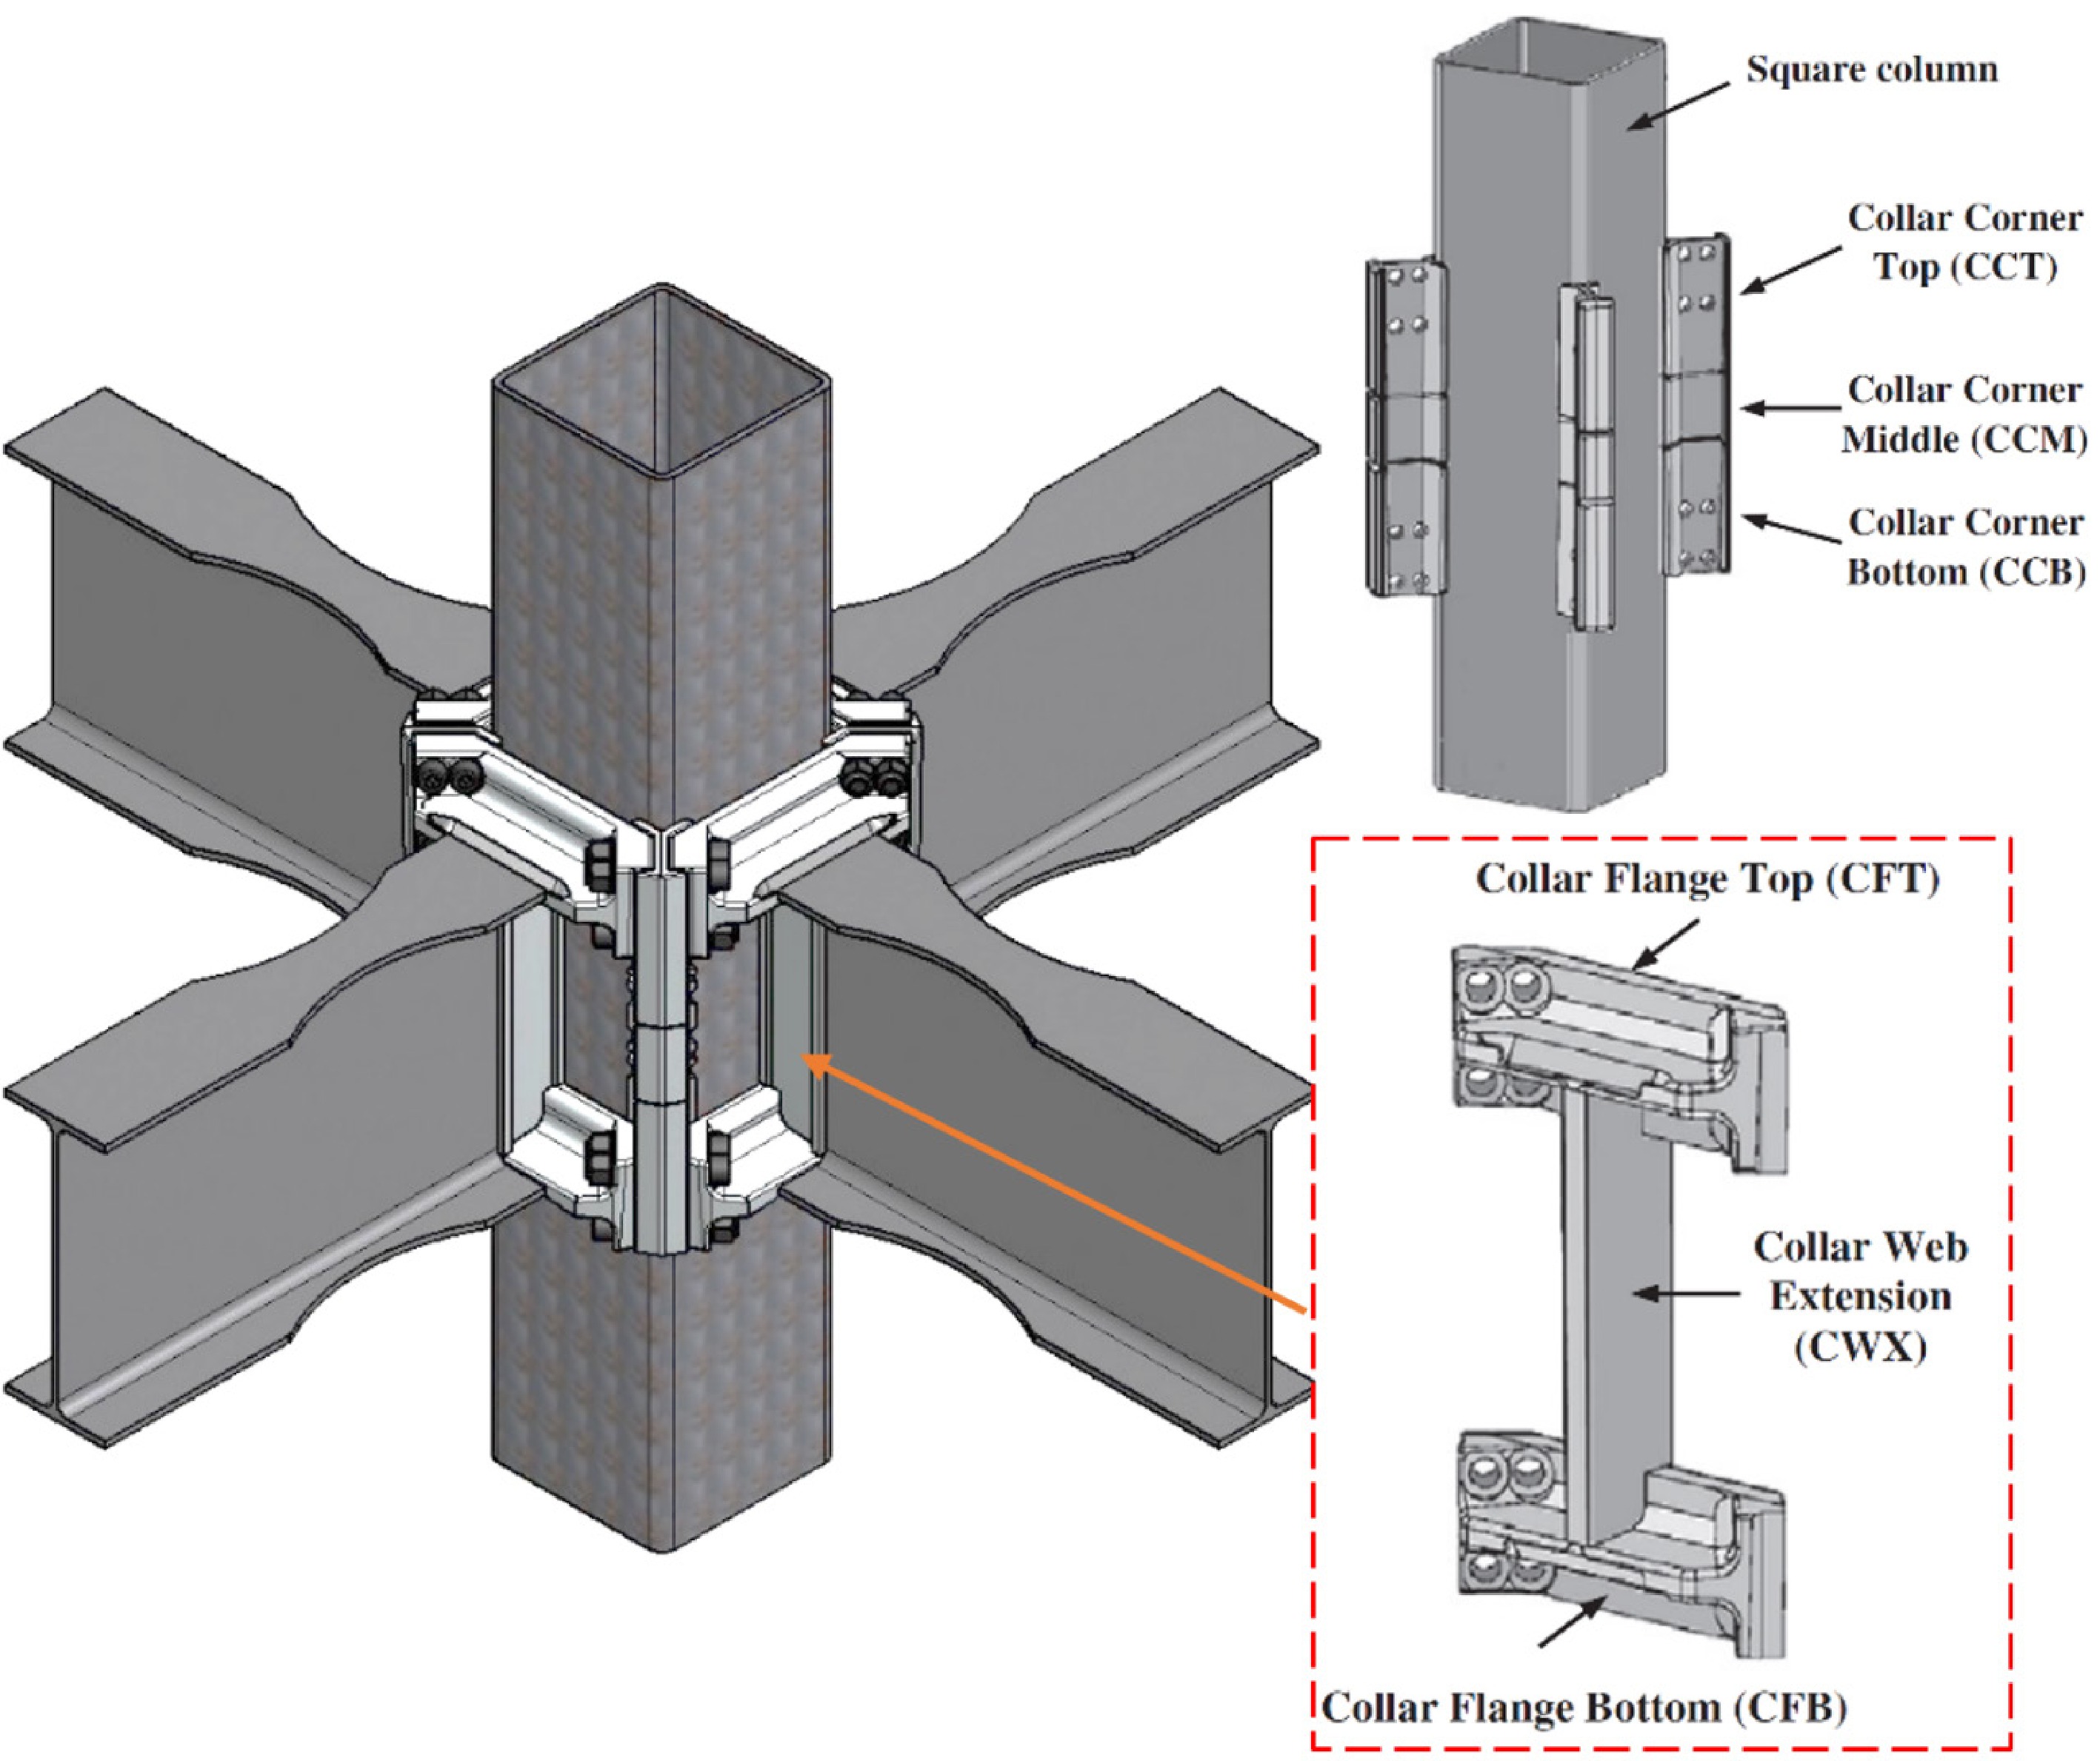
Figure 2.
Box column with ConXL connections, showing the details of the attached collar corner assemblies. Figure created by the authors.
-
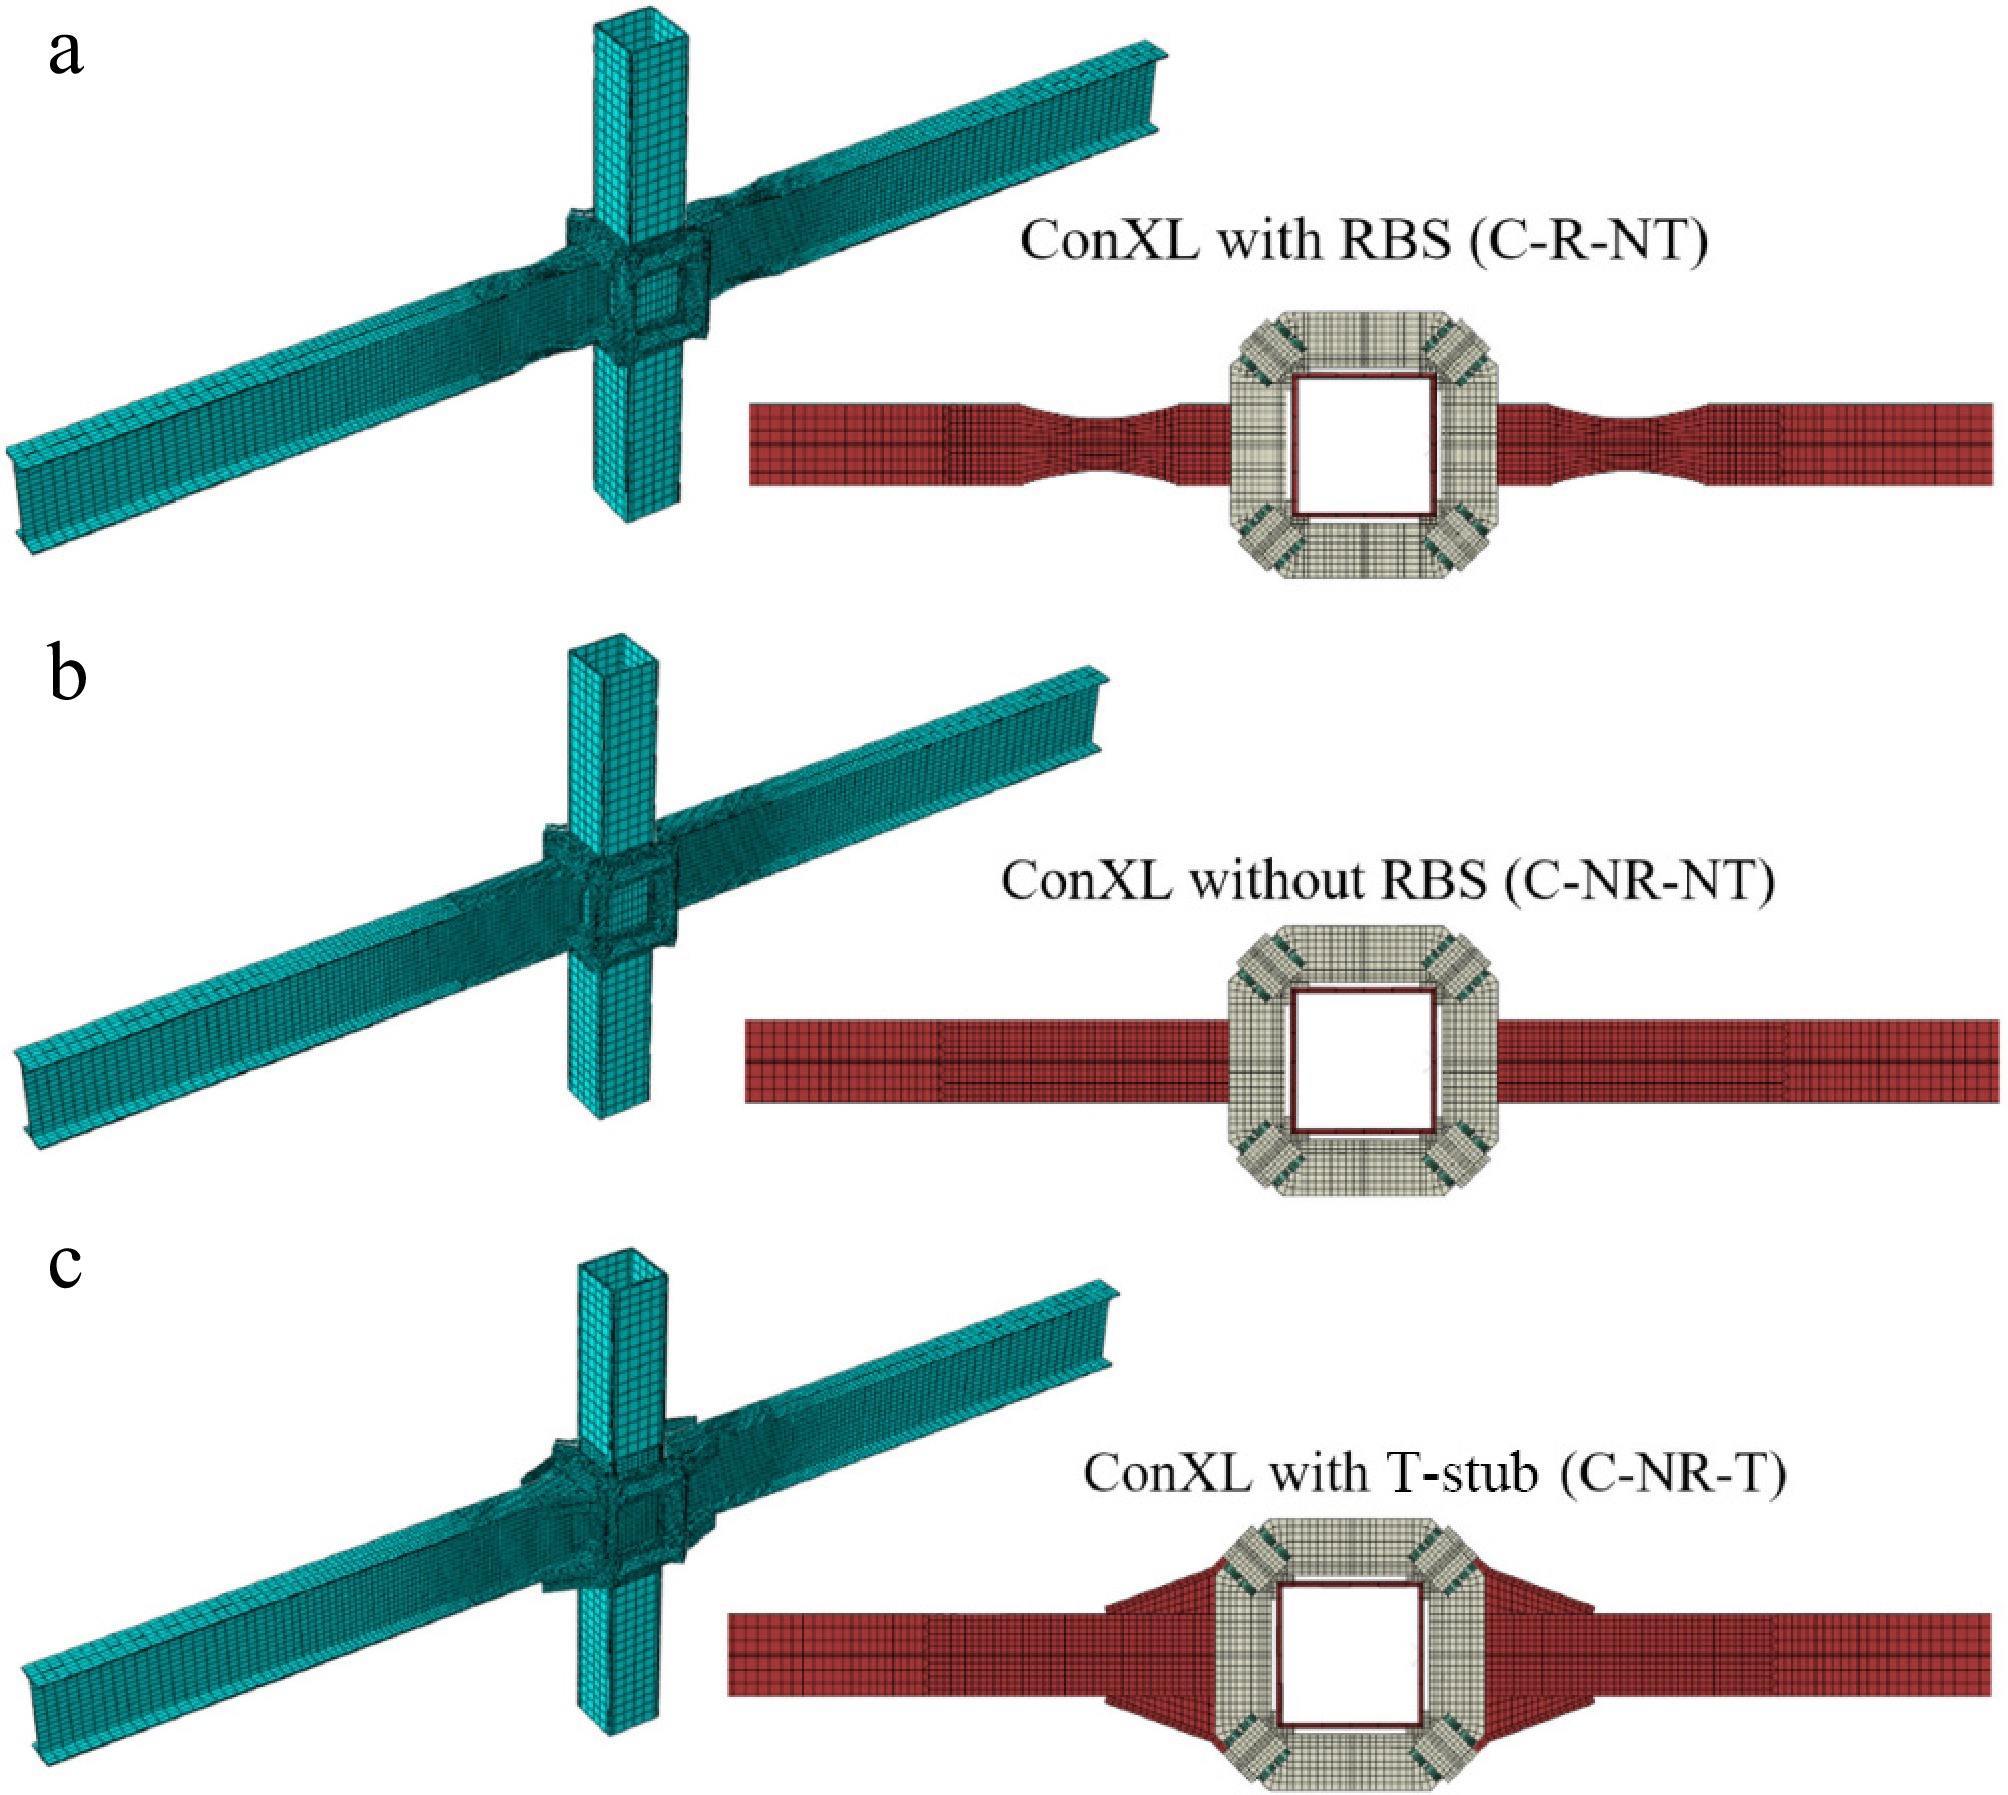
Figure 3.
Types of ConXL connections considered in the parametric study: (a) ConXL with an RBS (the C-R-NT model); (b) ConXL without an RBS (C-NR-NT model); and (c) ConXL with a T-stub (C-NR-T model).
-
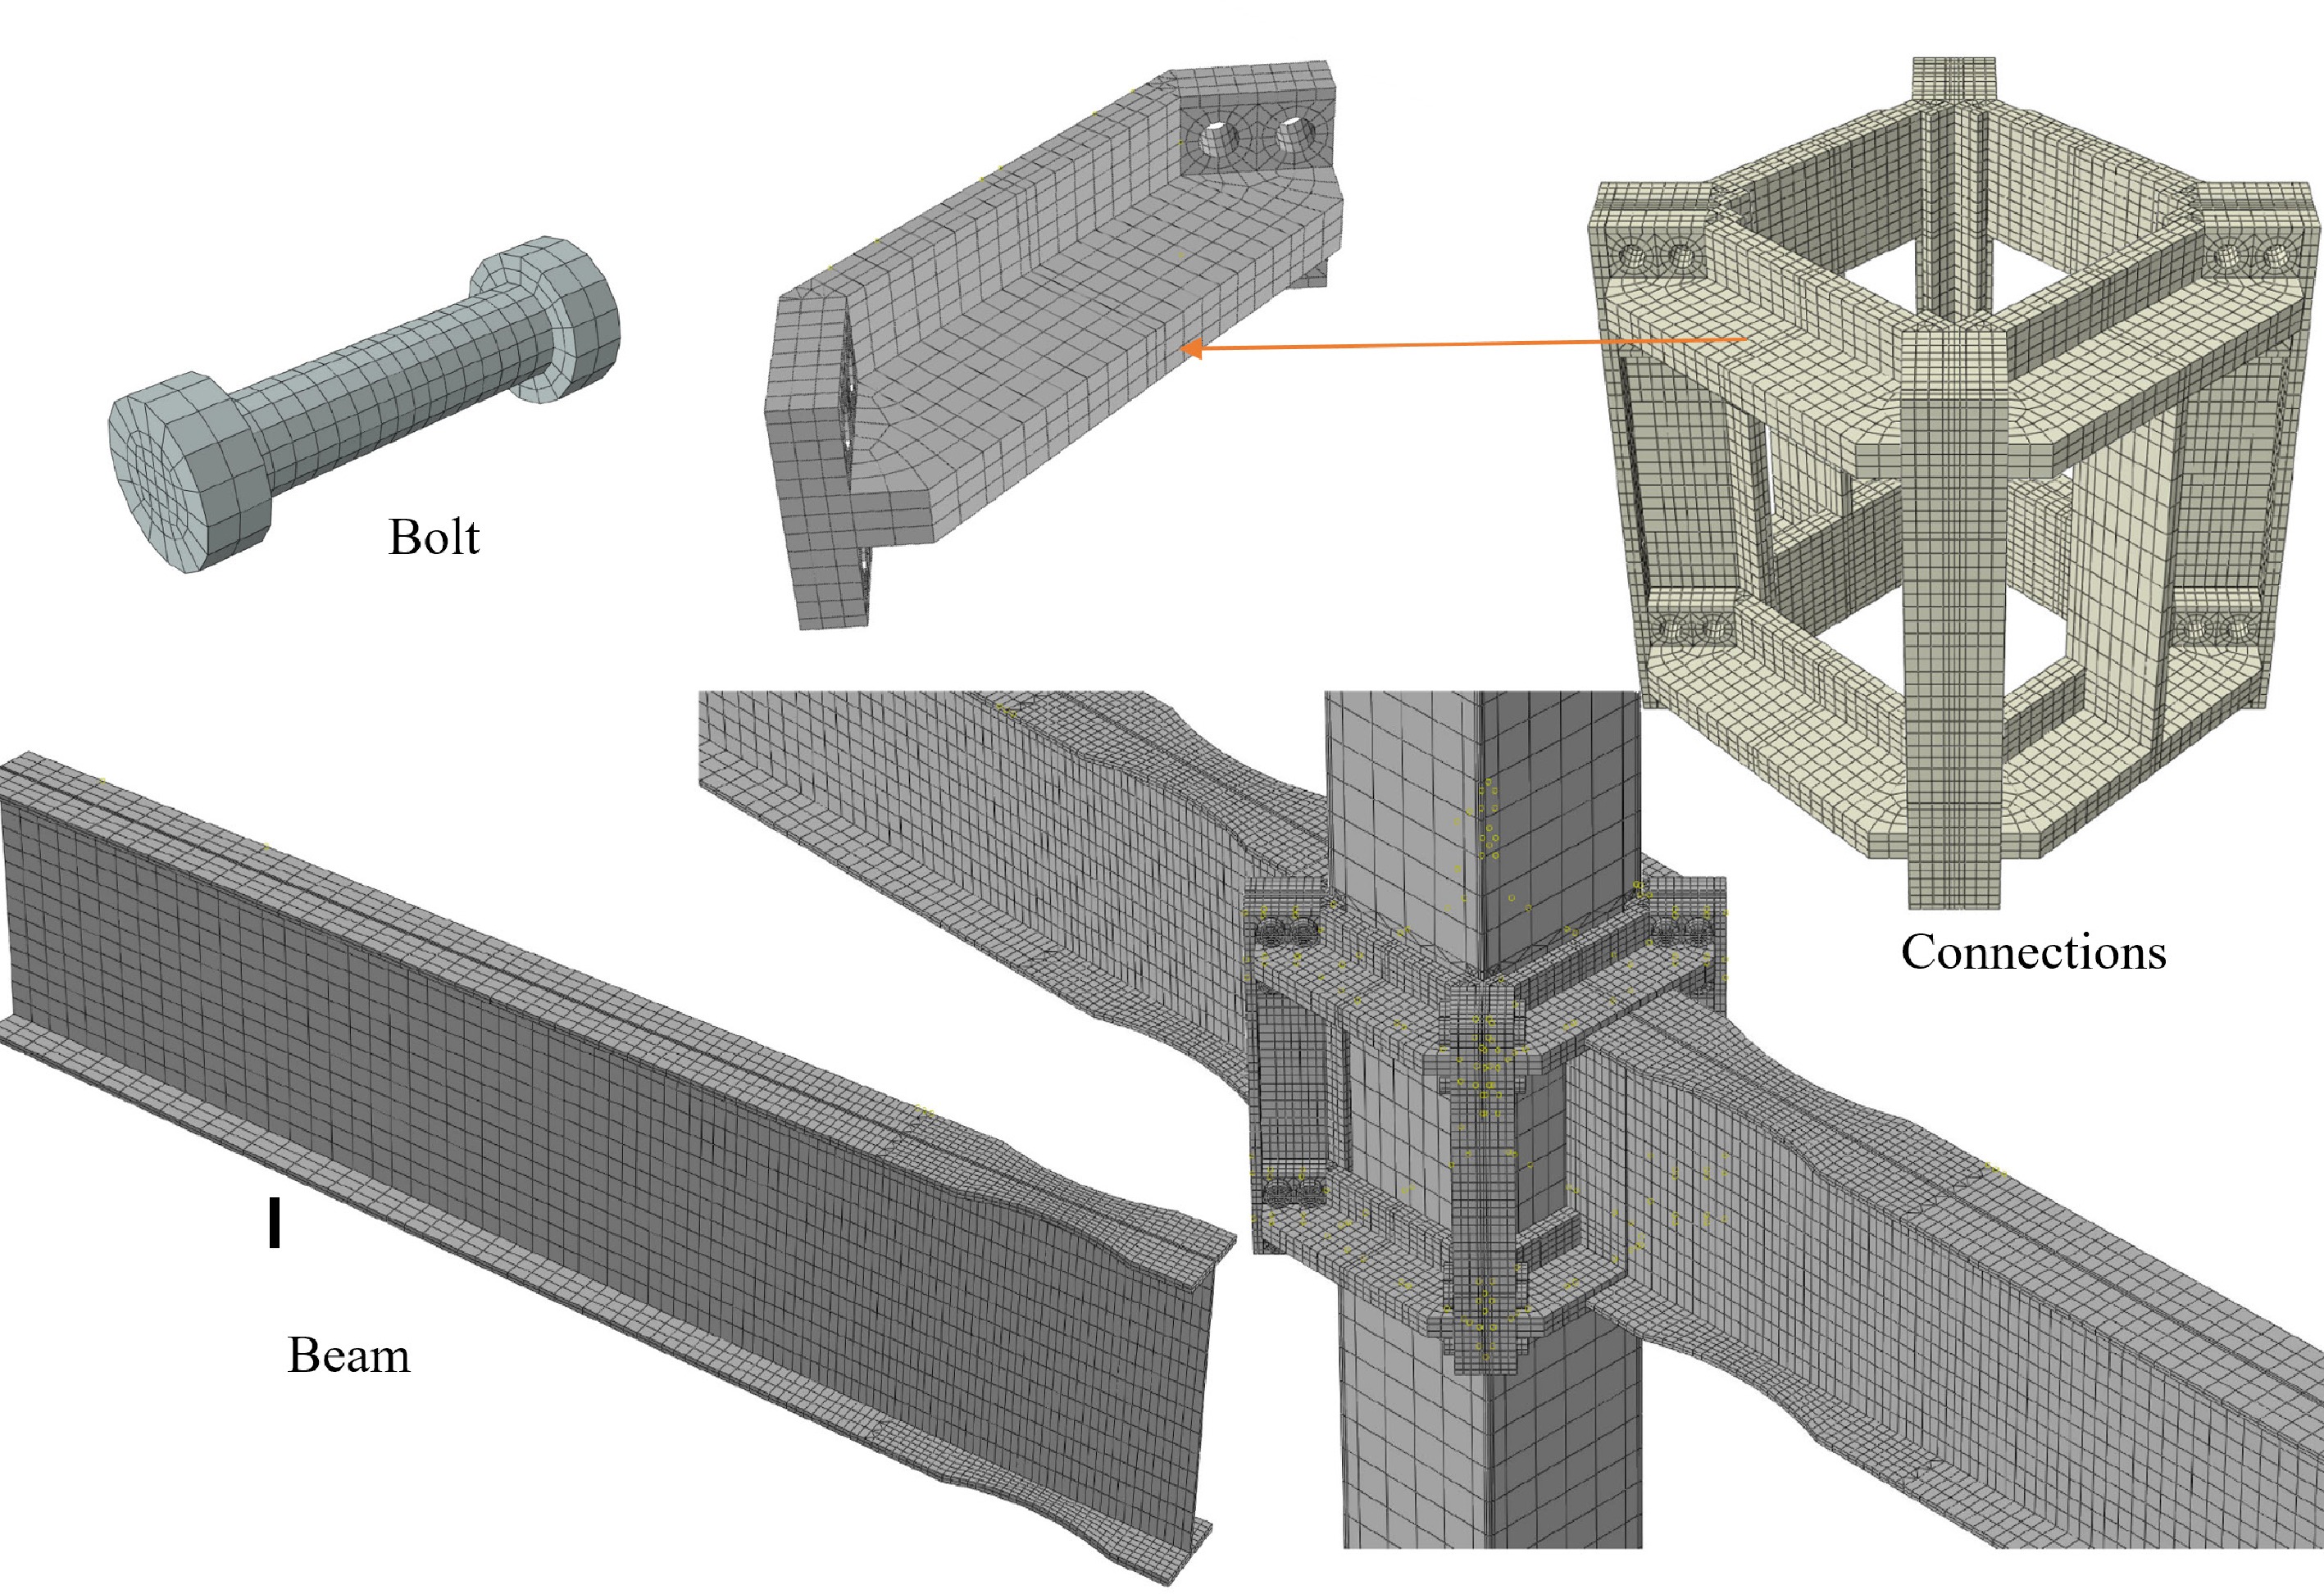
Figure 4.
A schematic view of the FE model, showing the meshing.
-
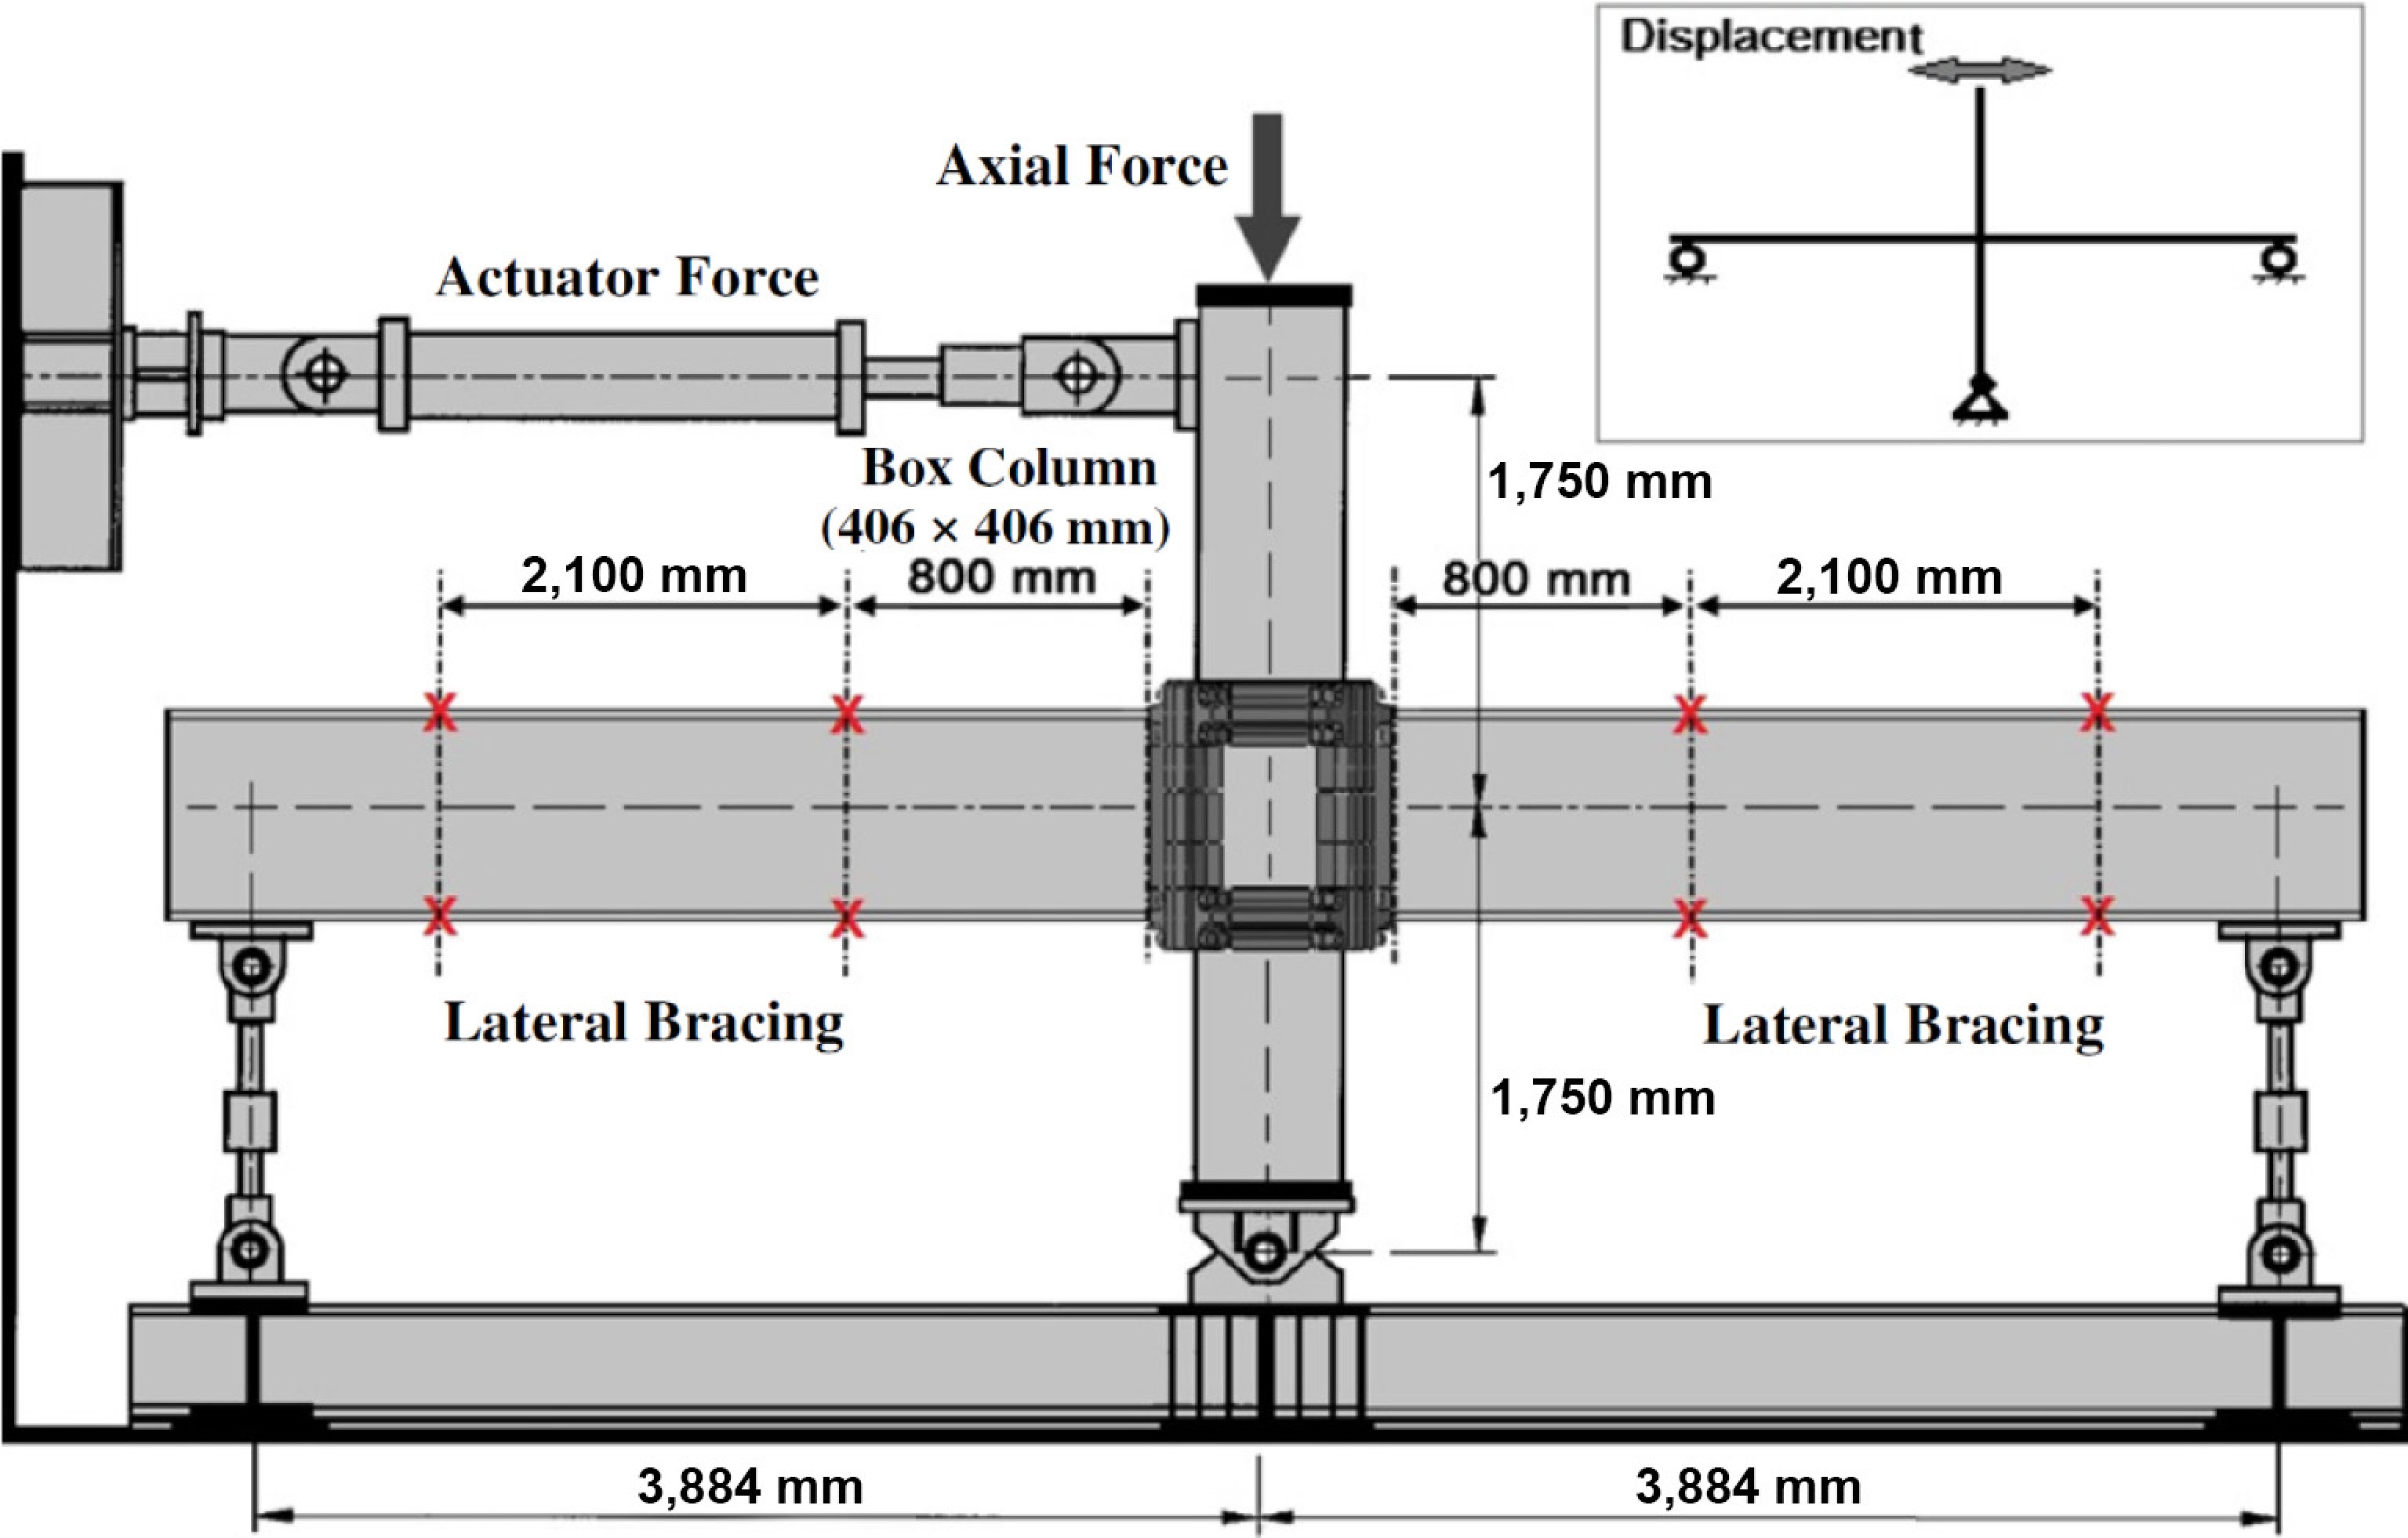
Figure 5.
Boundary conditions adopted for calibration of the initial FE model.
-
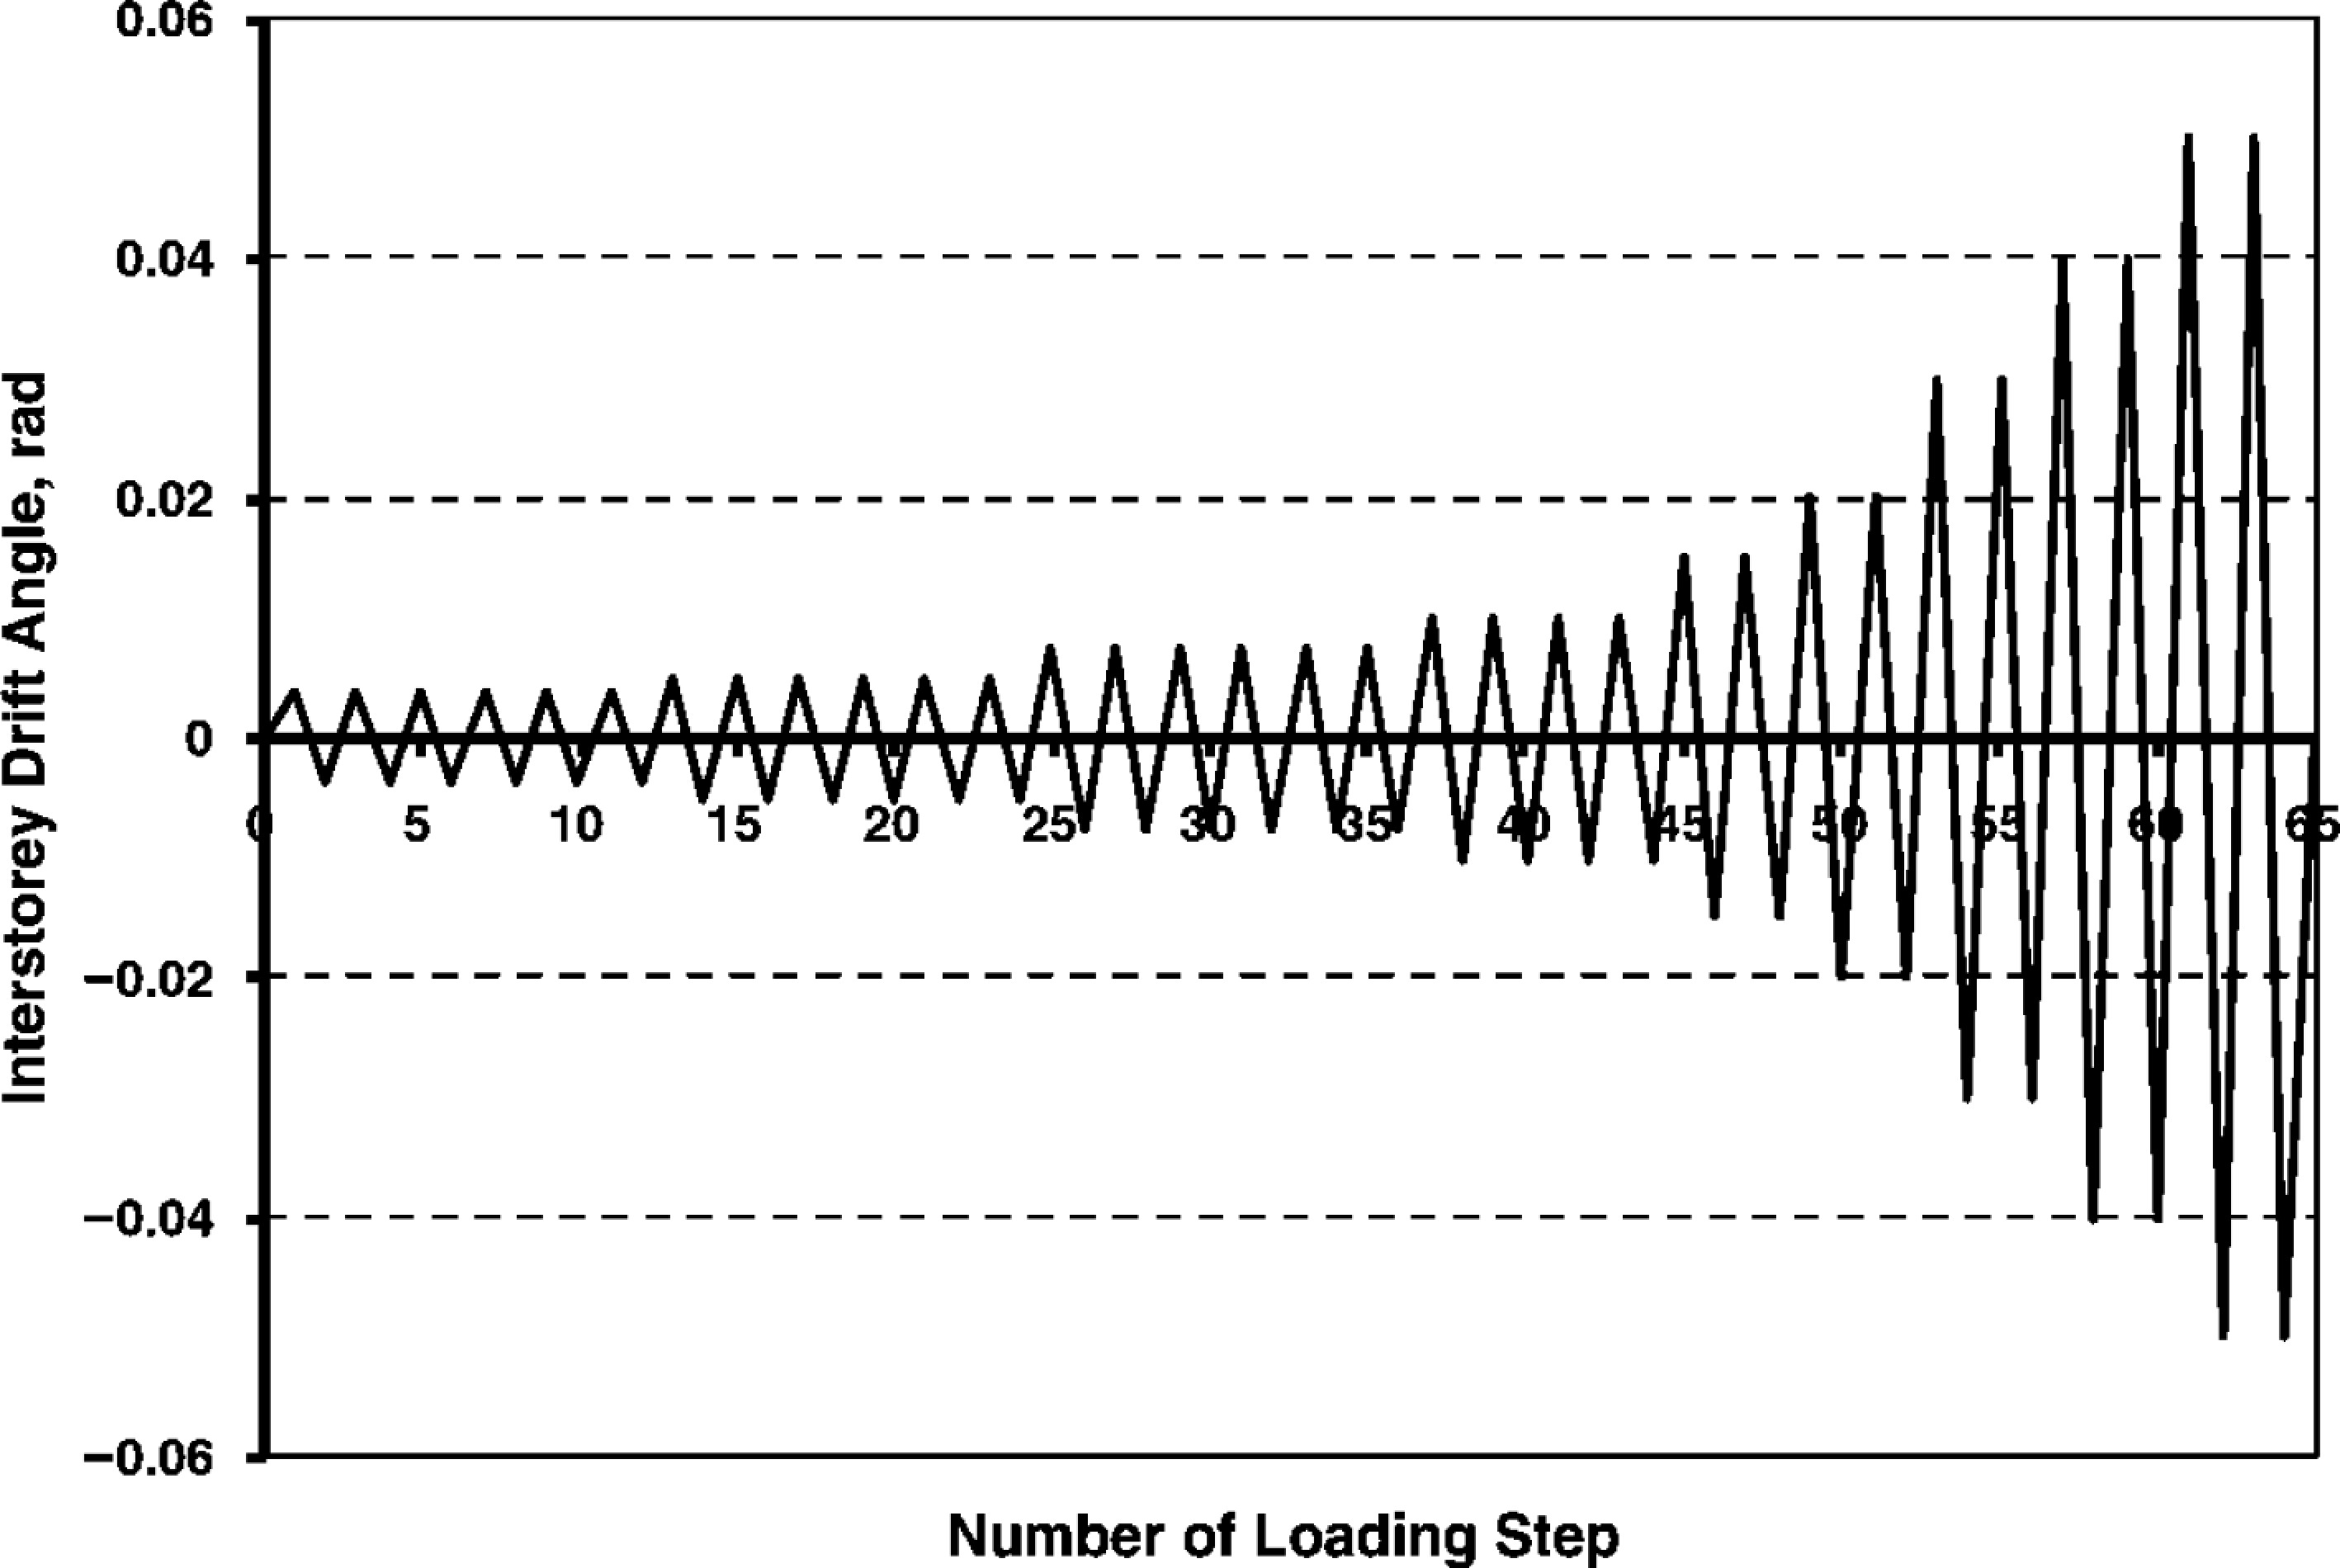
Figure 6.
Cyclic loading diagram based on ANSI/AISC 358-22[35].
-
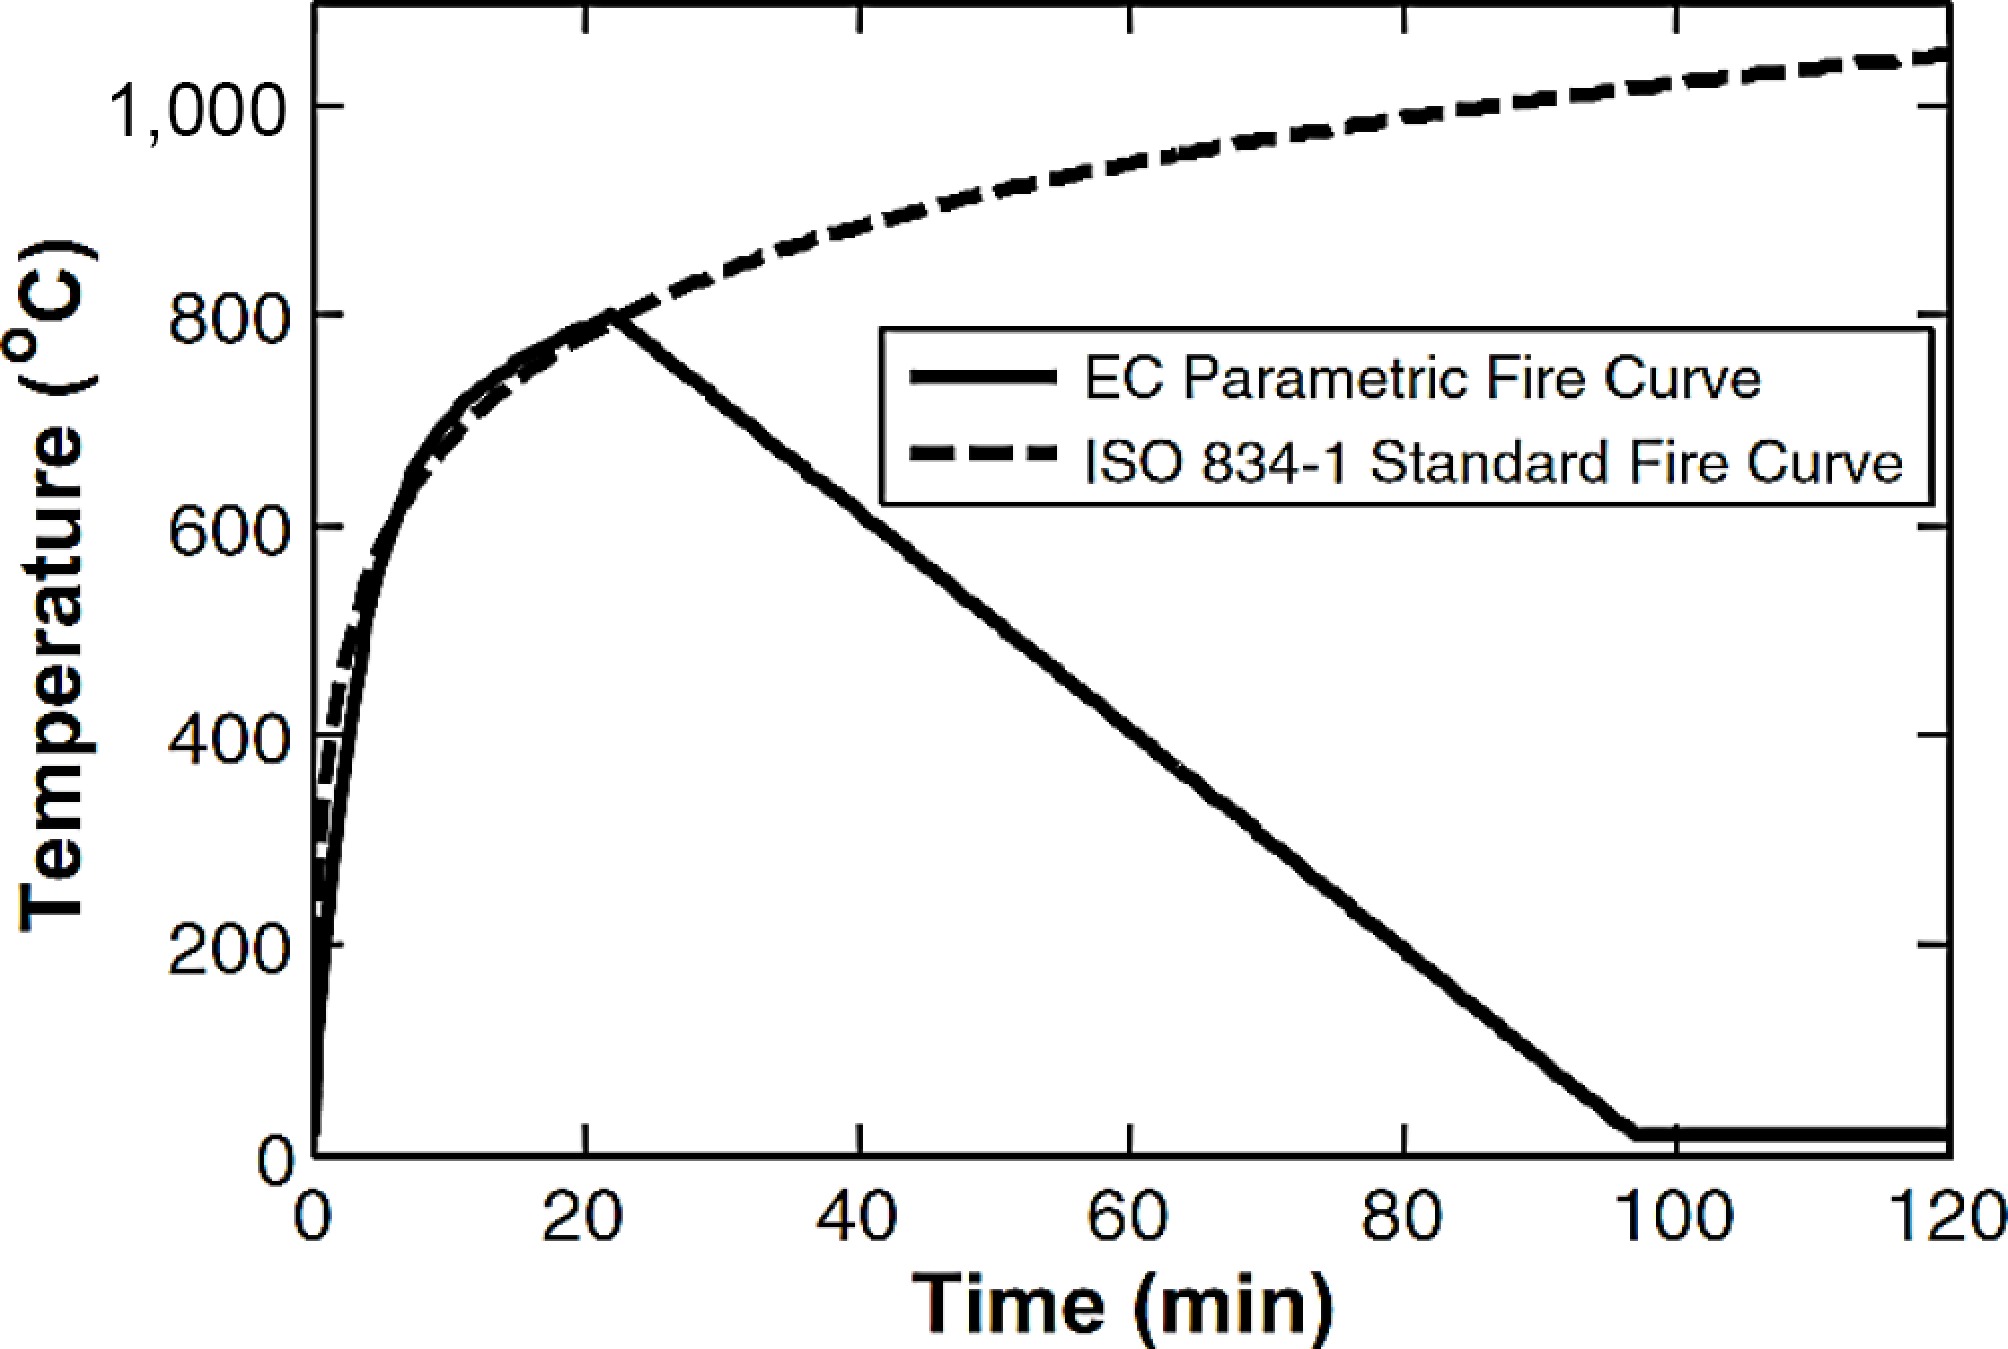
Figure 7.
The ISO standard fire curve and EC parametric fire curve applied to the FE models.
-
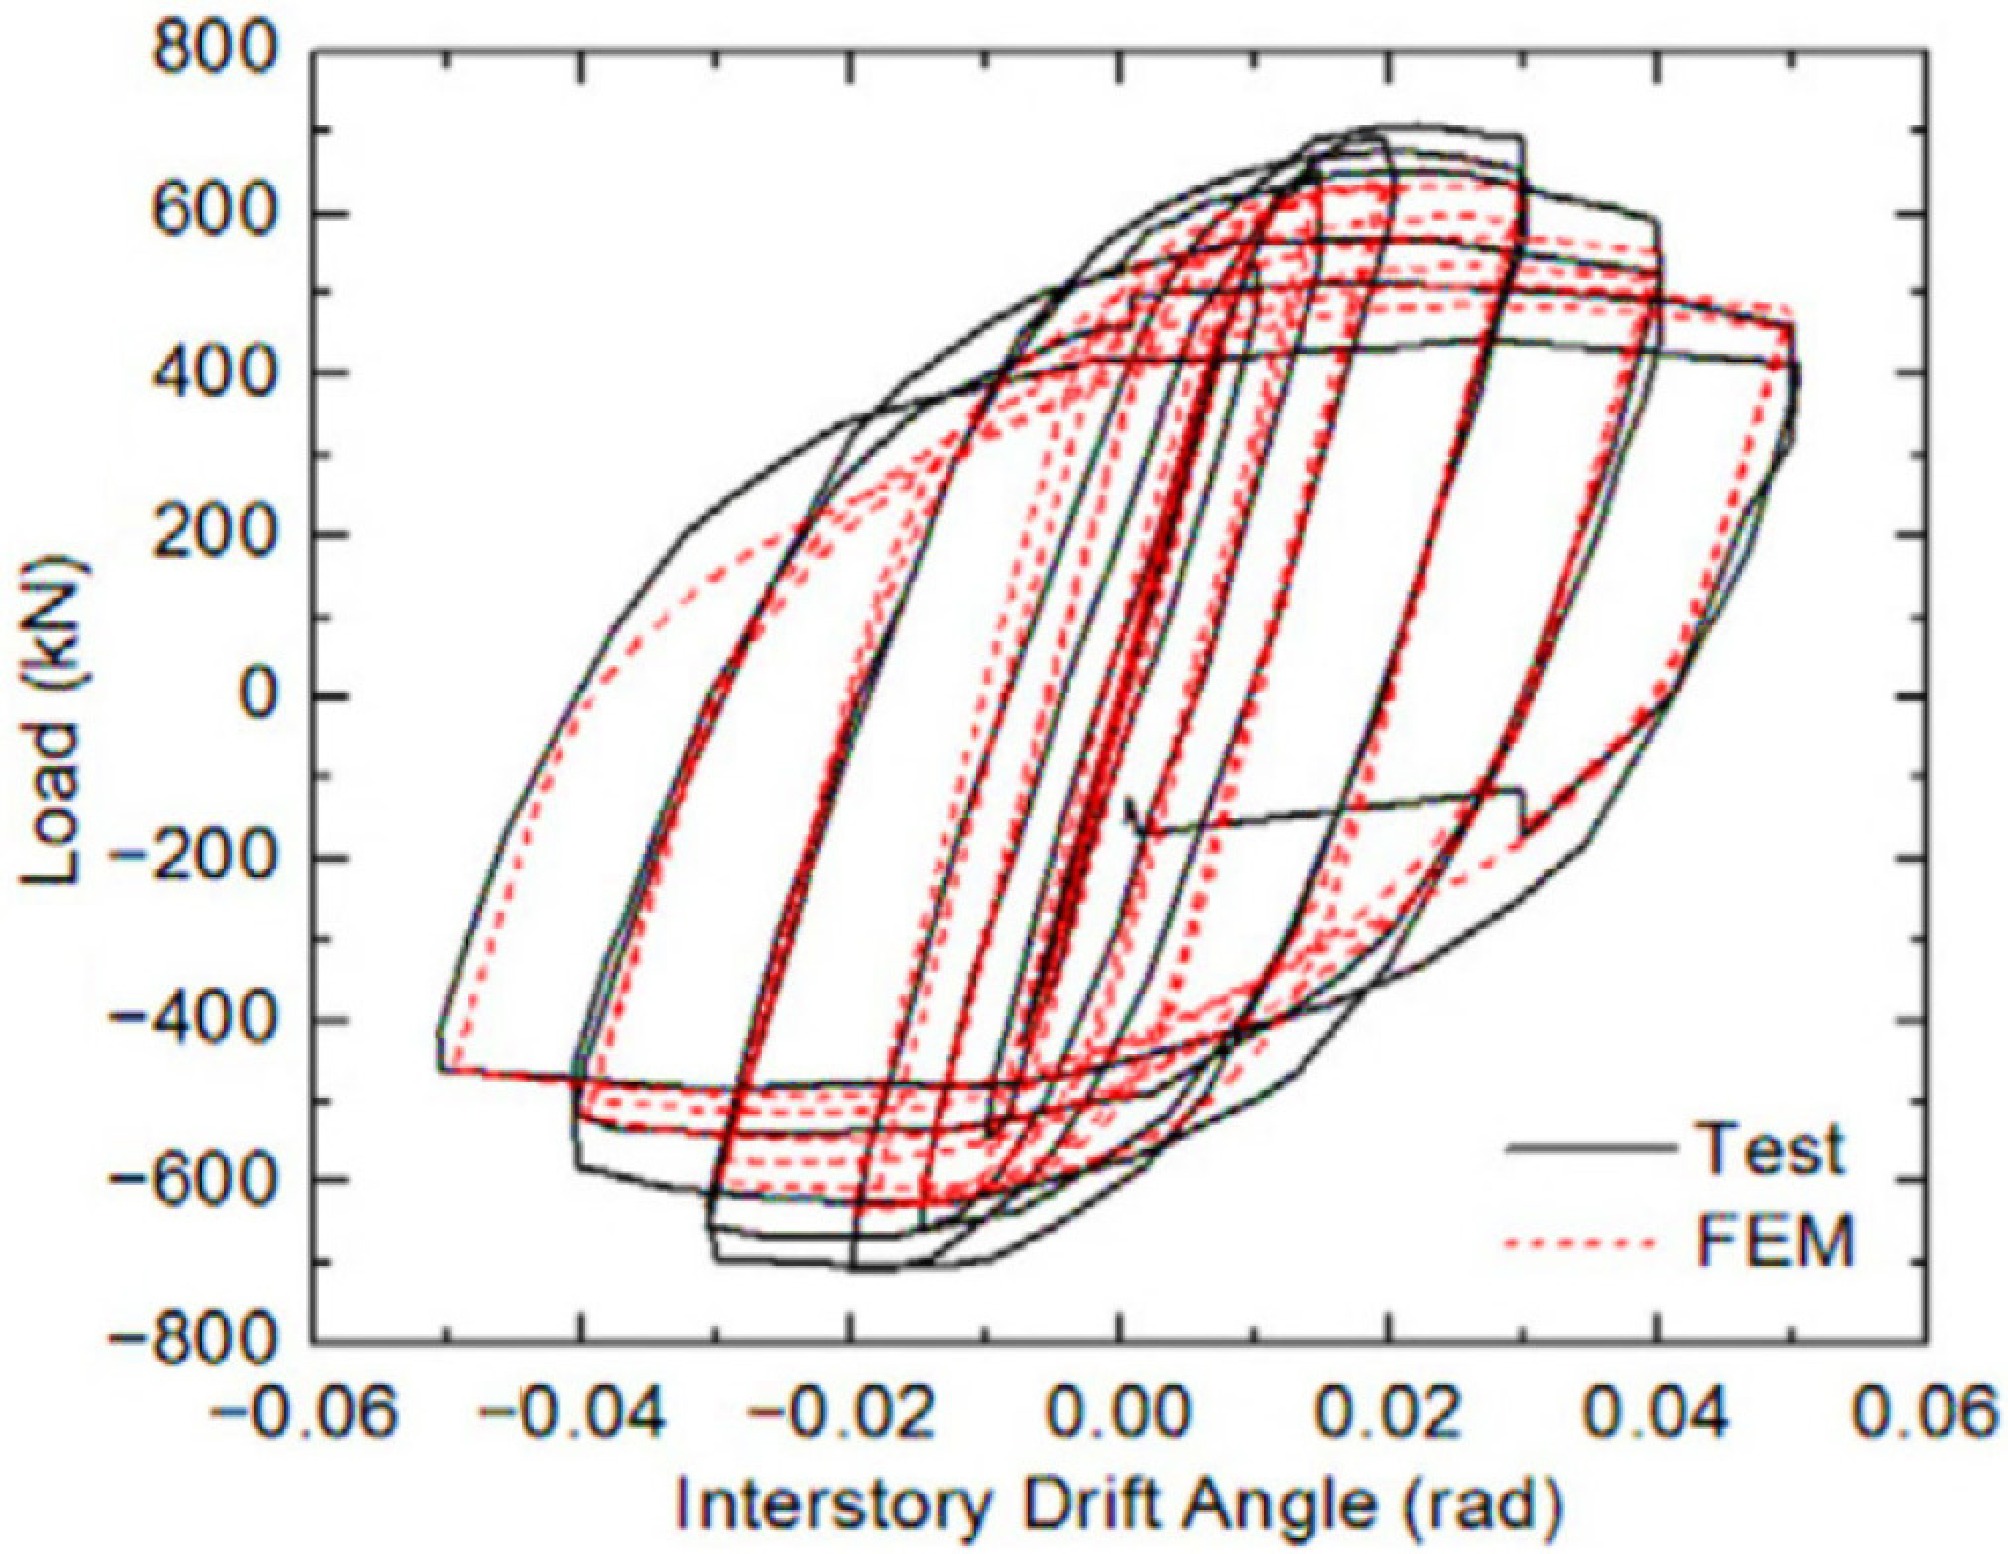
Figure 8.
Comparing the test results presented in ConXtech[41] against the FE simulation's results.
-
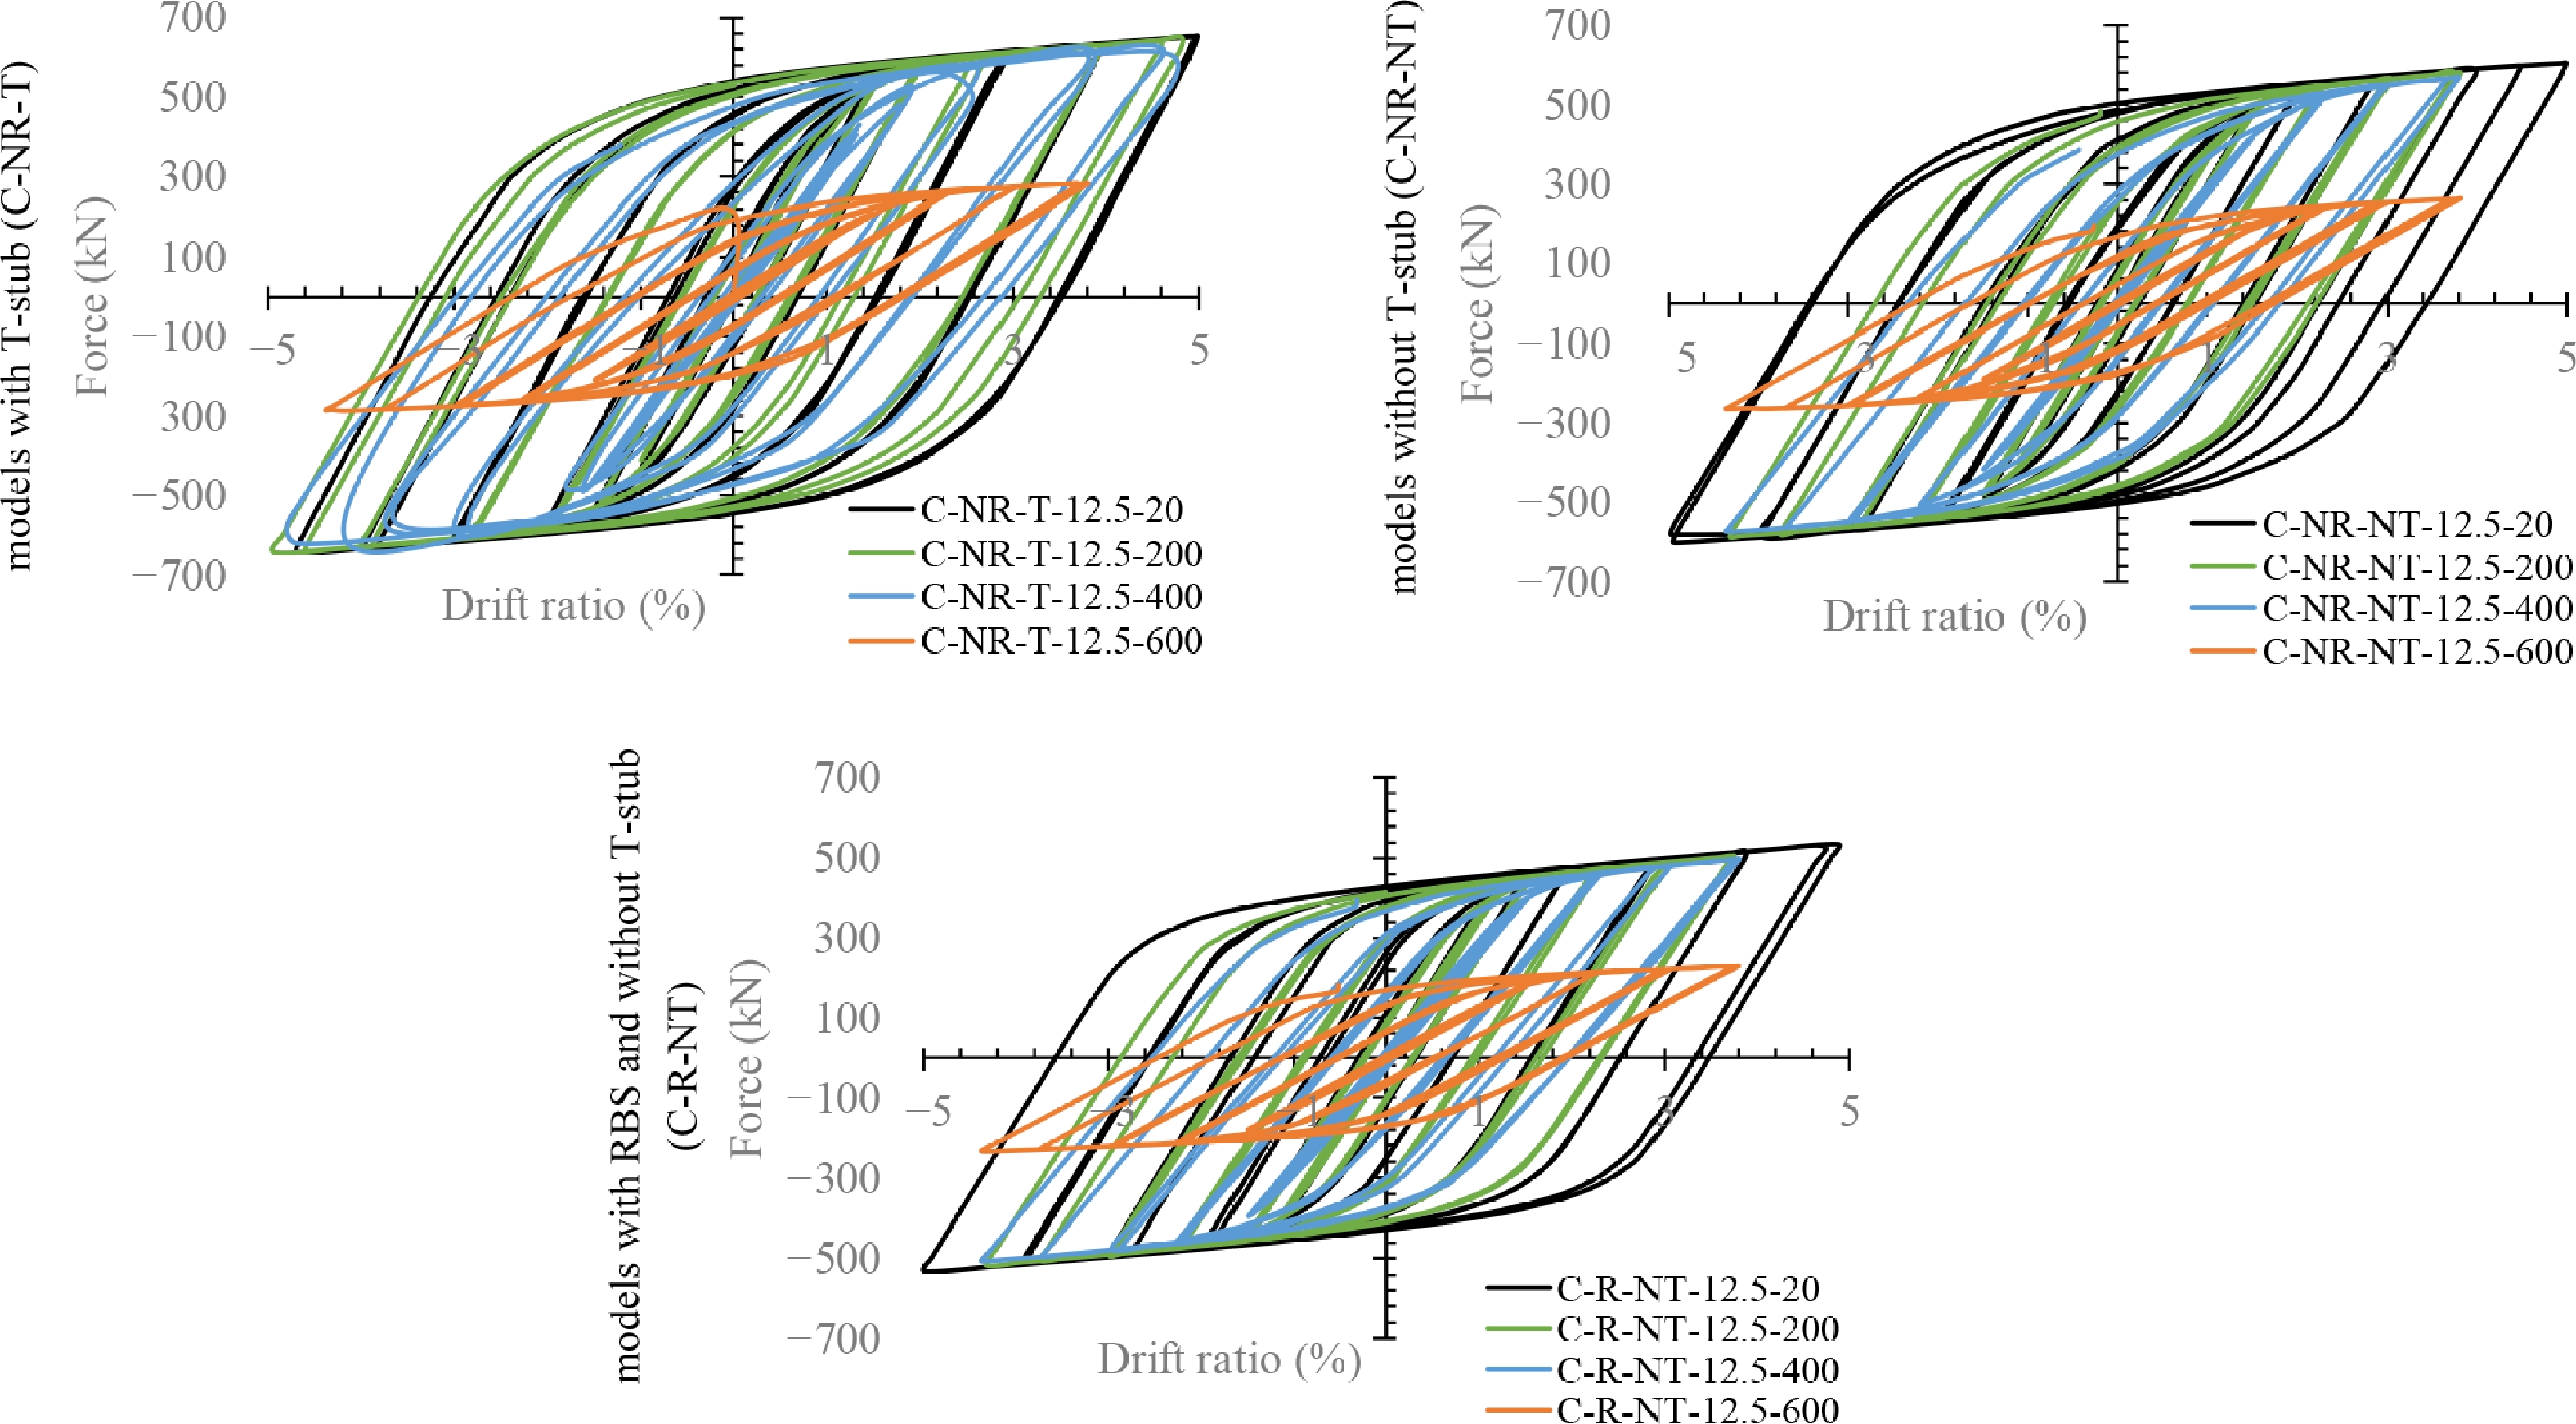
Figure 9.
Comparing the results considering the effects of fire.
-
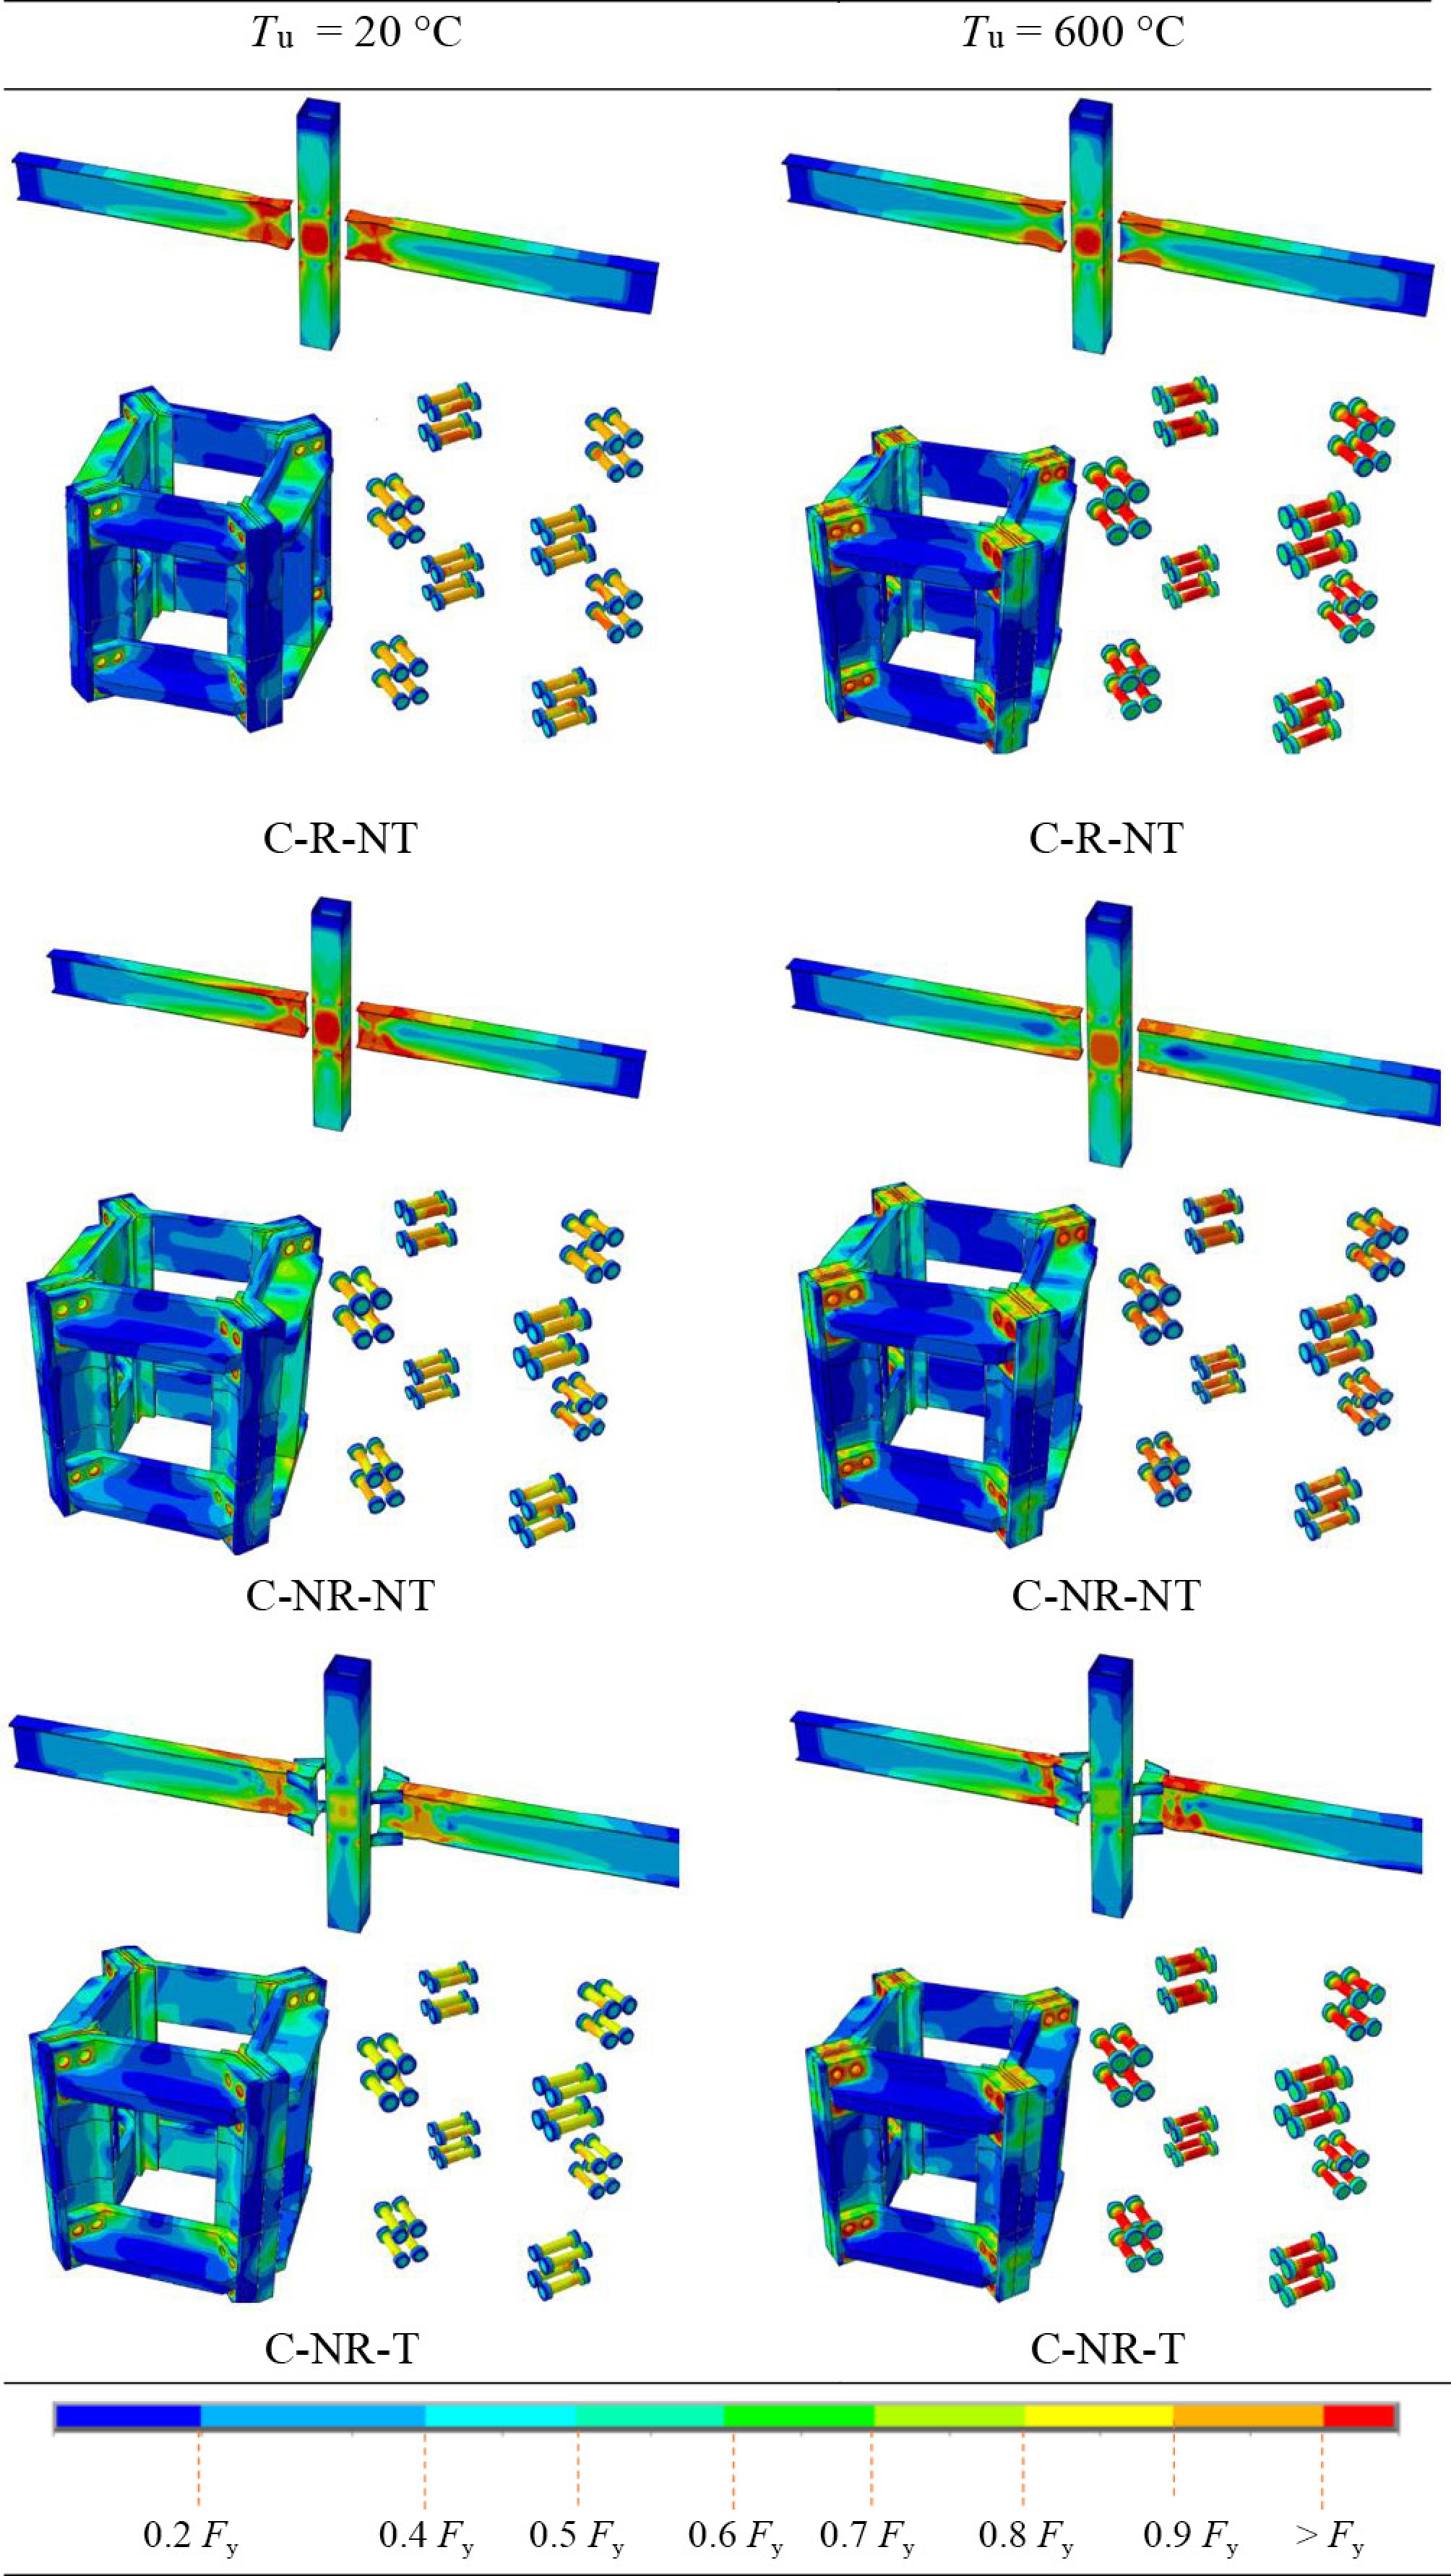
Figure 10.
The hinge formation of the elements.
-
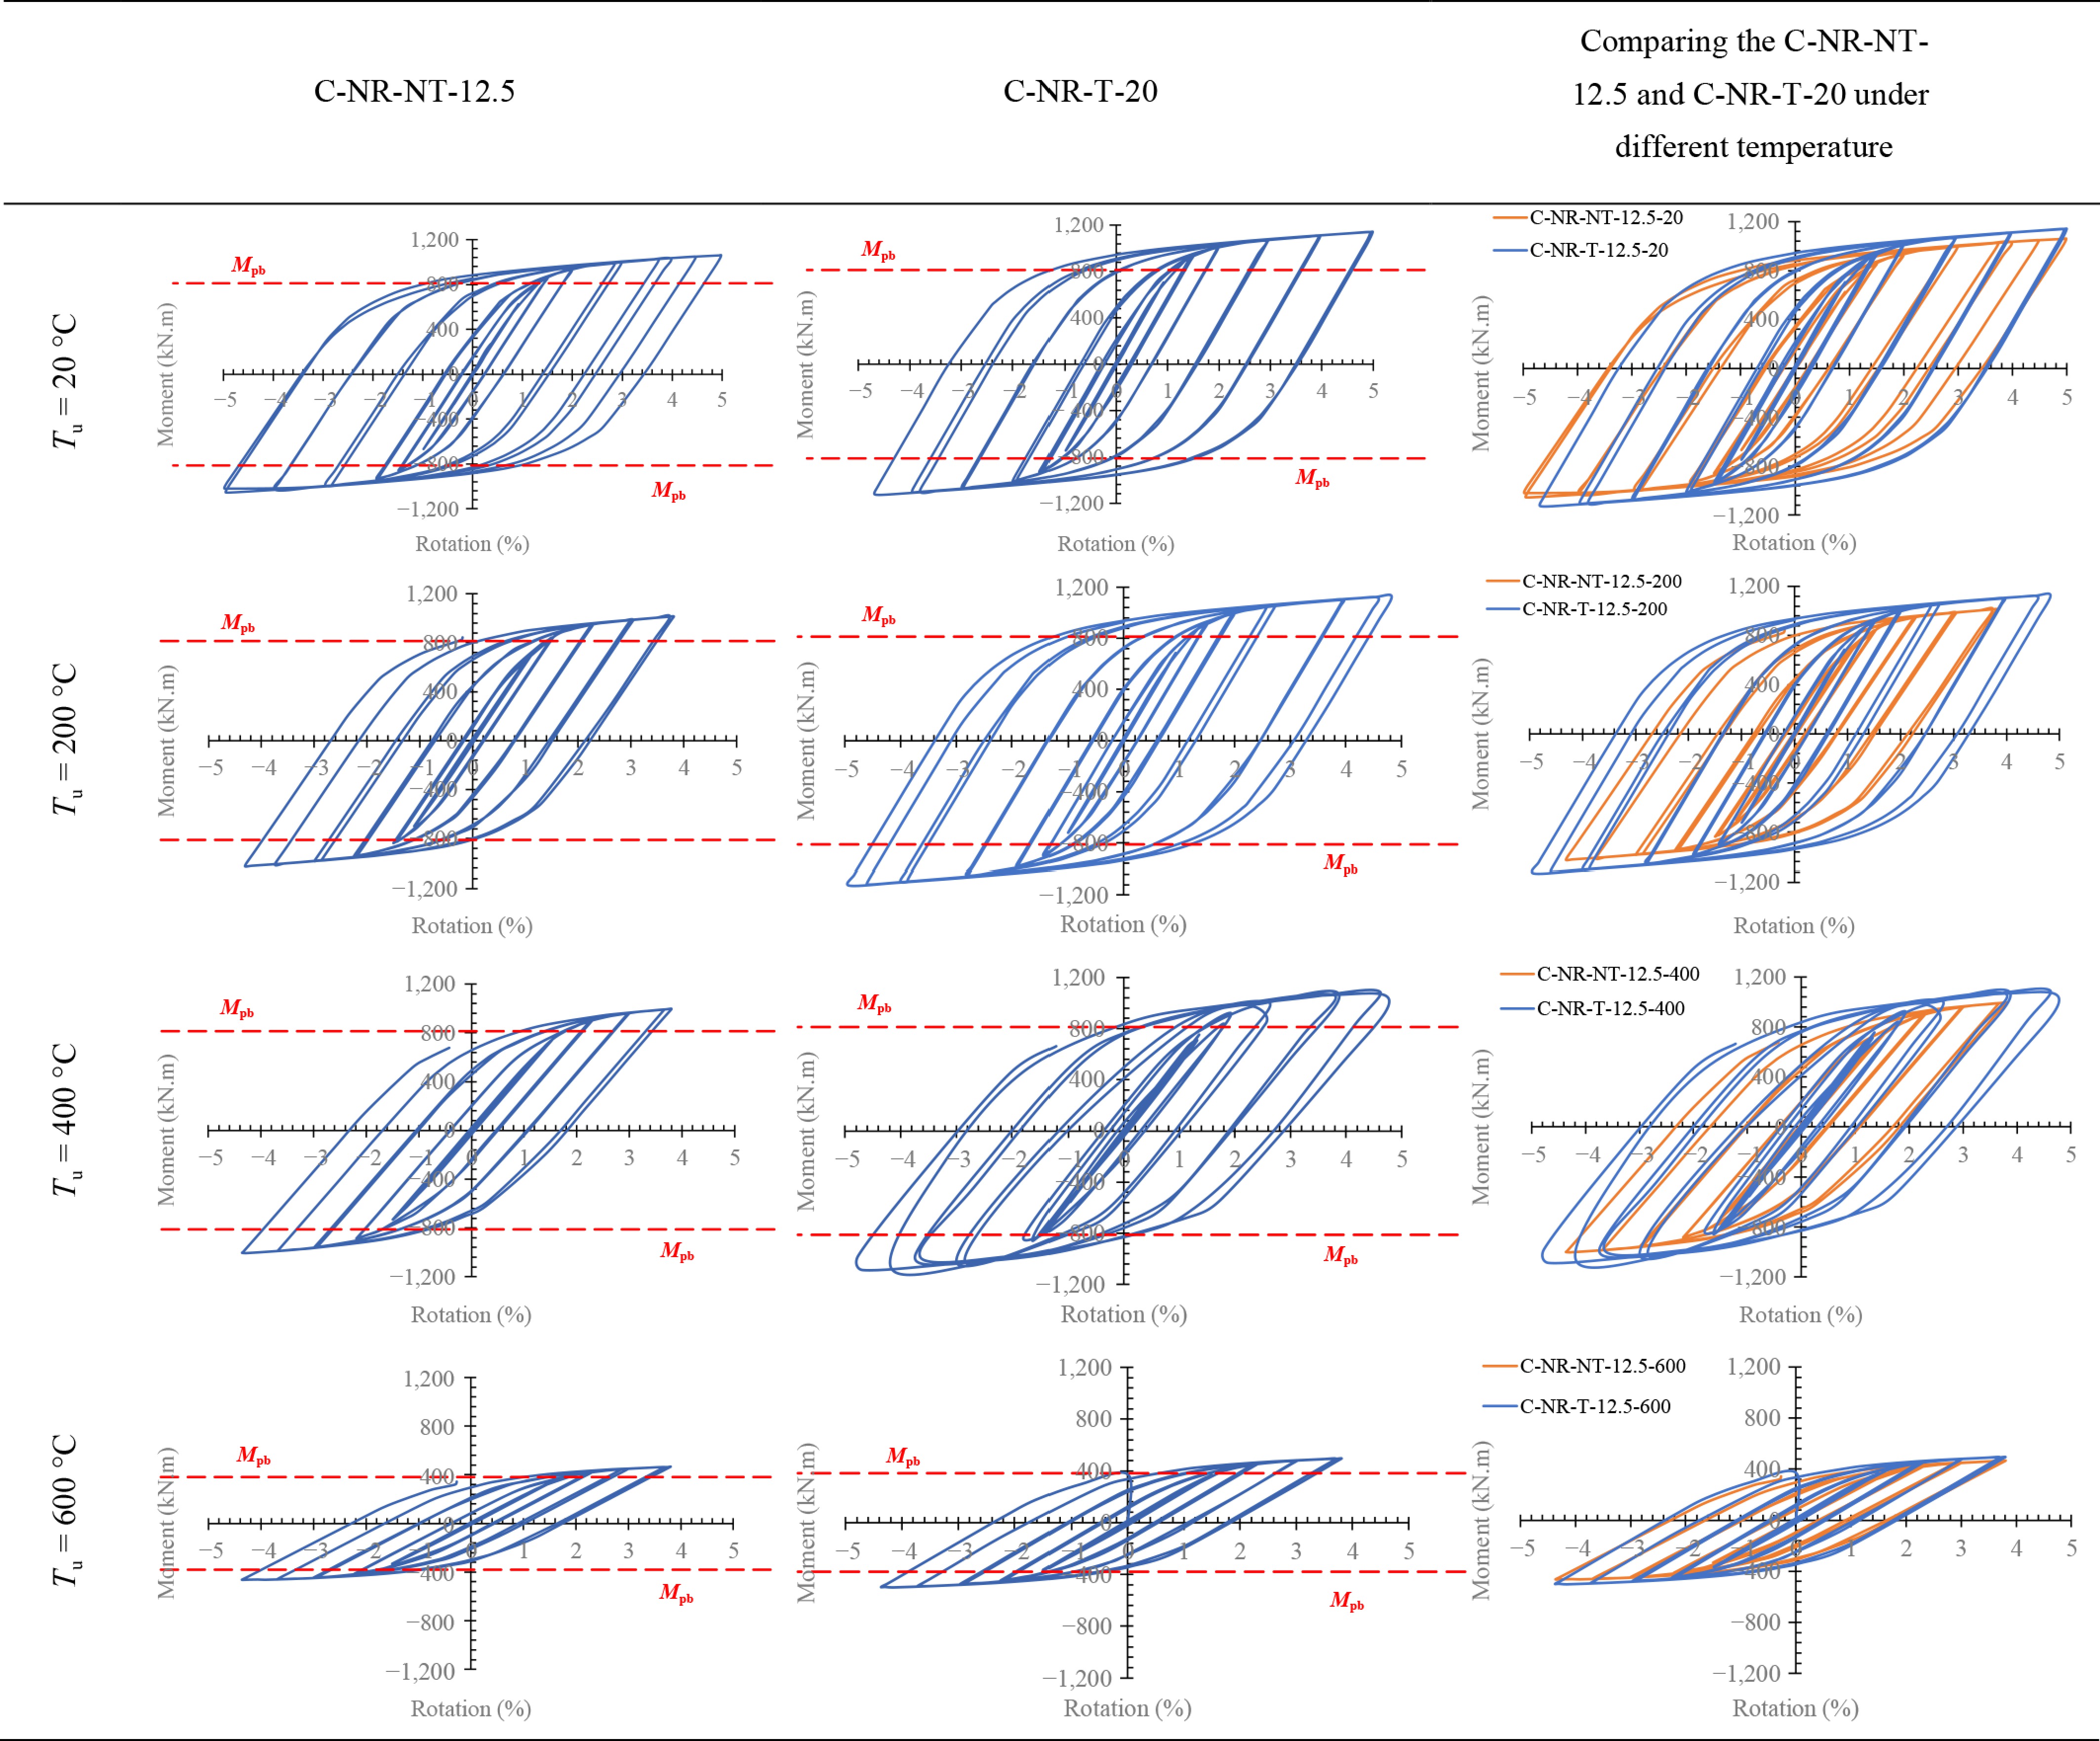
Figure 11.
ConXL connection hysteresis curves comparing the models.
-
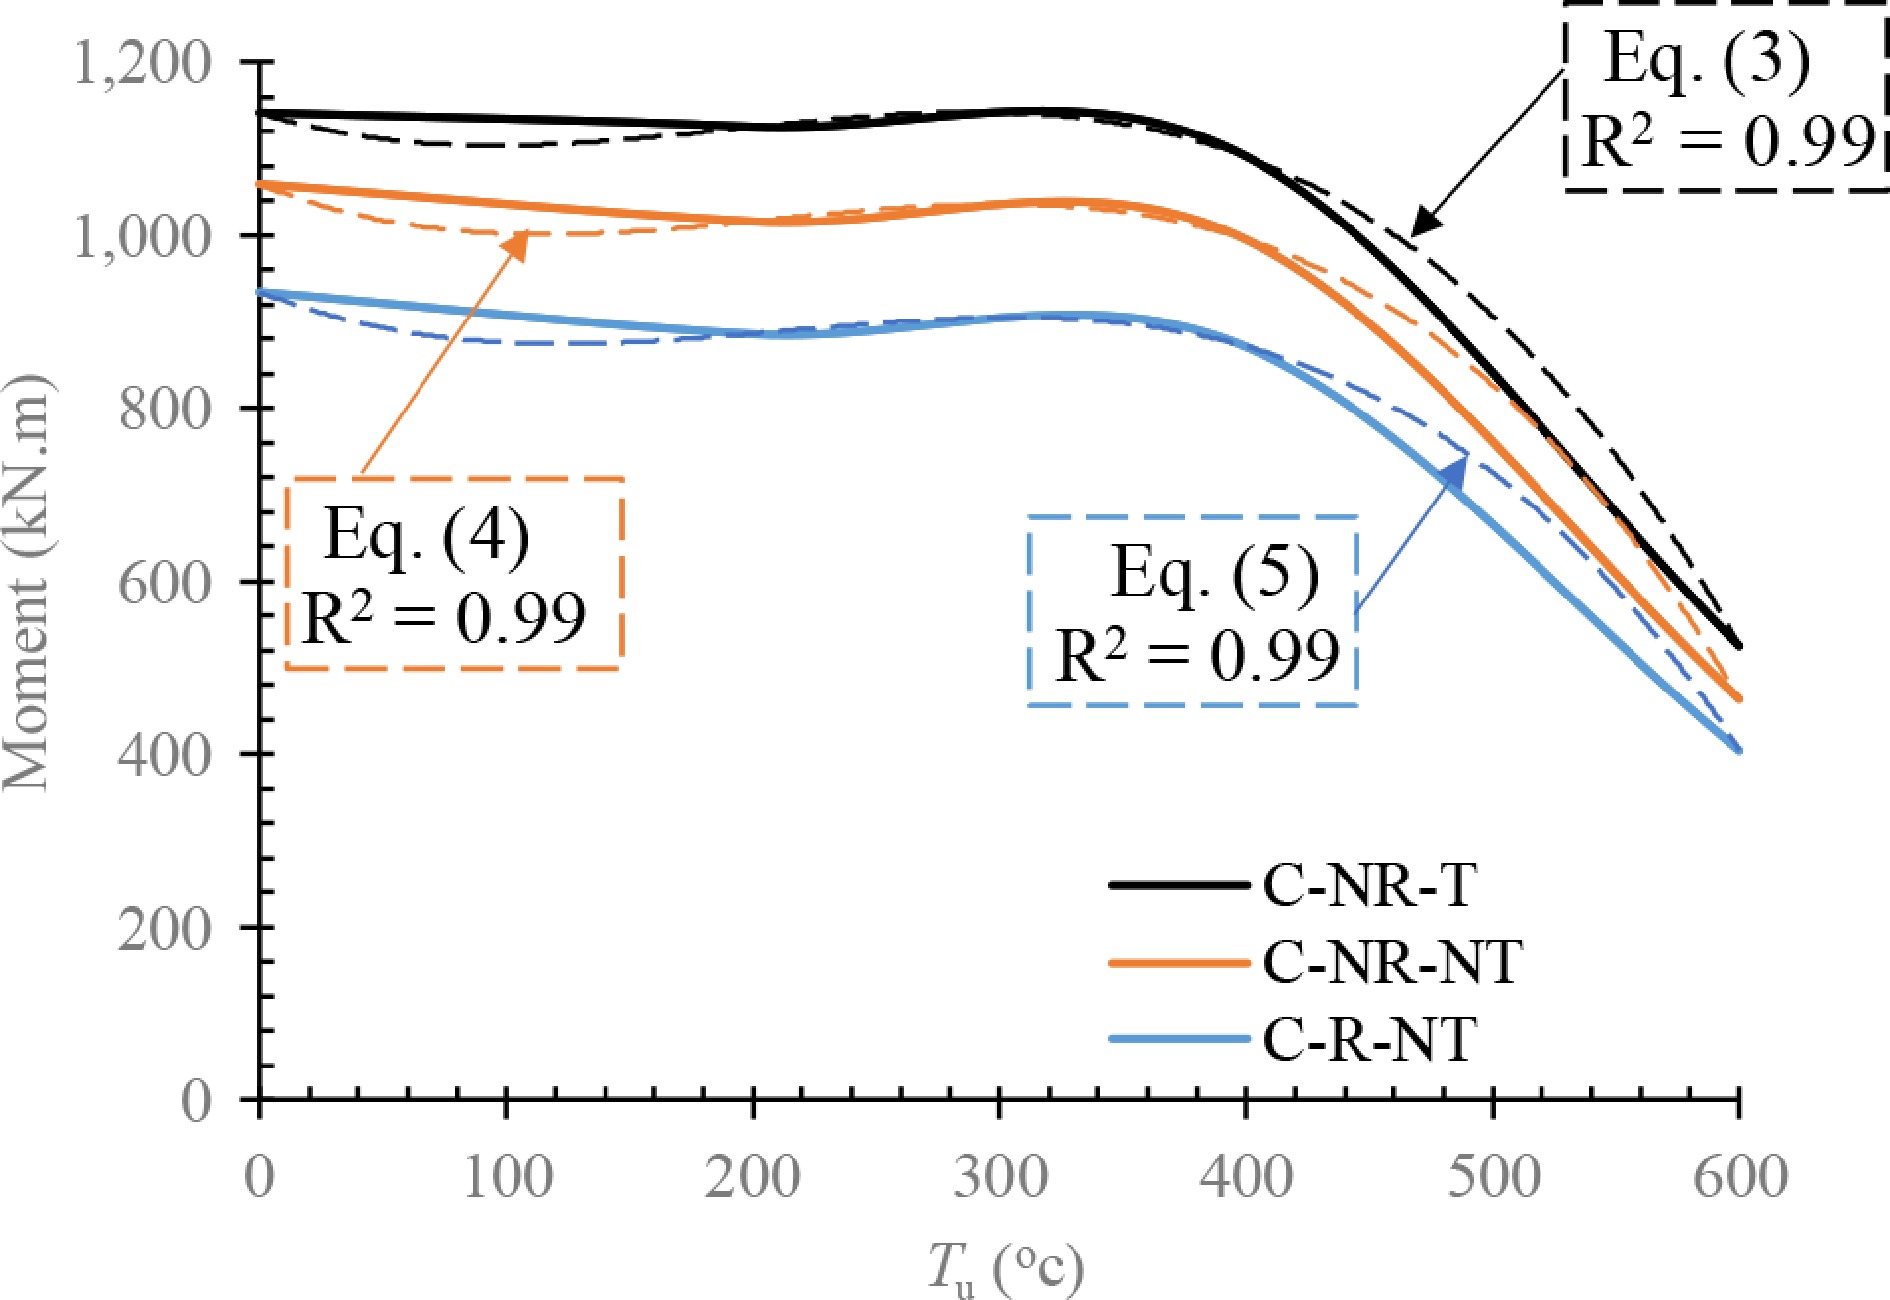
Figure 12.
Proposed equations to predict the capacity of the C-NR-T, C-NR-NT, and C-R-NT models.
-
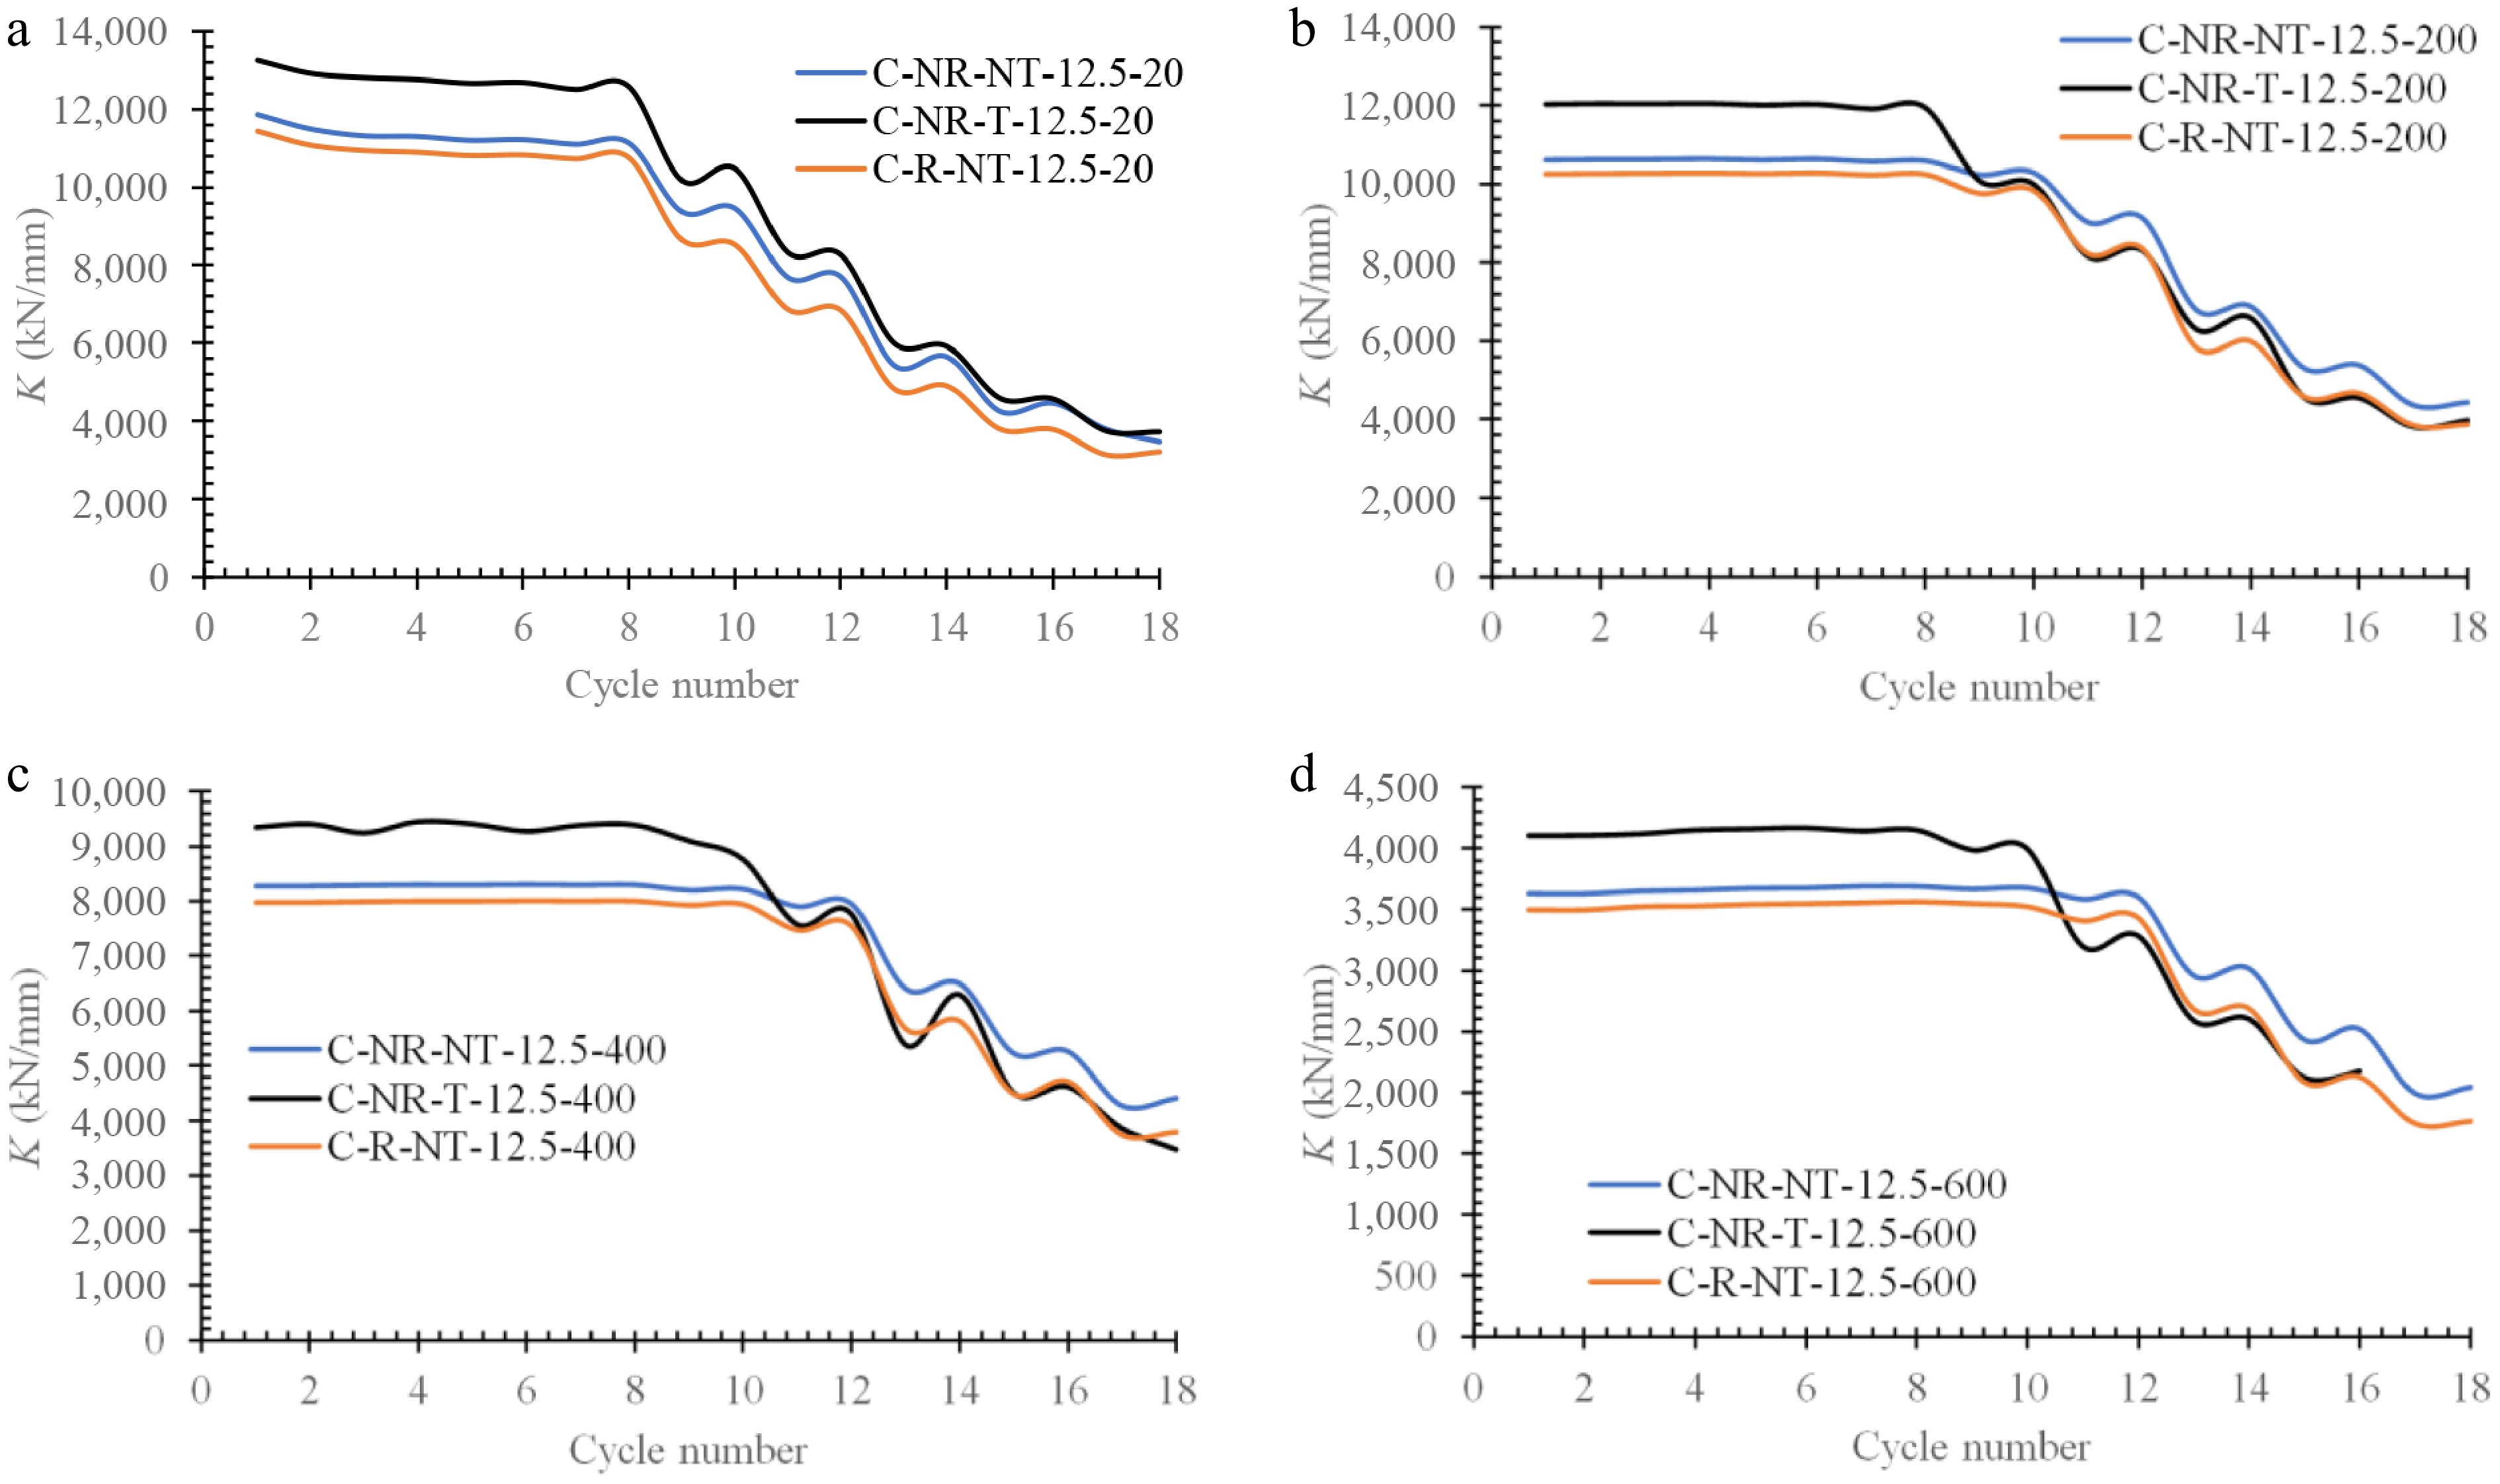
Figure 13.
Comparing the elastic stiffness of the C-NR-NT-12.5, C-NR-T-12.5, and C-R-NT-12.5 models at (a) Tu = 0 °C, (b) Tu =200 °C, (c) Tu = 400 °C, and (d) Tu = 600 °C.
-
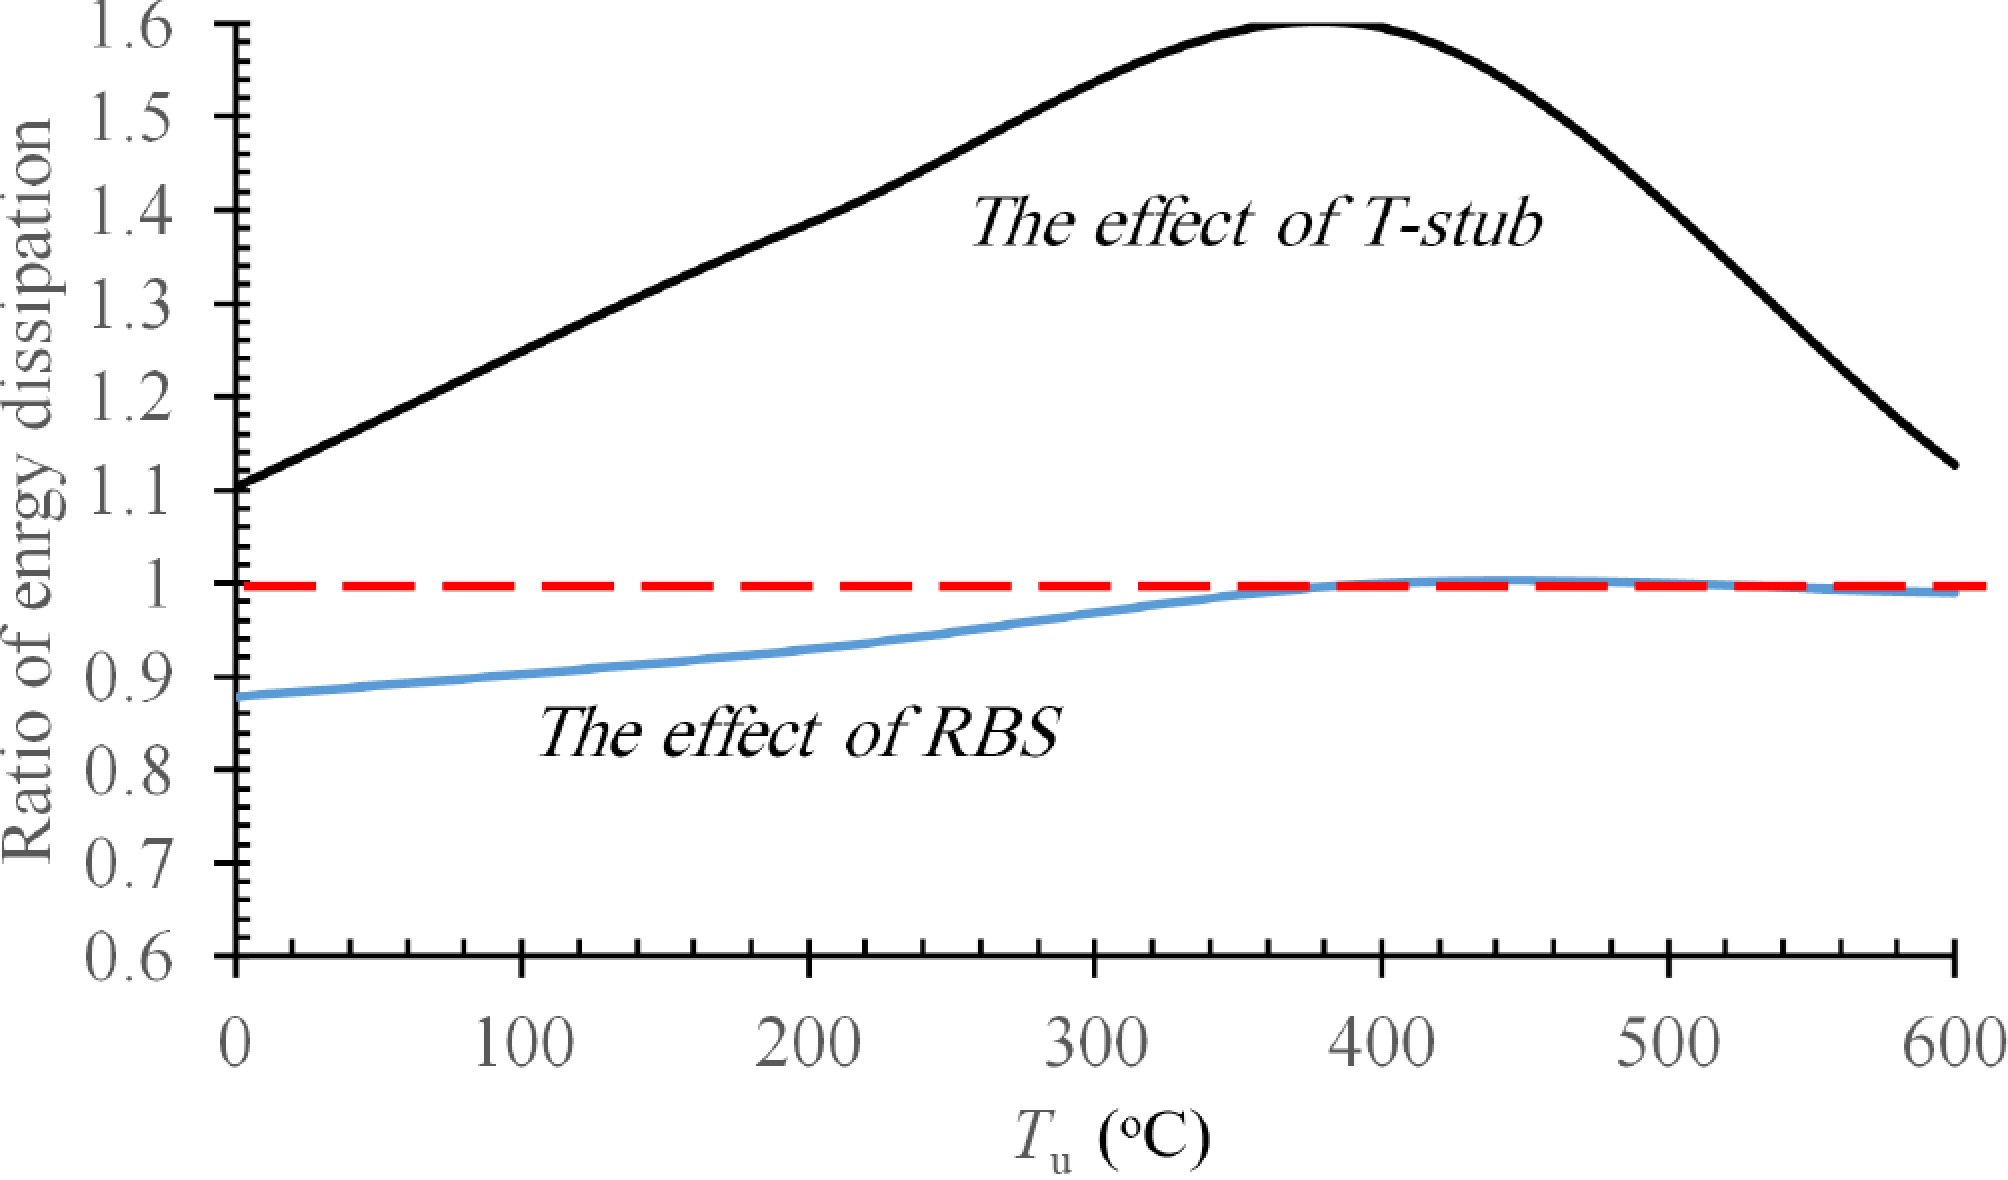
Figure 14.
Comparing the energy dissipation capacity of the models in the different temperature scenarios explored.
-
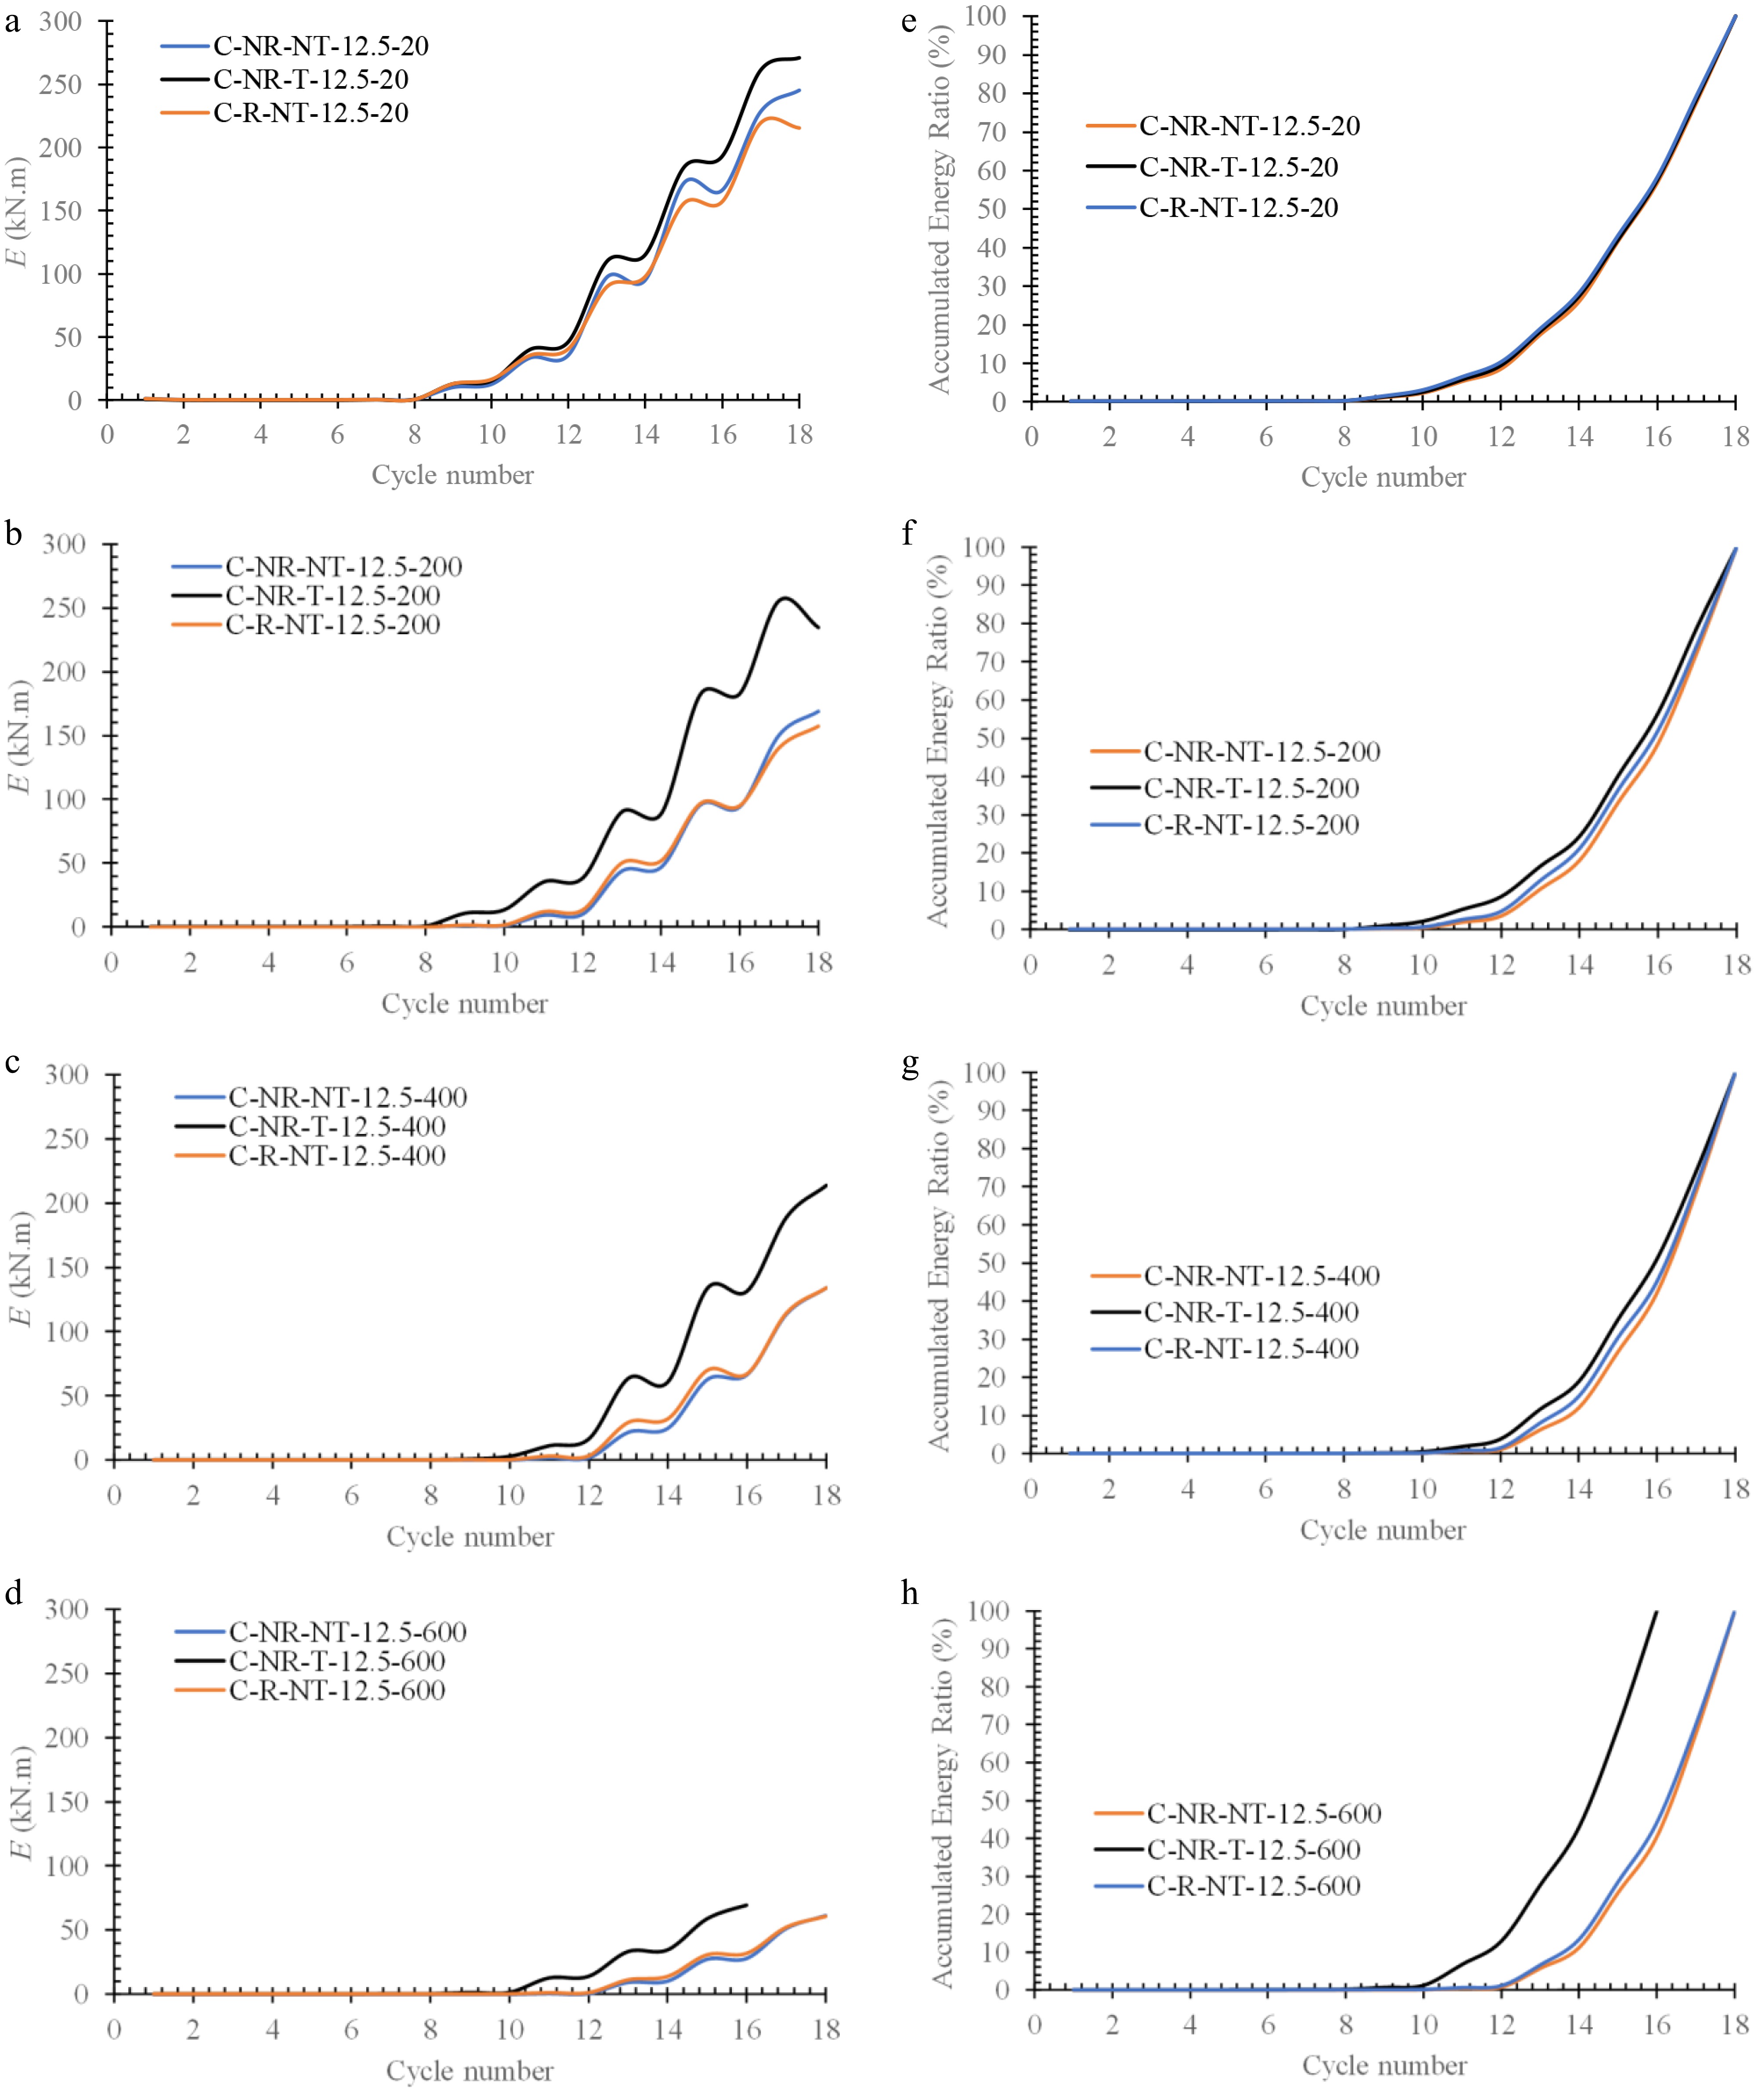
Figure 15.
Comparing the energy dissipation of the C-NR-NT-12.5, C-NR-T-12.5, and C-R-NT-12.5 models at (a) Tu = 20 °C, (b) Tu =20 °C, (c) Tu = 400 °C, (d) Tu = 600 °Cand the accumulated energy ratio of the C-NR-NT-12.5, C-NR-T-12.5, and C-R-NT-12.5 models at (e) Tu = 0 °C, (f) Tu = 200 °C, (g) Tu = 400 °C, (h) Tu = 600 °C.
-
Models Pu (kN) M (kN·m) $ \dfrac{M_{T_{\mathrm{u}}=i}}{M_{T_{\mathrm{u}}=20\; \text{°C}}} $ EModel with T/
EModel without TEModel with RBS/
EModel without RBSC-NR-T-12.5-20 652.33 1,141.6 1.00 1.08 C-NR-T-12.5-200 643.00 1,125.3 0.99 1.11 C-NR-T-12.5-400 623.23 1,090.7 0.96 1.10 C-NR-T-12.5-600 495.59 867.28 0.76 1.87 C-NR-NT-12.5-20 605.45 1,059.5 1.00 C-NR-NT-12.5-200 580.70 1,016.2 0.96 C-NR-NT-12.5-400 568.60 995.05 0.94 C-NR-NT-12.5-600 264.79 463.38 0.44 C-R-NT-12.5-20 534.29 935 1.00 0.88 C-R-NT-12.5-200 506.37 886.15 0.95 0.87 C-R-NT-12.5-400 497.95 871.42 0.93 0.88 C-R-NT-12.5-600 231.32 404.81 0.43 0.87 Table 1.
Comparing the ultimate strength of the models.
-
Models K (kN/mm) $ \dfrac{K_{T_{\mathrm{u}}=i}}{K_{T\mathrm{_u}=20\; \text{°C}}} $ EModel with T/
EModel without TEModel with RBS/
EModel without RBSC-NR-T-12.5-20 13,256 1.00 1.12 C-NR-T-12.5-200 12,034 0.91 1.13 C-NR-T-12.5-400 9,337.8 0.70 1.13 C-NR-T-12.5-600 4,102.0 0.31 1.13 C-NR-NT-12.5-20 11,850 1.00 C-NR-NT-12.5-200 10,621 0.90 C-NR-NT-12.5-400 8,266.5 0.70 C-NR-NT-12.5-600 3,630.5 0.31 C-R-NT-12.5-20 11,435 1.00 0.96 C-R-NT-12.5-200 10,246 0.90 0.96 C-R-NT-12.5-400 7,972.8 0.70 0.96 C-R-NT-12.5-600 3,498.1 0.31 0.96 Table 2.
Comparing the elastic stiffness of the models.
-
Models E (kN·m) $ \dfrac{E_{T_{\mathrm{u}}=i}}{E_{T_{\mathrm{u}}=20\; \text{°C}}} $ EModel with T/
EModel without TEModel with RBS/
EModel without RBSC-NR-T-12.5-20 270.78 1.00 1.10 C-NR-T-12.5-200 234.42 0.87 1.39 C-NR-T-12.5-400 213.99 0.79 1.60 C-NR-T-12.5-600 69.20 0.26 1.13 C-NR-NT-12.5-20 245.25 1.00 C-NR-NT-12.5-200 169.14 0.69 C-NR-NT-12.5-400 134.14 0.55 C-NR-NT-12.5-600 61.37 0.25 C-R-NT-12.5-20 215.51 1.00 0.88 C-R-NT-12.5-200 157.23 0.73 0.93 C-R-NT-12.5-400 134.18 0.62 1.00 C-R-NT-12.5-600 60.78 0.28 0.99 Table 3.
Comparing the energy dissipation of the models.
Figures
(15)
Tables
(3)