-
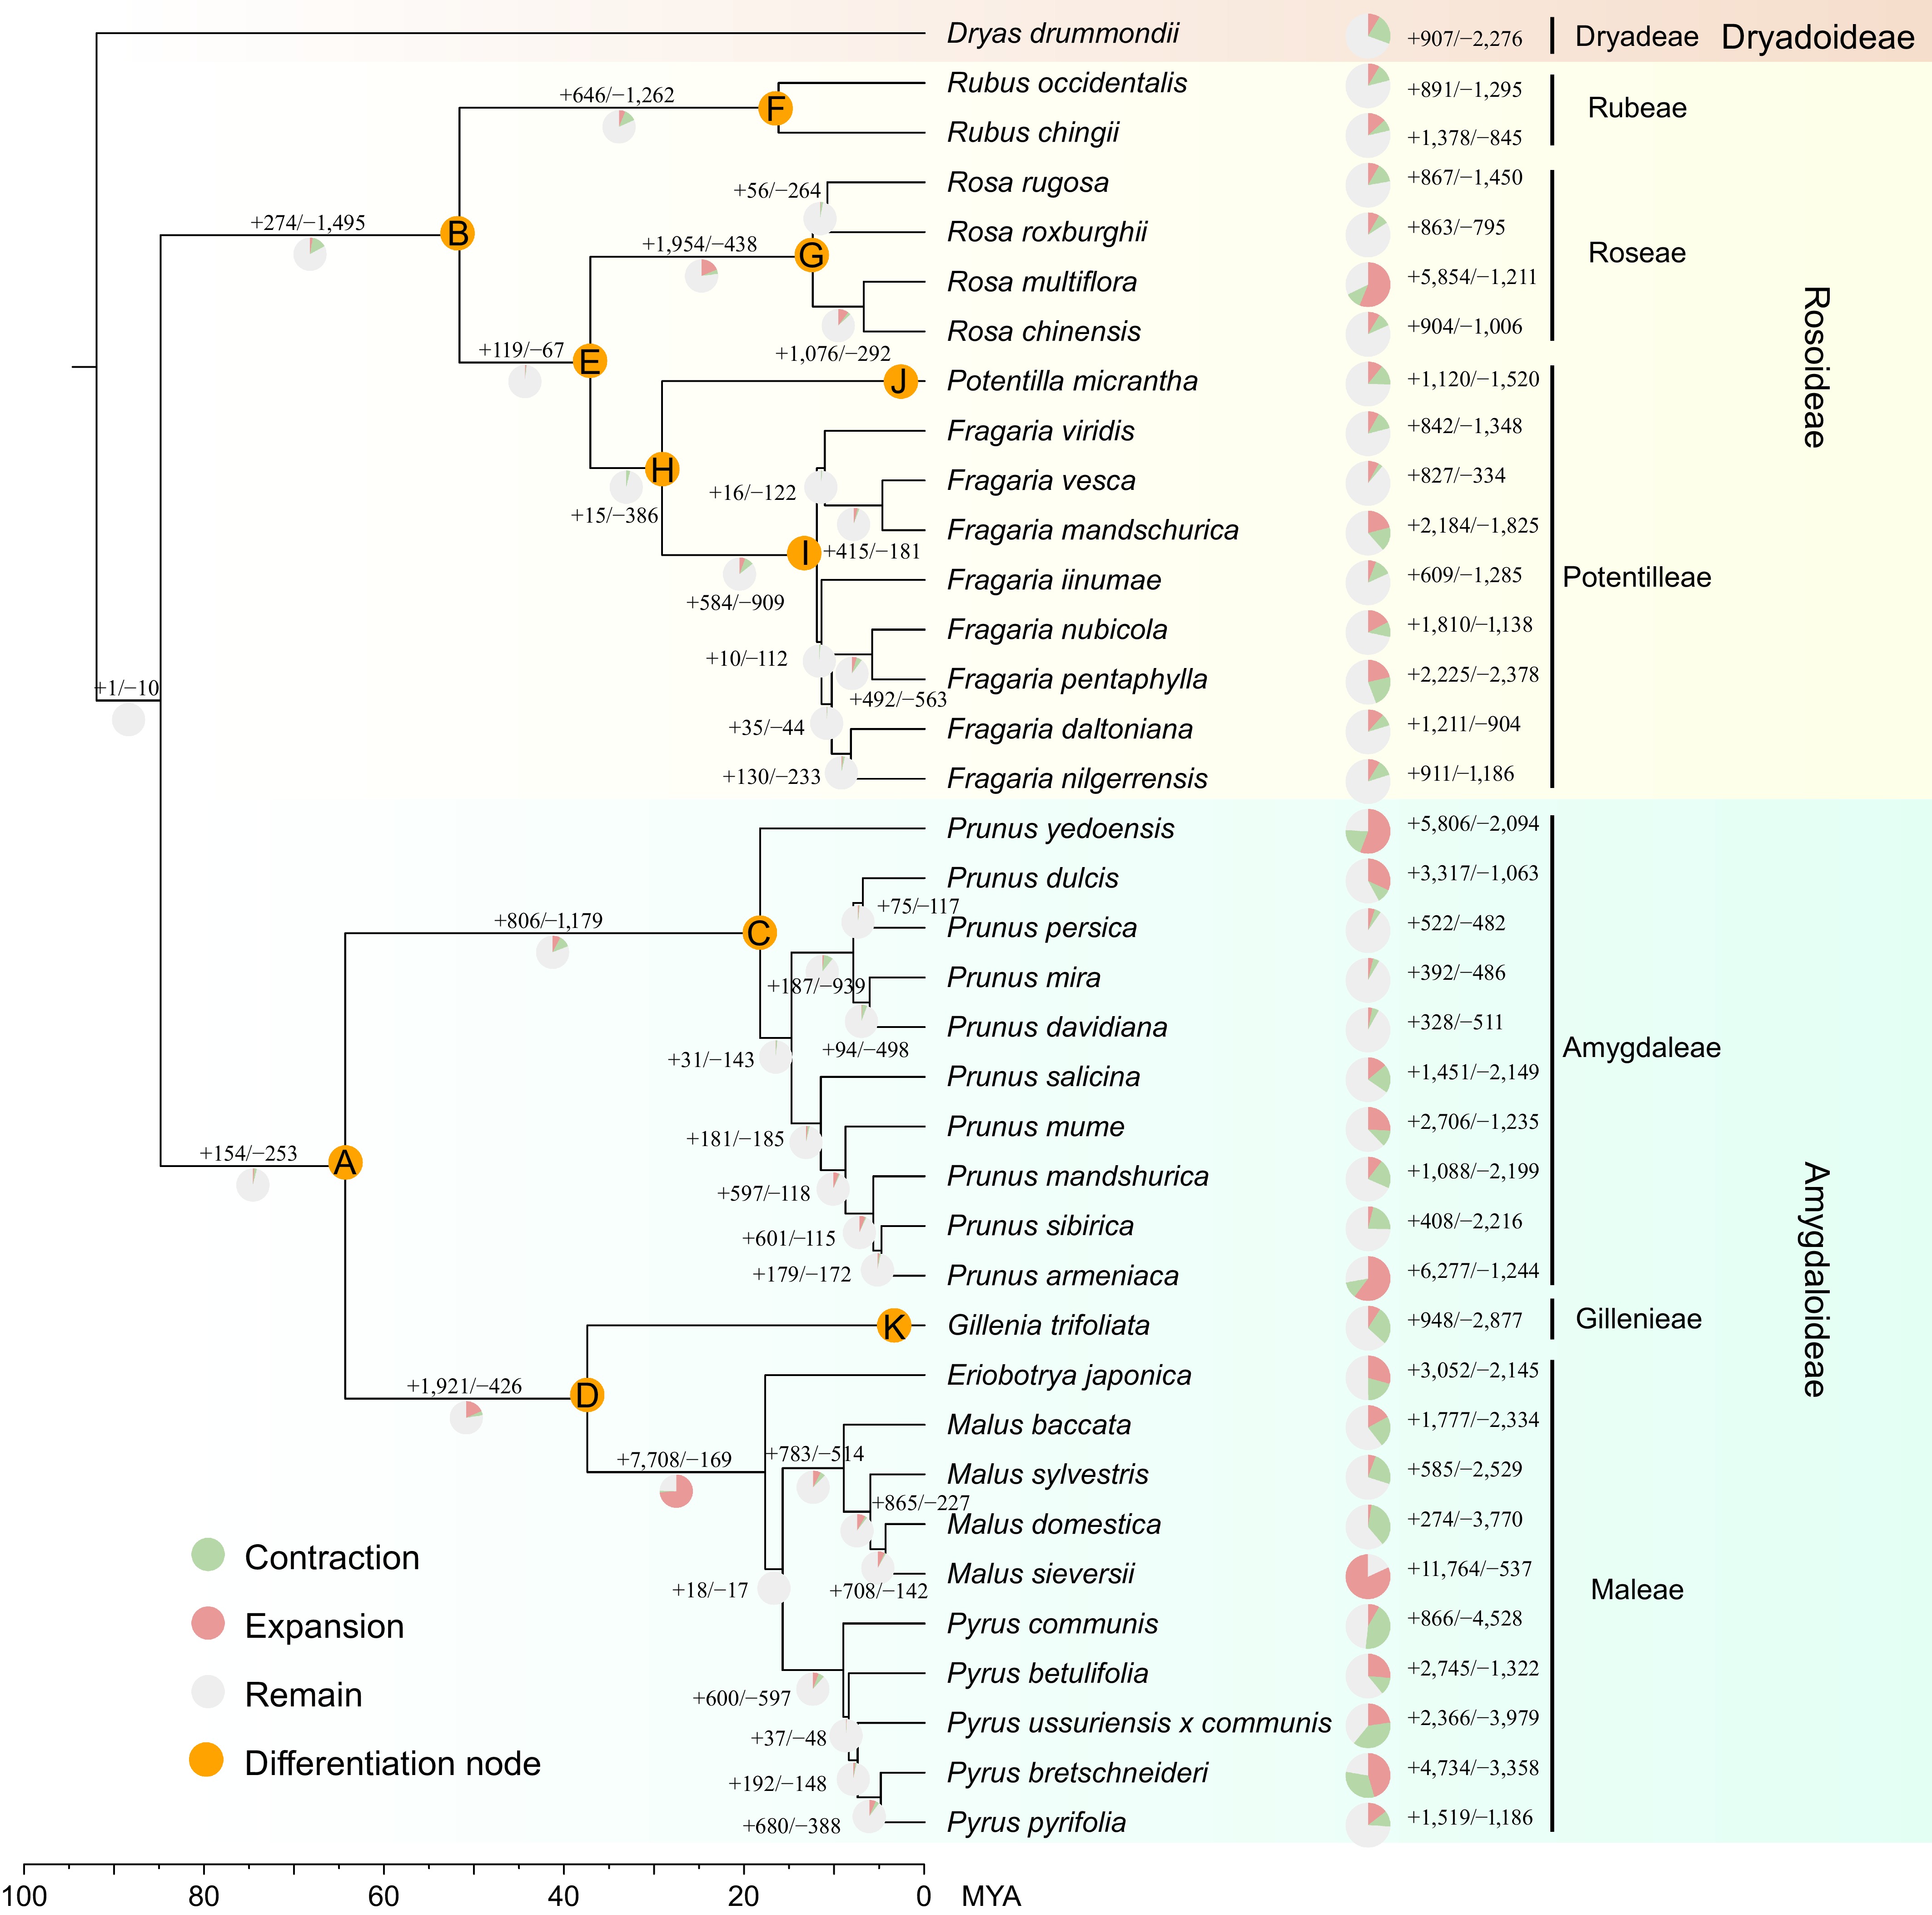
Figure 1.
Phylogeny and gene family expansion/contraction analysis in 37 Rosaceae species.
-
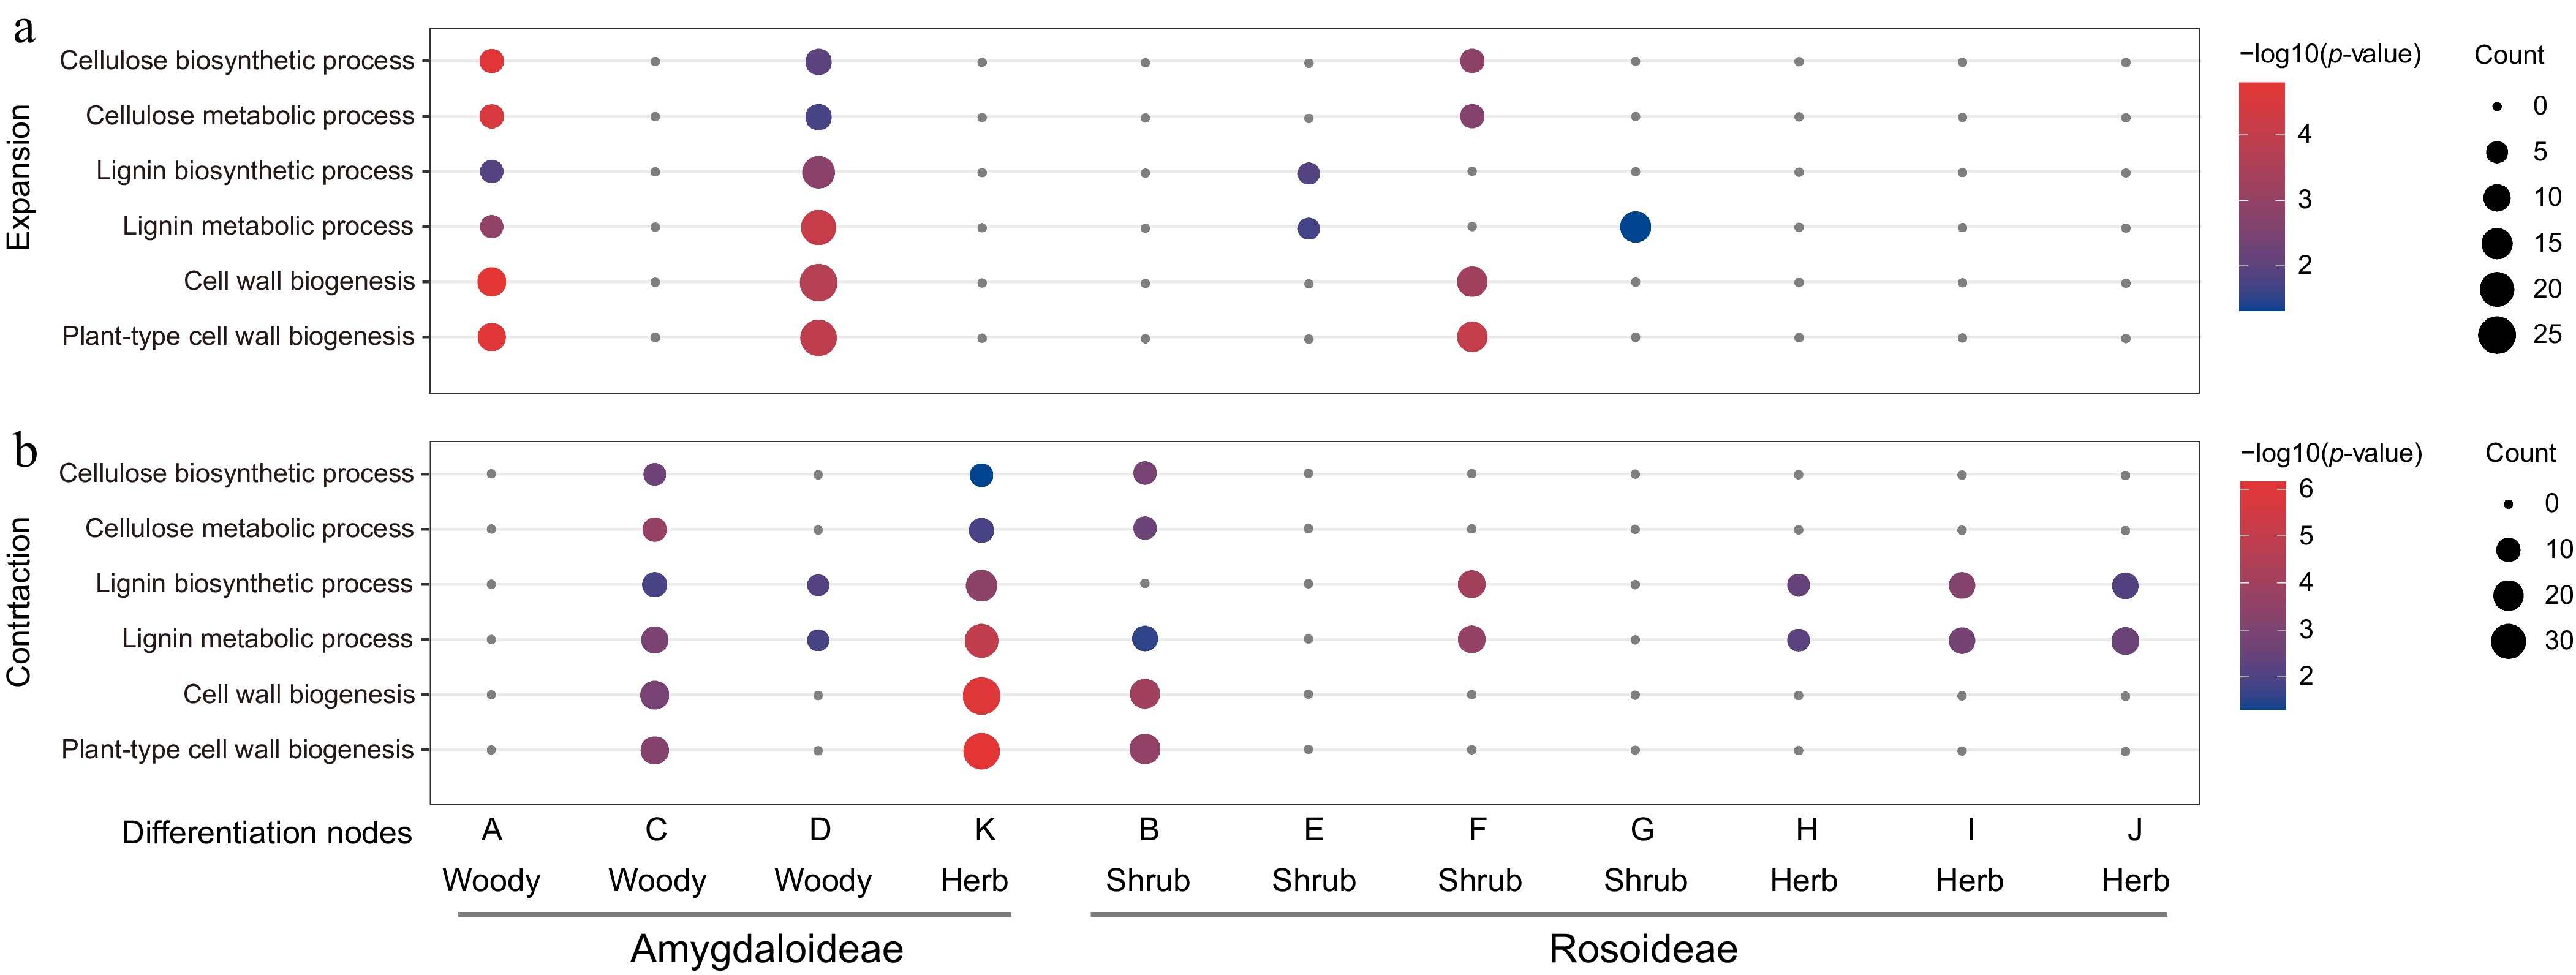
Figure 2.
GO enrichment analysis of (a) expanded, and (b) contracted gene families at 11 key evolutionary nodes on the Rosaceae phylogenetic tree.
-
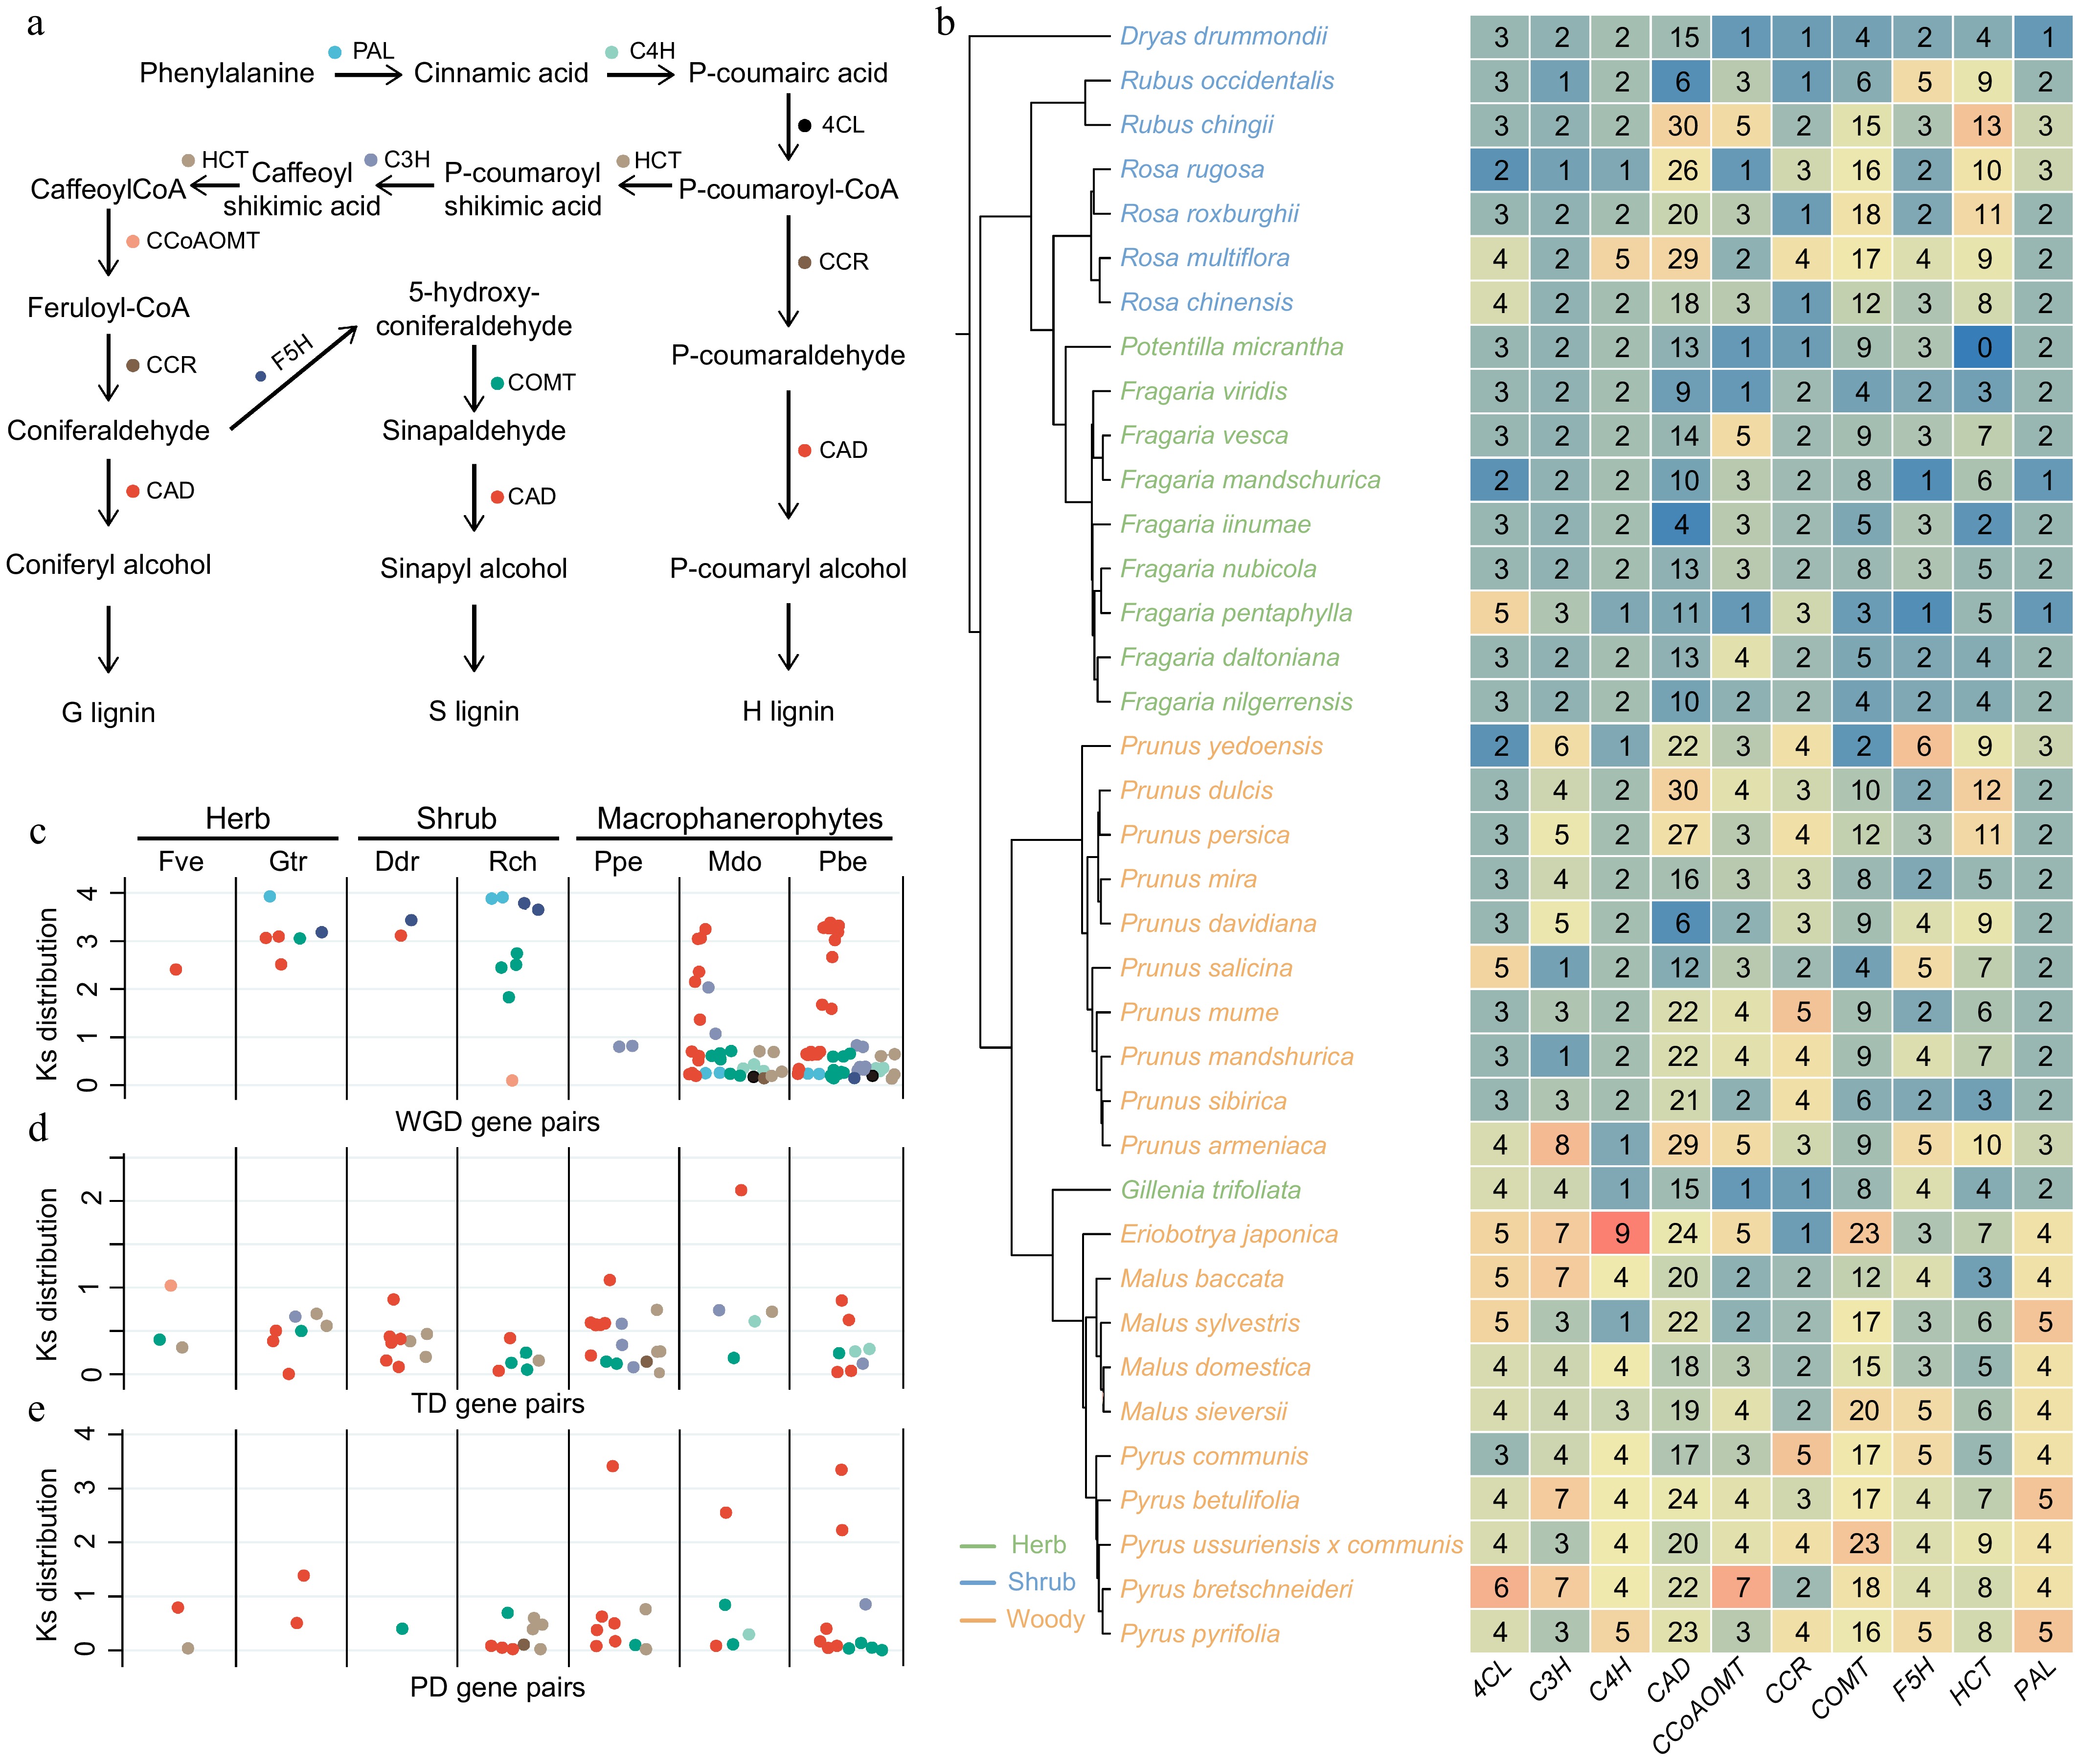
Figure 3.
Expansion of lignin biosynthesis genes in woody Rosaceae species is driven by recent duplication events. (a) Schematic diagram of the lignin biosynthesis pathway in plants. (b) Gene copy number variation in the lignin biosynthesis pathway across 37 Rosaceae species. The plants used in this study were all diploid. The color of labels represent different plant life forms. PAL, phenylalanine ammonia lyase; C4H, cinnamate-4-hydroxylase; 4CL, 4-coumarate:CoA ligase; HCT, hydroxycinnamoyl-CoA:shikimate/quinate hydroxycinnamoyltransferase; C3H, p-coumaroyl shikimate 3′-hydroxylase/coumaroyl 3-hydroxylase; CCoAOMT, trans-caffeoyl-CoA 3-O-methyltransferase; CCR, cinnamoyl-CoA reductase; F5H, ferulate 5-hydroxylase; COMT, caffeic acid 3-O-methyltransferase; CAD, cinnamyl alcohol dehydrogenase. C, D, E: Comparison of (c) whole-genome duplication, (d) tandem duplication, and (e) proximal duplication events for genes in the lignin biosynthesis pathway. The color of each point corresponds to the gene color in (a).
-
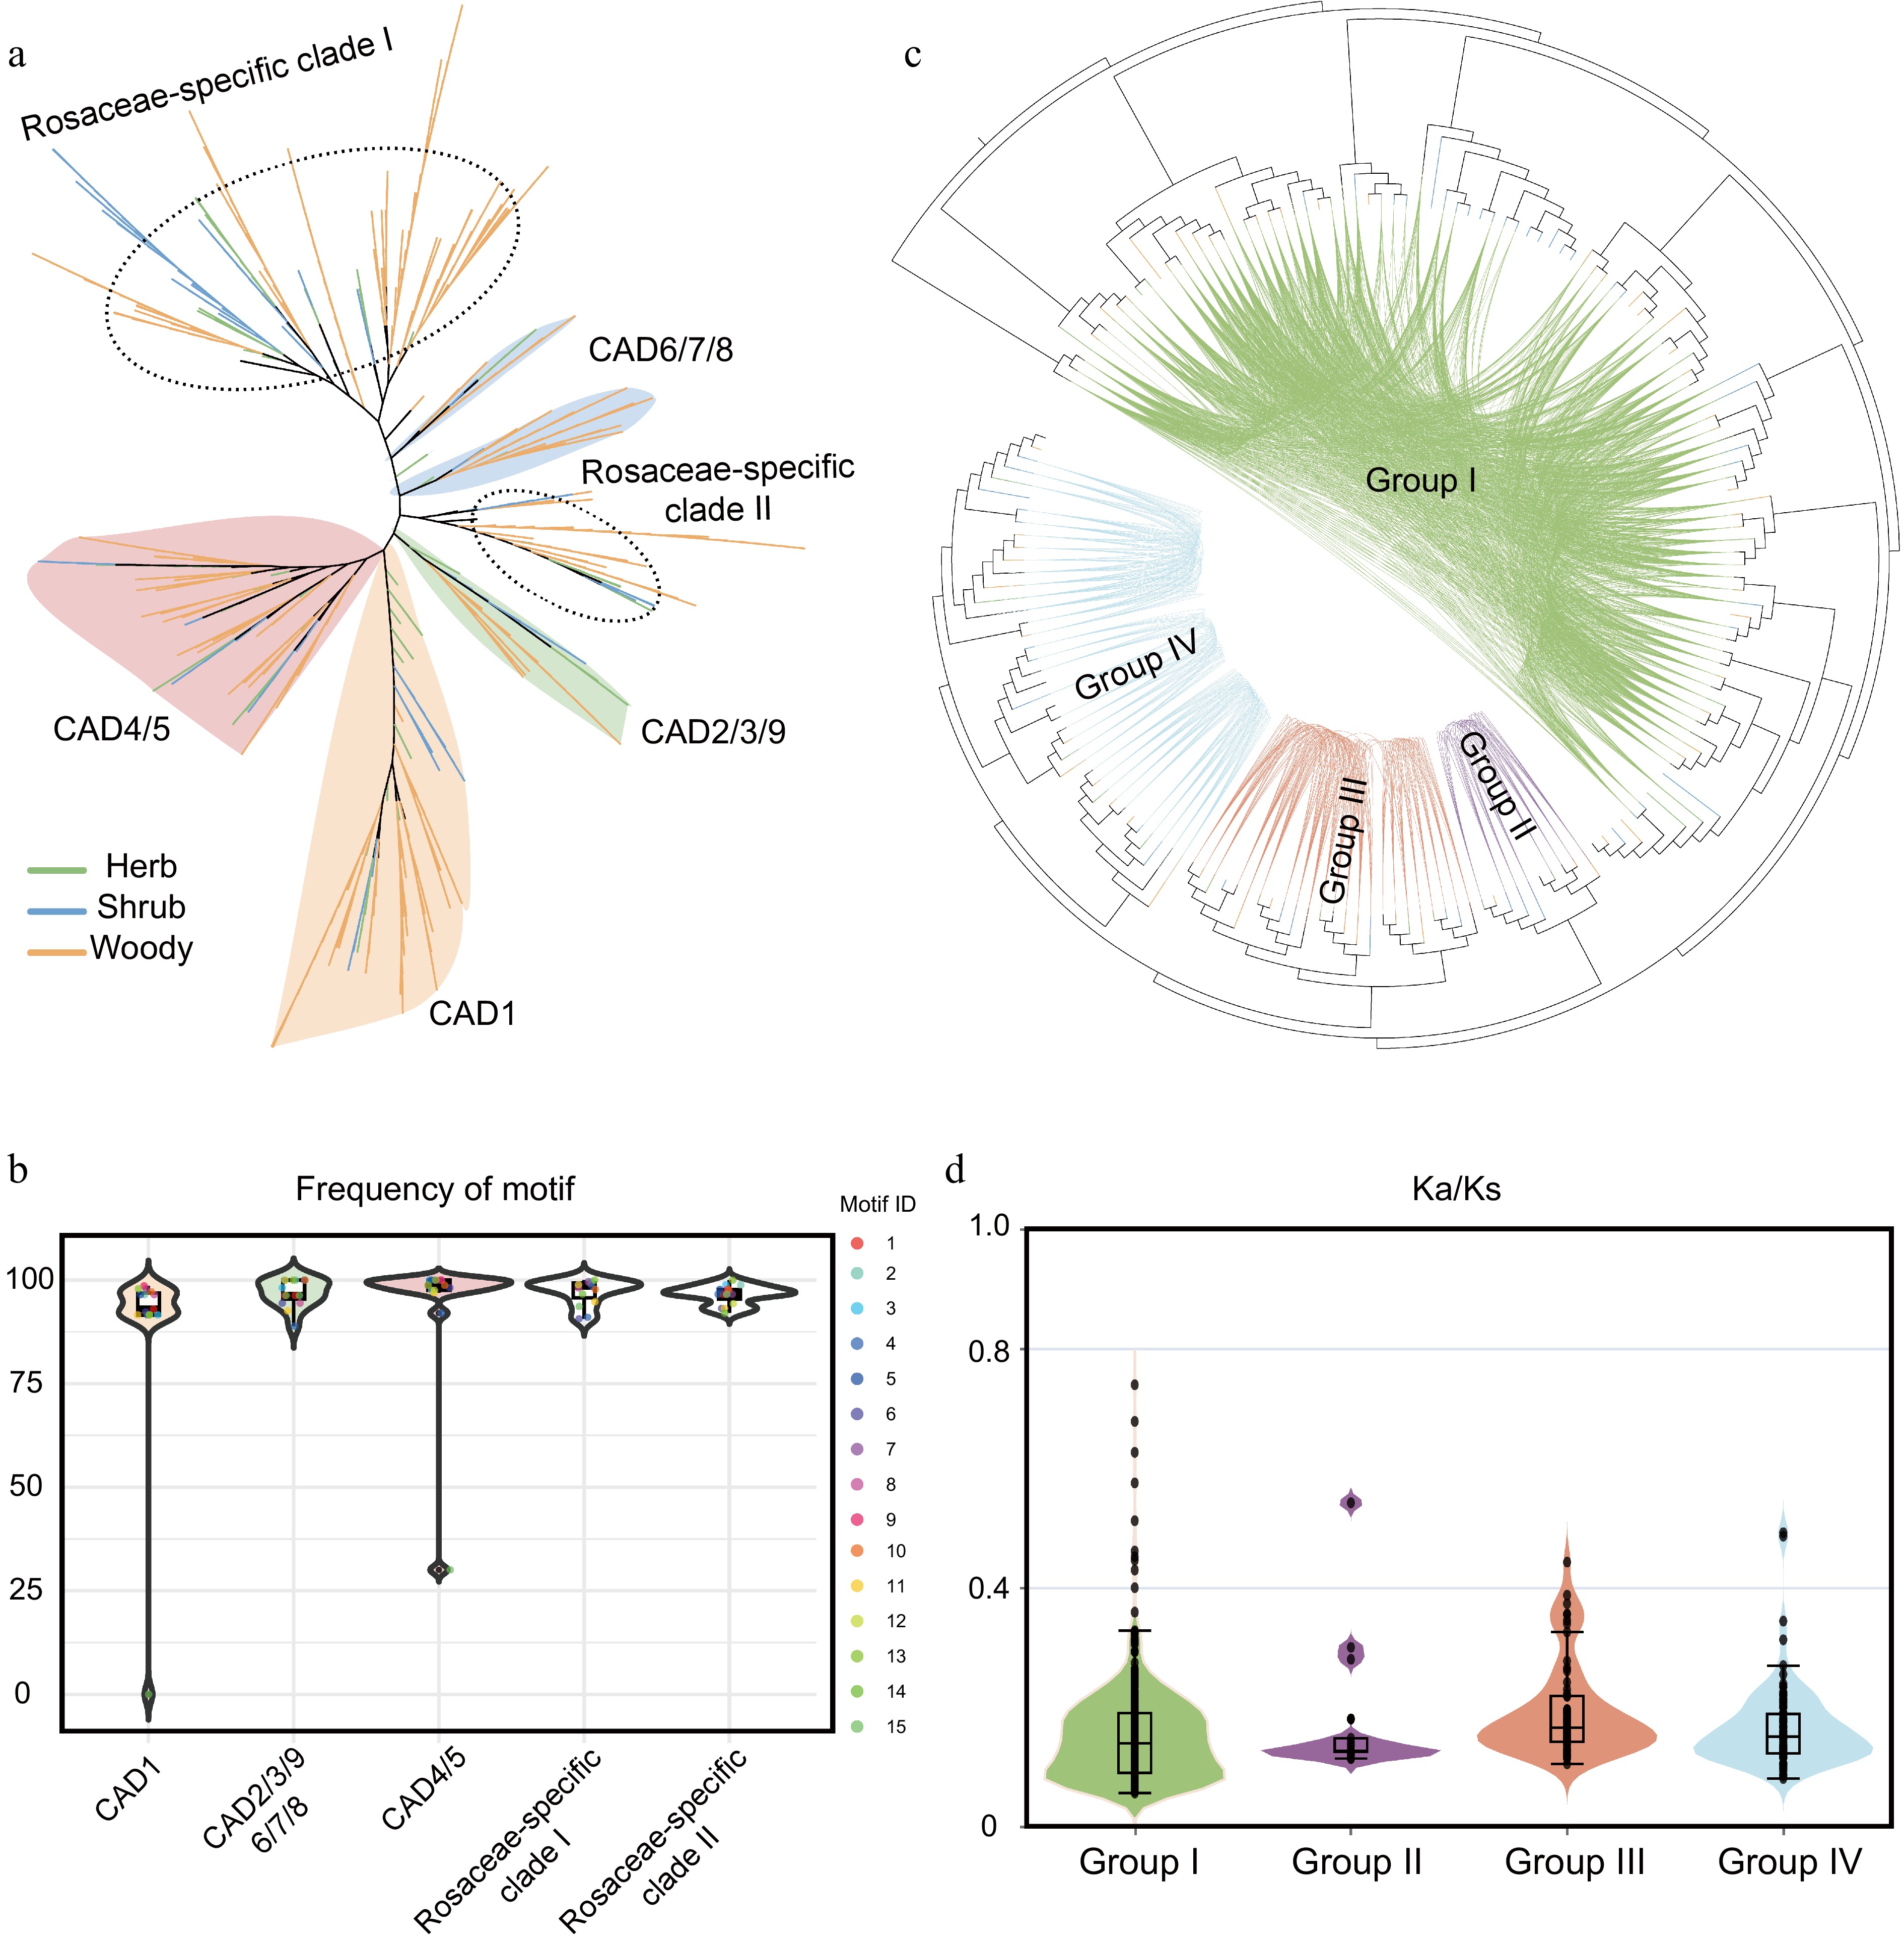
Figure 4.
Phylogenetic history and selection pressure of the CAD gene family in Rosaceae. (a) Phylogenetic analysis of CAD gene family members from 37 Rosaceae species. Distinct background colors represent different clades, while branch colors indicate distinct life-form plant groups. (b) Motif frequency distribution across different evolutionary clades. Background colors indicate phylogenetic clades. (c) Syntenic network analysis of CAD members in Rosaceae. (d) Ka/Ks analysis of gene pairs within the four gene clusters. Background colors correspond to the group colors in (c).
-
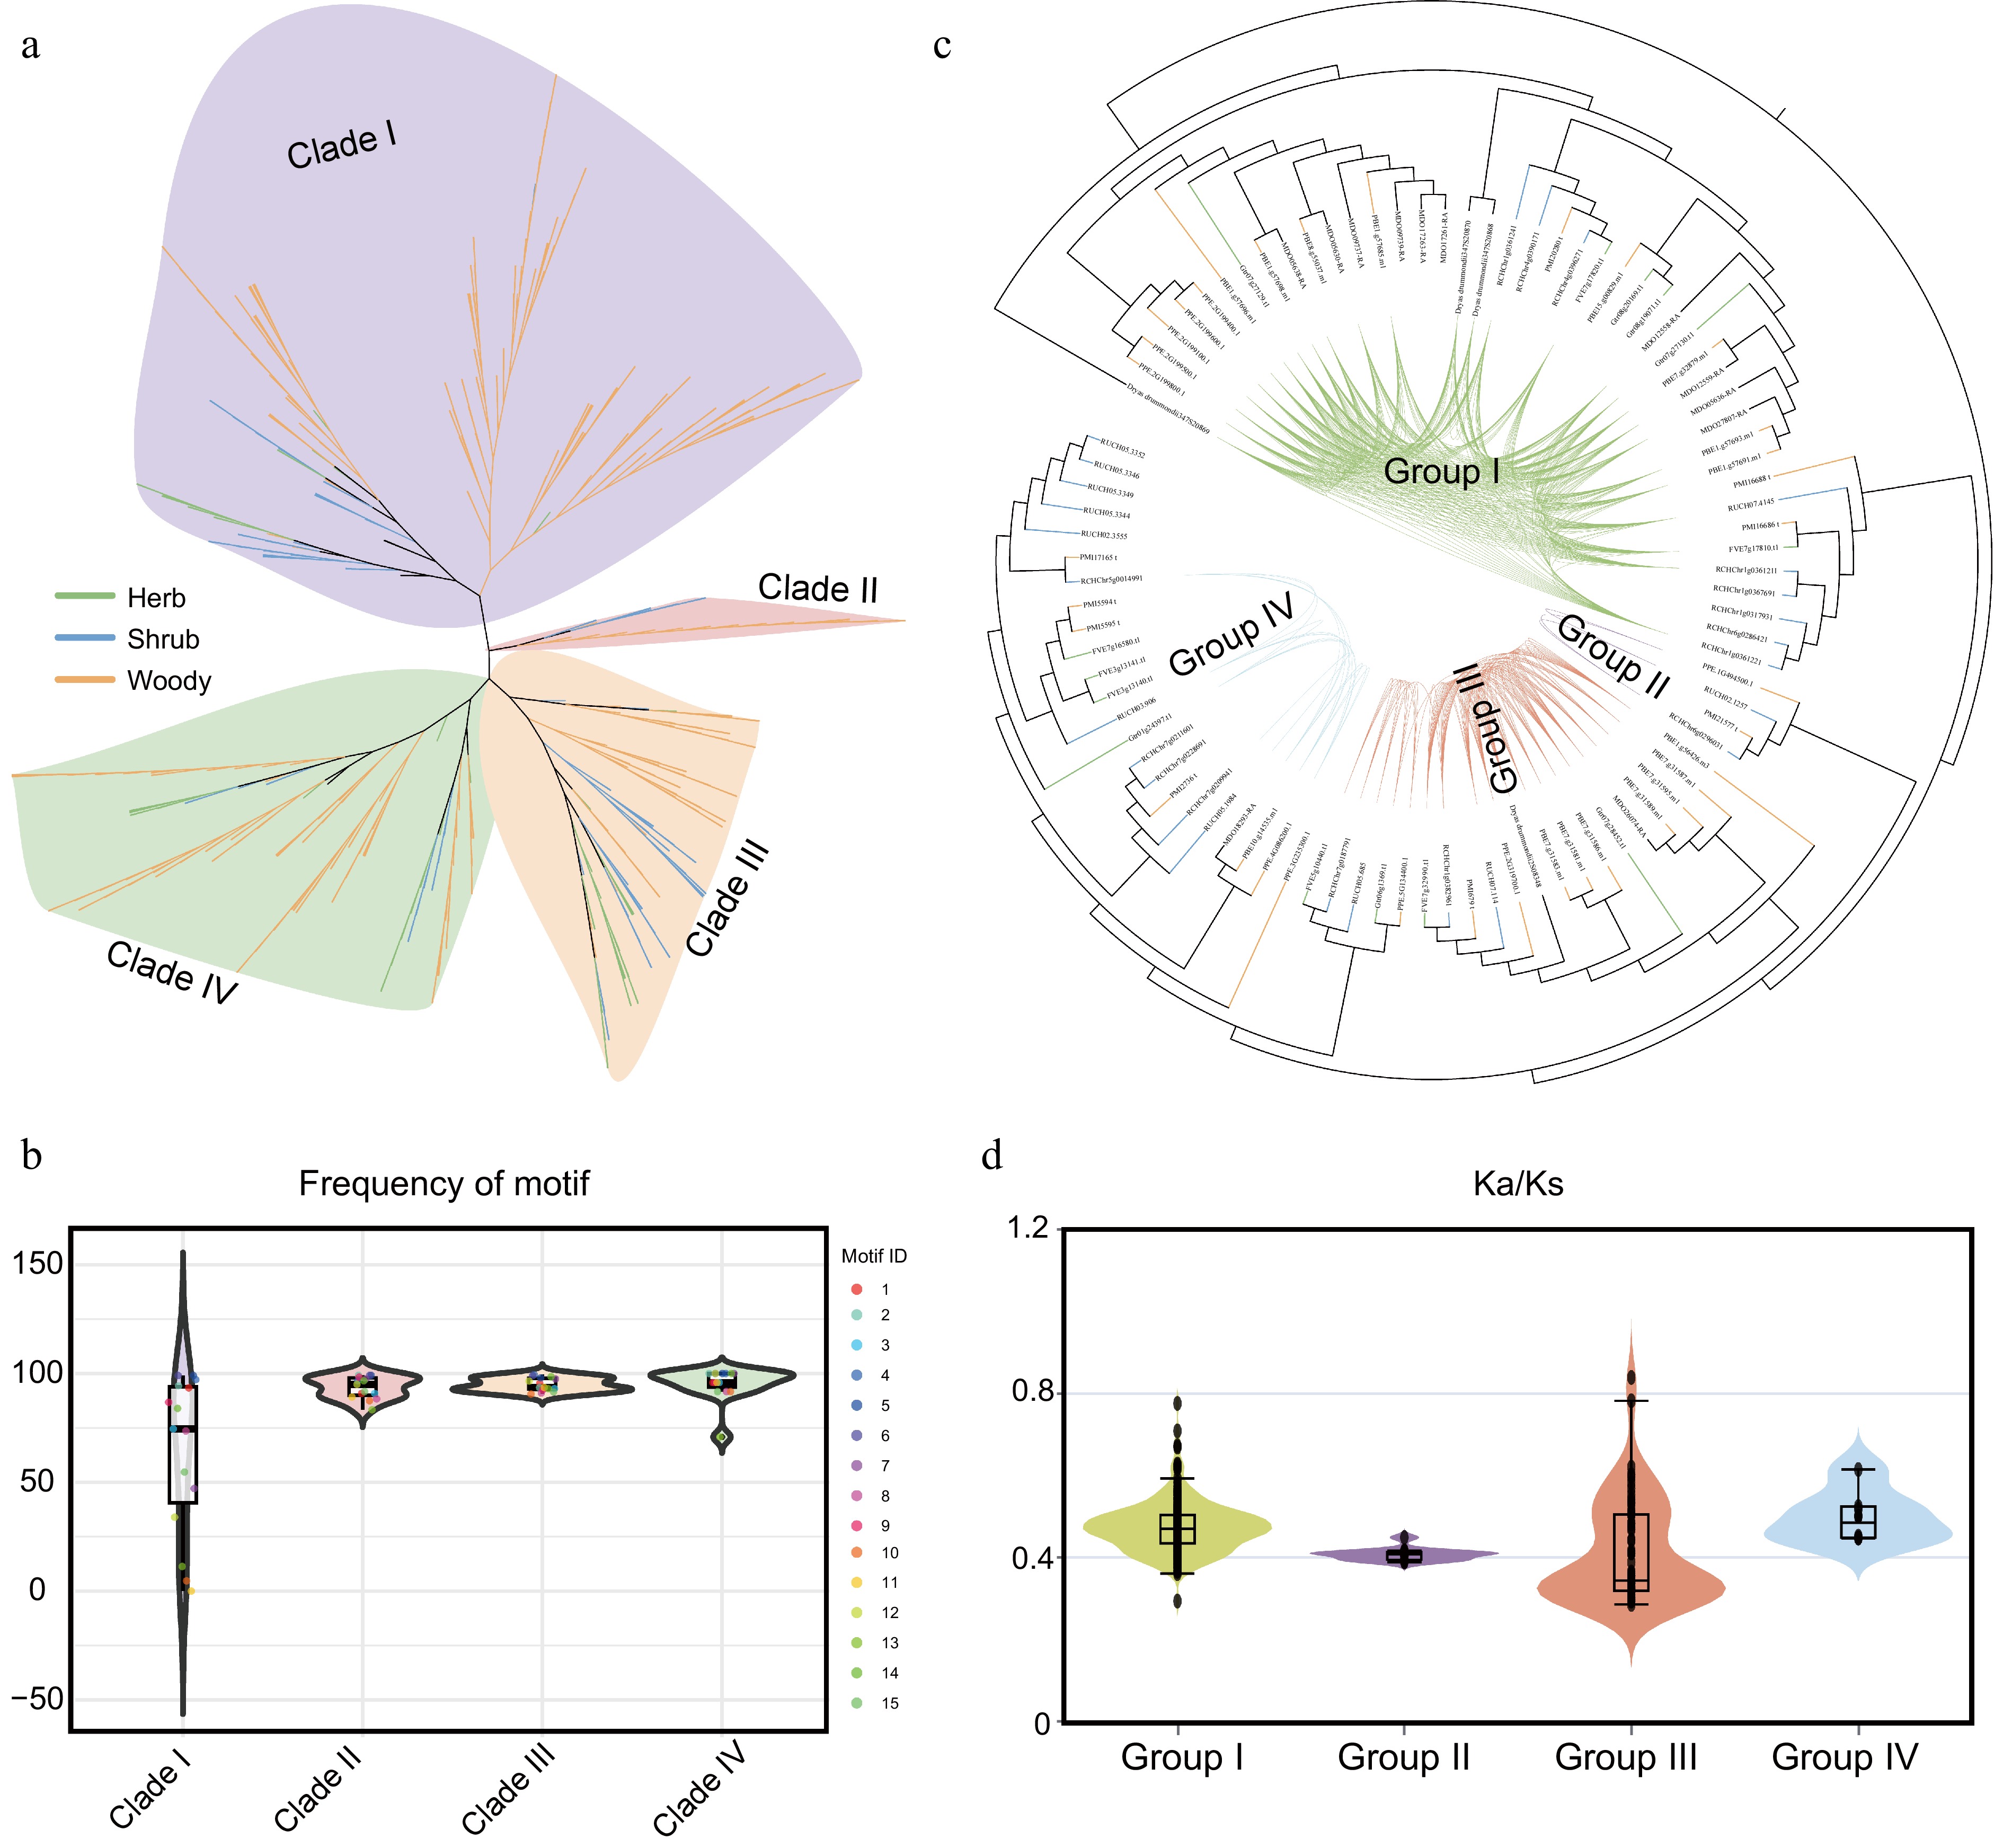
Figure 5.
Structural and evolutionary dynamics of the COMT gene family in Rosaceae. (a) Phylogenetic analysis of COMT gene family members from 37 Rosaceae species. Distinct background colors represent different clades, while branch colors indicate distinct life-form plant groups. (b) Motif frequency distribution across different evolutionary clades. Background colors indicate phylogenetic clades. (c) Syntenic network analysis of COMT members in Rosaceae. (d) Ka/Ks analysis of gene pairs within the four gene clusters. Background colors correspond to the group colors in (c).
-
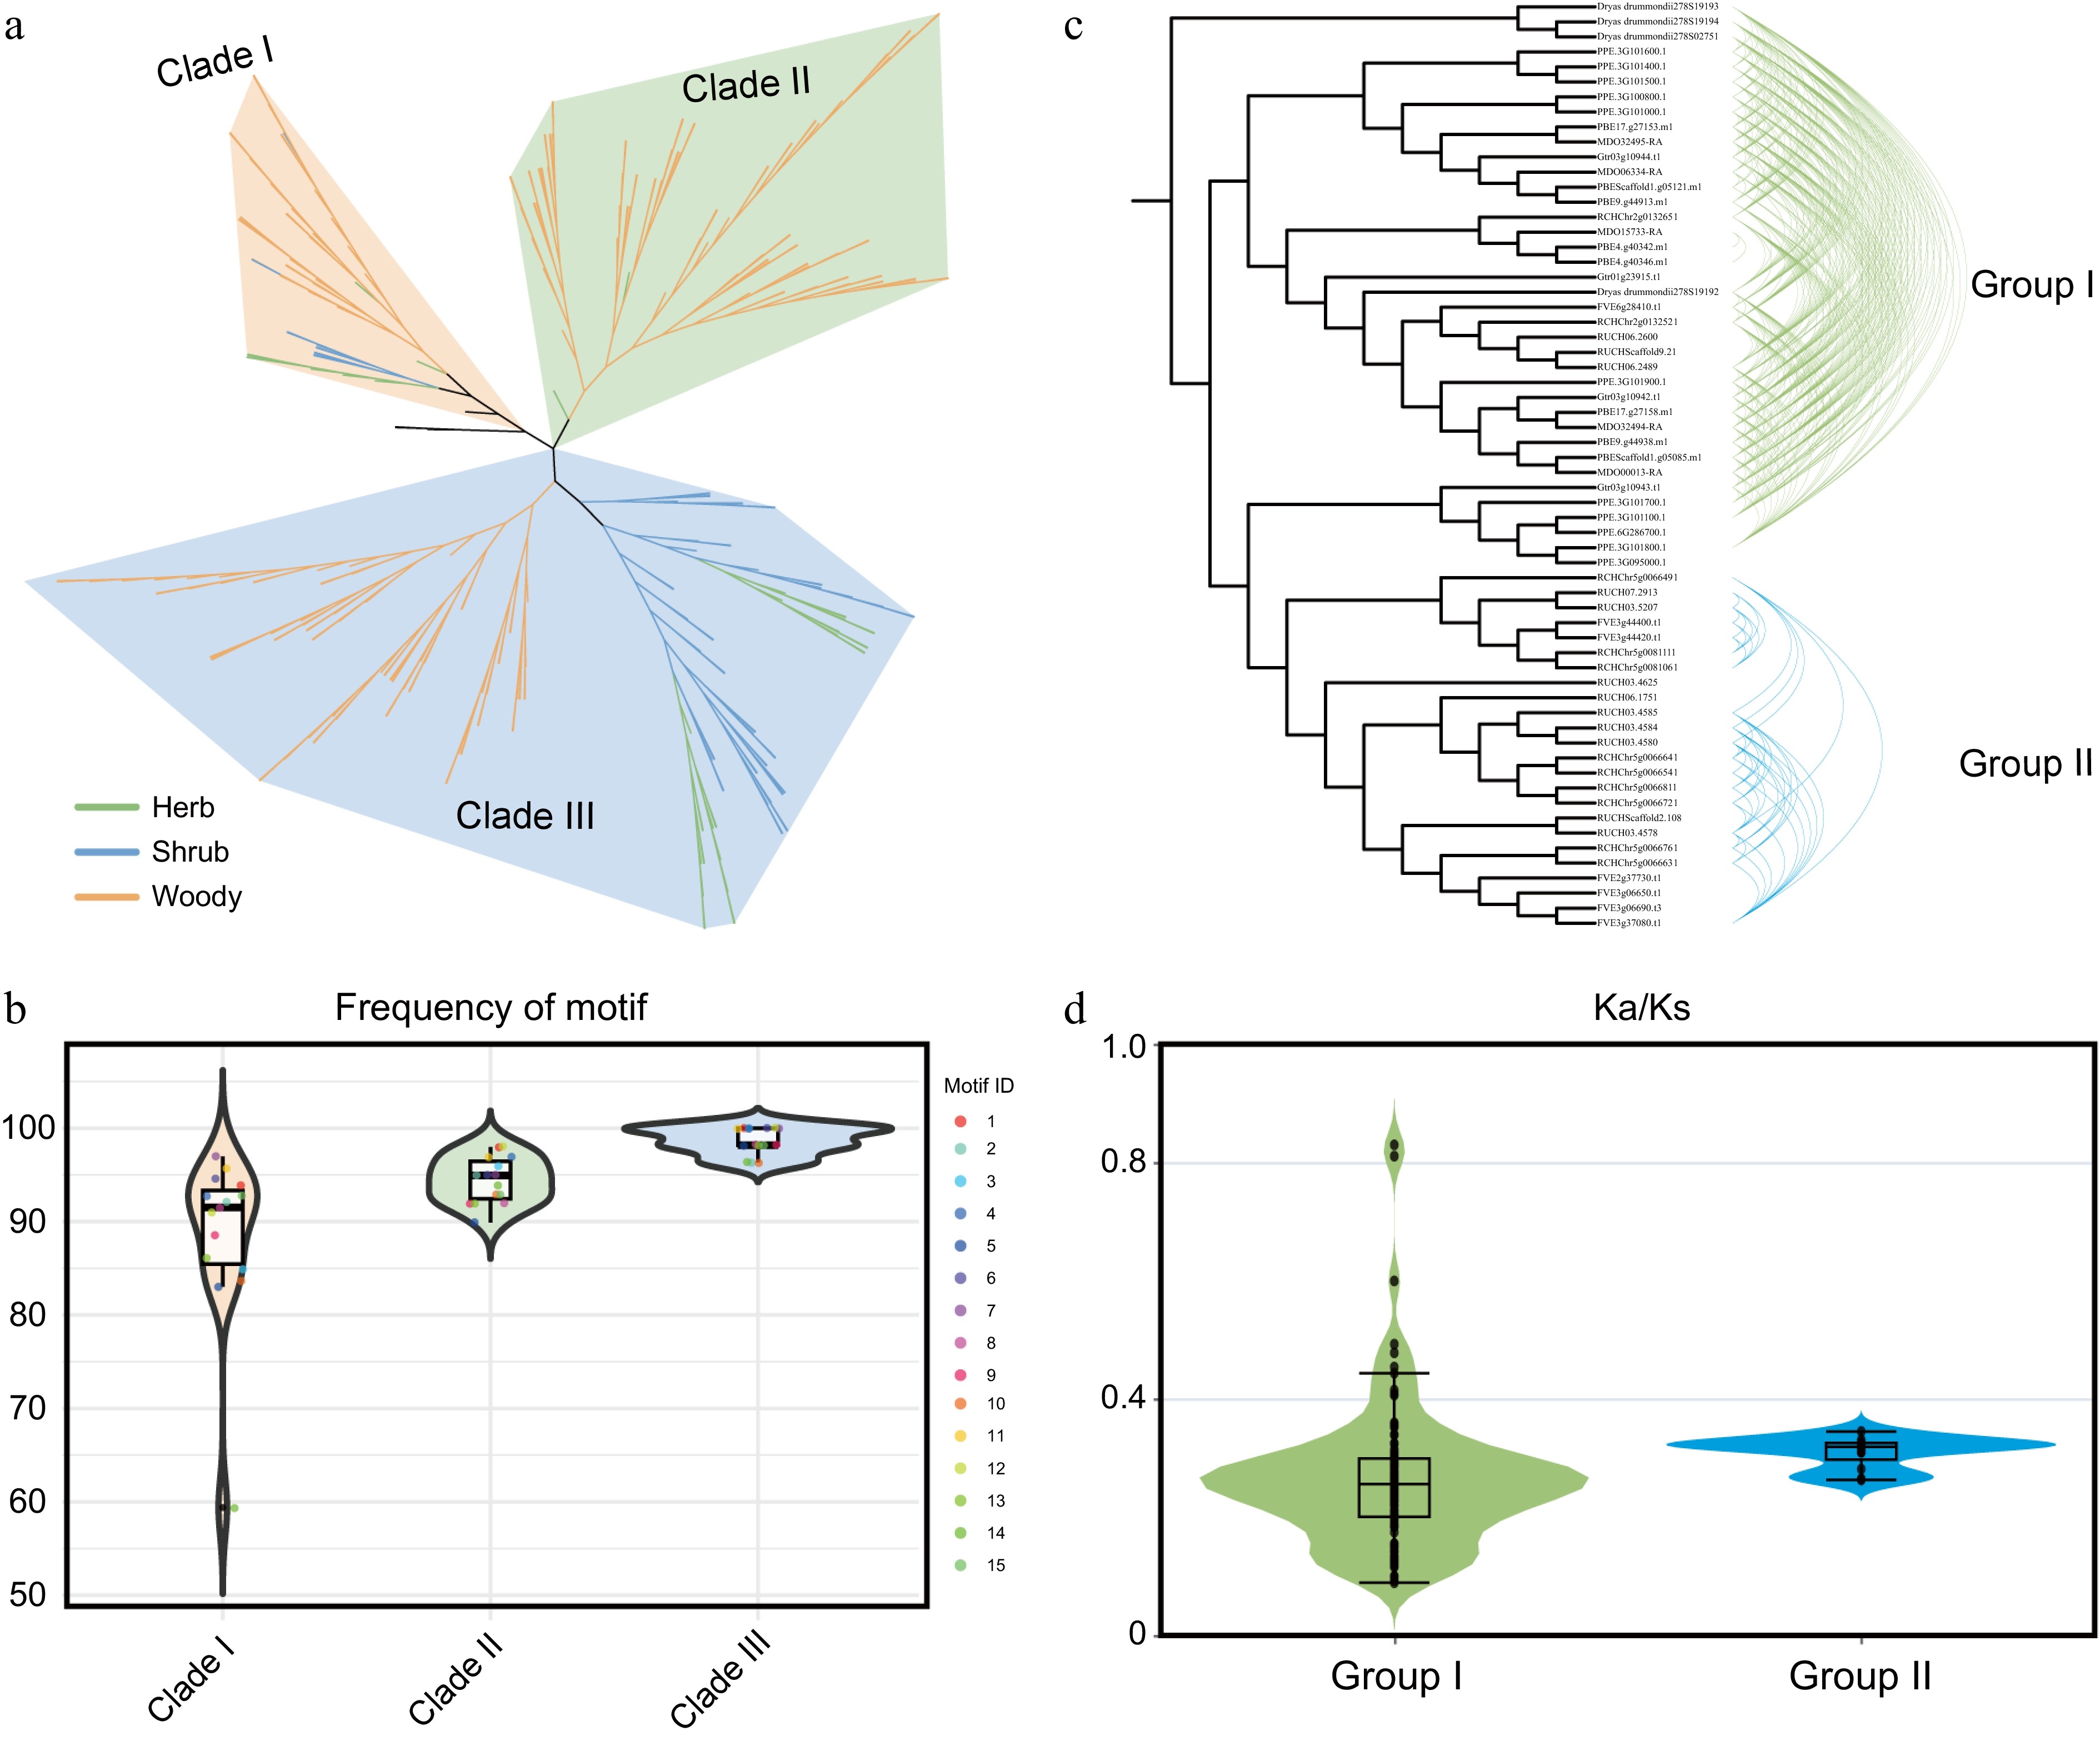
Figure 6.
Emergence of a woody-specific HCT clade through gene duplication. (a) Phylogenetic analysis of HCT gene family members from 37 Rosaceae species. Distinct background colors represent different clades, while branch colors indicate distinct life-form plant groups. (b) Motif frequency distribution across different evolutionary clades. Background colors indicate phylogenetic clades. (c) Syntenic network analysis of HCT members in Rosaceae. (d) Ka/Ks analysis of gene pairs within the two gene clusters. Background colors correspond to the group colors in (c).
Figures
(6)
Tables
(0)