-
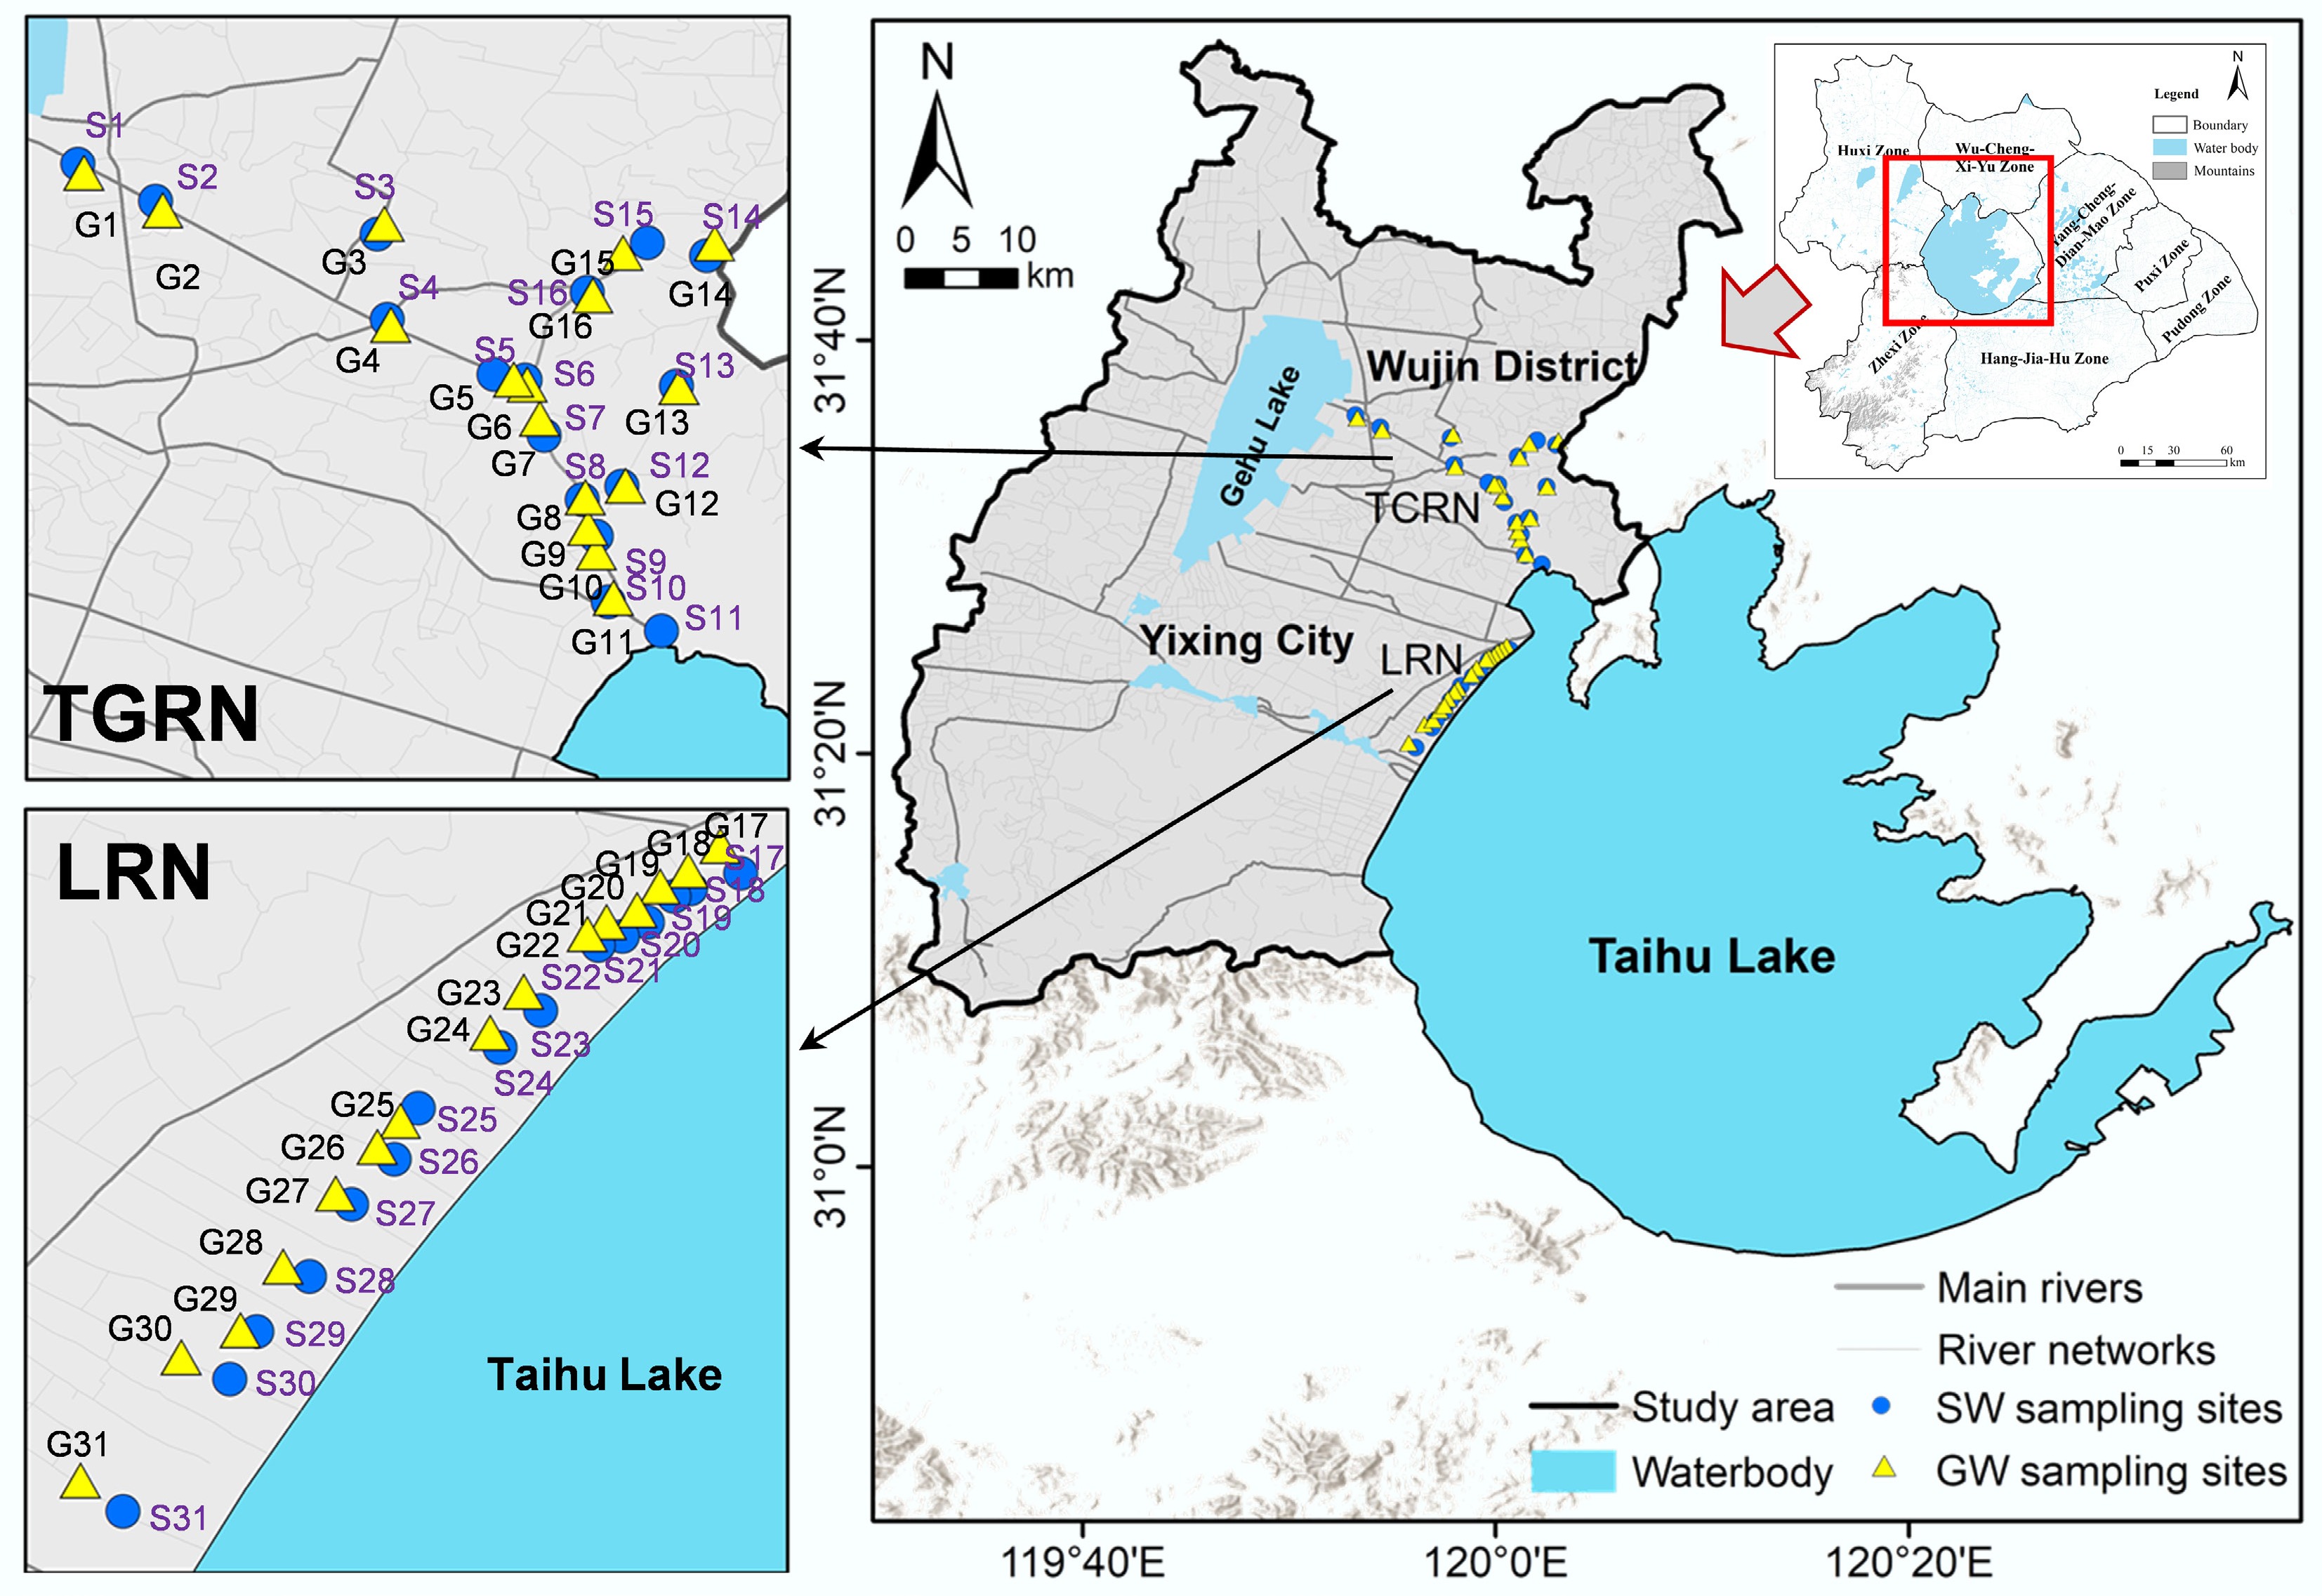
Figure 1.
Study area and seasonal sampling sites for surface water and groundwater samples. TCRN and LRN represent the Tai-ge Canal river network and the lakeside river network, respectively.
-
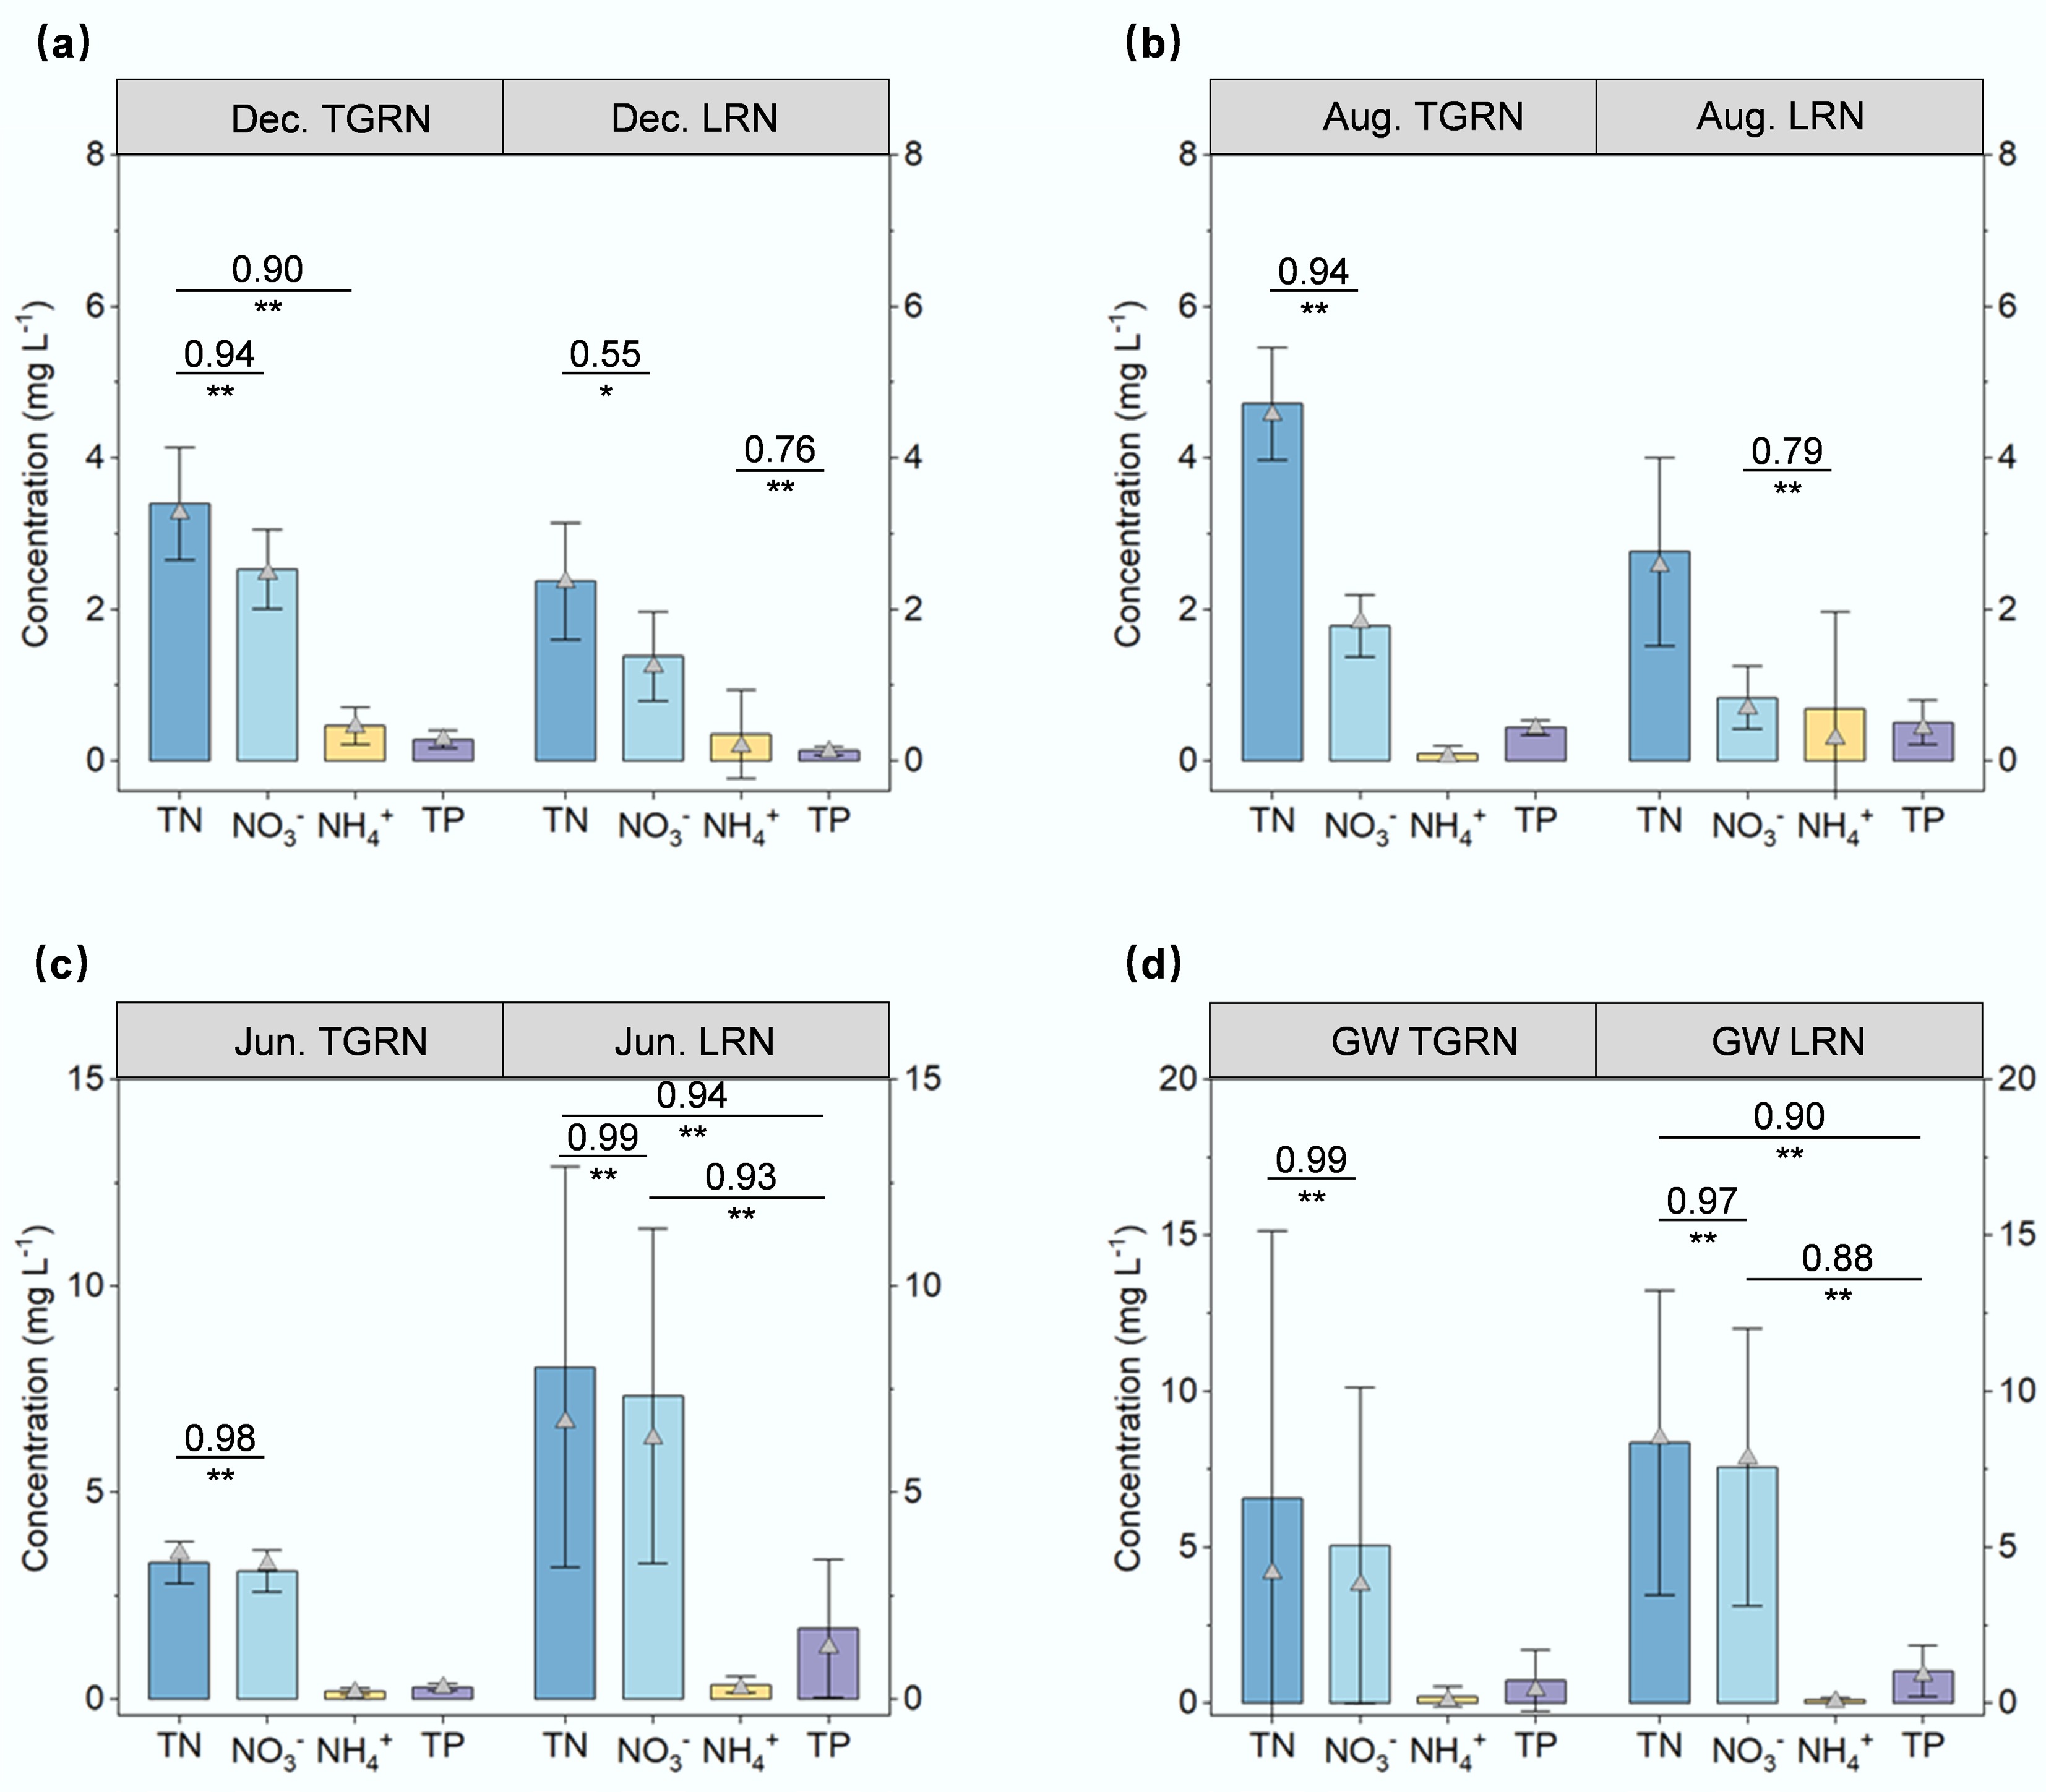
Figure 2.
Differences in nutrient concentration of surface water during the (a) dry, (b) wet, and (c) regular flow seasons and groundwater during the regular (d) flow season in the Tai-ge Canal river network area (TGRN), and the lakeside river network (LRN).
-
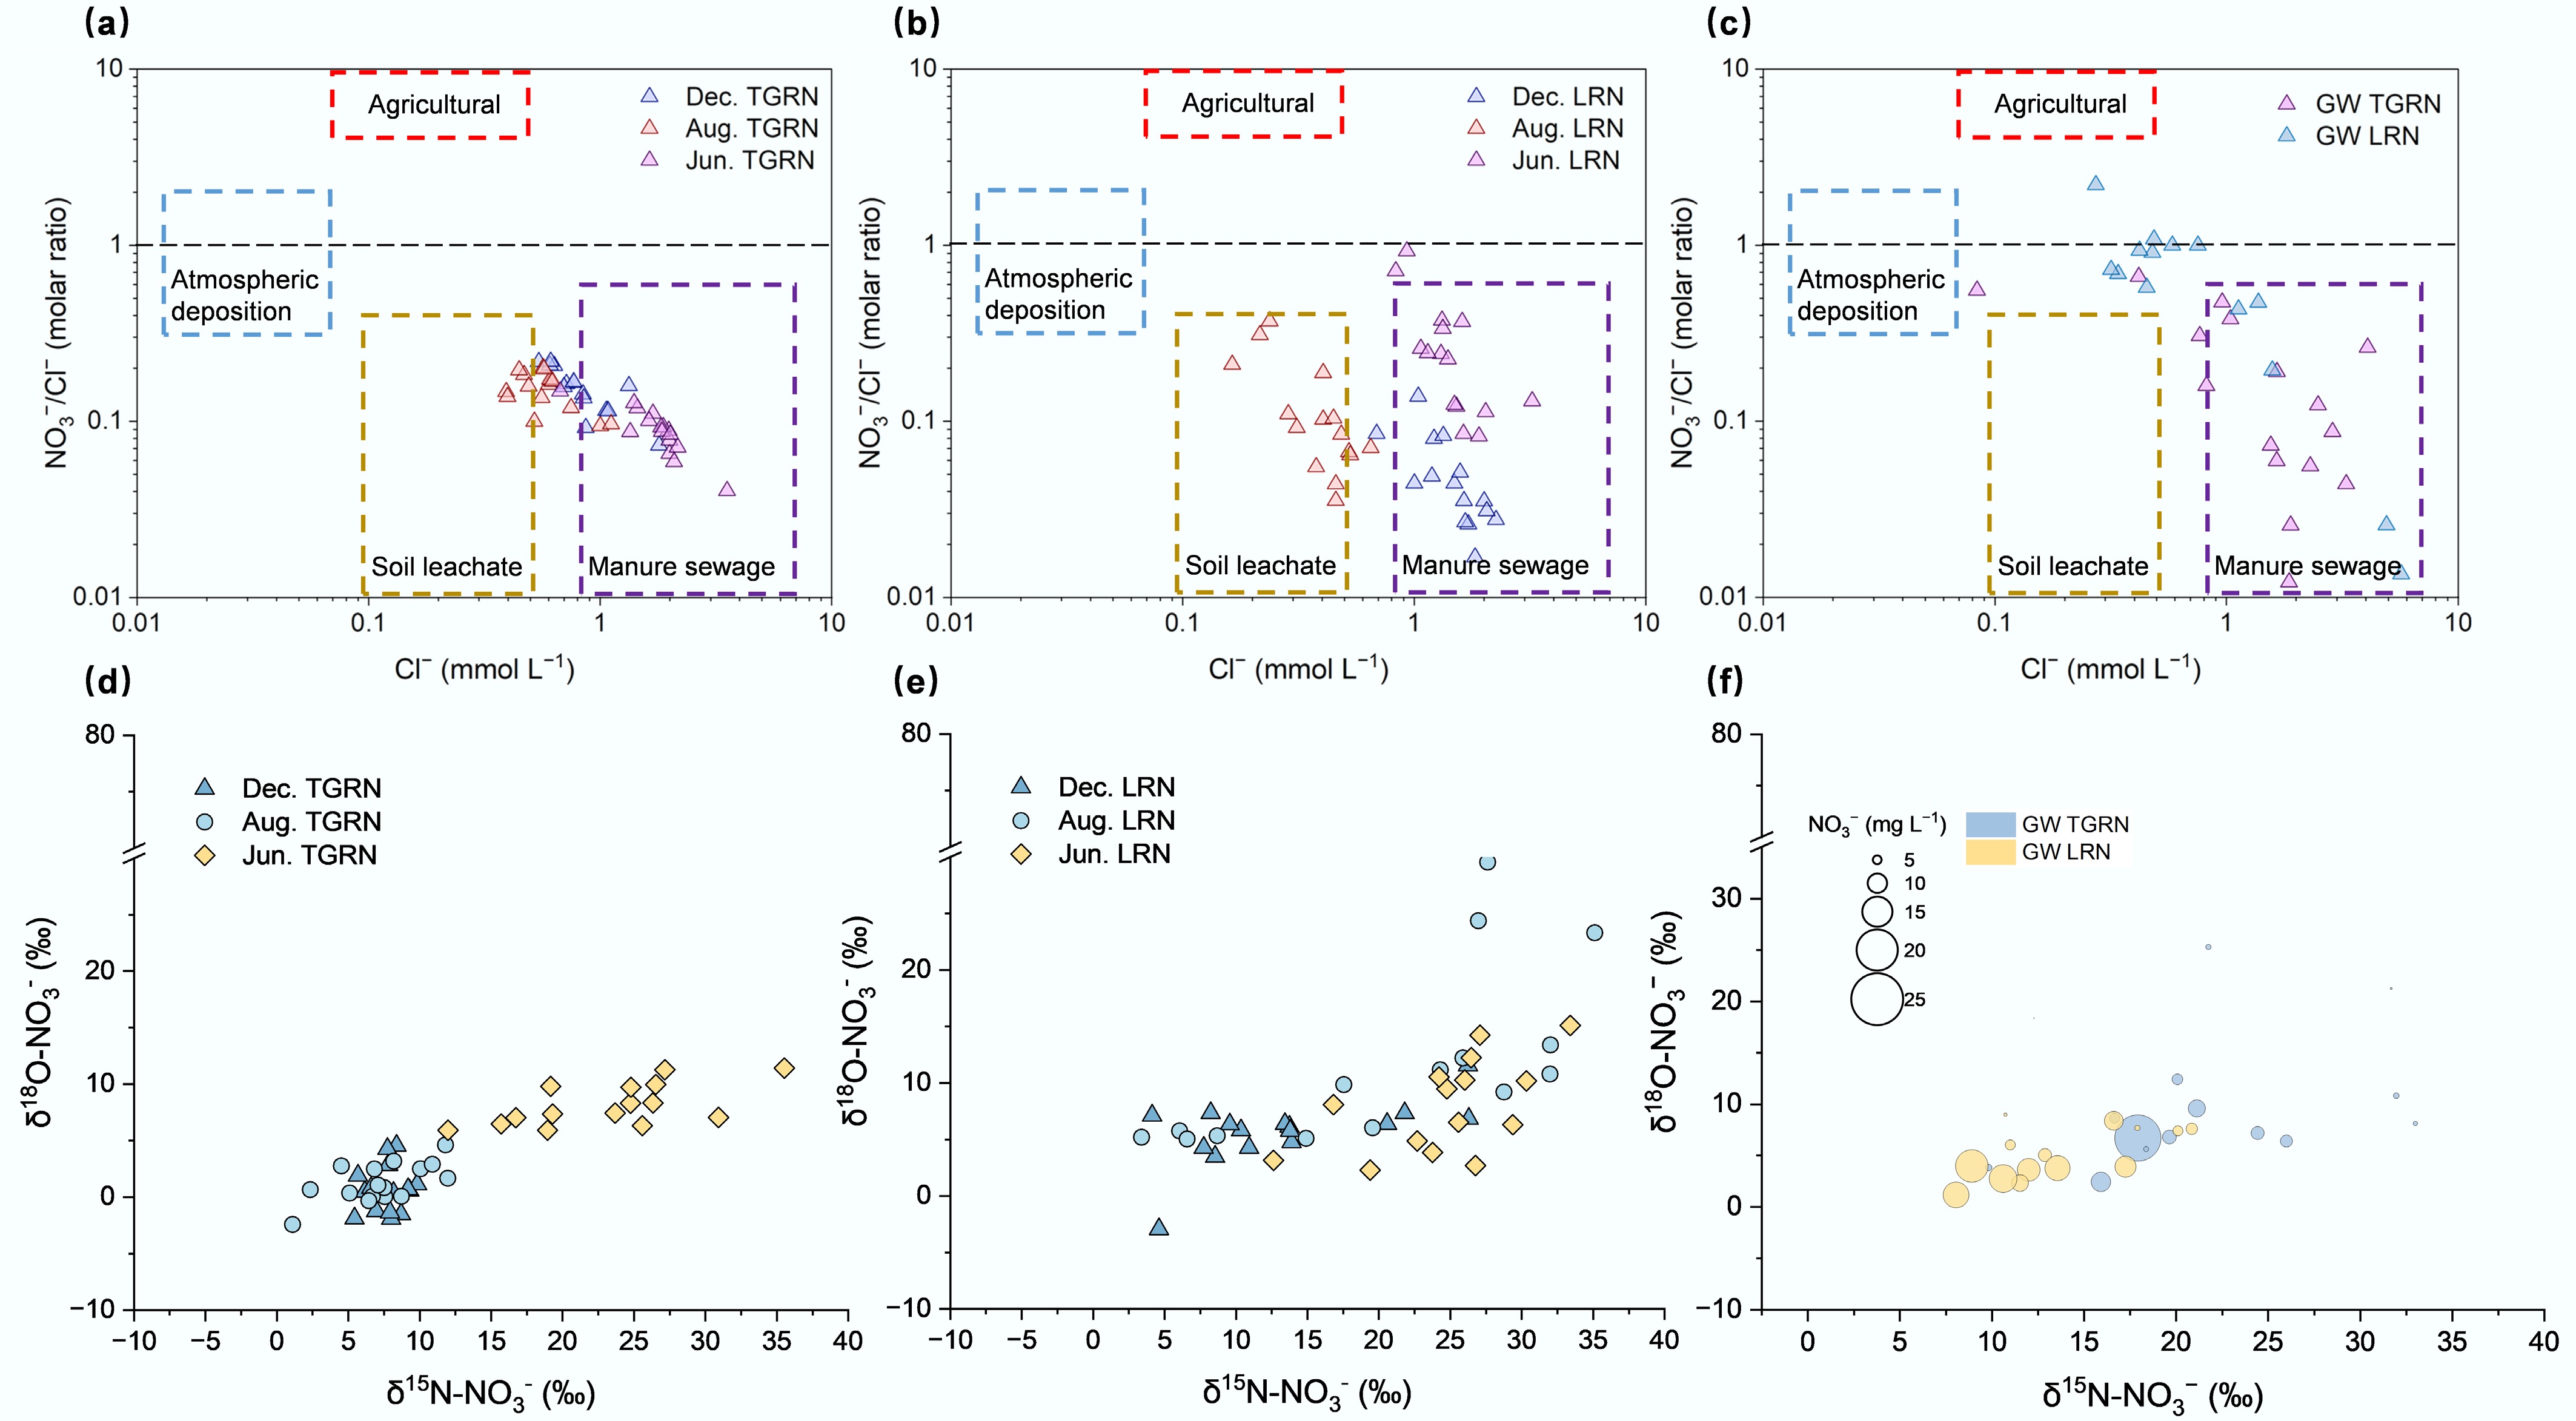
Figure 3.
(a)–(c) Mixing diagram with NO3−/Cl− ratios and Cl− concentrations. (d), (e) Dual isotopic component for surface water samples in dry, wet, and regular seasons. (f) Dual isotopic component and NO3− concentration for groundwater samples.
-
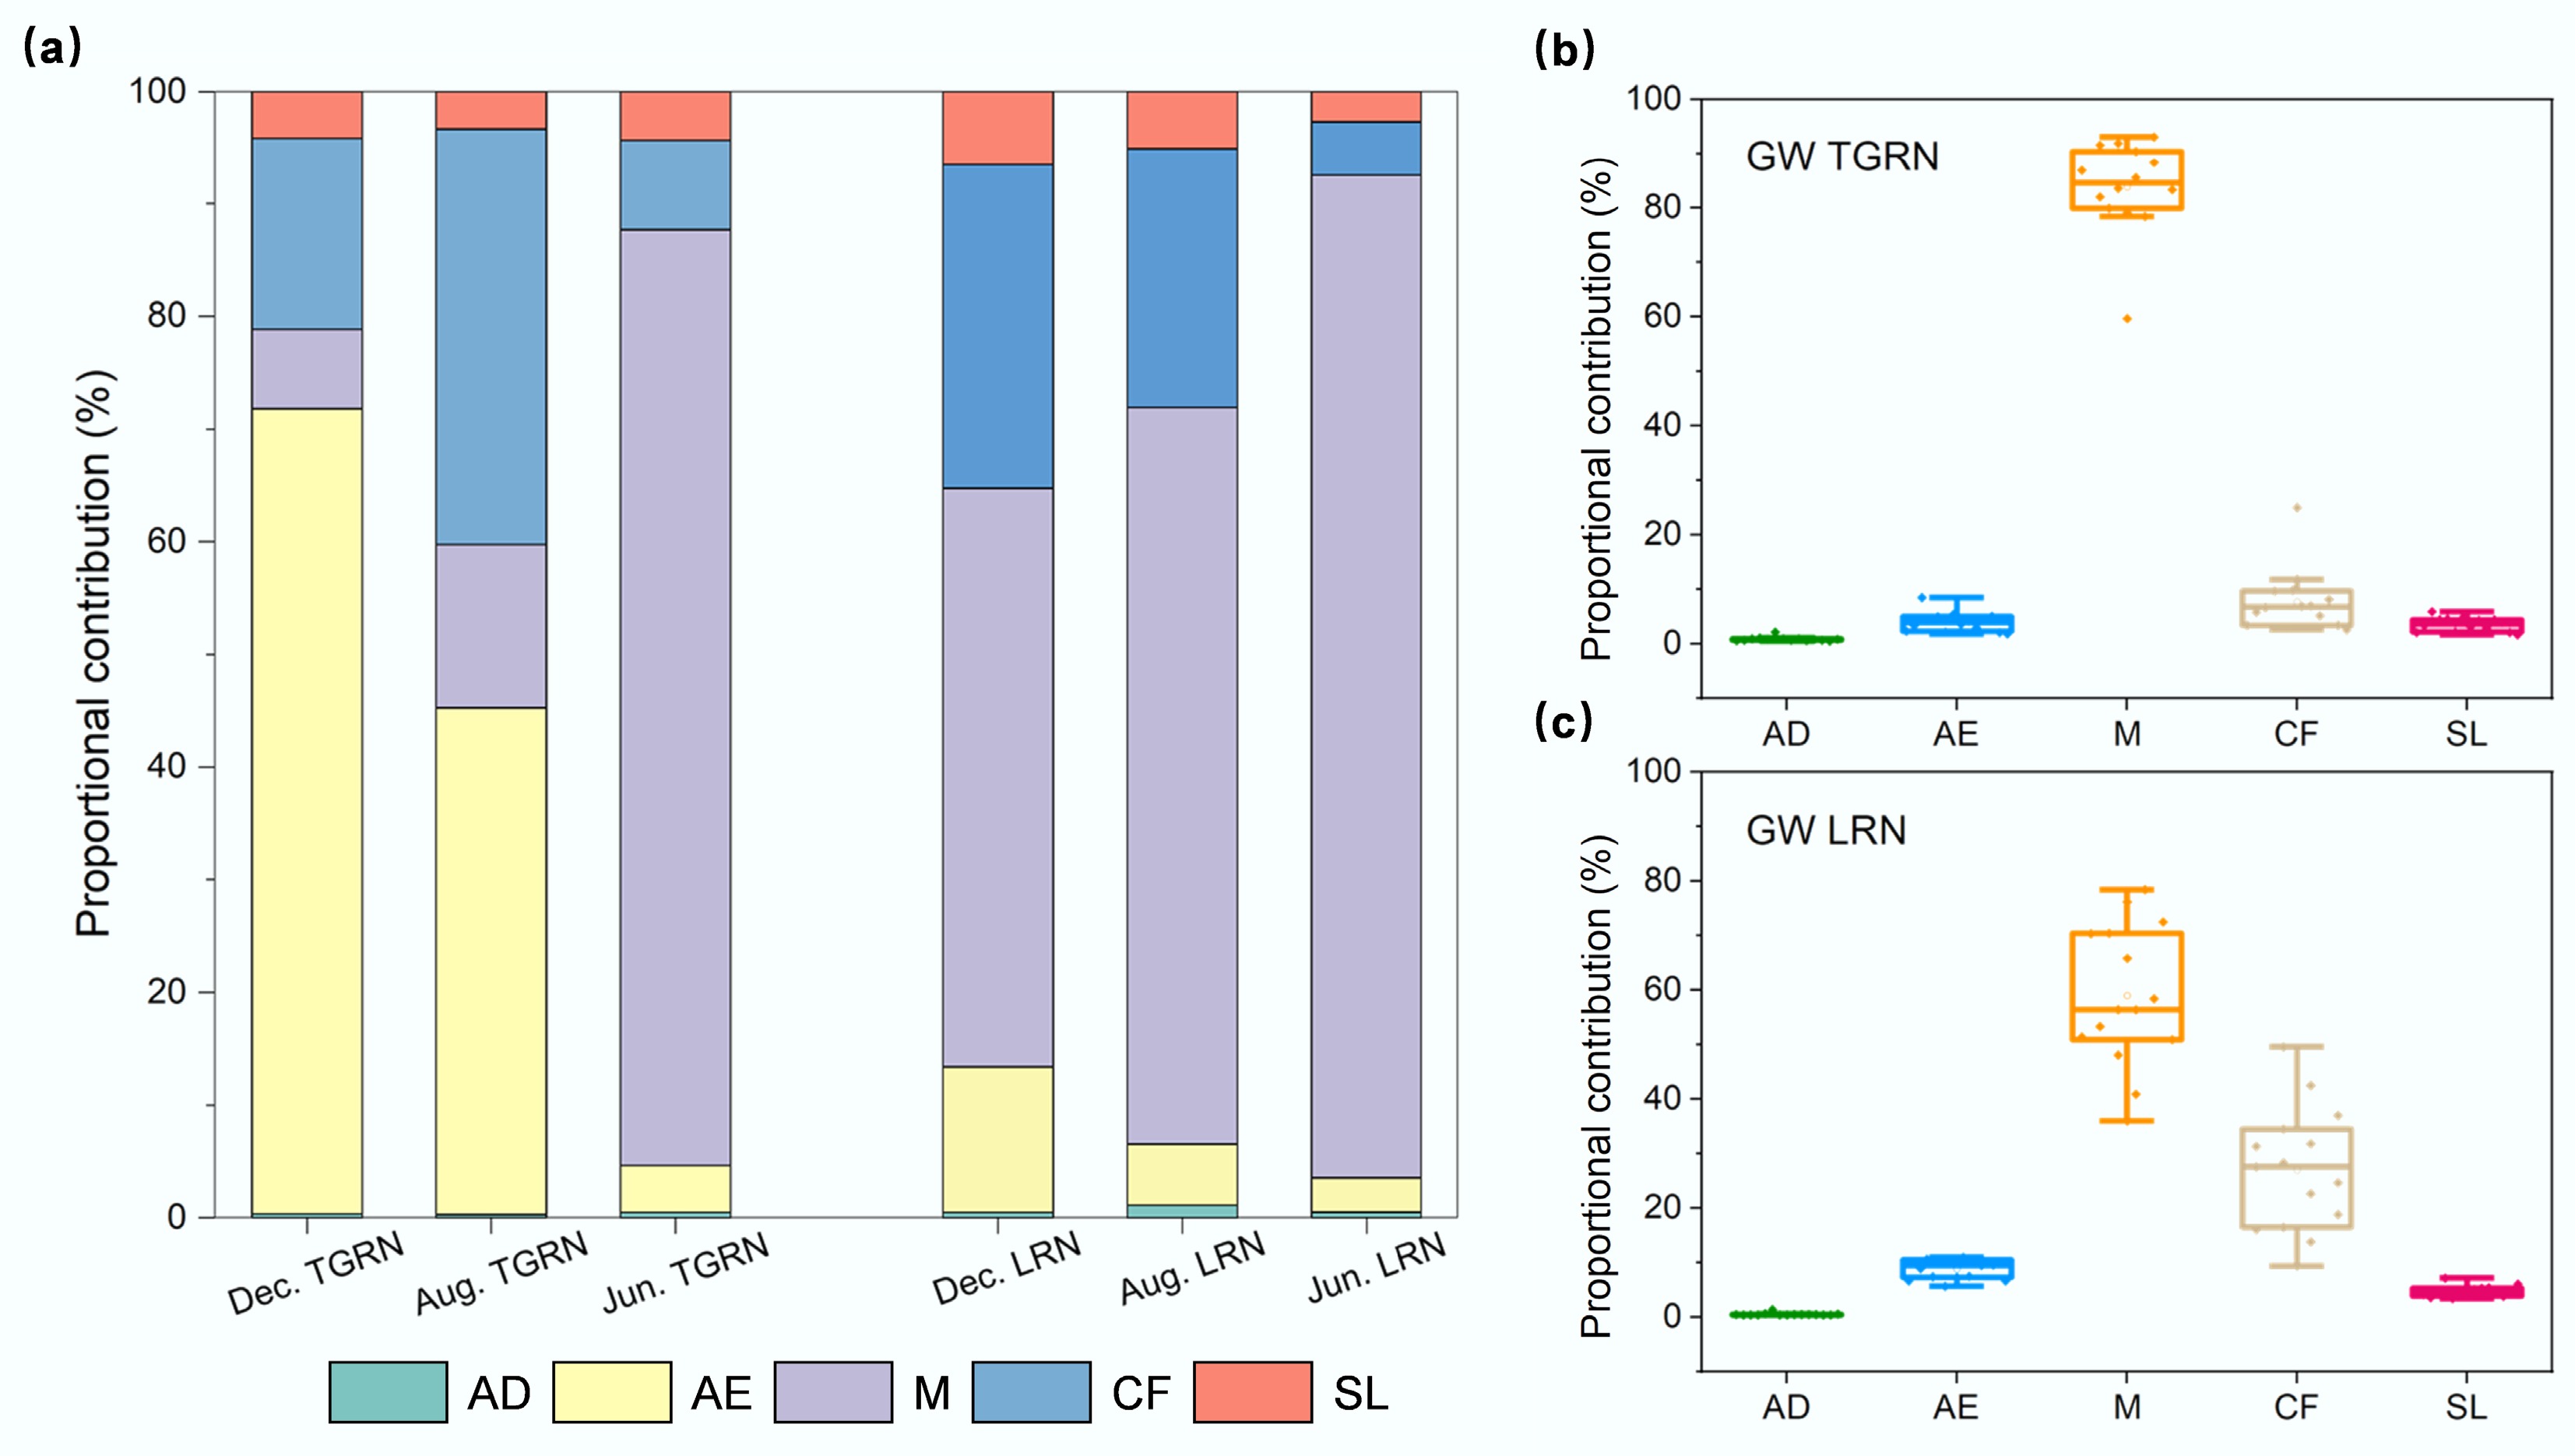
Figure 4.
Proportions for NO3− source in (a) surface water samples, and (b), (c) groundwater samples. Atmospheric deposition (AD), aquaculture effluent (AE), chemical fertilizer (CF), manure (M), and soil leachate (SL) were potential sources of nitrate.
-
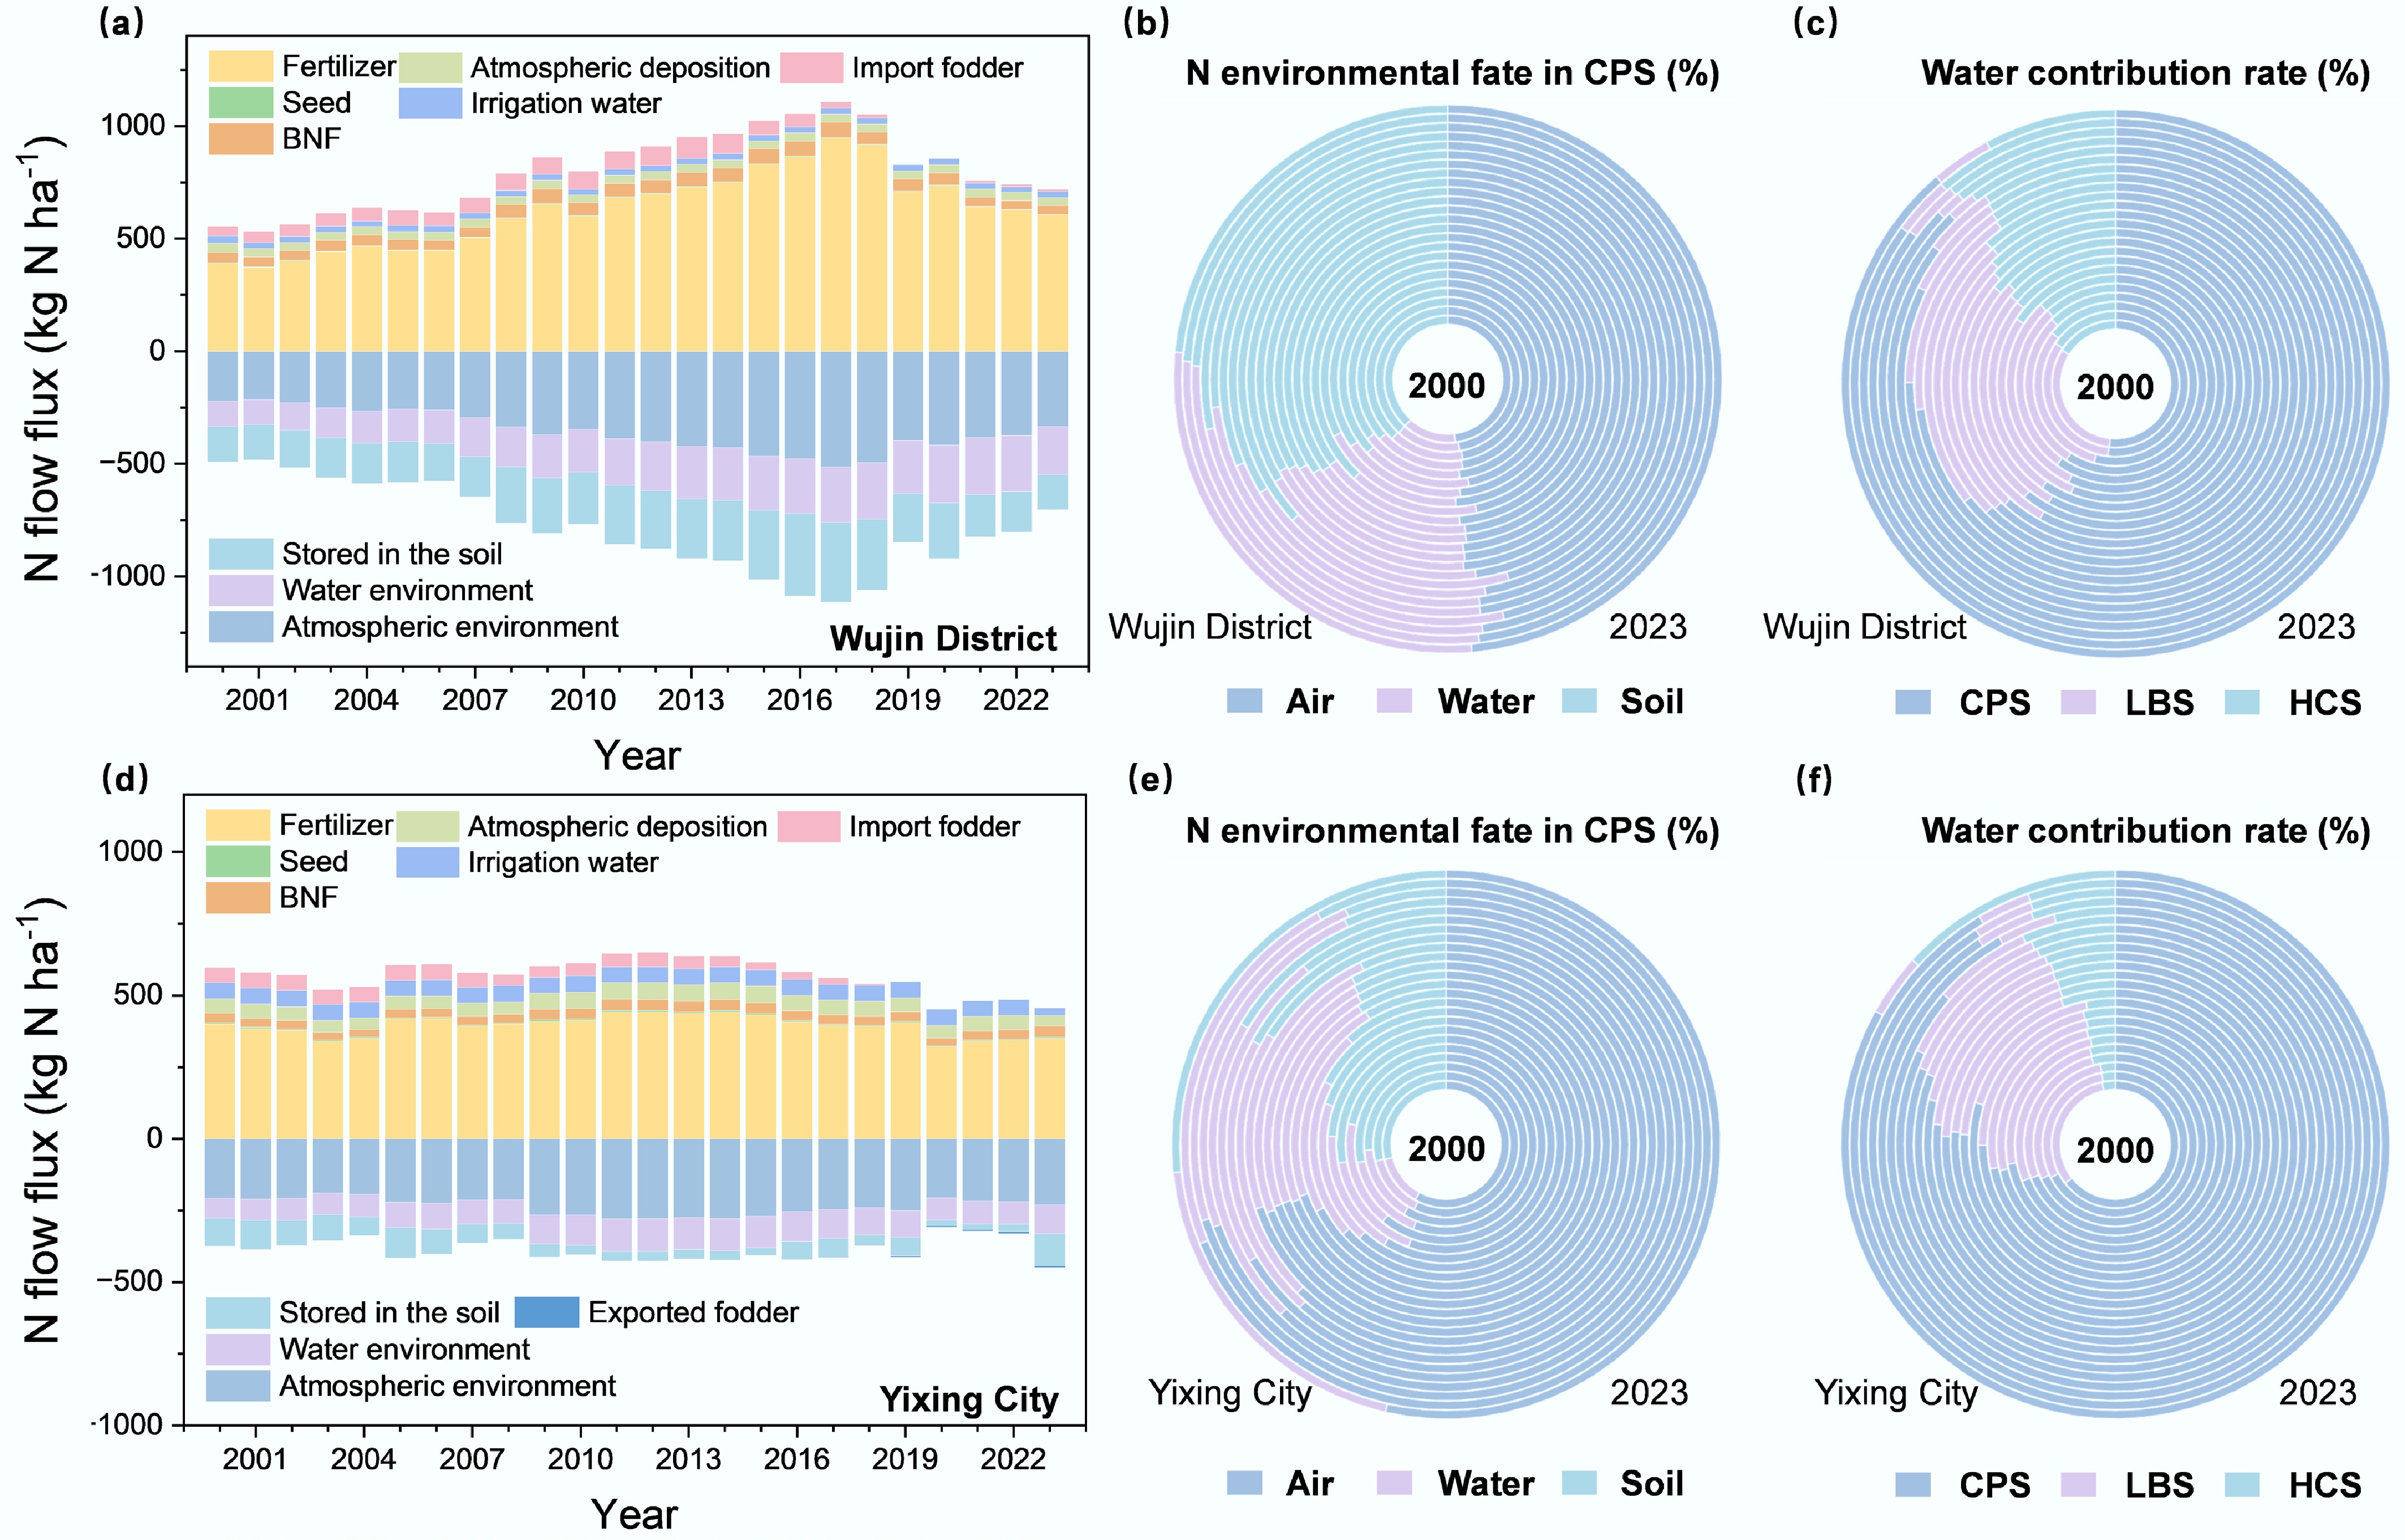
Figure 5.
Temporal N flux in the agriculture-food-environment system in (a) Wujin District, and (d) Yixing City from 2000 to 2023. (b), (e) The N environment fate in CPS can be divided into losses to air and water, and storage in soil. (c), (f) The contribution percentage of N loss from crop-production subsystem (CPS), livestock-breeding subsystem (LBS), and household-consumption subsystem (HCS) subsystems to the water environment during the period 2000–2023.
-
Sources δ15N-NO3−
(Mean ‰ ± SD ‰)δ18O-NO3−
(Mean ‰ ± SD ‰)n Atmospheric deposition (AD) −3.38 ± 2.42 58.04 ± 6.27 4 Aquaculture effluent (AE) 4.46 ± 4.92 8.27 ± 5.22 5 Chemical fertilizer (CF) −0.94 ± 1.00 −0.60 ± 1.50 7 Manure (M) 20.10 ± 6.39 12.63 ± 4.28 7 Soil leachate (SL) 6.09 ± 6.33 9.20 ± 2.75 17 Table 1.
Isotopic end-members for MixSIAR quantifying the contribution of NO3− sources
Figures
(5)
Tables
(1)