-

-
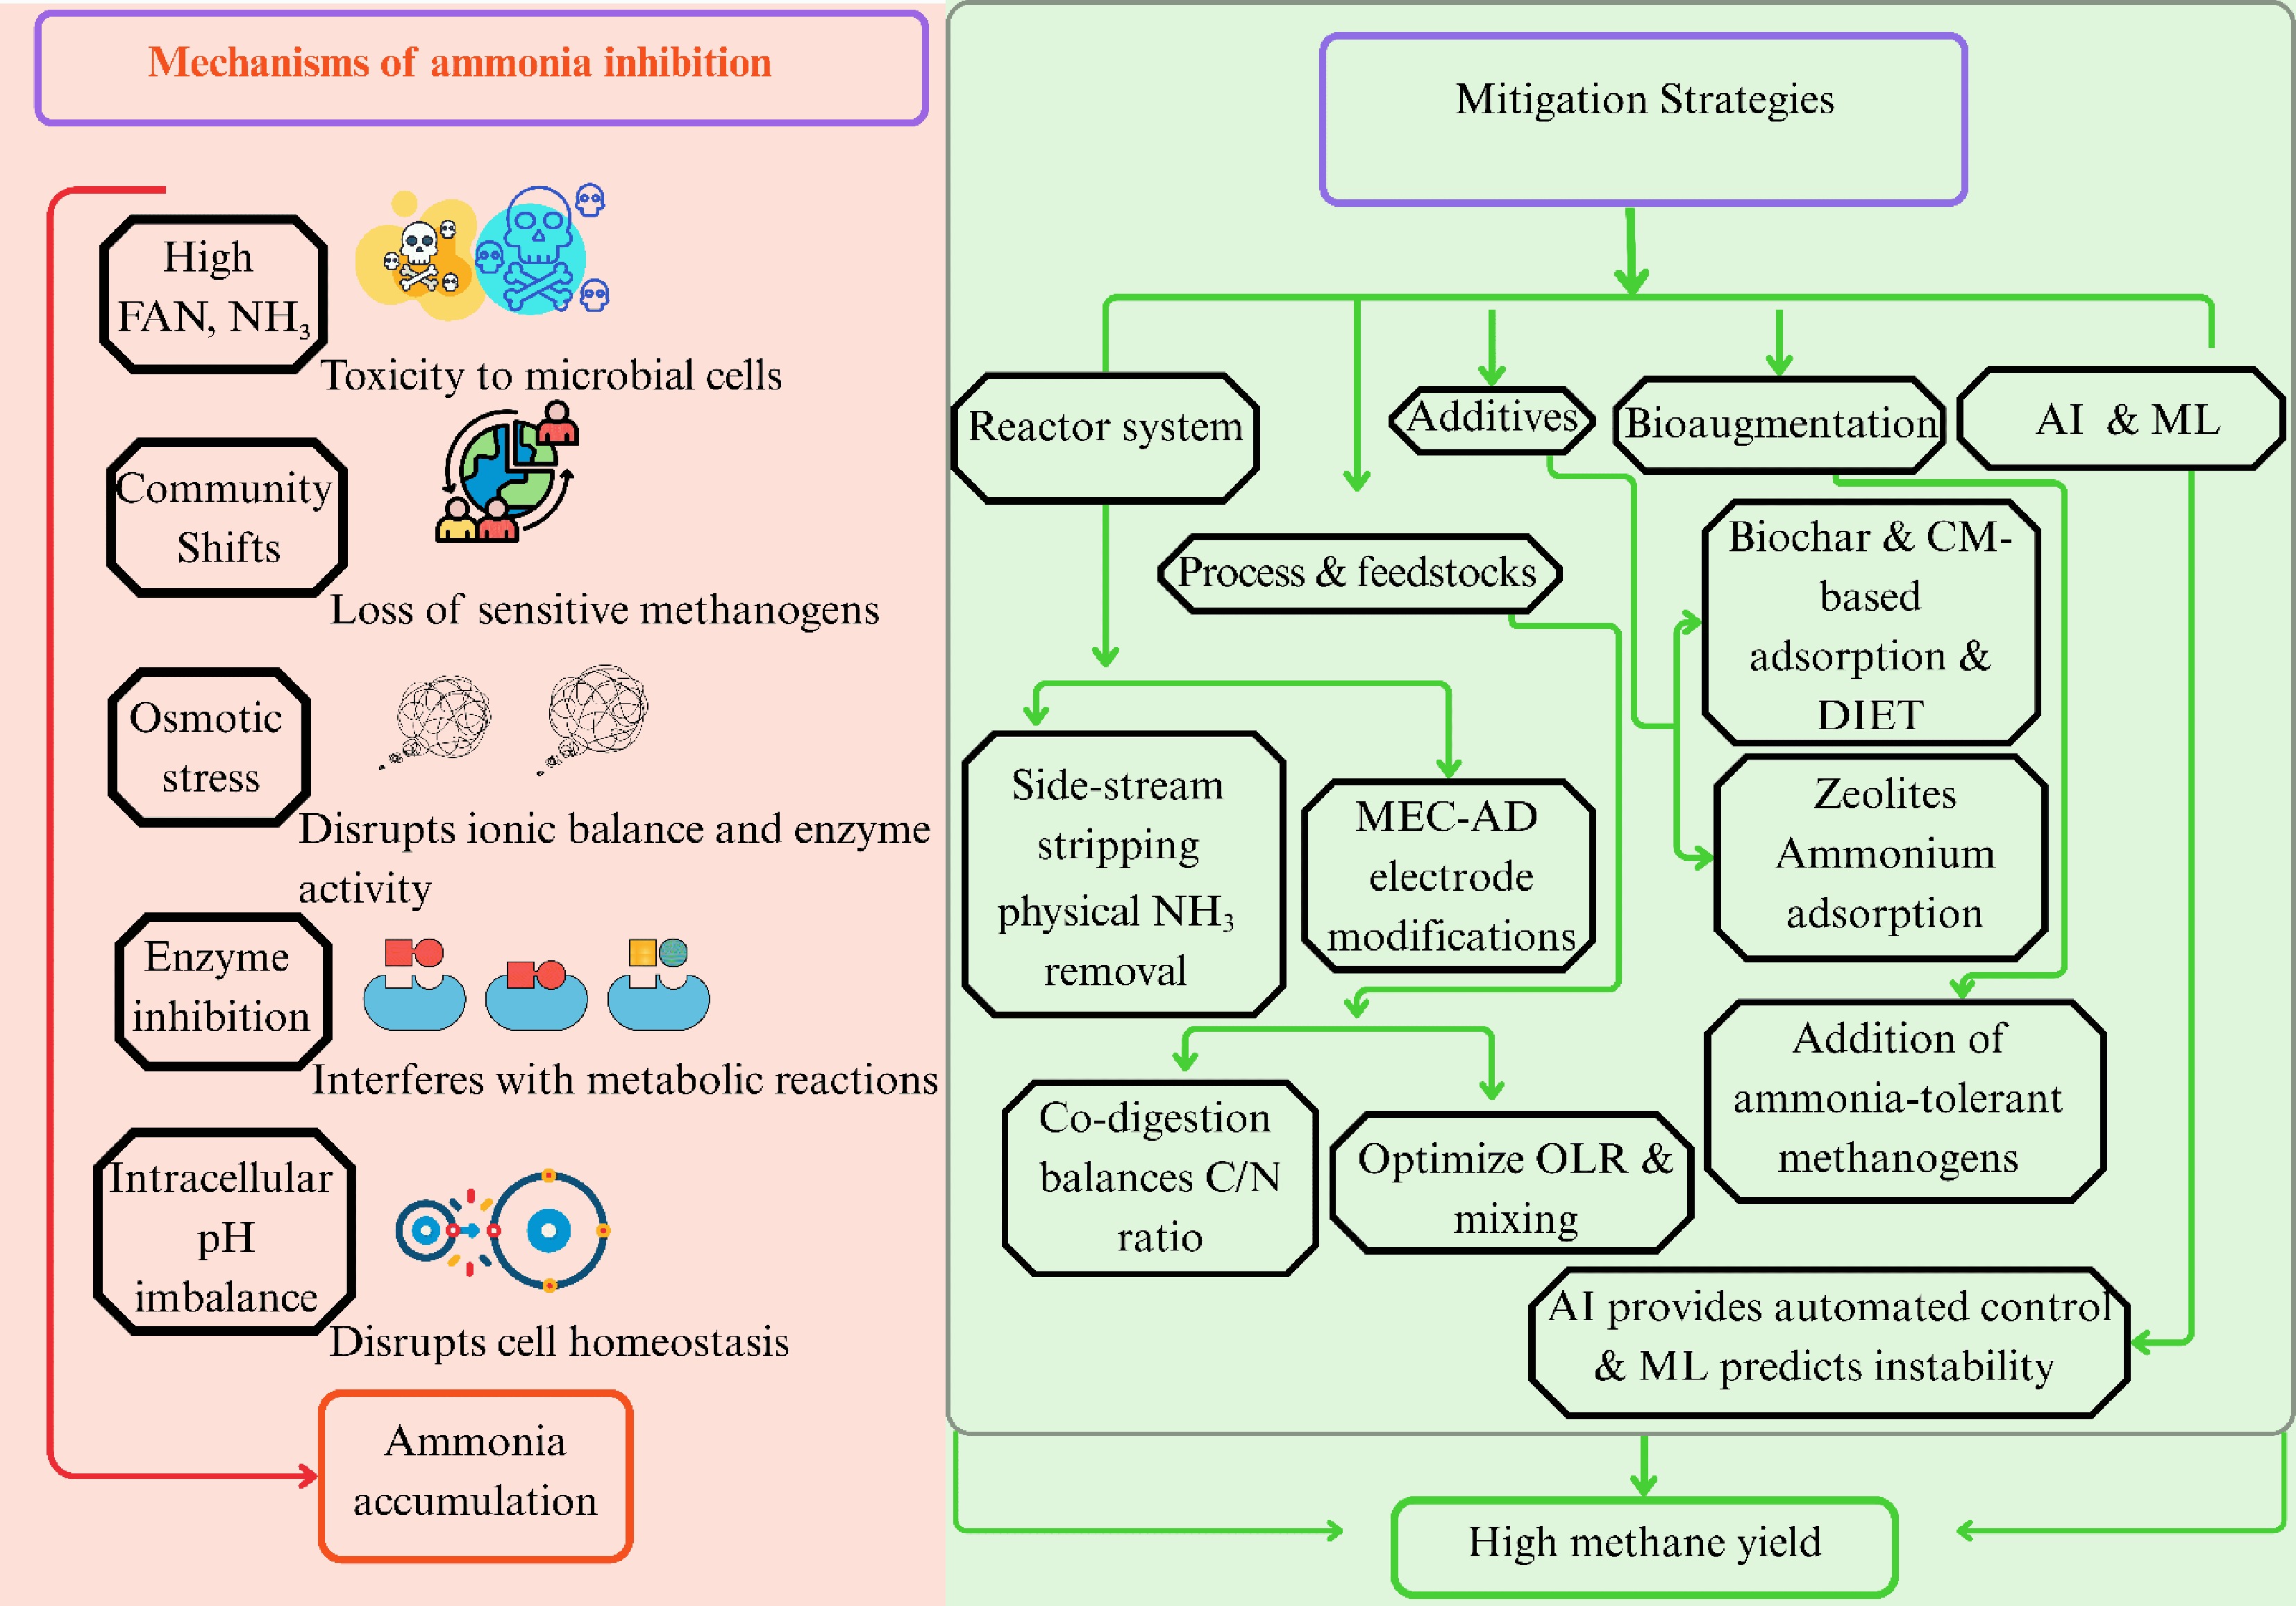
Figure 2.
Schematic representation of the effect of ammonia inhibition on the microbes and mitigation strategies. FAN: free ammonia nitrogen; AI: artificial intelligence; ML: machine learning; CM: conductive material; DIET: direct interspecies electron transfer; MEC-AD: microbial electrolysis cell-anaerobic digestion; C/N: carbon to nitrogen; OLR: organic loading rate.
-
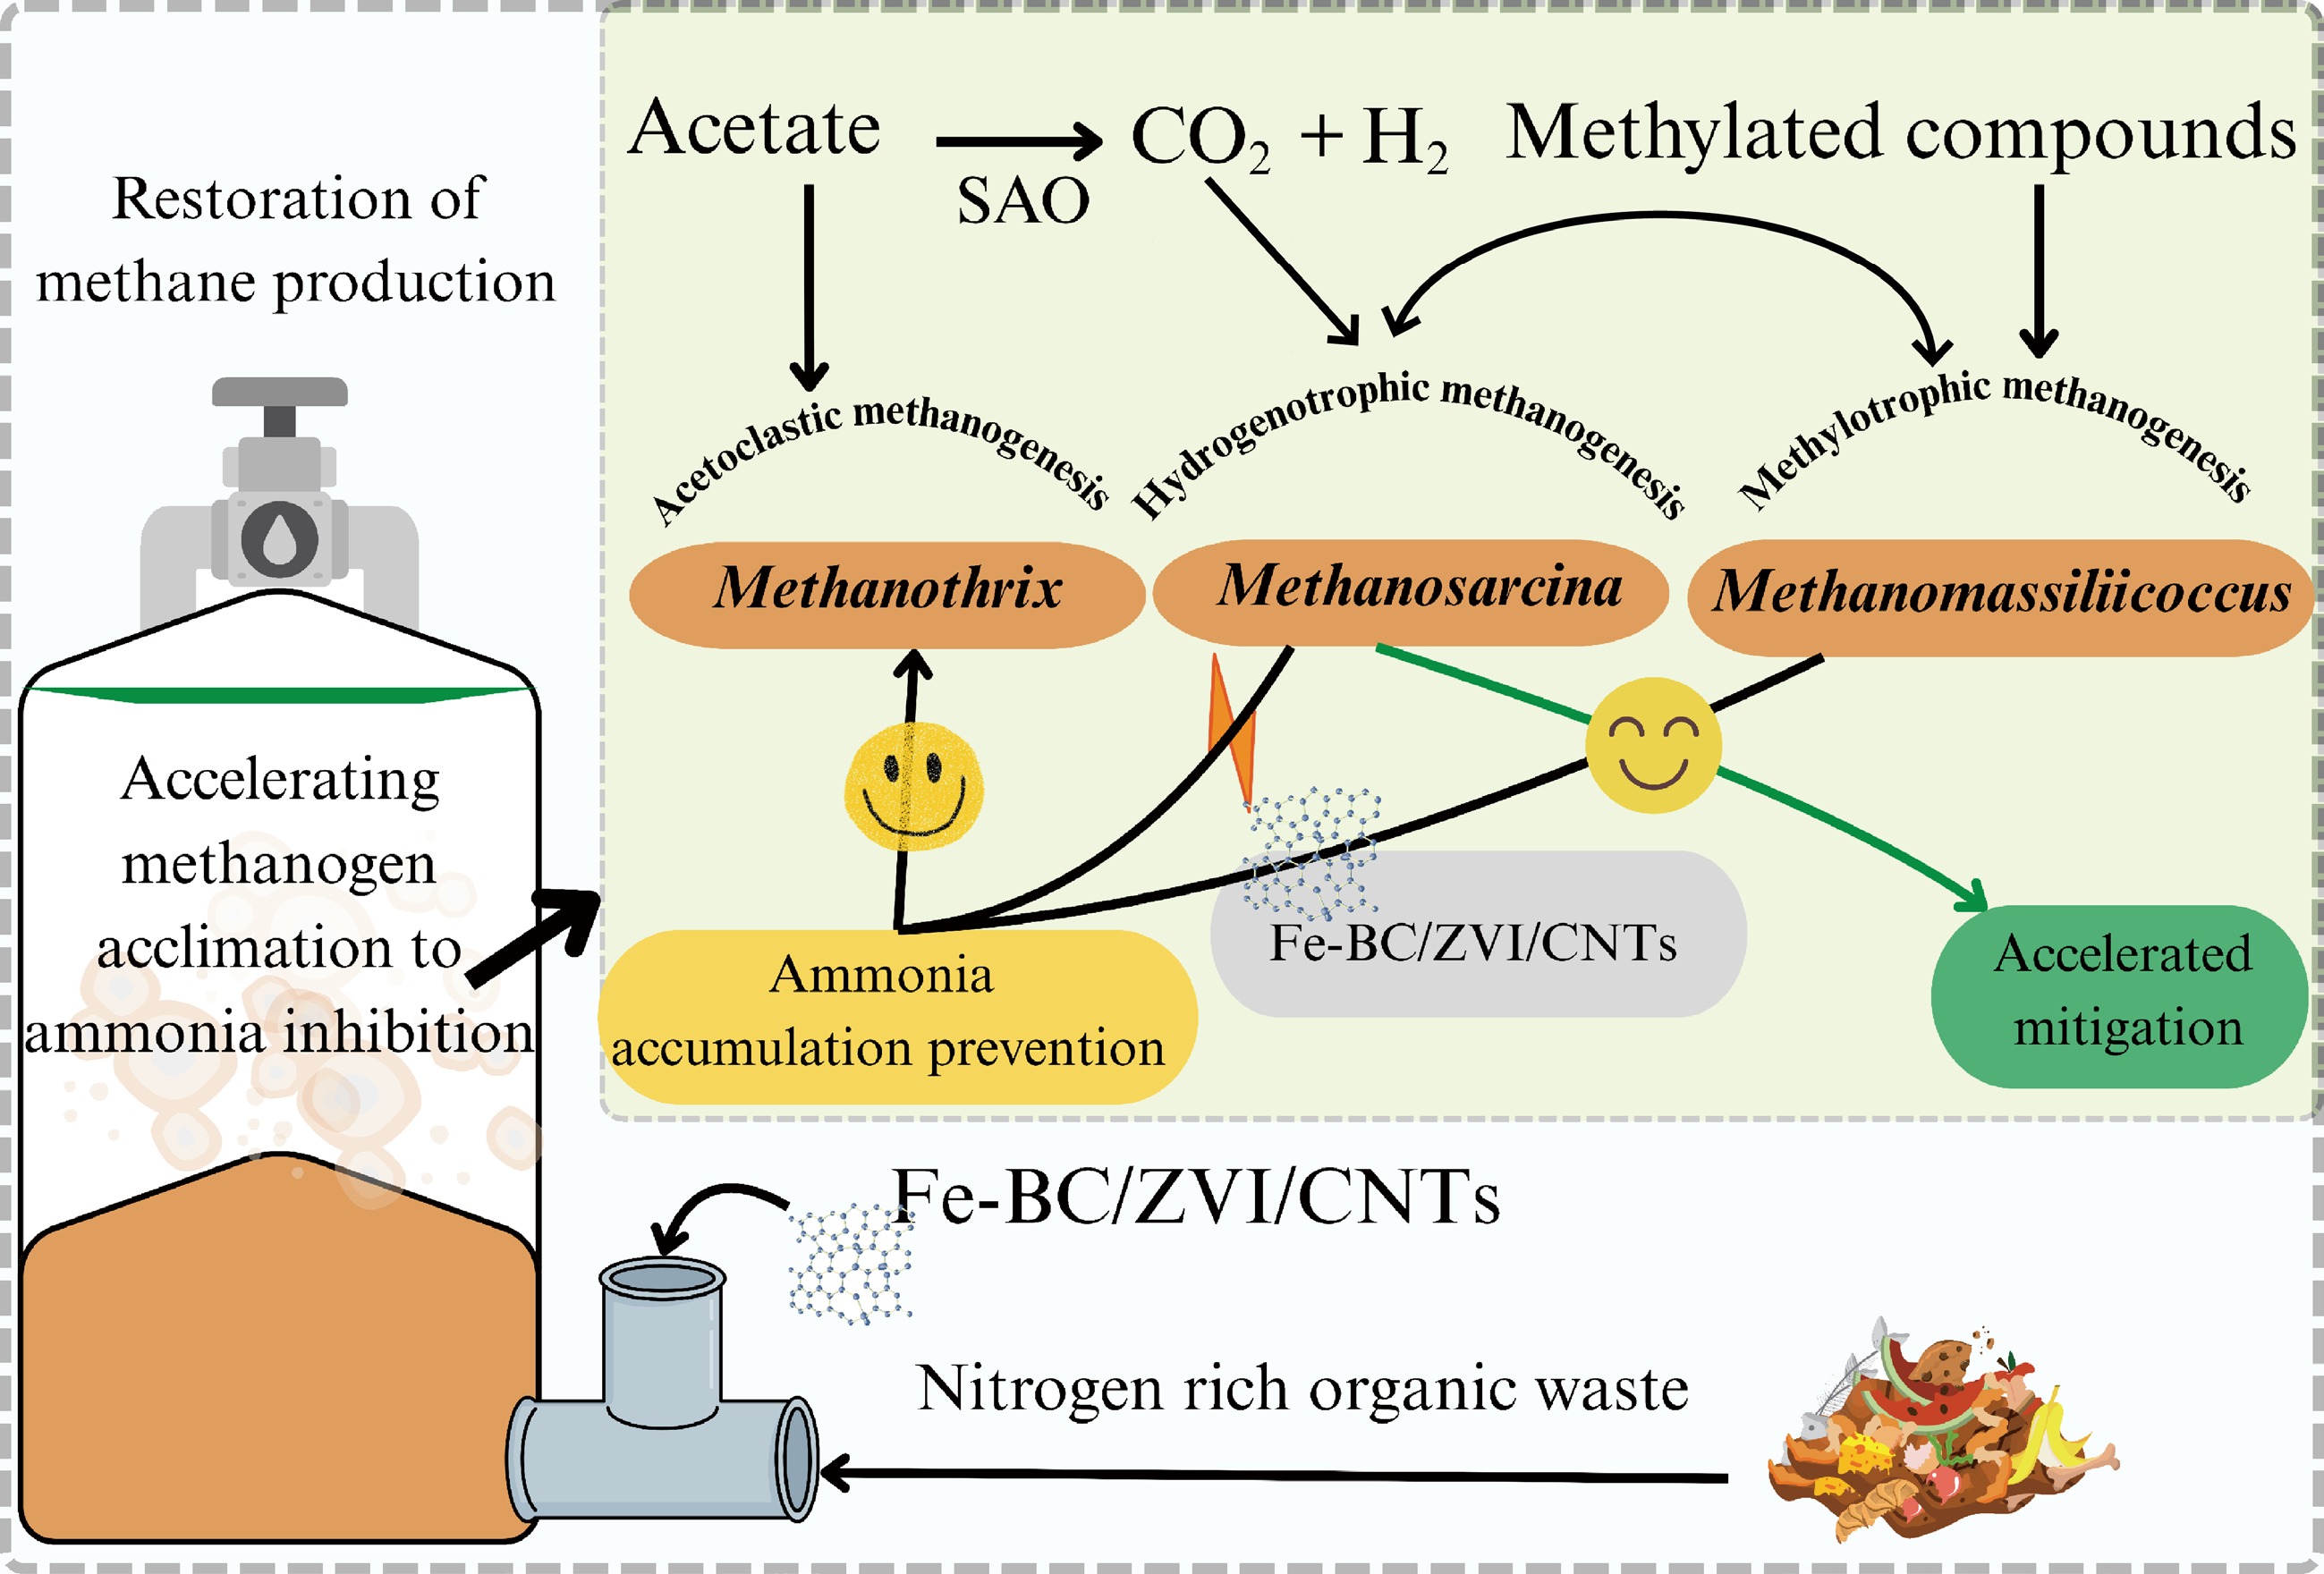
Figure 3.
Schematic representation of the role of conductive materials in alleviating ammonia inhibition. Additives such as iron-biochar (Fe-BC), zero valent iron (ZVI), carbon nanotubes (CNTs) enable high methane yield while reducing the impact of ammonia accumulation. (The figure has been produced using input from references[53,54]).
-
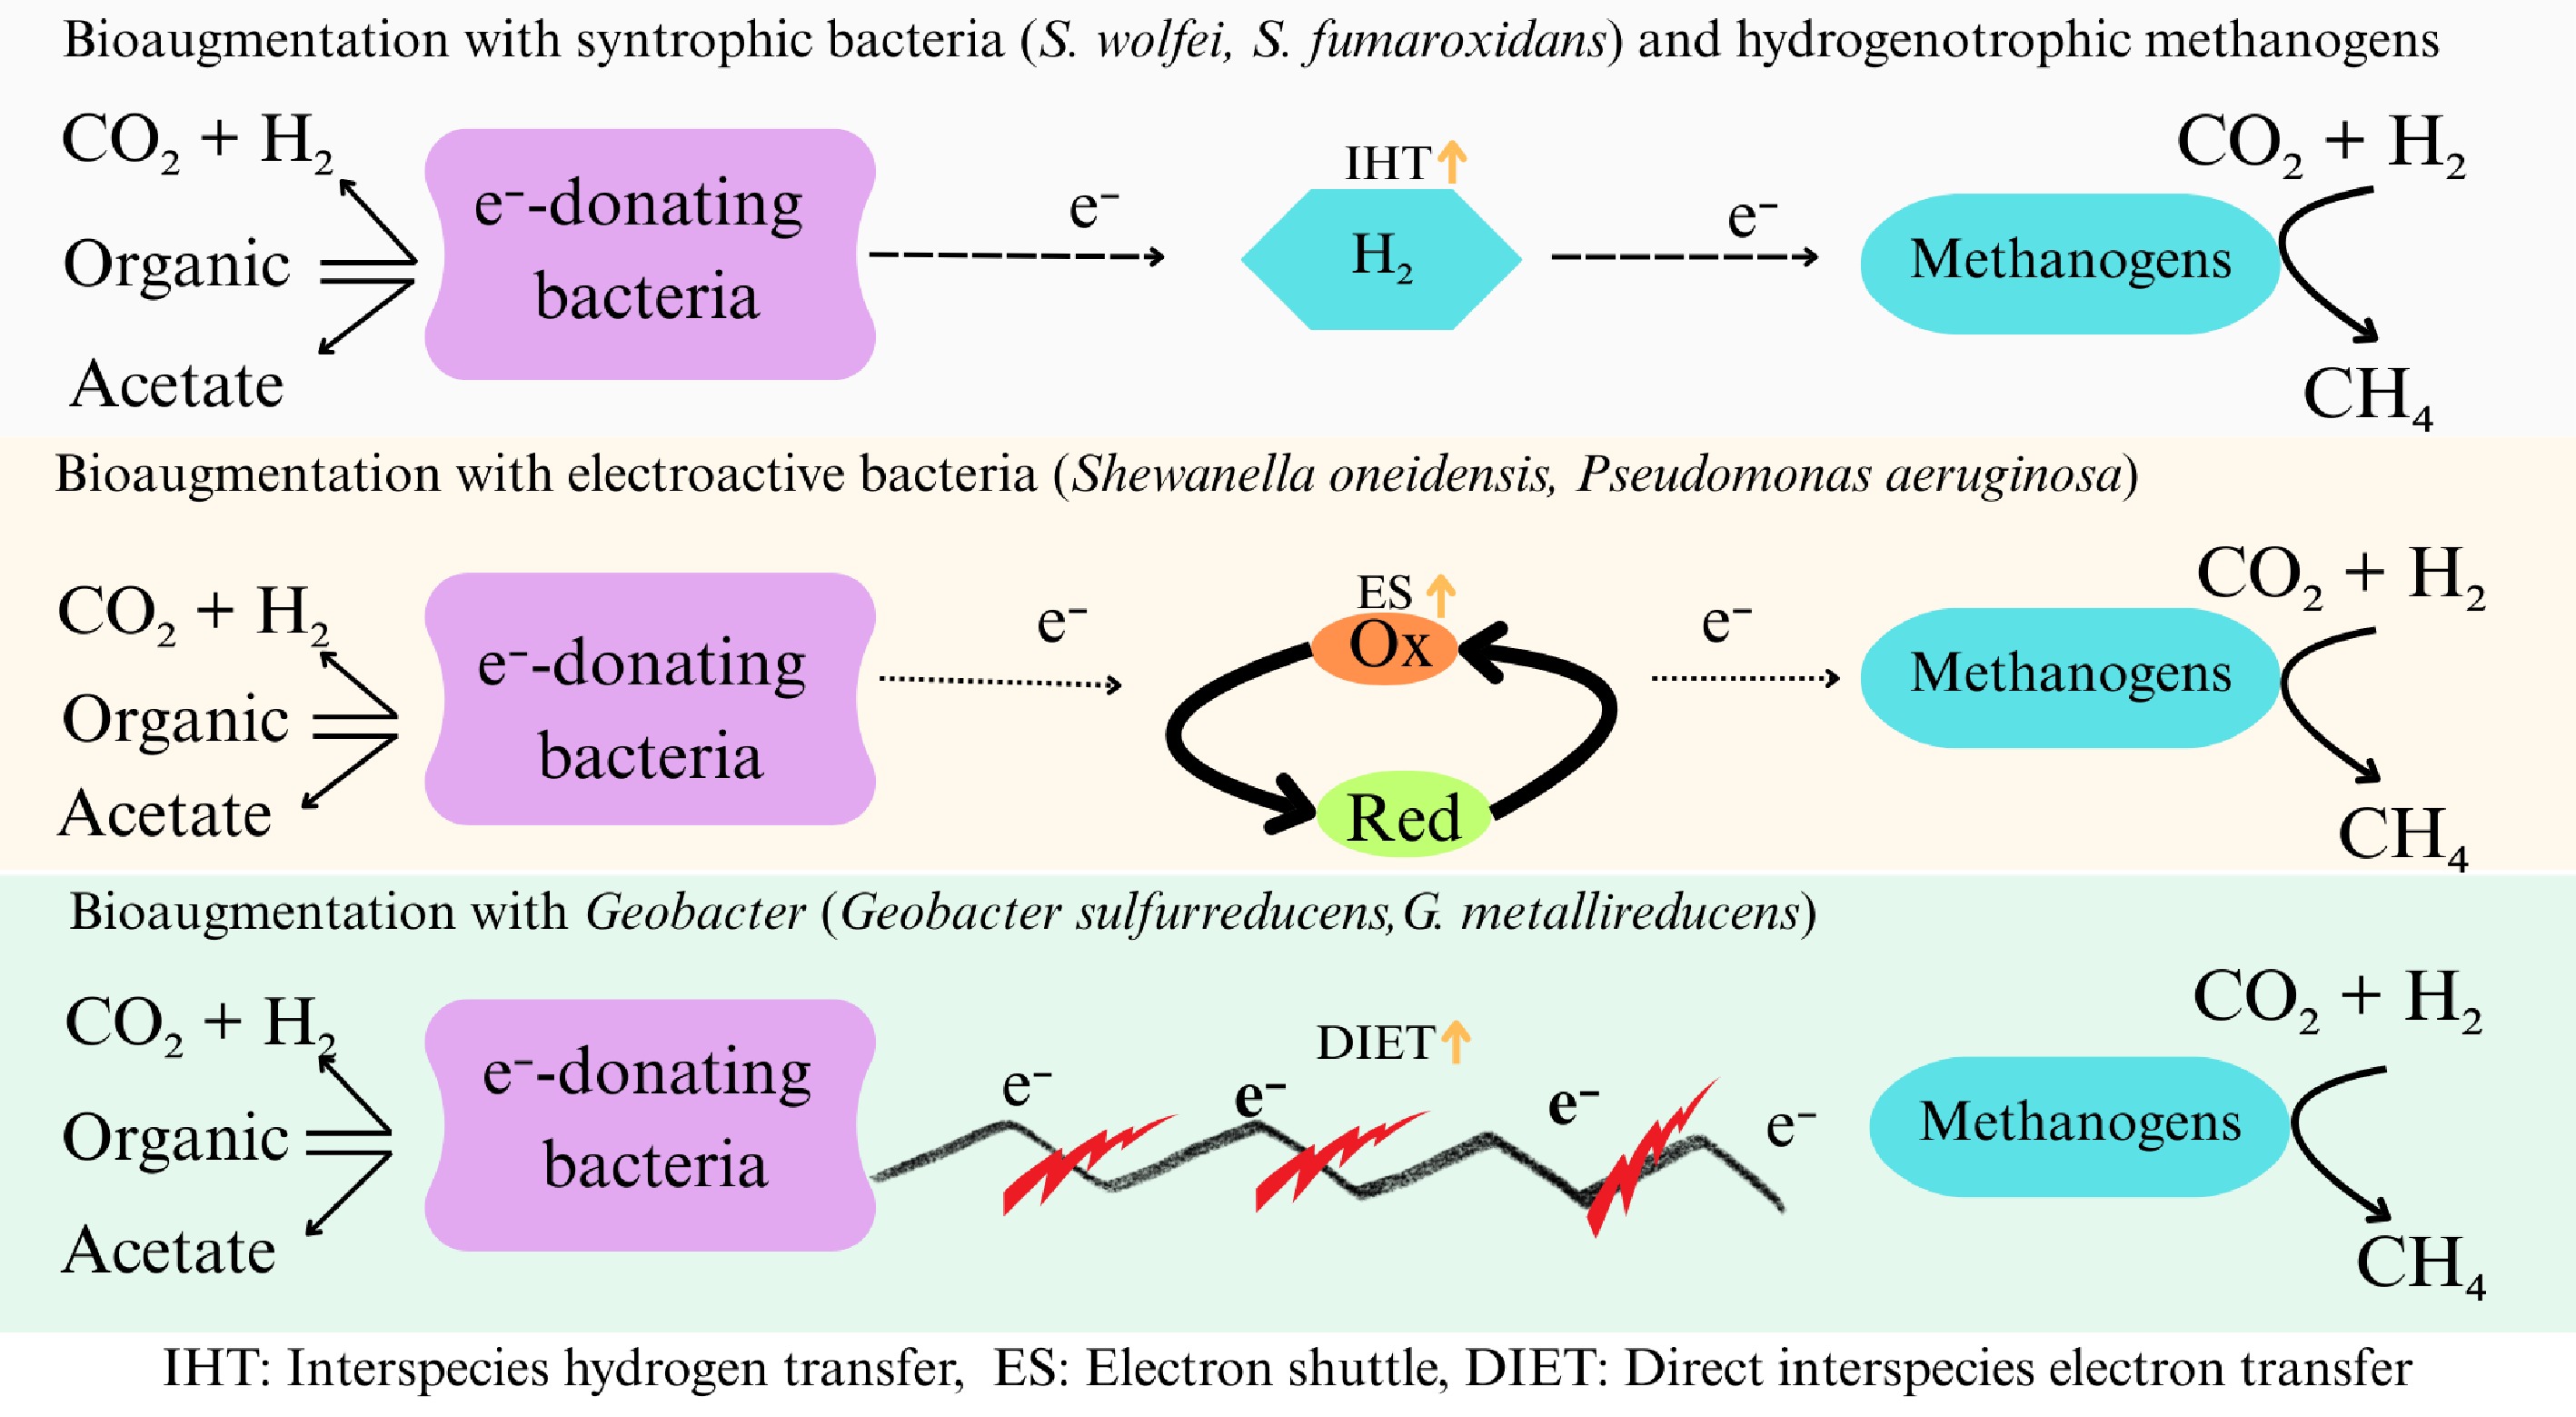
Figure 4.
Role of bioaugmented bacteria in enhancing methanogenesis for alleviation of ammonia inhibition. Inoculation with suitable strains could enable electron transfer between the syntrophic partners resulting in enhanced methanogenesis while mitigating impacts of ammonia accumulation. (This figure was produced using input from references[78,79]).
-
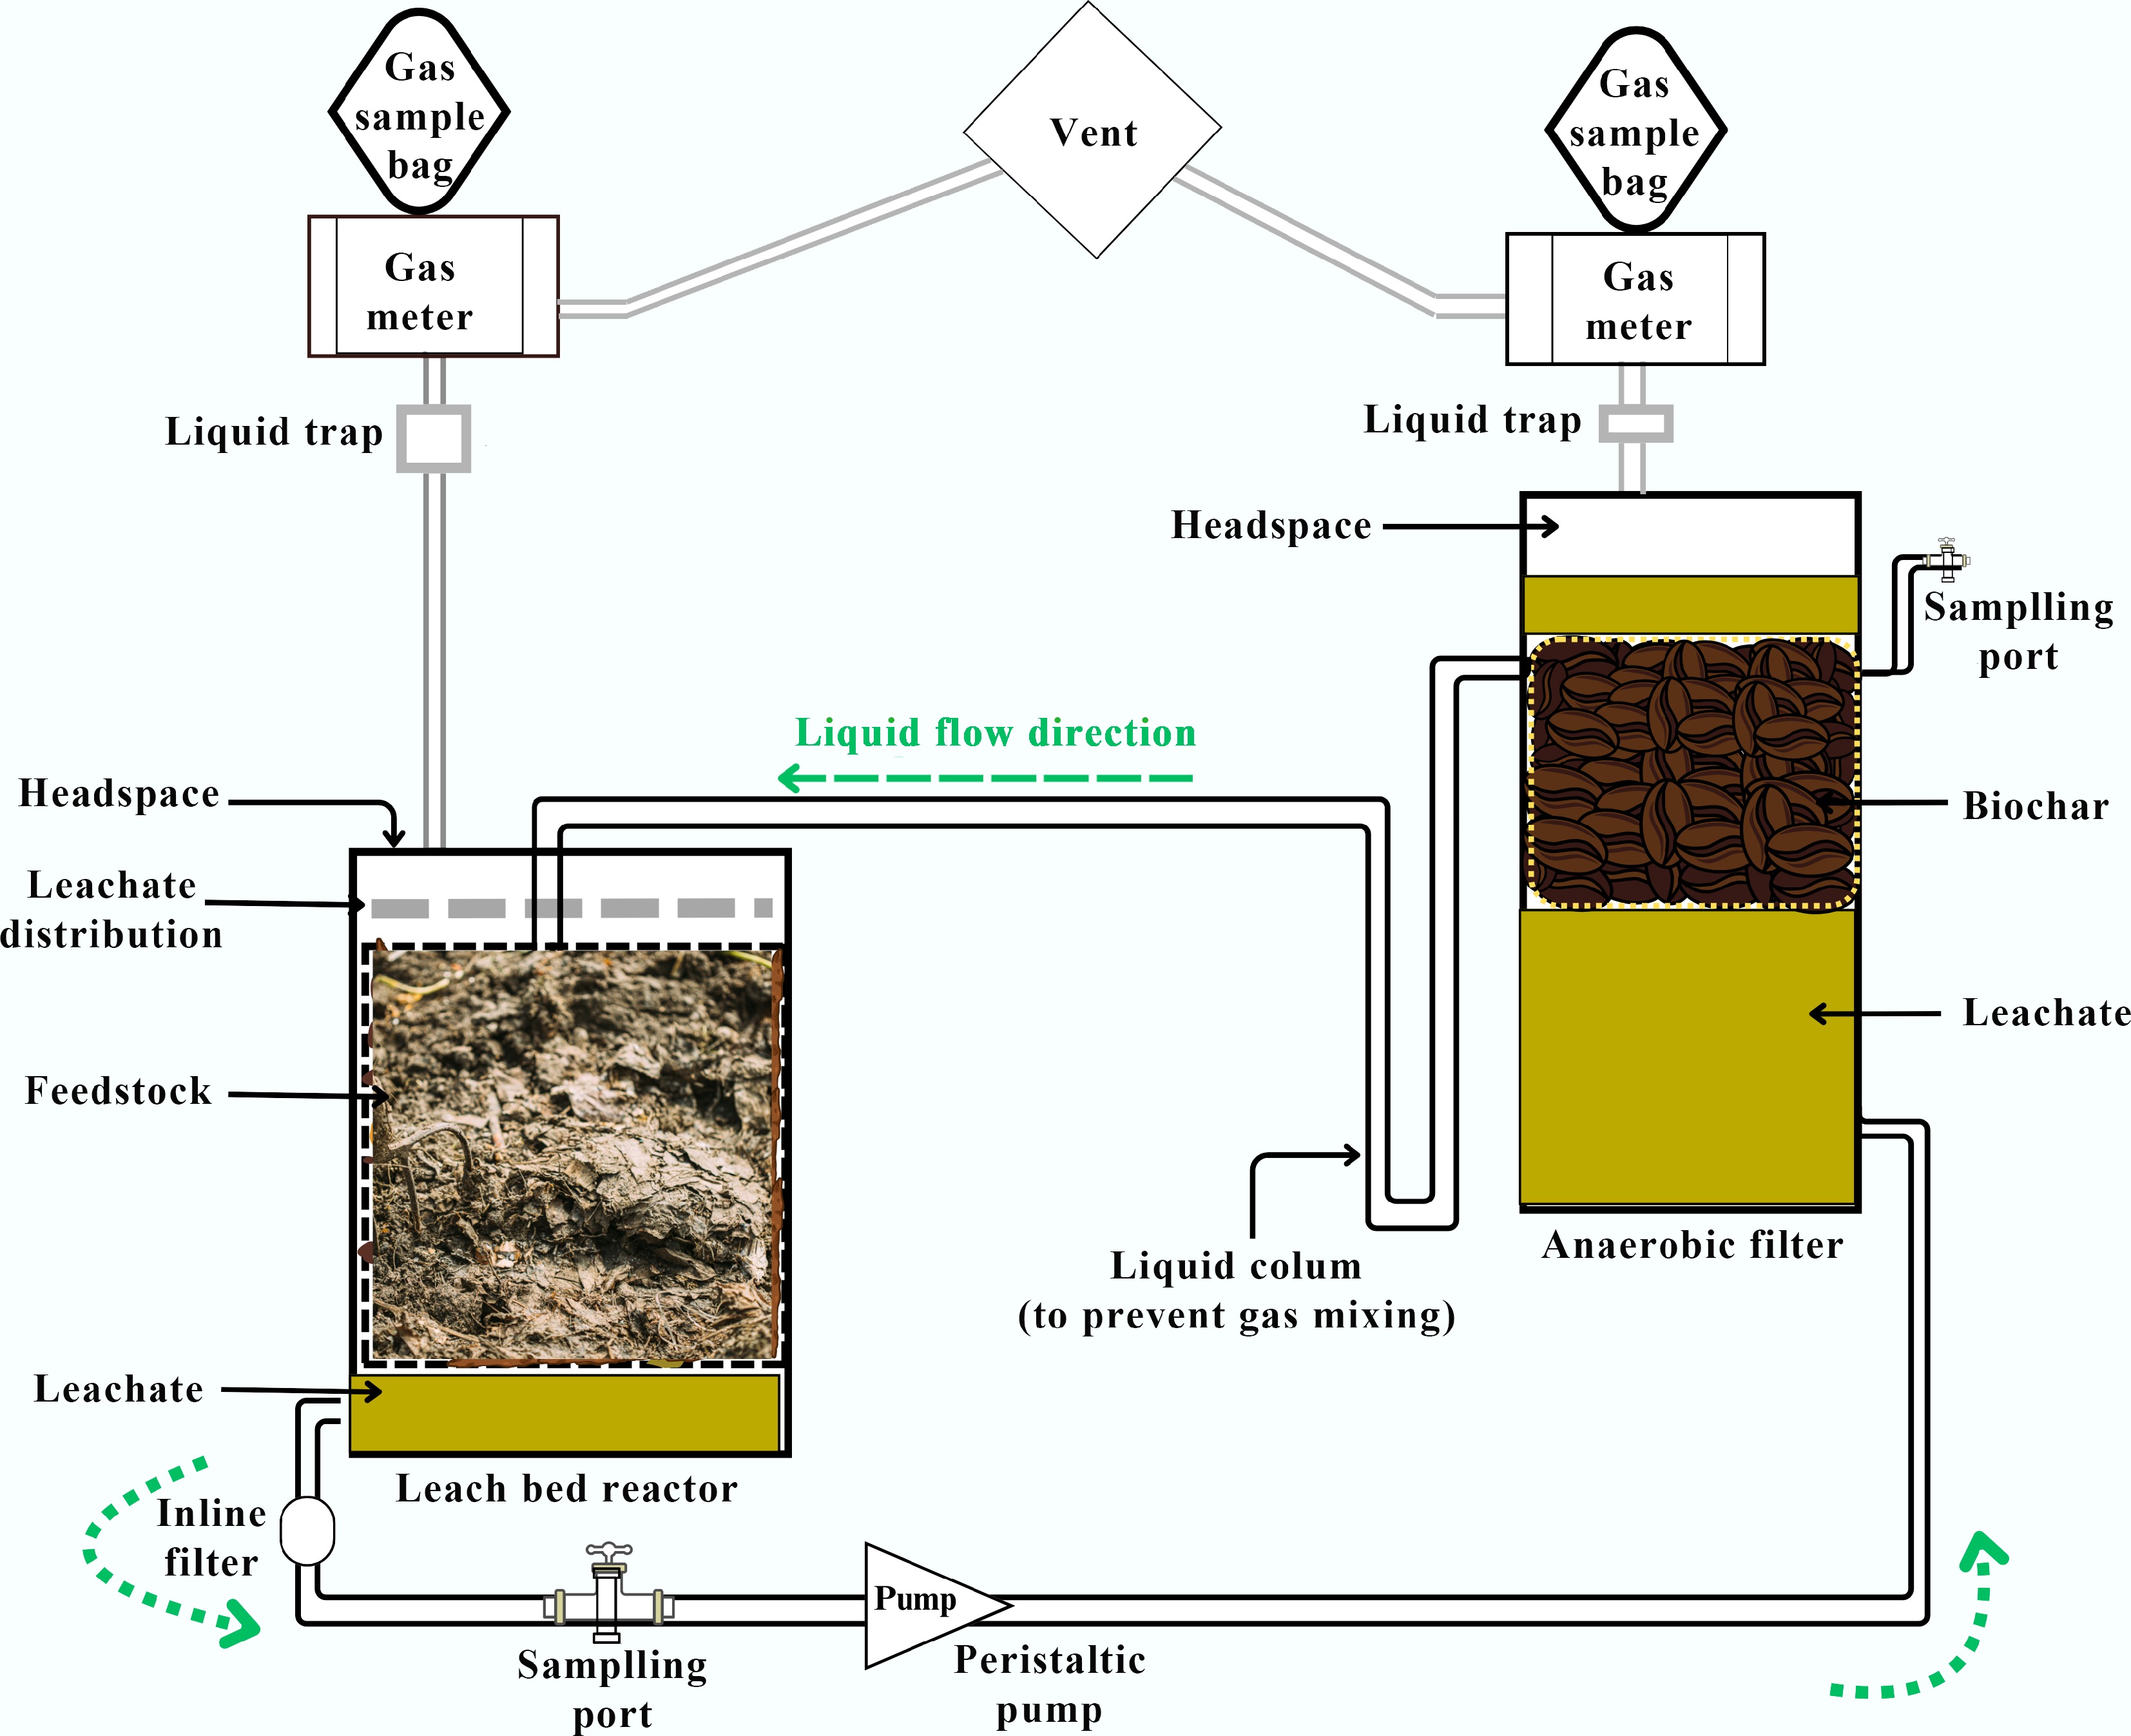
Figure 5.
Schematic representation of a leach bed reactor. A leach bed is coupled to a biochar filter for anaerobic digestion of nitrogen-rich wastes. (The figure was adapted from reference[81]).
-
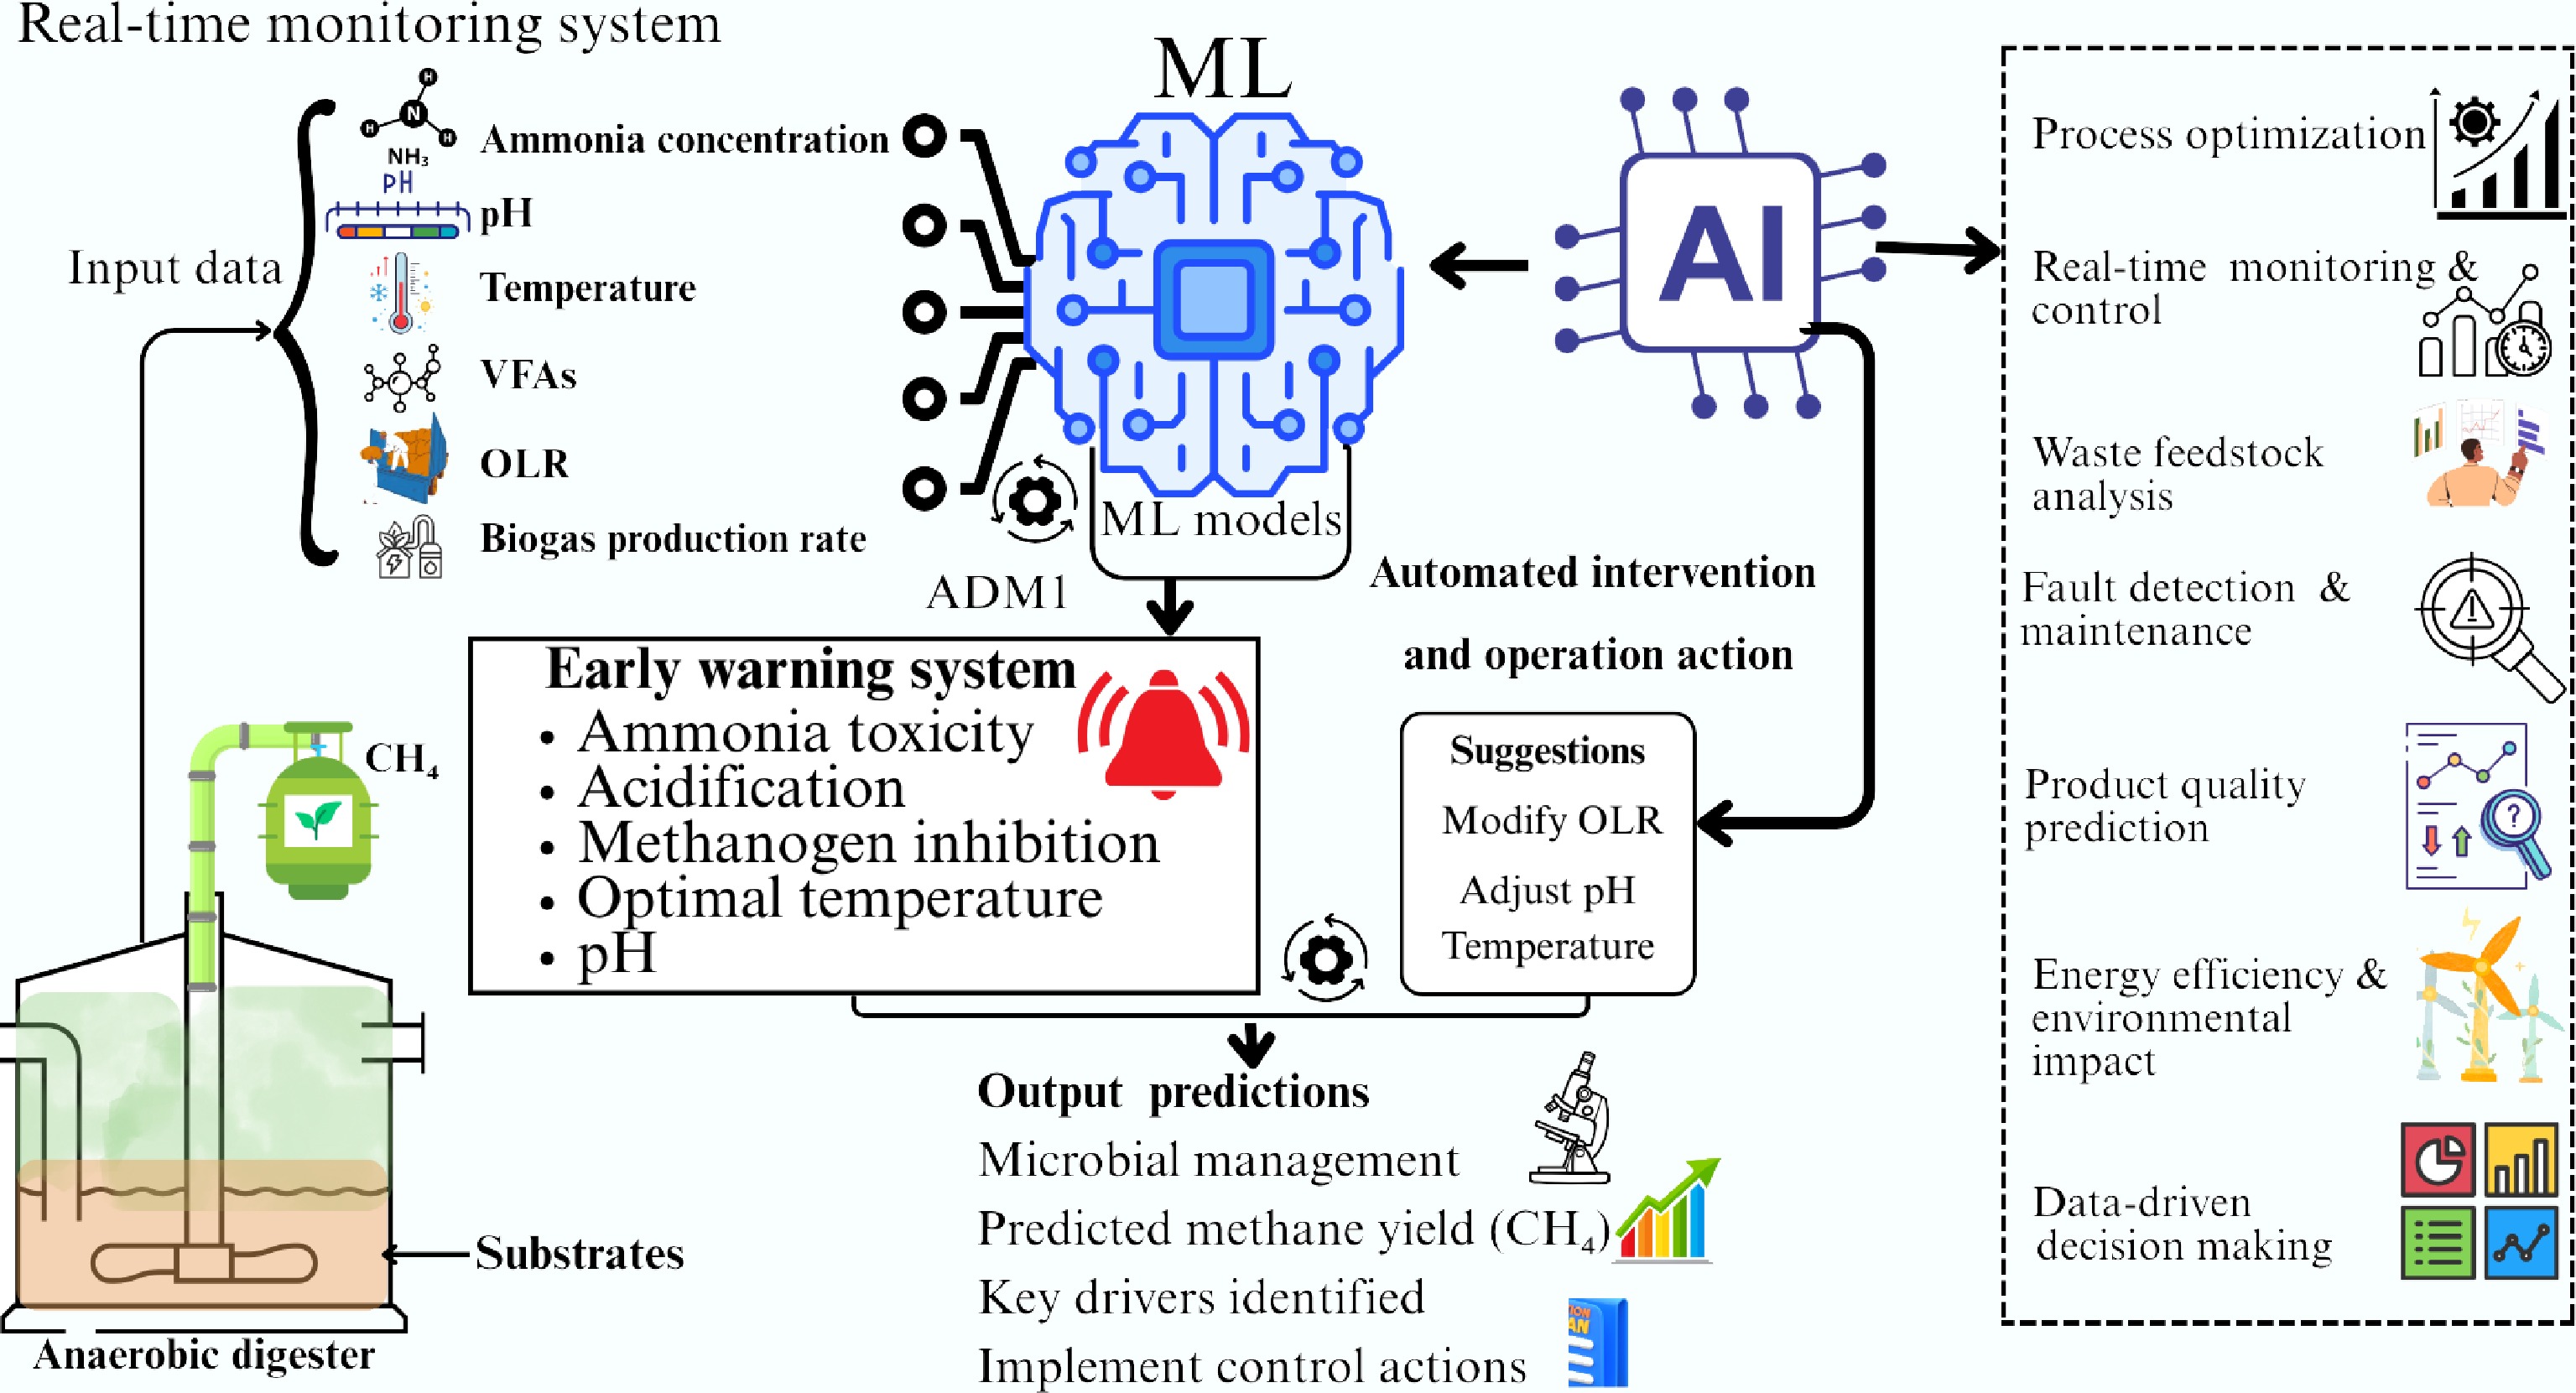
Figure 6.
Schematic representation of the application of ML and AI for enhanced methane yield while monitoring and preventing system inhibition resulting from ammonia accumulation.
-
Ammonia-rich waste TS (%) VS (%) TCOD (g/L) TN (mg/L) TAN (mg/L) Inhibition effect Ref. Pig manure 2.67 ± 0.10 1.86 ± 0.08 21.3 197.48 197.48 ± 32.27 CH4 decreased 20% as ammonia concentration increased from 1,800 to 4,800 mg/L; complete methanogenic failure > 6,000 mg/L [28] Chicken manure 20.0 ± 0.5 17.0 ± 0.4 202 ± 1.1 1825 1,700 ± 10 Methane yield reduced by 18% (414−340 mL/g); inhibition TAN: 3.5−8.5 g NH4+-N/L [29] Cow manure 26.57 ± 0.84 19.27 ± 0.72 N/A N/A 1,510 ± 280 50% CH4 inhibition at 7 g/L TAN, failure at
> 8 g/L TAN[30] Primary sludge,
thickened waste
activated sludge8.2 5.3 85 4,100 1,400 CH4 yield reduced by 31% due to propionate
> 2.2 g/L; inhibition TAN 5.6−5.7 g N/L[31] Rice, rotten
vegetables, eggs57 51.34 27.64 405,120 3,700–4,946 CH4 yield reduced by 67% (from 321−106 mL/g)
and 99% (to 0.07 mL/g) at TAN 3.7–5.5 g/L[32] Chicken manure,
corn straw57.79 ± 0.82 32.64 ± 0.36 26.9 59,200 2,470–4,340 CH4 yield reduced by 71.14% (phase IV,
4,340.11 mg/L); inhibition TAN: 2,869.71–
4,340.11 mg/L, severe > 4,000 mg/L[27] Food Waste 5.2 90 46.8 39,000 2,360–3,200 CH4 yield reduced by 46.7% (0.08 L CH4/g COD added) at TAN 2.4 g/L and OLR 8 kg COD/(m3·d); inhibition TAN: 2.4–3.2 g/L [33] Chicken manure 29.2 ± 0.5 70.2 ± 3.0 65.38 3.8 3,775 ± 30 CH4 yield reduced by 50% at TAN 9,069 mg/L
and TVFA 33,646 mg-HAc/L[34] Chicken manure 92.46 ± 1.82 59.10 ± 0.39 1.29–24.85 2,293 ± 174 1,884 ± 154 CH4 yield reduced by 40% at TAN 1,884 mg/L [35] Chicken manure 35 68 N/A 27,000 8,500–9,000 CH4 yield reduced by 100% (control), 42% (hydrogenotrophic methanogen consortium to
184 mL/g VS), and 34% (syntrophic microbial consortium to 211 mL/g VS) at TAN > 4.2 g/L[36] Mesophilic sludge 13.22 ± 0.39 8.16 ± 0.24 1.06 g COD/(L·d) 1,430 900 CH4 yield reduced by 41% at TAN 2,500 mg/L [37] Chicken manure 29.3 ± 3.2 21.5 ± 2.1 139 14,360 2,493 → 6,162 CH4 yield reduced by 66% (from 445 to
153 mL/L·d) at TAN 2.5–6.3 g/L[38] Taihu blue algae 7.83 6.24 N/A 3,100 2,100–7,000 CH4 yield reduced by 71.2% (from 266.7 to
76.7 mL CH4) at TAN 7 g/L, and 40.8%
(to 157.9 mL CH4) at 5 g/L[39] Pig manure 31.51 ± 1.80 57.63 10.9 15,900 970–1,059 CH4 yield reduced by 21% (from 217.4 to
172.2 L CH4/kg VS) at TAN > 1,000 mg/L[40] Pig manure 24.59 19.19 N/A 1,574 700 CH4 yield reduced by 4.6% at TAN > 700 mg/L [41] Table 1.
Recent studies discussing the inhibitory effects of ammonia accumulation on reactor output
-
Reactor
typeTemperature
(°C)Ammonia
(mg/L)Conductive material CH4
enhancementEffect Ref. Batch 35 TAN 9.609 Corn straw biochar 121.3% BC800 improved conductivity (8.72 S/m), enhanced DIET, reduced VFAs, enriched Bathyarchaeia and Methanosaeta, and achieved a 35% reduction in TAN. [34] Batch 37 NH3–N 3,200
FAN 100Hematite, Goethite, Ferrihydrite Hematite: 22.8%
Goethite: 39.4%
Ferrihydrite: 56.3%Fe(III) oxides enhanced VFA conversion and methanogenesis, with Goethite and Ferrihydrite triggering Feammox (NH4+ → N2), reducing ammonia inhibition, and enriching reductive iron bacteria (FeRB and ammonia-tolerant methanogens, TAN ↓50%, FAN ↓40%. [56] Semi-continuous stirred reactor 35 TAN 1,200
FAN 100PAC, Magnetite, Graphite PAC: +39.1%
Magnetite: +42.5%Methanogenesis, enzyme activity (F420, AK, and protease),
DIET enhanced; microbial salt-tolerance improved (Na+/H+ antiporter, K+ uptake, osmoprotectant transport); microbial viability maintained (↑40%); TAN: ≤ 1,200 mg/L, FAN: ≤
100 mg/L (40% reduction).[57] Batch 37 FAN > 100 IP, BC BC: 18.9%
IP: 9.8%Biochar boosted acetate degradation; Methanobacterium enrichment; TAN controlled, FAN ≤ 100 mg/L. [58] Batch 37 NH3–N 1,500
TAN 4,000Biochar, GAC, Magnetite Biochar: 7.6%.
GAC: 17.6%.
Magnetite: 10.4%COD removal: > 90% (GAC); enhanced degradation of N-organics and inhibitors; enrichment of DIET microbes (Syntrophorhabdus, Syner-01, Mesotoga, Methanosaeta); Methane yield increase: +77% (magnetite), TAN: > 80% degradation (biochar), FAN: Controlled (GAC removal). [59] Batch 35–37 TAN 3,200
FAN > 100Ferrihydrite 84.8% Boosted COD removal to 88%–92% (vs 71% control), increased TN removal by 36.8%–52.5%, and shifted community toward Methanobacterium, Methanosarcina, and Methanosaeta. TAN: reduced from 3,200 to 2,086 mg/L, FAN: controlled below 100 mg/L. [56] Batch 26 22.5 ICB 83.70% Enriched ammonia-tolerant methanogens (Methanosarcina, Methanosaeta). TAN: reduced from 22.5 to 15.6 mg/L (30.7%). [60] Batch 37 NH4+-N 4,946 FeMn-MOF/G +201% Increased activity of coenzyme F420, NH4+-N reduced by 57.8% to 2,086 mg/L. Enriched Methanosarcina, enhanced acetoclastic methanogenesis pathway. [32] Batch 35 TAN 1,260 GO, MGO 284% GO/MGO facilitated DIET, enhanced microbial attachment, and boosted hydrolysis; TAN reduced from 1,260 to 1,050 mg/L. [61] Batch 35 TAN 4,527 Fe-Z 195% Promoted microbial activity, electron transfer, syntrophic oxidation, enrichment of electroactive communities like Anaerolineae and Methanosarcinaceae, and boosting metabolic pathways such as carbohydrate metabolism;
and TAN reduced to 1,177 mg/L.[62] Two-phase anaerobic digestion system 35 TAN 1,700 ZVI, activated carbon 143% ZVI improved hydrolysis and acidogenesis, while methanogenesis was enhanced through DIET; stabilized VFA/TA < 0.4, shifted dominant archaea from Methanoculleus to Methanosarcina. [63] Batch 35 TAN 5,000 Biochar (peanut shells pyrolyzed) 37% Lag phase halved (18 → 9 d), accelerated acetate use, enhanced DIET via pili and cytochrome C, enriched Sporanaerobacter, Blvii28, Methanobacterium and Methanosaeta, up-regulated NH4+ detox (glutamine synthetase); reduced TAN inhibition by 63% under 5.0 g/L ammonia stress. [64] Batch 35–45 NH4+–N 2,000 Fe–C Cumulative CH4
128.31% (MAD)
286.96% (STAD)Fe–C enhanced DIET, electron/proton transfer, and energy metabolism; enriched Chloroflexota, Methanosarcina, Methanoculleus; upregulated ATPase; ammonia < 2.0 g/L boosts methane, while > 2.0 g/L inhibits. [65] Semi-continuous anaerobic digestion 35 NH4+–N 600–3,300 RM 19.05% pH ↑3.97 → 6.27; enhanced hydrolysis and methanogenesis; promoted DIET, oxidative phosphorylation; enriched Candidatus Cloacimonetes, Bacteroidetes, Synergistetes, Methanosarcina, Methanothrix; up-regulated cytochrome c, e-pili (fixA, pilD, ccmE/F/G); enzymes (AK, phosphatases, CoA synthetase). [66] Batch 35 TAN: 1,500–2,082 Allophane 261%–350% Allophane mitigated ammonia inhibition through NH4+-N adsorption (capacity: 261.9 mg/g), enhanced DIET with increased Methanosaeta, Methanosarcina, and coenzyme F420 (up 103%–120%); TAN/FAN reduced below inhibitory thresholds (from 2,082 mg/L in control to < 1,500 mg/L). [67] Fe–C: Iron–carbon materials; PAC: Powdered activated carbon; IP: Iron powder; BC: Biochar; GO: Graphene oxide; MGO: Magnetite-decorated graphene oxide; Fe–Z: Fe-modified zeolite; ZVI: Zero valent iron; RM: Red mud; MAD: Mesophilic anaerobic digestion; STAD: Semi-thermophilic anaerobic digestion; FeMn-MOF/G: Metal–organic framework (MOF)-derived porous metal oxide/graphene nanocomposite. Table 2.
Recent studies reporting the role of conductive materials in alleviating ammonia inhibition
Figures
(6)
Tables
(2)