-
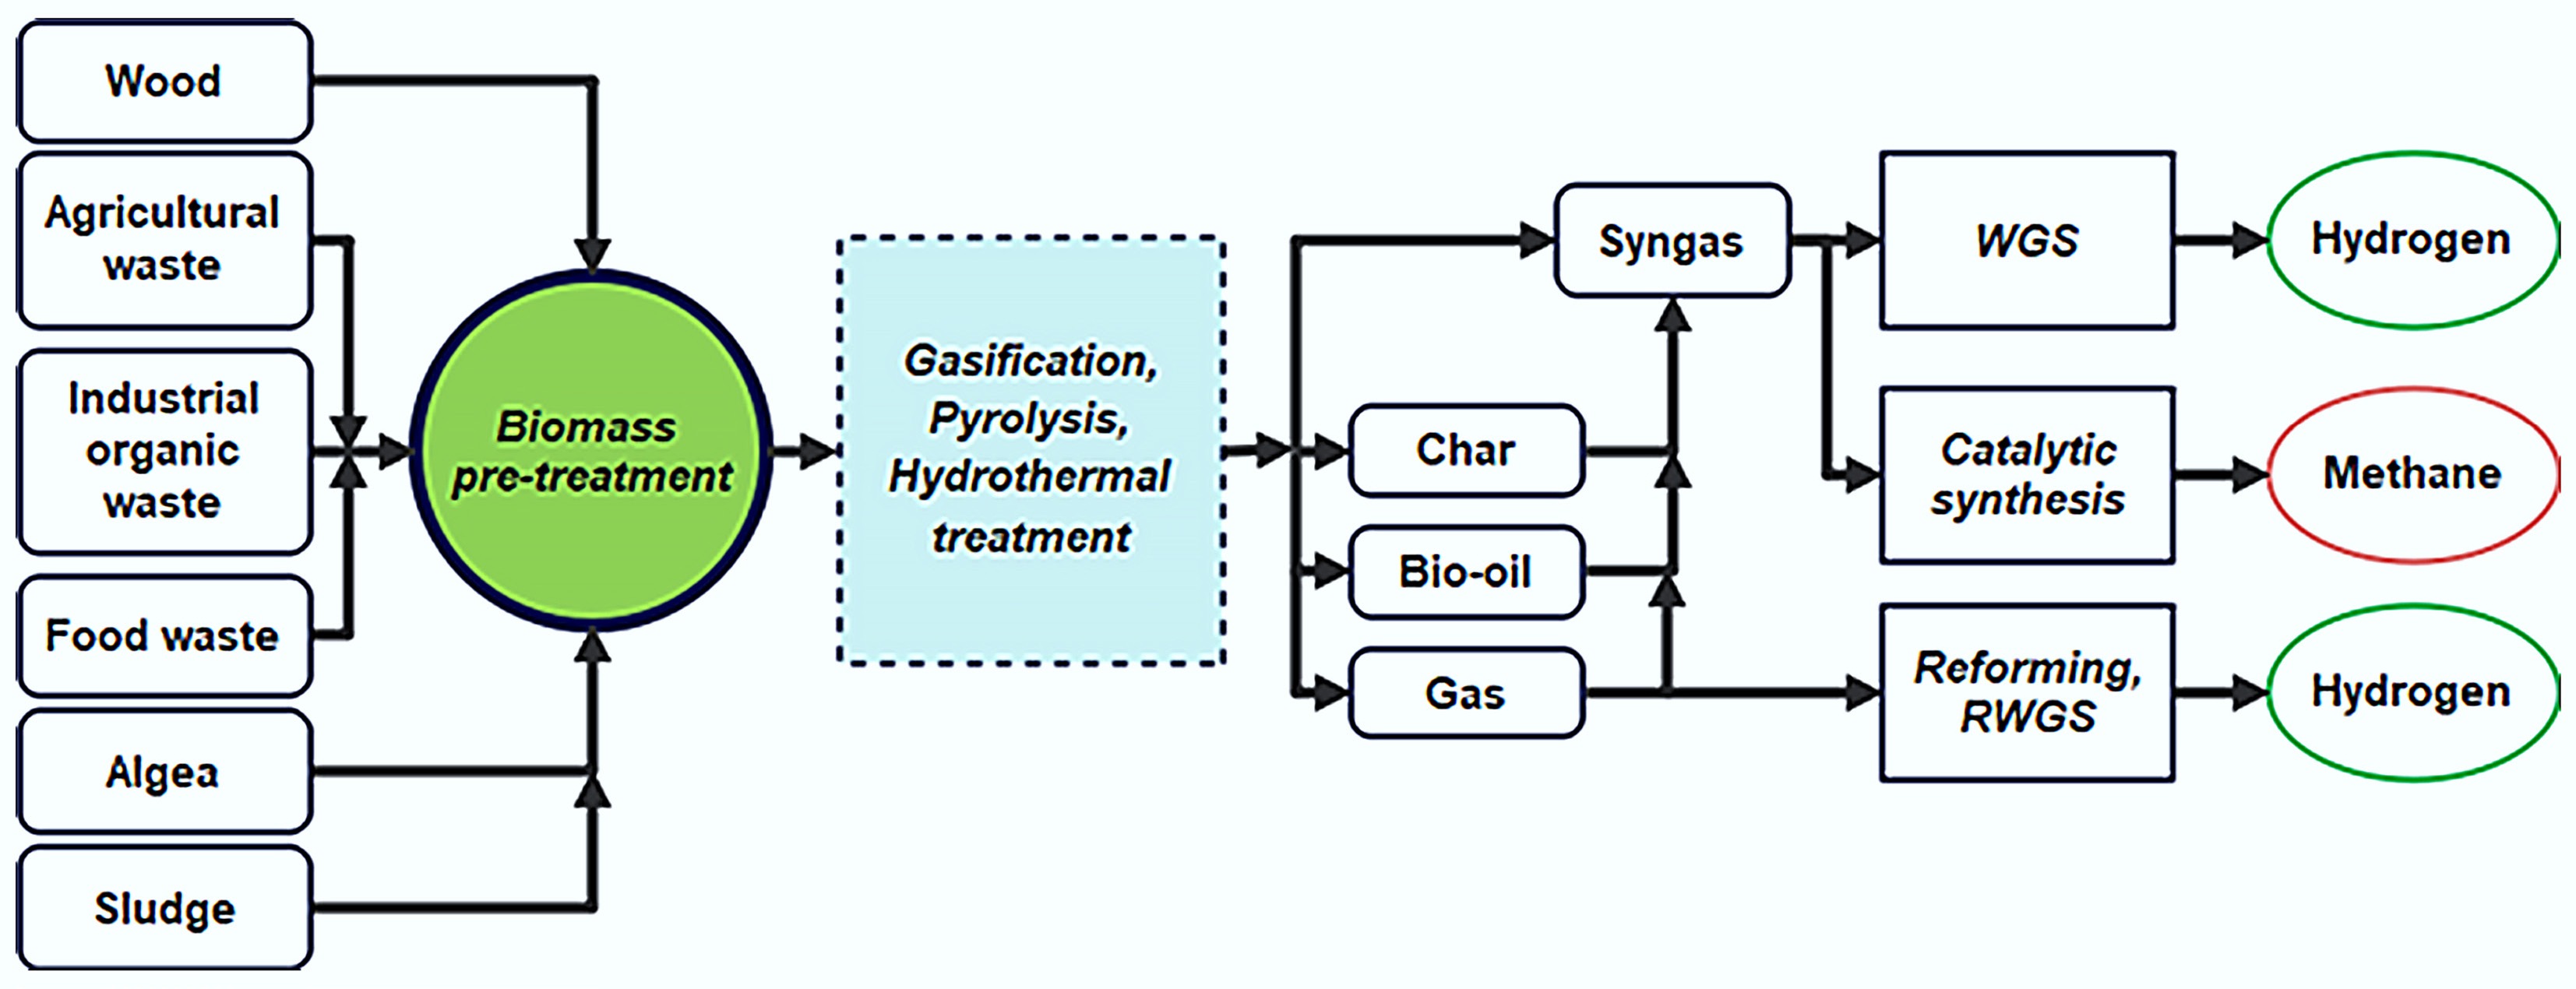
Figure 1.
Schematic flowchart for thermochemical conversion of biomass into syngas, bio-oil, and char.
-
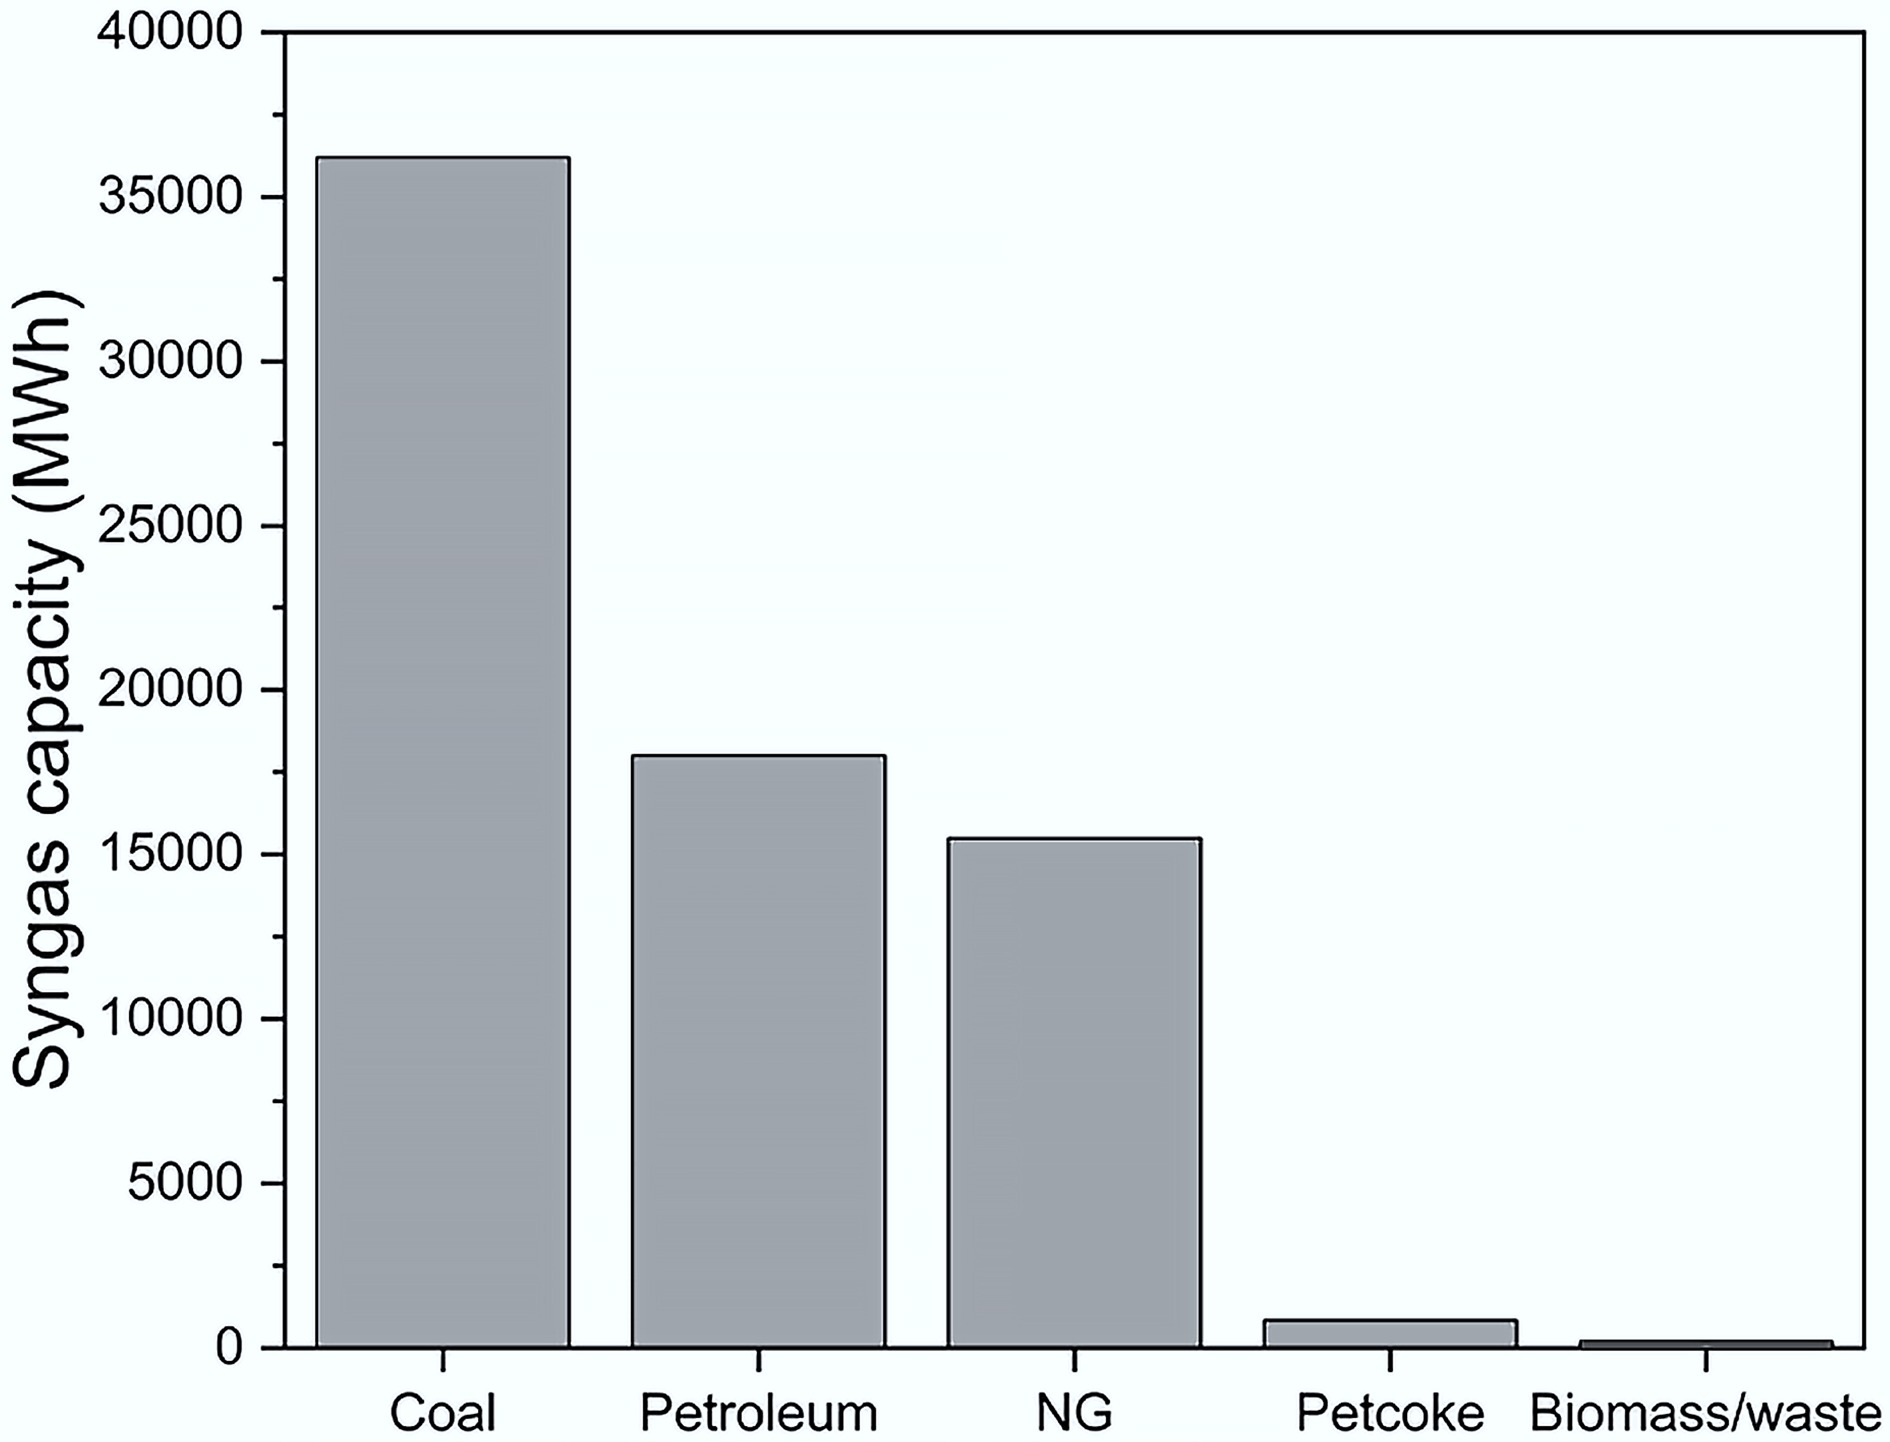
Figure 2.
Syngas production capacities of various feedstocks. Redraw based on the data from Ahmad et al. [7].
-
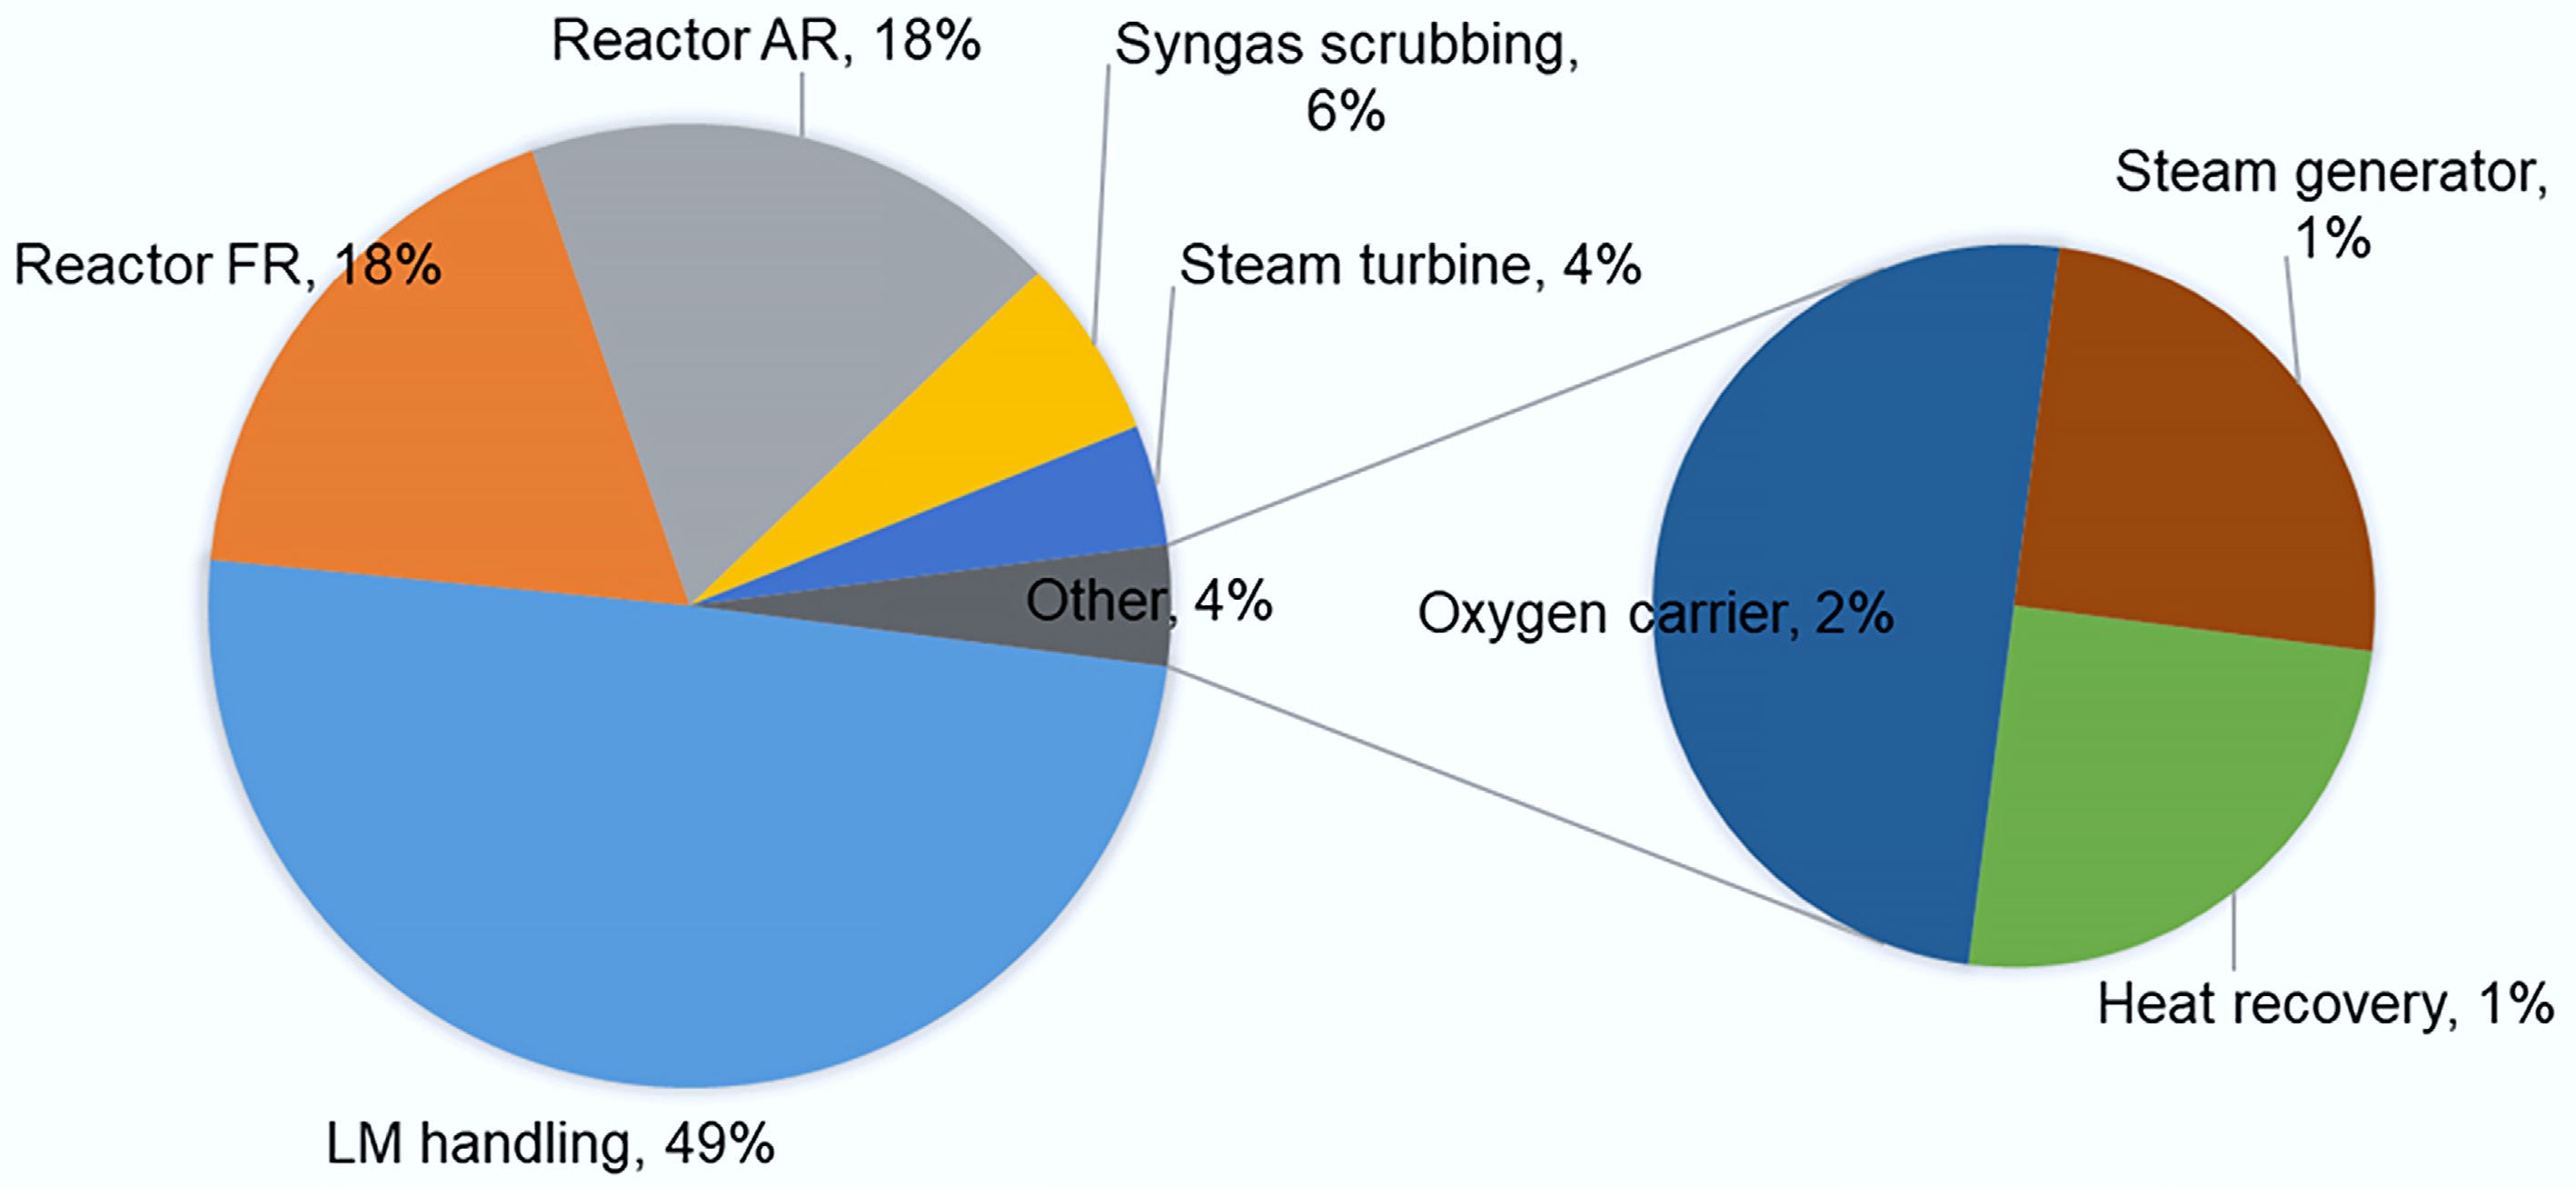
Figure 3.
Price breakdown for syngas production by chemical looping gasification process with liquid metal oxide carriers (CLG-LMOC). Redraw based on the data from Sarafraz & Christo[63].
-
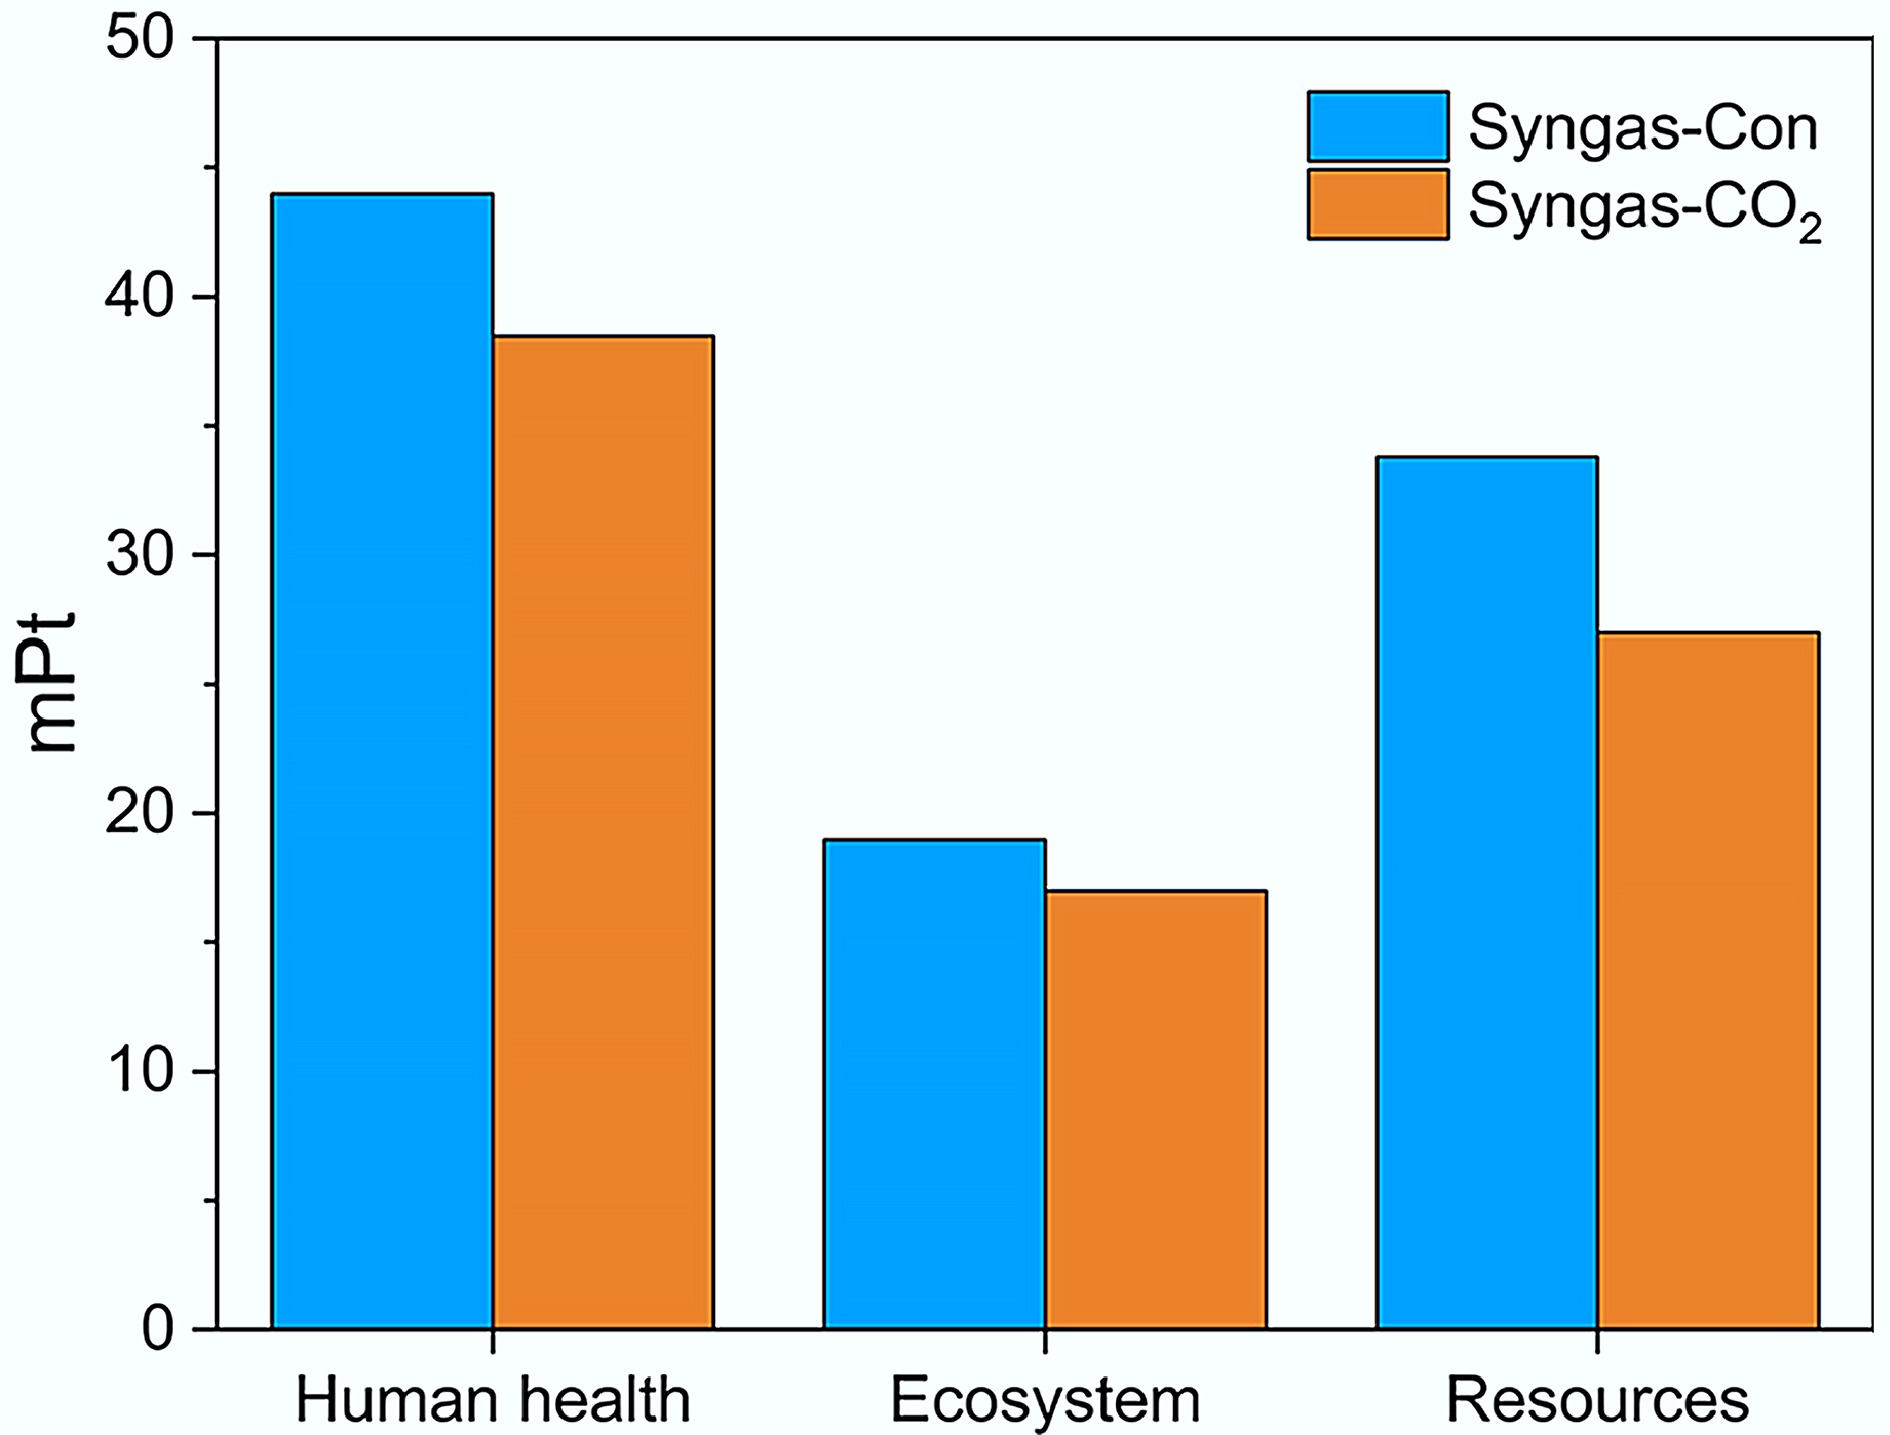
Figure 4.
Environmental impact caused-conventional biomass gasification (Syngas-Con) and CO2-enhanced biomass gasification (Syngas-CO2). Redraw based on the data from Parvez et al.[76].
-
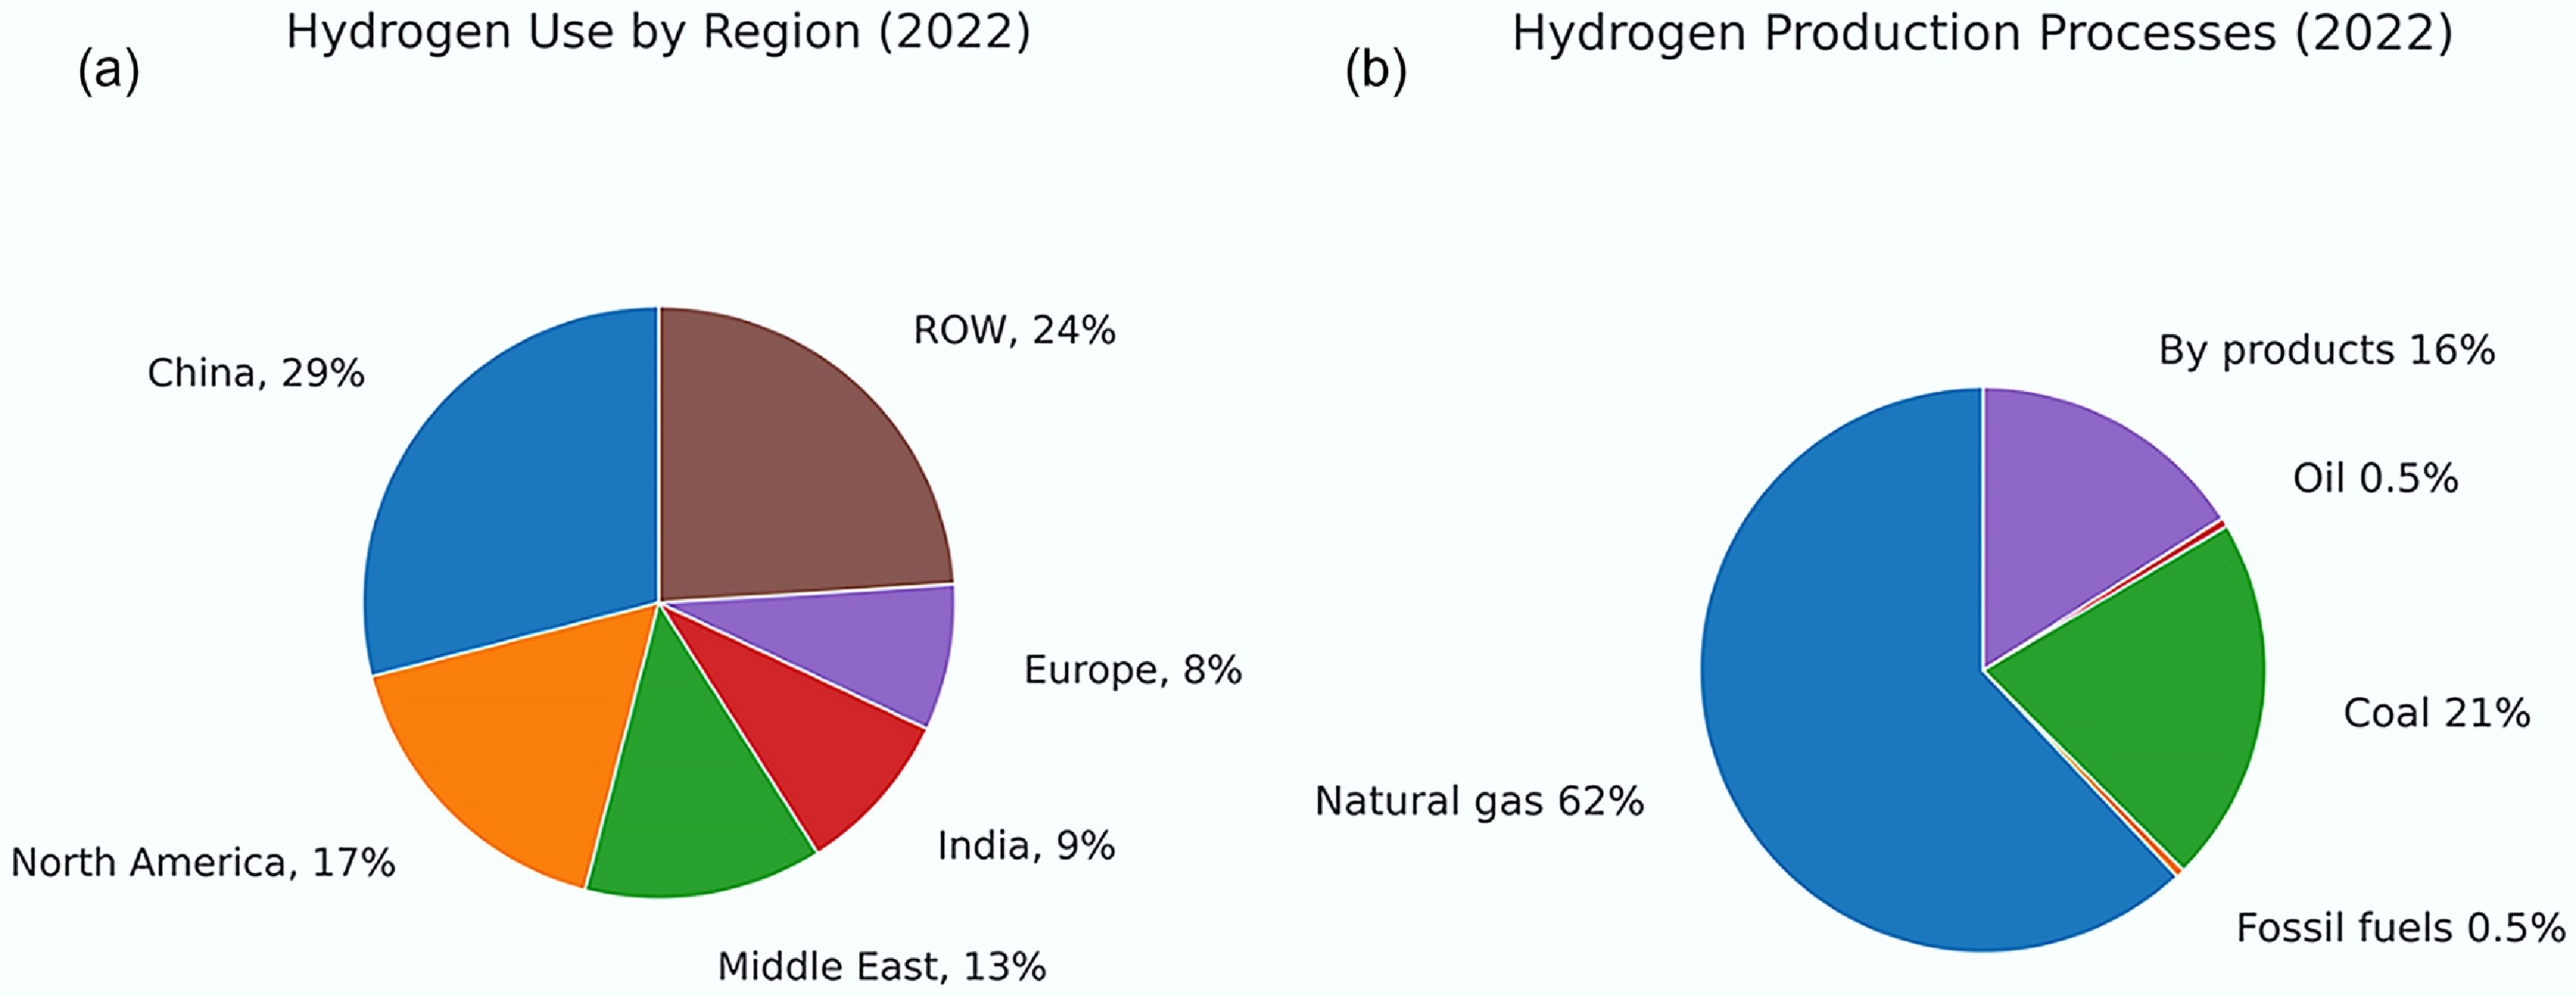
Figure 5.
(a) Major application regions, and (b) production processes of H2 in 2022. Redraw based on the data from IEA[93].
-
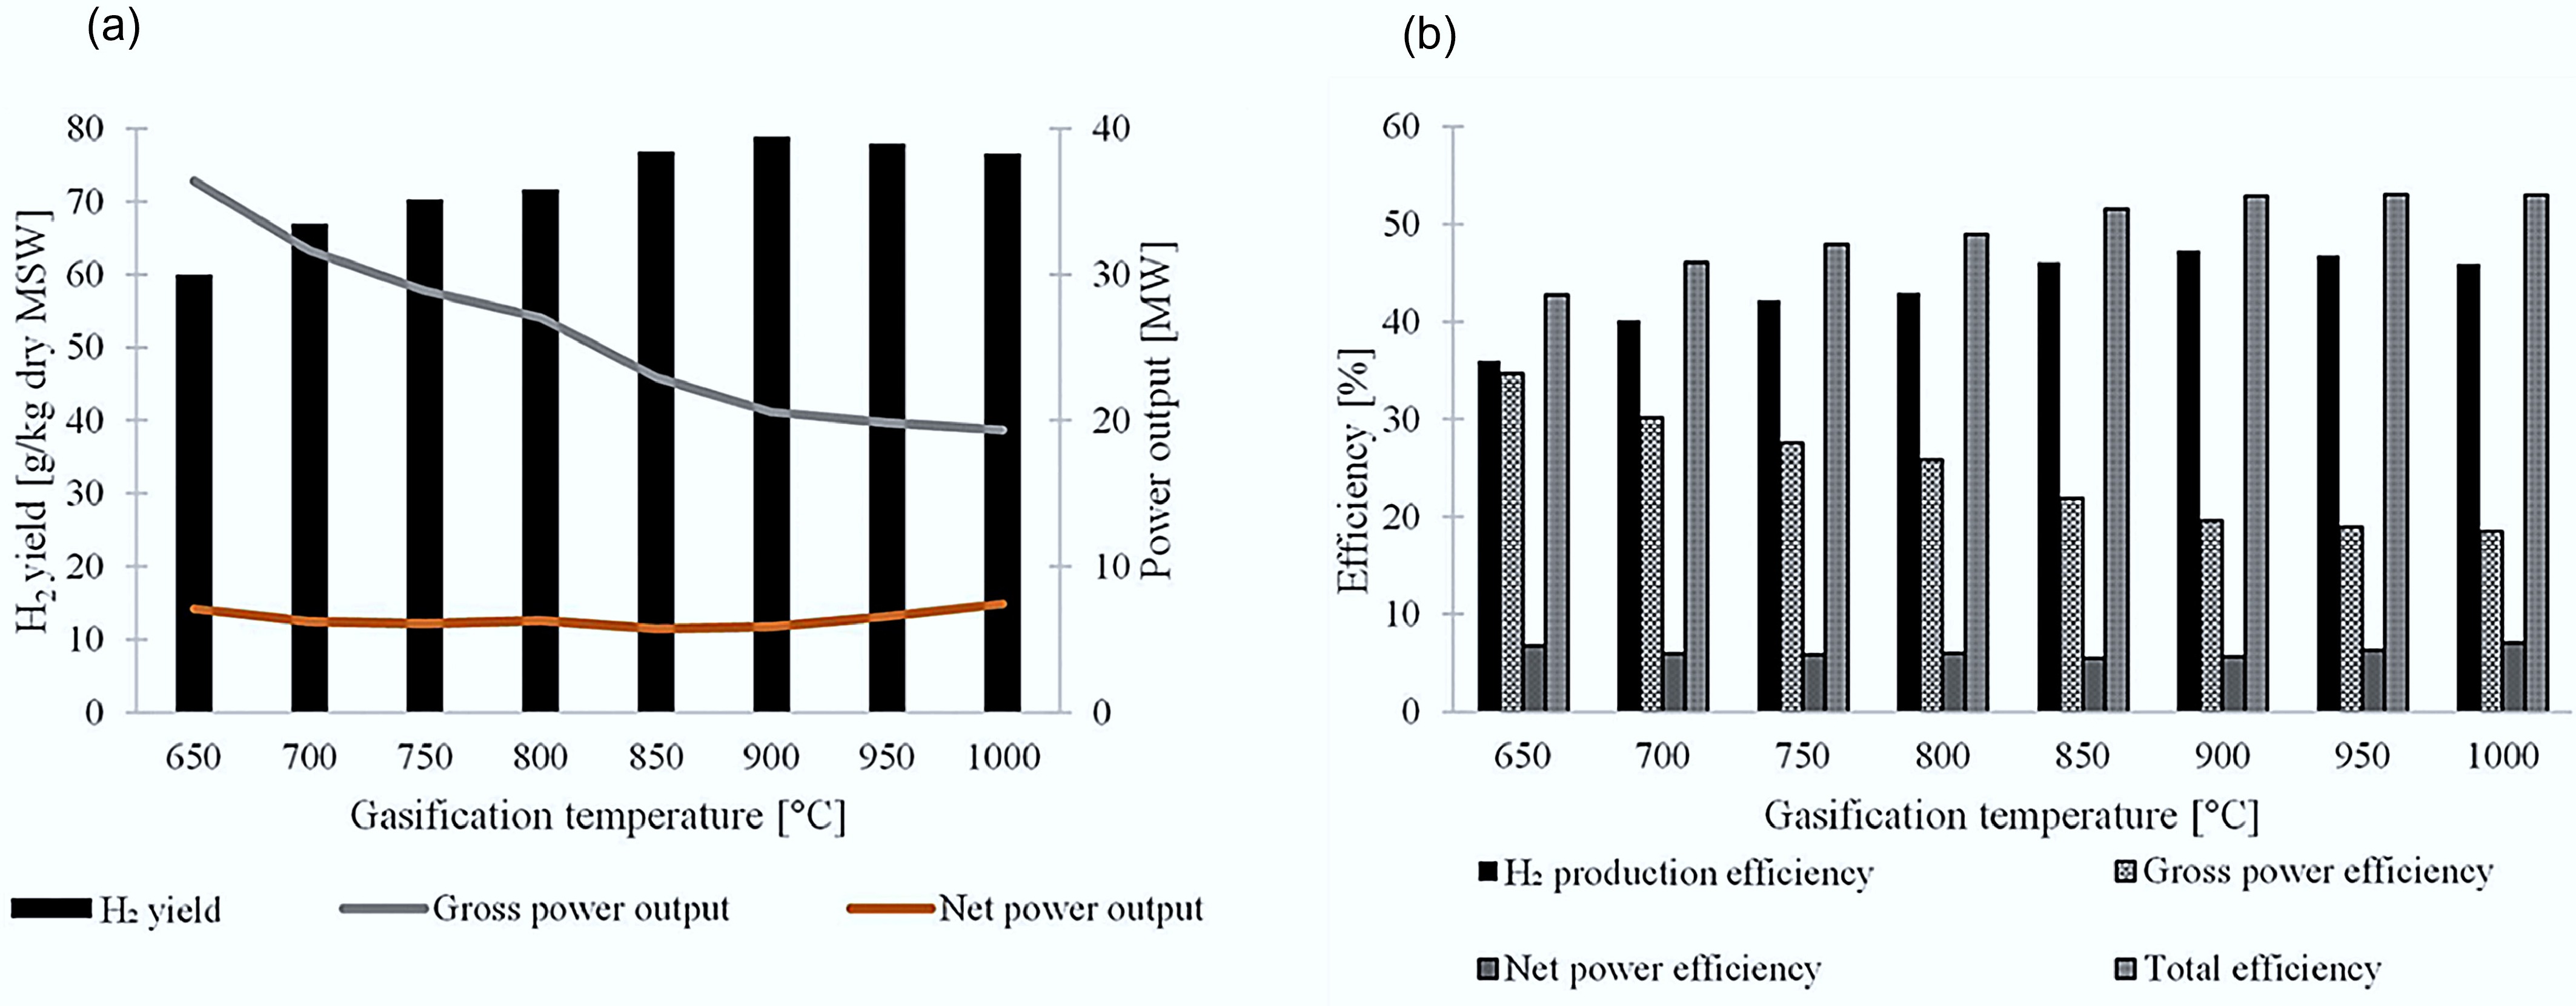
Figure 6.
The influence of gasification temperature on H2 product yield and process efficiencies[54].
-
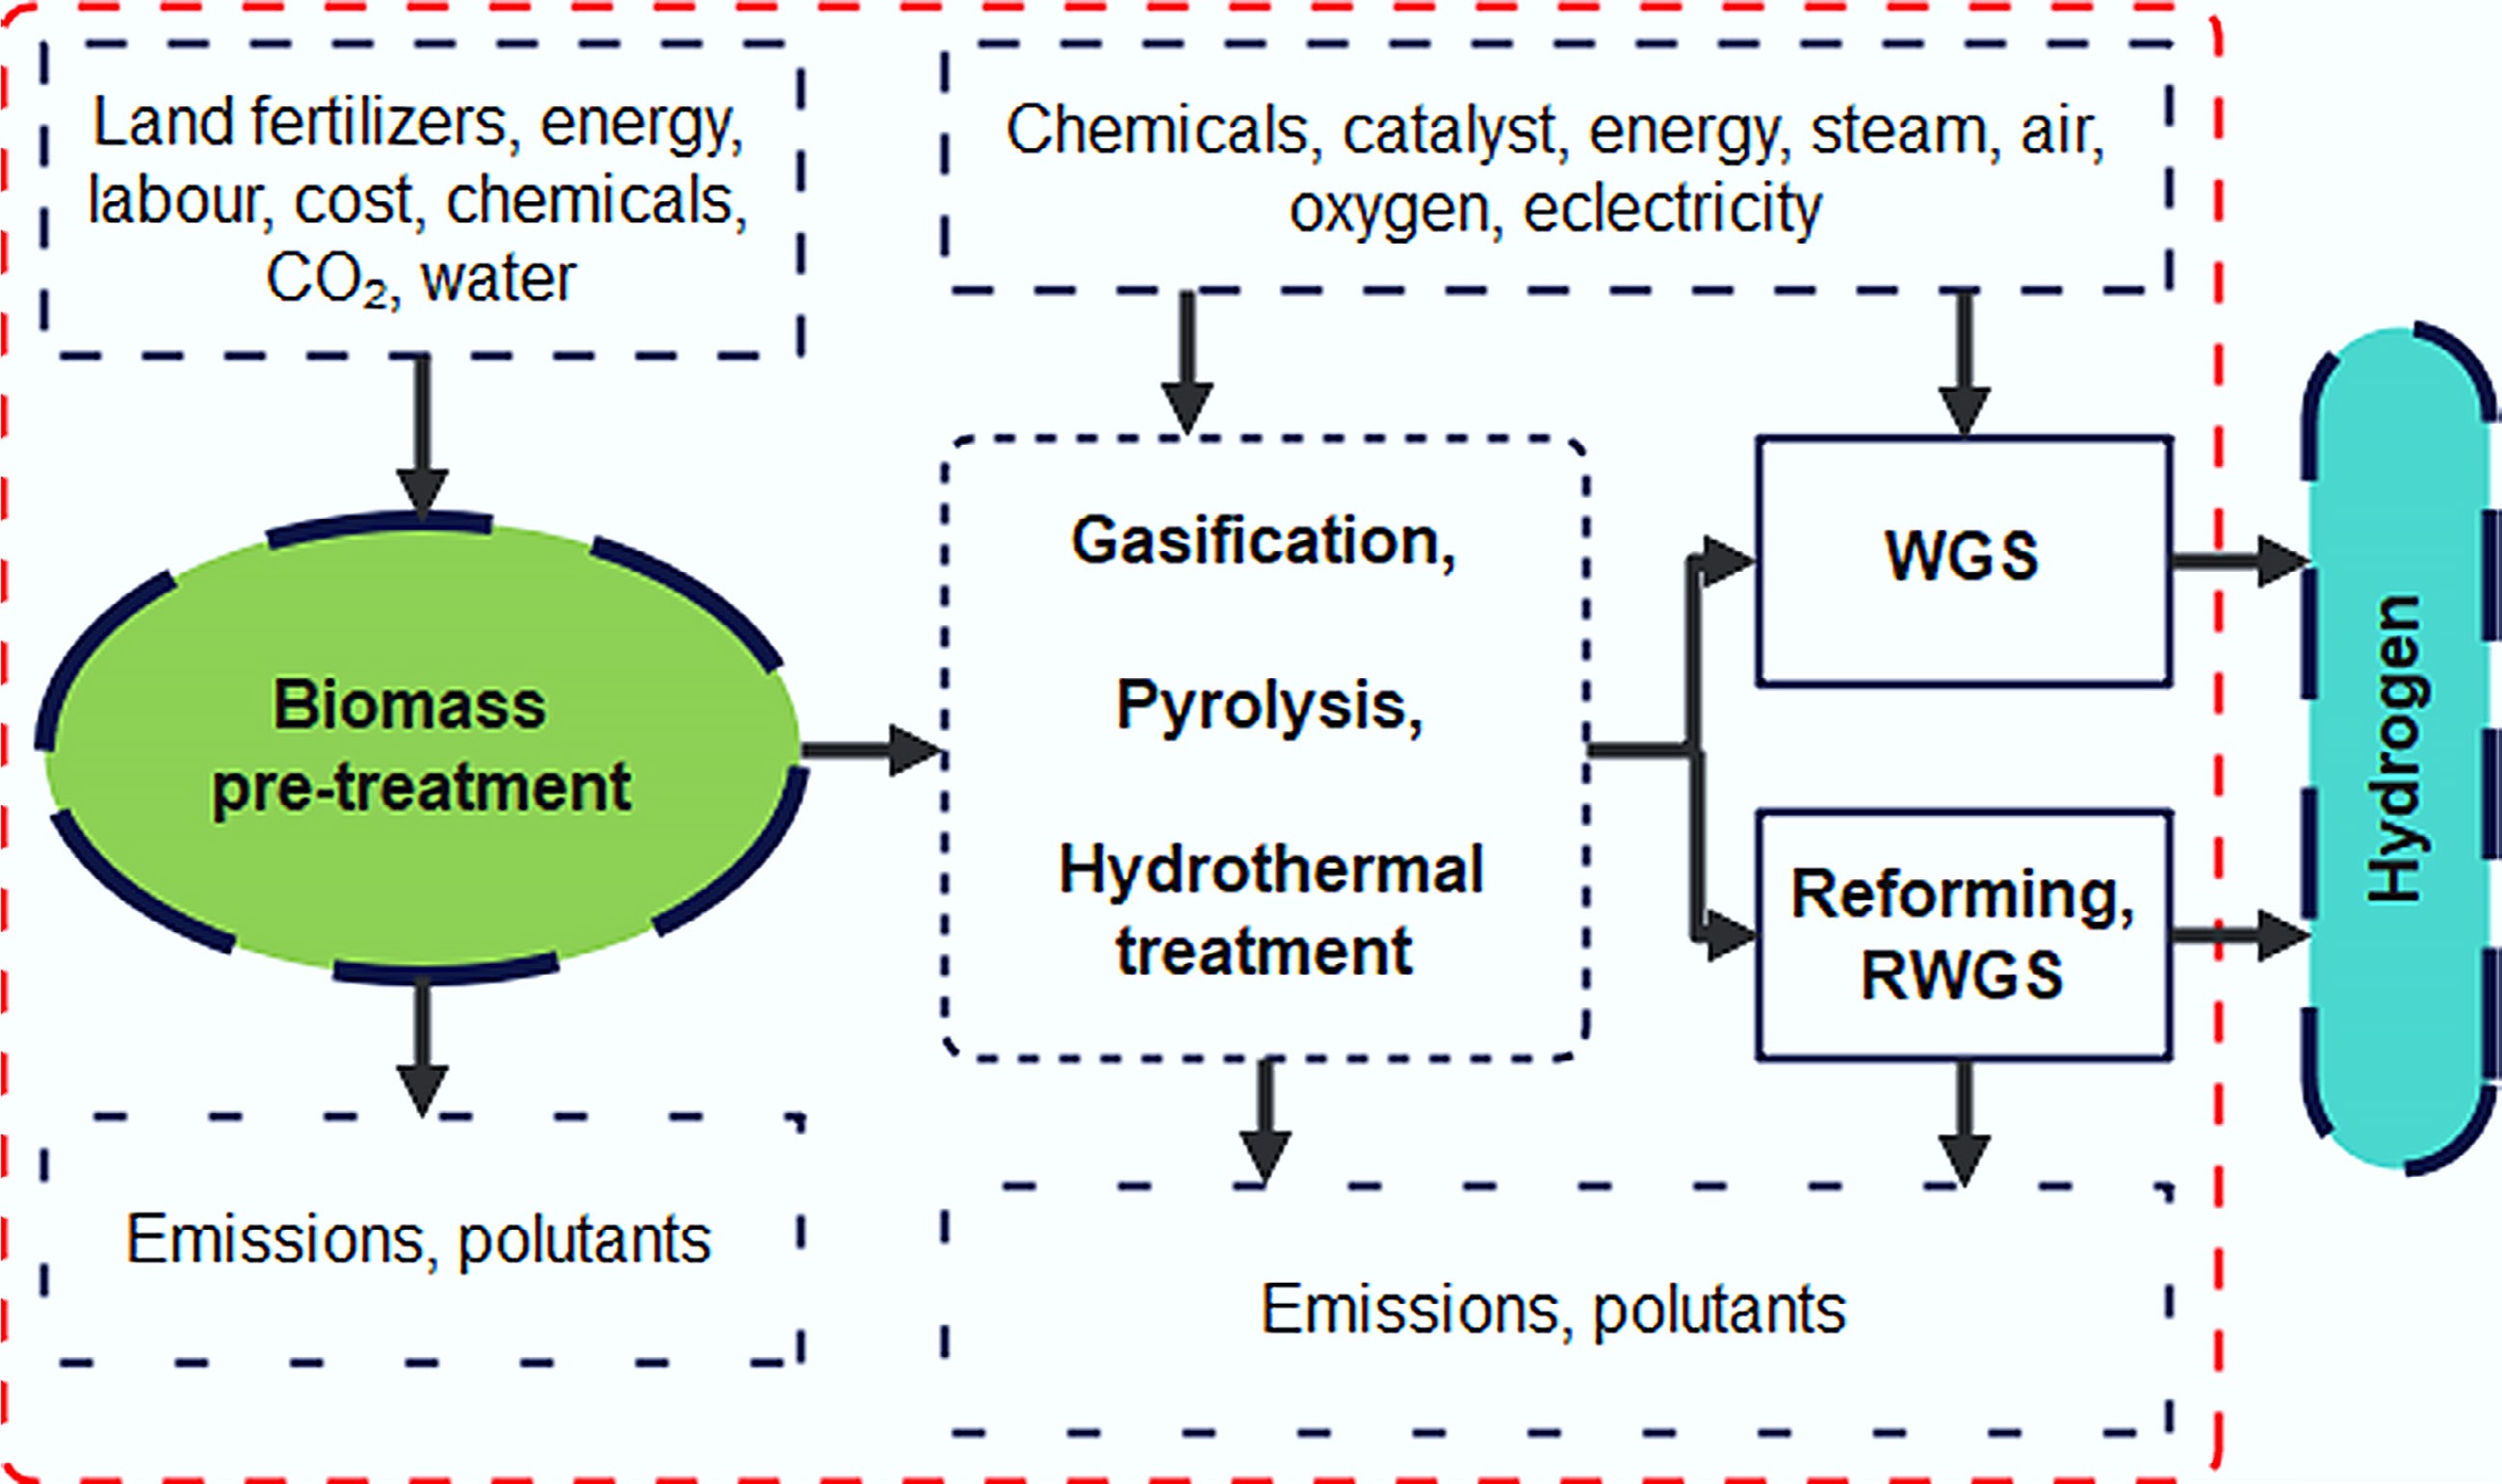
Figure 7.
Schematic diagram of LCA for thermochemical conversion of biomass into H2.
-
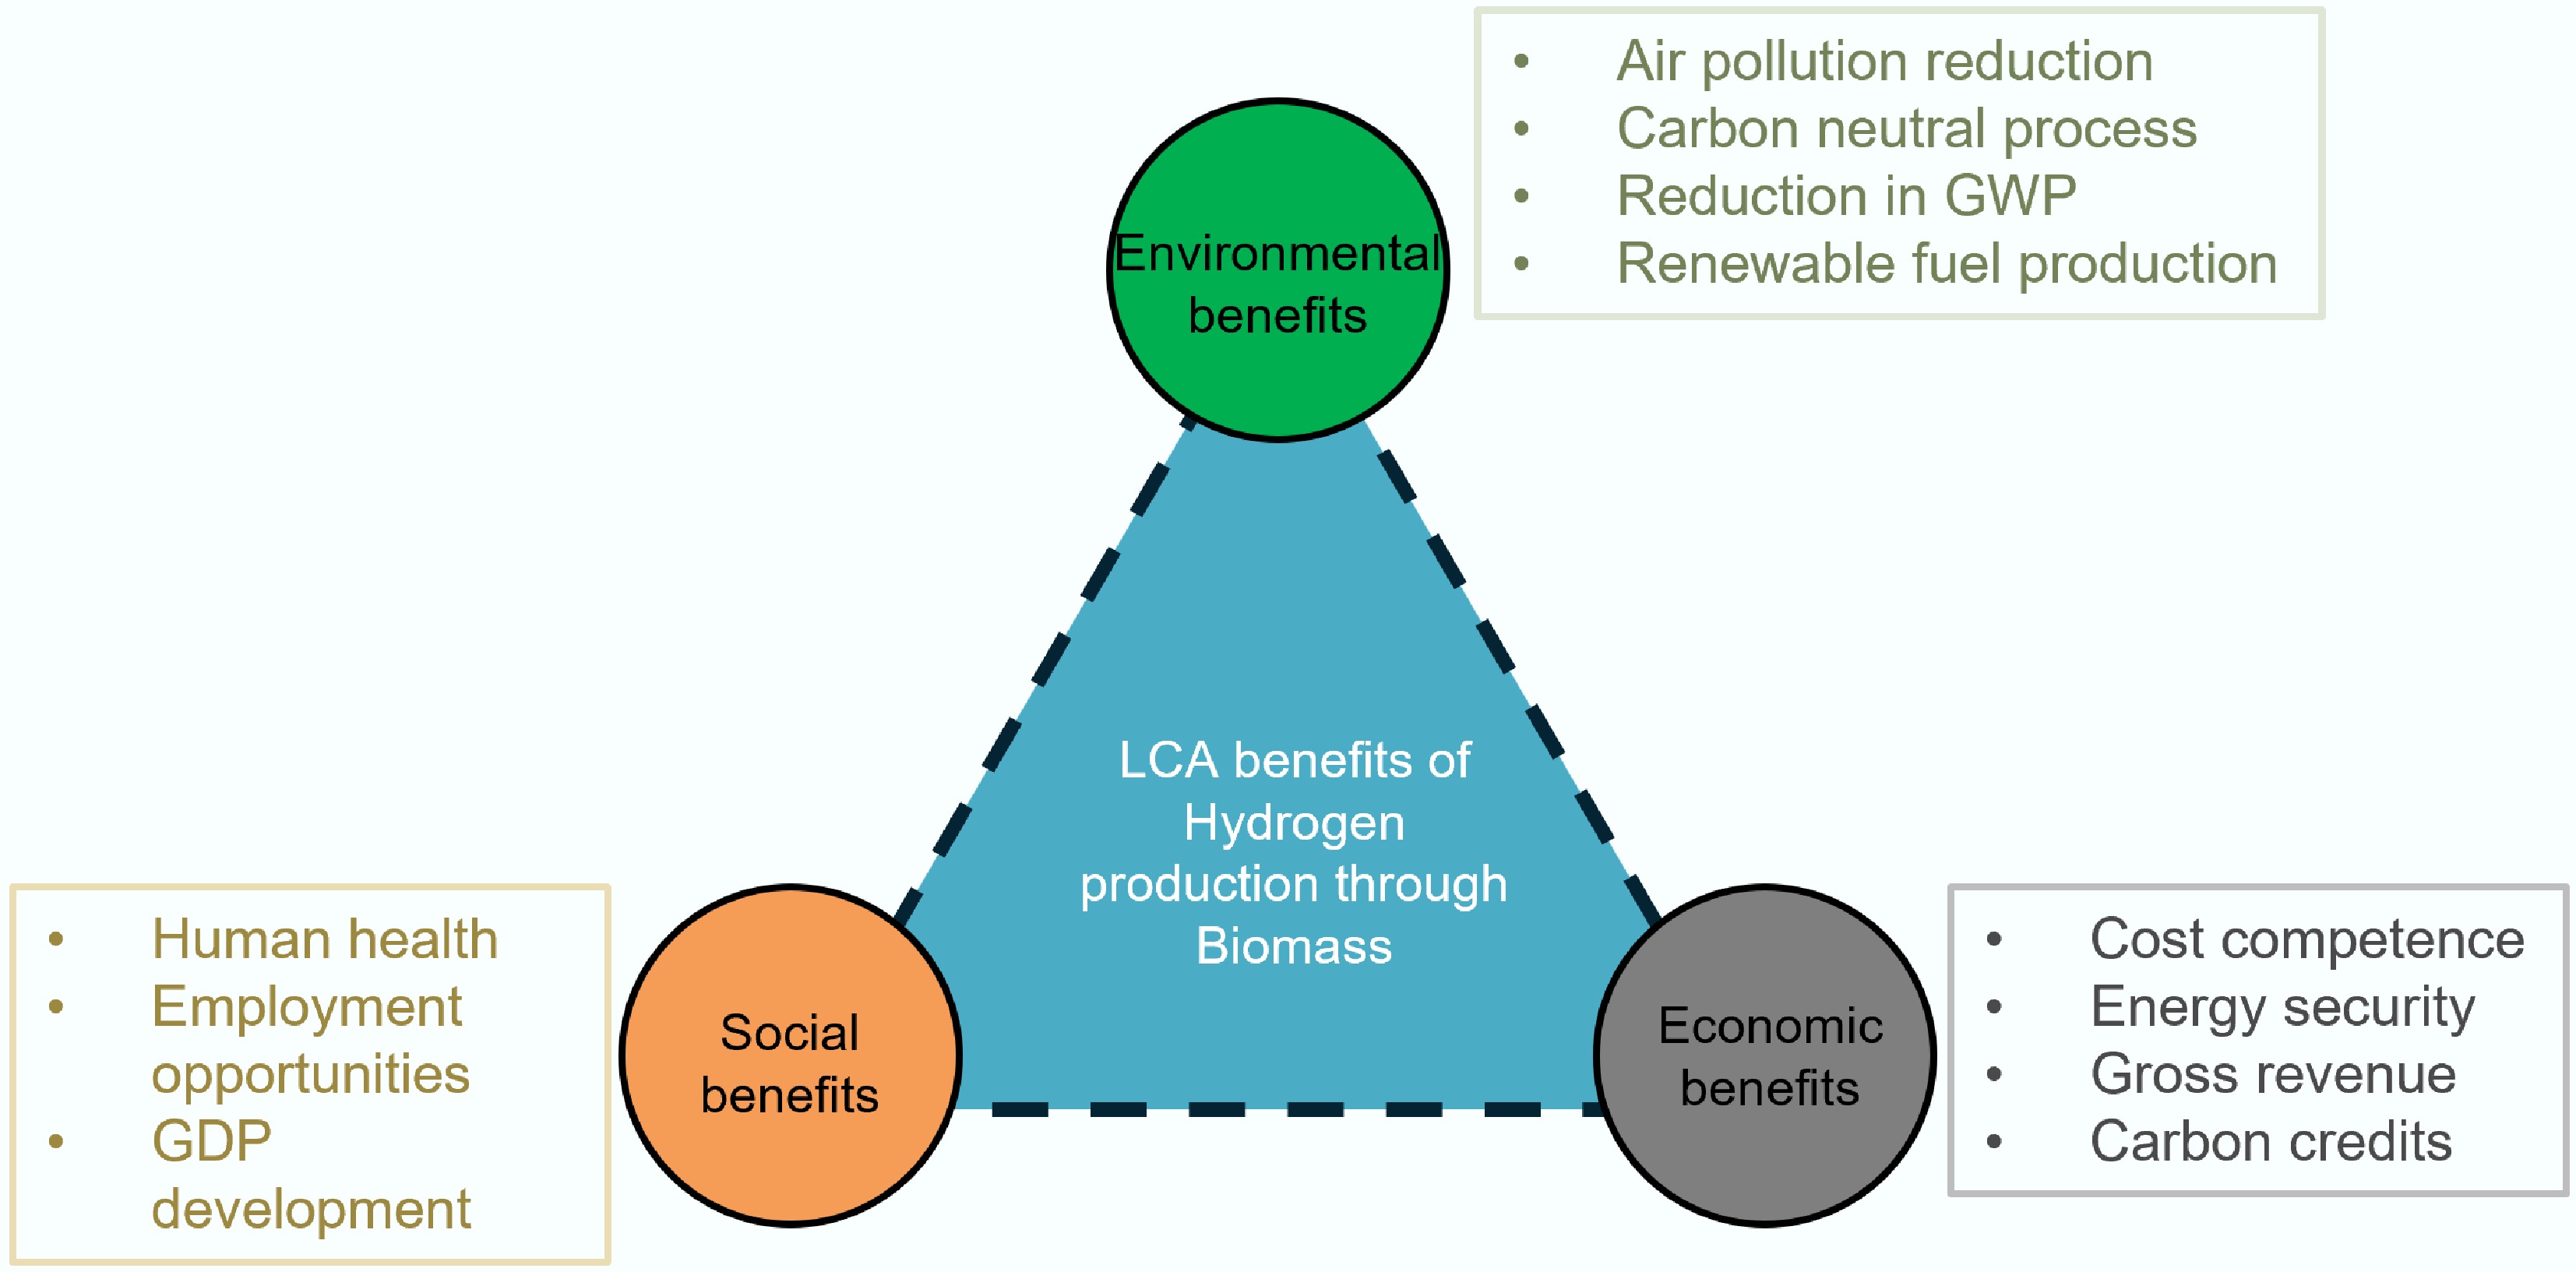
Figure 8.
Social, economic, and environmental benefits of H2 production through biomass.
-
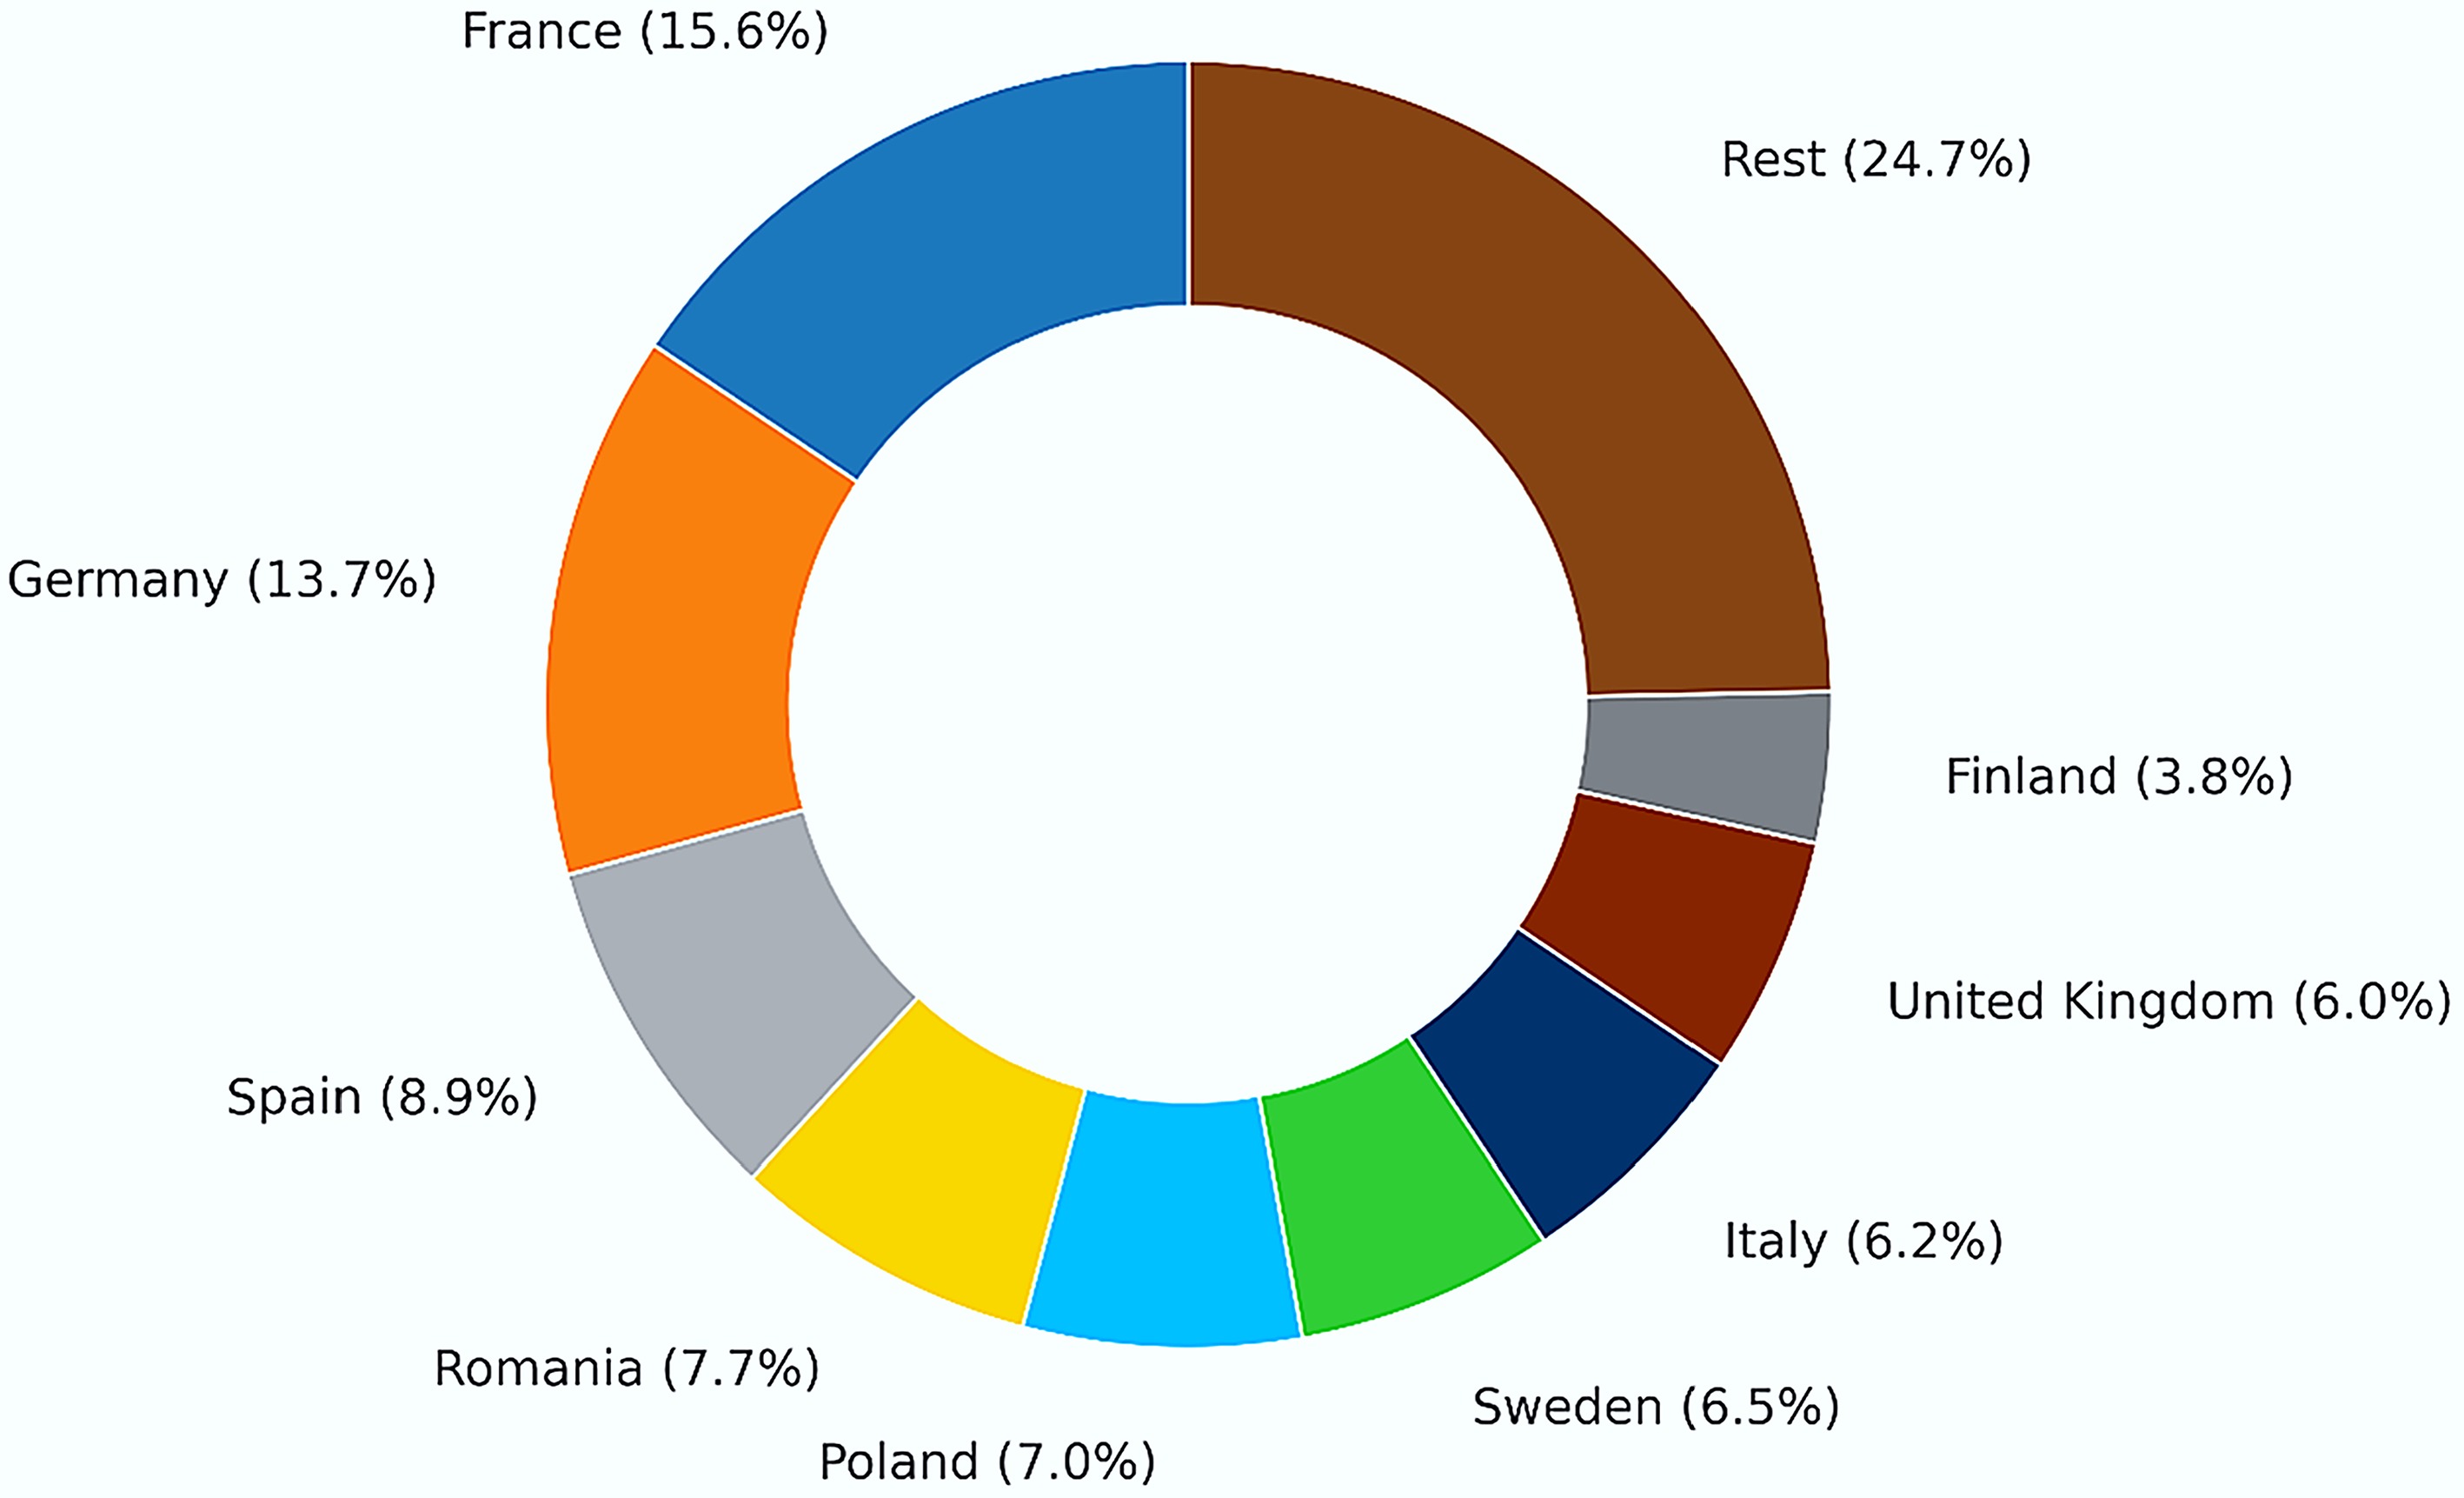
Figure 9.
Bio-based methane production in different countries. Redraw based on the data from Sulewski et al.[146].
-
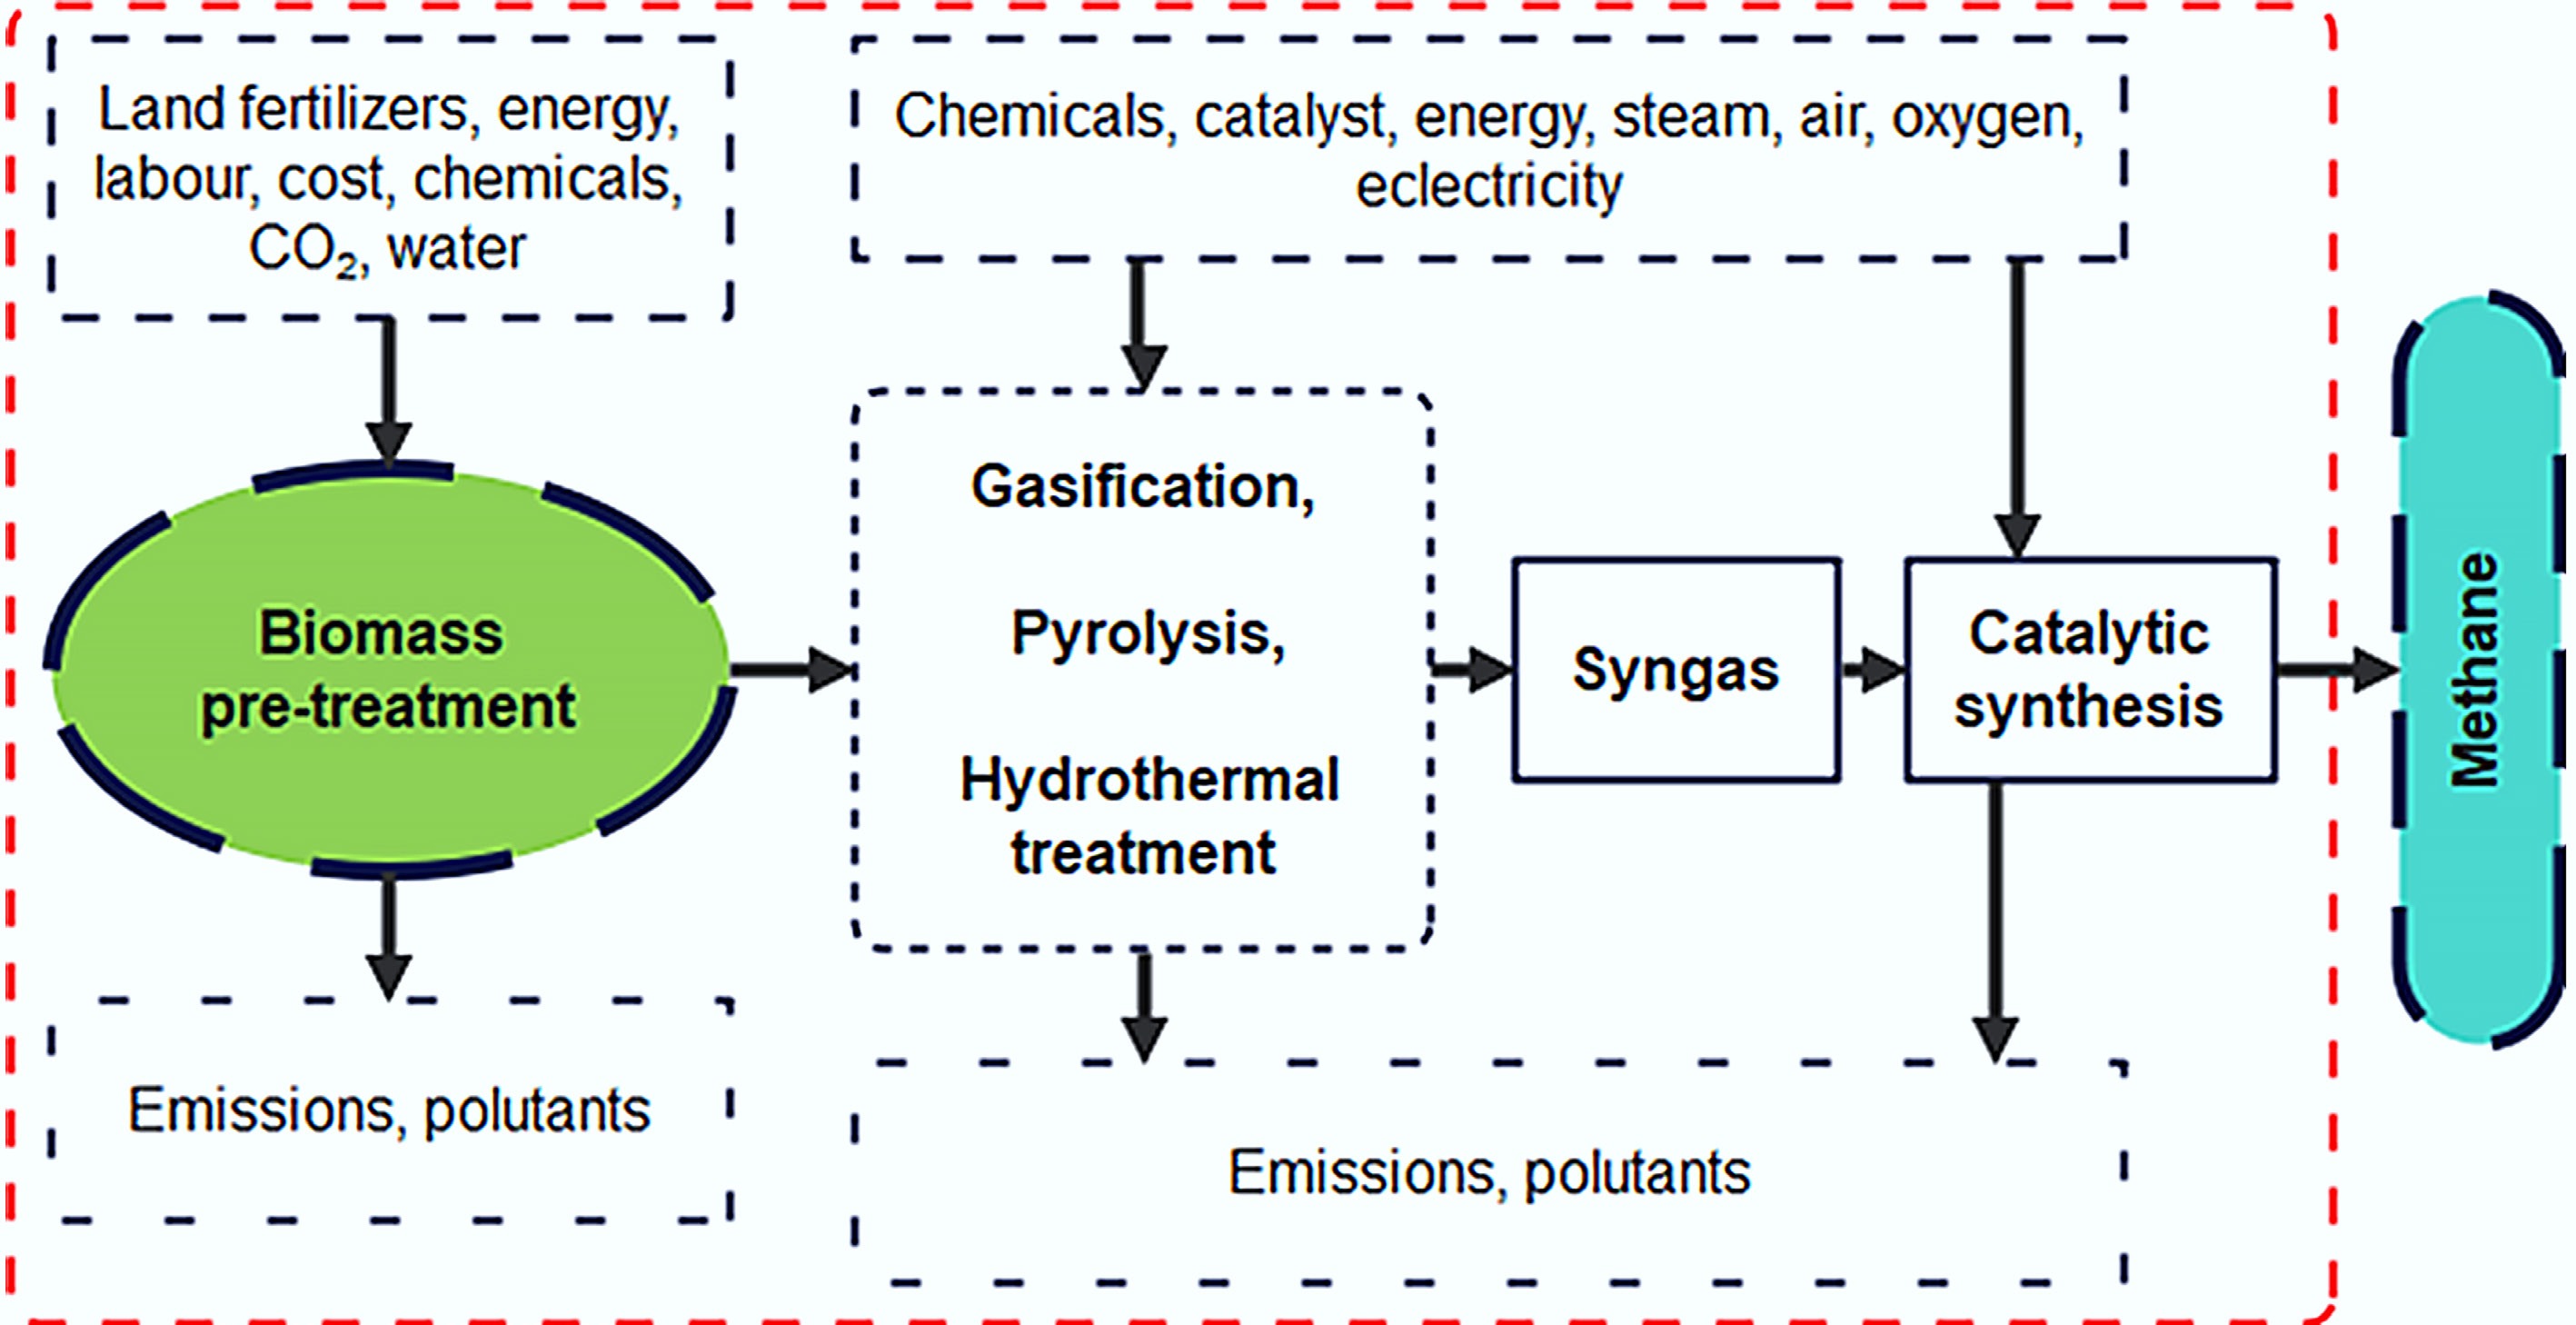
Figure 10.
LCA diagram of methane production from biomass.
-
Biomass Proximate analysis (%, as received basis) Ultimate analysis (%, dry ash-free basis) Ash Moisture Organic fraction C H N S O Wood 1.8 19.8 78.4 50.8 6.1 0.3 0.1 42.7 Legume straw 9.8 1.6 73.7 43.3 5.6 0.6 0.1 50.4 Apricot stone 8.5 0.2 75.1 44.4 5.7 0.4 0.0 49.5 Hornbeam shell 9.5 2.3 78.8 41.8 5.4 0.60 0.0 52.3 Hornbeam sawdust 0.5 8.8 78.1 45.2 6.6 0.0 0.0 48.2 Rice husk 12.9 1.1 70.5 42.0 5.4 0.4 0.0 39.3 Straw 6.4 12.7 80.9 48.9 5.9 0.8 0.2 43.9 Safflower 2.2 5.7 80.8 60.5 9.8 3.1 0.0 27.4 Sludge 25.7 32.5 41.8 50.2 7.1 5.6 1.8 34.9 Manure 17.2 43.6 39.2 50.2 6.5 6.5 0.9 34.6 Vegetable oils 0.0 0.0 100.0 75.4 11.7 0.0 12.9 0.0 -
Review study Gaseous fuels Integrated TEA Integrated LCA TRL
analysisSocioeconomic analysis Regional feedstock consideration Key limitations Das et al.[36] Syngas Partial No No No No No integrated TEA + LCA;
no TRL/socioeconomics.Lee et al.[35] Syngas No No No No No Lacks TEA/LCA synthesis and deployment context. Arregi et al.[38] Hydrogen Partial Partial Limited No No Partial TEA/LCA with pre-2020 datasets; limited TRL mapping; excludes SNG. Patel et al.[39] Syngas, hydrogen Partial Yes No No Limited Mixed system boundaries;
no TRL analysis, no regional feedstock economics.Kumar et al.[40] Syngas Partial Partial No No No Absent TRL and socioeconomic lenses. Ignat et al.[41] Bioenergy (general) No Yes No Yes Yes Not a thermochemical-process review; no TEA. Kaloudas et al.[21] Bioenergy (general) No Partial No Partial Yes Limited LCA depth and no
TEA integration.This review Syngas, hydrogen, methane Yes Yes Comprehensive Yes Comprehensive Thermochemical-to-gas focus
with harmonized TEA/LCA, integrated TRL and socioeconomic/
regional lenses.Table 2.
Comparative summary with recent review papers relevant to biomass thermochemical conversion
-
Step Syngas Bio-based hydrogen Bio-based methane Comparison Ref. Biomass feedstock characterization Moisture content, ash content, and heating value Moisture content, ash content, and heating value Moisture content, ash content, and heating value Similar [50−52] Process design Gassifiaction: Feedstock properties and the desired syngas composition,gasifier type, operating conditions, and gas cleaning methods Gasification process design: feedstock properties, gasifier type, operating conditions, gas cleaning, H2 separation Drying, pyrolysis, and gasification: feedstock properties, gasifier type, operating conditions, gas cleaning Key difference: drying for methane; H2 separation for H2 [50] Product gas composition analysis Analyzed to determine its suitability for downstream applications Analyzed for H2 purity and downstream applications Analyzed for downstream applications Similar, with H2 requiring additional purity analysis [50] Capital cost estimation Based on the process design, equipment specifications, and installation costs Based on process design, equipment, H2 separation unit, installation costs Based on process design, equipment, installation costs Similar, with H2 including additional costs for H2 separation [50] Operating cost estimation Feedstock costs, energy costs, and maintenance costs Feedstock, energy, H2 separation, maintenance costs Feedstock, energy, maintenance costs Similar, with H2 including H2 separation costs [50] Revenue estimation From the sale of the syngas or downstream products From bio-based H2 or downstream product sales From bio-based methane or downstream product sales Similar [50] Sensitivity analysis Evaluate the impact of changes in key parameters, such as feedstock prices and product prices, on the economic viability of the process. Evaluates impact of feedstock and product price changes on viability Evaluates impact of feedstock and product price changes on viability Similar [50] Table 3.
A summary of parameters need to be considerd for conducing techno-economic analysis of syngas, bio-based H2, and bio-based methane production from biomass
-
Technology Fuel type Current TRL Key barrier Estimated commercialization timeline Ref. Bubbling fluidized bed gasifier Syngas 7–8 Tar control, catalyst degradation 3–5 years [53] Steam reforming of bio-oil H2 5–6 Catalyst cost, scalability 5–8 years [38] Sorption-enhanced gasification H2 4–5 Process integration, CO2 handling 8–10 years [54] Supercritical water gasification (SCWG) Syngas/H2 4–5 High pressure equipment cost, limited demo data 8–12 years [55] Biomass methanation Methane 6–7 Ni-based catalyst deactivation, cost estimating 5–7 years [56] Table 4.
Technology readiness levels (TRL) of the technologies for producing biomass-based gaseous fuels
-
Year Category Targeted product Indicator Feedstock Capacity Result Ref. 2011 Fixed capital investment:
US${\$} $ ${\$} $ CH4 and H2 Annual net income Waste sludge 481 kg/h H2 Annual profit will be highest at US ${\$} $ [67] 2012 Construction cost: US ${\$} $
Labor cost: US${\$} $
TPC: US${\$} $ Syngas Syngas production cost Microalgae 86,500 t/d Updated syngas cost: US ${\$} $ [55] 2014 Indirect cost, O.C.,
Depreciation costSyngas Break-even prices for syngas, electricity Sugarcane
Bio-refinery residues1 kg/h syngas yield The break-even syngas price is lower than US ${\$} $ [68] Table 5.
Economic analysis of various SCWG processes for syngas production
-
LCA step Syngas Bio-based hydrogen Bio-based methane Comparison/note Ref. Biomass feedstock acquisition and preprocessing Land, water, and energy
use for growth, harvesting, transport, drying; GHG and biodiversity impactsAs syngas; effects depend on H2 pathway selected (gasification, steam reforming) As syngas; for biogas/
biomethane, includes anaerobic digestion of waste or cropsAll rely on sustainable sourcing and transport minimization; cropping practice crucial [72] Conversion/
process stageGasification emissions
(CO2, CO, tars, particulates); electricity/fuel useGasification plus water-gas shift, H2 separation (membranes, PSA); added energy and chemicals Anaerobic digestion/followed by upgrading and possible methanation; methane slip and biogenic CO2 H2 route has higher process emissions and energy use; methane route increases risk of fugitive CH4 emissions [72] Product gas upgrading/
cleaningAcid gas removal (CO2, H2S),
tar cleanup, waste disposal impactsH2 purification to fuel cell or pipeline standards; impacts from separation units Upgrading biogas to biomethane purity (> 95% CH4); methane slip is critical LCA factor All require energy-intensive cleanup; H2 and biomethane purity requirements drive additional impacts [72] Distribution
and usePipeline or local use;
GHG savings depend on substitution (e.g., replacing fossil syngas)Similar; GHG impact determined by end use (fuel, chemical); negative emissions possible with carbon capture and storage (CCS) Grid injection or CNG; methane leakage and efficiency affect net GHG savings Biogenic routes generally yield lower GHG than fossil, but only if methane slip and H2 purification are managed efficiently [72] End-of-life/waste management Ash, char, tar reuse/disposal, water effluents; possible recycling or reuse of byproducts Similar, plus wastes from H2 separation materials Digestate use in agriculture, residual CO2 streams from upgrading H2 and methane pathways introduce separation wastes; all routes can benefit from optimal byproduct valorization [72] Overall GHG and environmental performance (summary) Significant GHG reduction vs fossil syngas, especially when using bio-waste; some trade-offs in land/water use H2 from biomass + CCS can be net negative GHG; LCA depends on full-system boundaries Biomethane can achieve deep decarbonization if methane slip minimized and digestate reused Best LCA results from waste-based feedstocks, strong methane management, CCS integration for negative emissions [72] Table 6.
A summary of LCA steps of syngas, bio-based H2, and bio-based methane production from biomass thermochemical conversion
-
Process type Feedstock/context Syngas production cost (US ${\boldsymbol\$} $ GWP (kg CO2-eq per kg syngas) Ref. Indirect steam DFB gasification Woody biomass − ~2–5 depending on electricity GWI [85] Stand-alone biomass syngas plant Lignocellulosic biomass 8.22–6.73 − [86] Pulp-mill integrated biomass gasification Forest residues 17 − [87] Mill-gas separation (COG H2 + BOFG CO) to syngas Steel mill off-gases − 0.7–3.6 (pathway and electricity carbon intensity dependent) [88] Micro-scale biomass gasification Various residues 5–54 − [89] Table 7.
Comparison of syngas production cost and GWP for different technologies
-
Process type Feedstock Capital expenditure
(M US${\boldsymbol\$} $ Hydrogen
production cost (US${\boldsymbol\$} $ Levelized cost of hydrogen (US ${\boldsymbol\$} $ GWP
(kg CO2 eq/kg H2)Ref. Biomass Gasification and steam reforming Solid waste 399.2 2.26 3.04 4.4–7.72 [109,116] Waste wood 137.65 2 2.77 0.18–6.98
(–24.19 with CCS)[109,116] Wood chips 12.5 1.83–2.35 n.a. 0.18–6.98
(–24.19 with CCS)[116] Dark fermentation Wet waste, sludge 38.162 2.38 2.945 n.a. [109] Dark and photo fermentation Wet waste, sludge 41.642 2.52 3.137 n.a. [109] Pyrolysis Bio-nut shell, olive husk, black liquor, pulp and paper waste 264.6–361.6 1.21–2.57 n.a. n.a. [117] Supercritical water gasification Black liquor 72.37 1.51–3.89 n.a. n.a. [118] Fossil resources SMR Natural gas 215.4–302.65 0.77 1.45–2.56 10–16 [117] SMR with CCS Natural gas 2–2.4 3–10 [119,120] Coal gasification Coal 324.57 0.92–2.83 1.26 19.25–23 [117] Coal gasification with CCS 1.51 4.85–11 [121] Non-biobased renewables H2 electrification Renewable energy 2.9–6.7 0.49–6.63 [119,120] Table 8.
Techno-economic comparison of different H2 production processes
-
Parameter Syngas Bio-based hydrogen Bio-based methane Ref. Production method Gasification (fluidized/entrained bed) Gasification + WGS reactors + pressure swing adsorption purification Gasification + methanation (Ni-based catalysts) [149] Energy efficiency 32%–53% exergy efficiency 69% LHV efficiency (steam gasification) 70.98% system efficiency (with heat integration) [149] Yield 8–14 MJ/Nm3 (LHV) 0.057–0.107 kg H2/kg biomass 0.4–0.6 kg CH4/kg biomass [149] Production cost US ${\$} $ US ${\$} $ US ${\$} $ [149] Key cost driver Gasifier type, O2 consumption Gas cleaning, WGS reactors, electrolysis Methanation catalysts, drying energy [149] Carbon recovery N/A 41%–69% (with CCS) 69.8% (via gasification + methanation) [149] Byproduct Biochar, residual ash CO2 Biochar, CO2 (with CCS) [149] TRL TRL 7–8 (commercial gasifiers) TRL 6–7 (pilot plants) TRL 6 (demonstration-scale) [149] Table 9.
Techno-economic comparison of syngas, bio-based H2, and bio-based methane production from biomass
-
Process type Feedstock Capital expenditure
(M US${\boldsymbol\$} $ SNG/biomethane production cost (US ${\boldsymbol\$} $ GWP 100
(kg CO2 eq/MWh)Ref. Biomass Biogas to biomethane Food waste 75.696 38.91 −168 to 316.8 [150] Food waste (scaled up 2×) 141.93 31.94 −168 to 316.8 [150] Cattle manure 62.016 130.34 −324 to −236 [150] Pig manure 55.518 215.55 −241.3 to 211.5 [150] Sludge 58.482 123.73 −52.6 to 16.9 [150] Gasification and methanation Solid biomass 62.12–131.1 −86.9 to 95.1 (assuming wood) [152−155] SCWG Microalgae Very optimistic: 82.8–147.6
optimistic: 284.4–464n.a. [55] Table 10.
Techno-economic comparison of different SNG and biomethane production processes and their global warming potentials
Figures
(10)
Tables
(10)