-
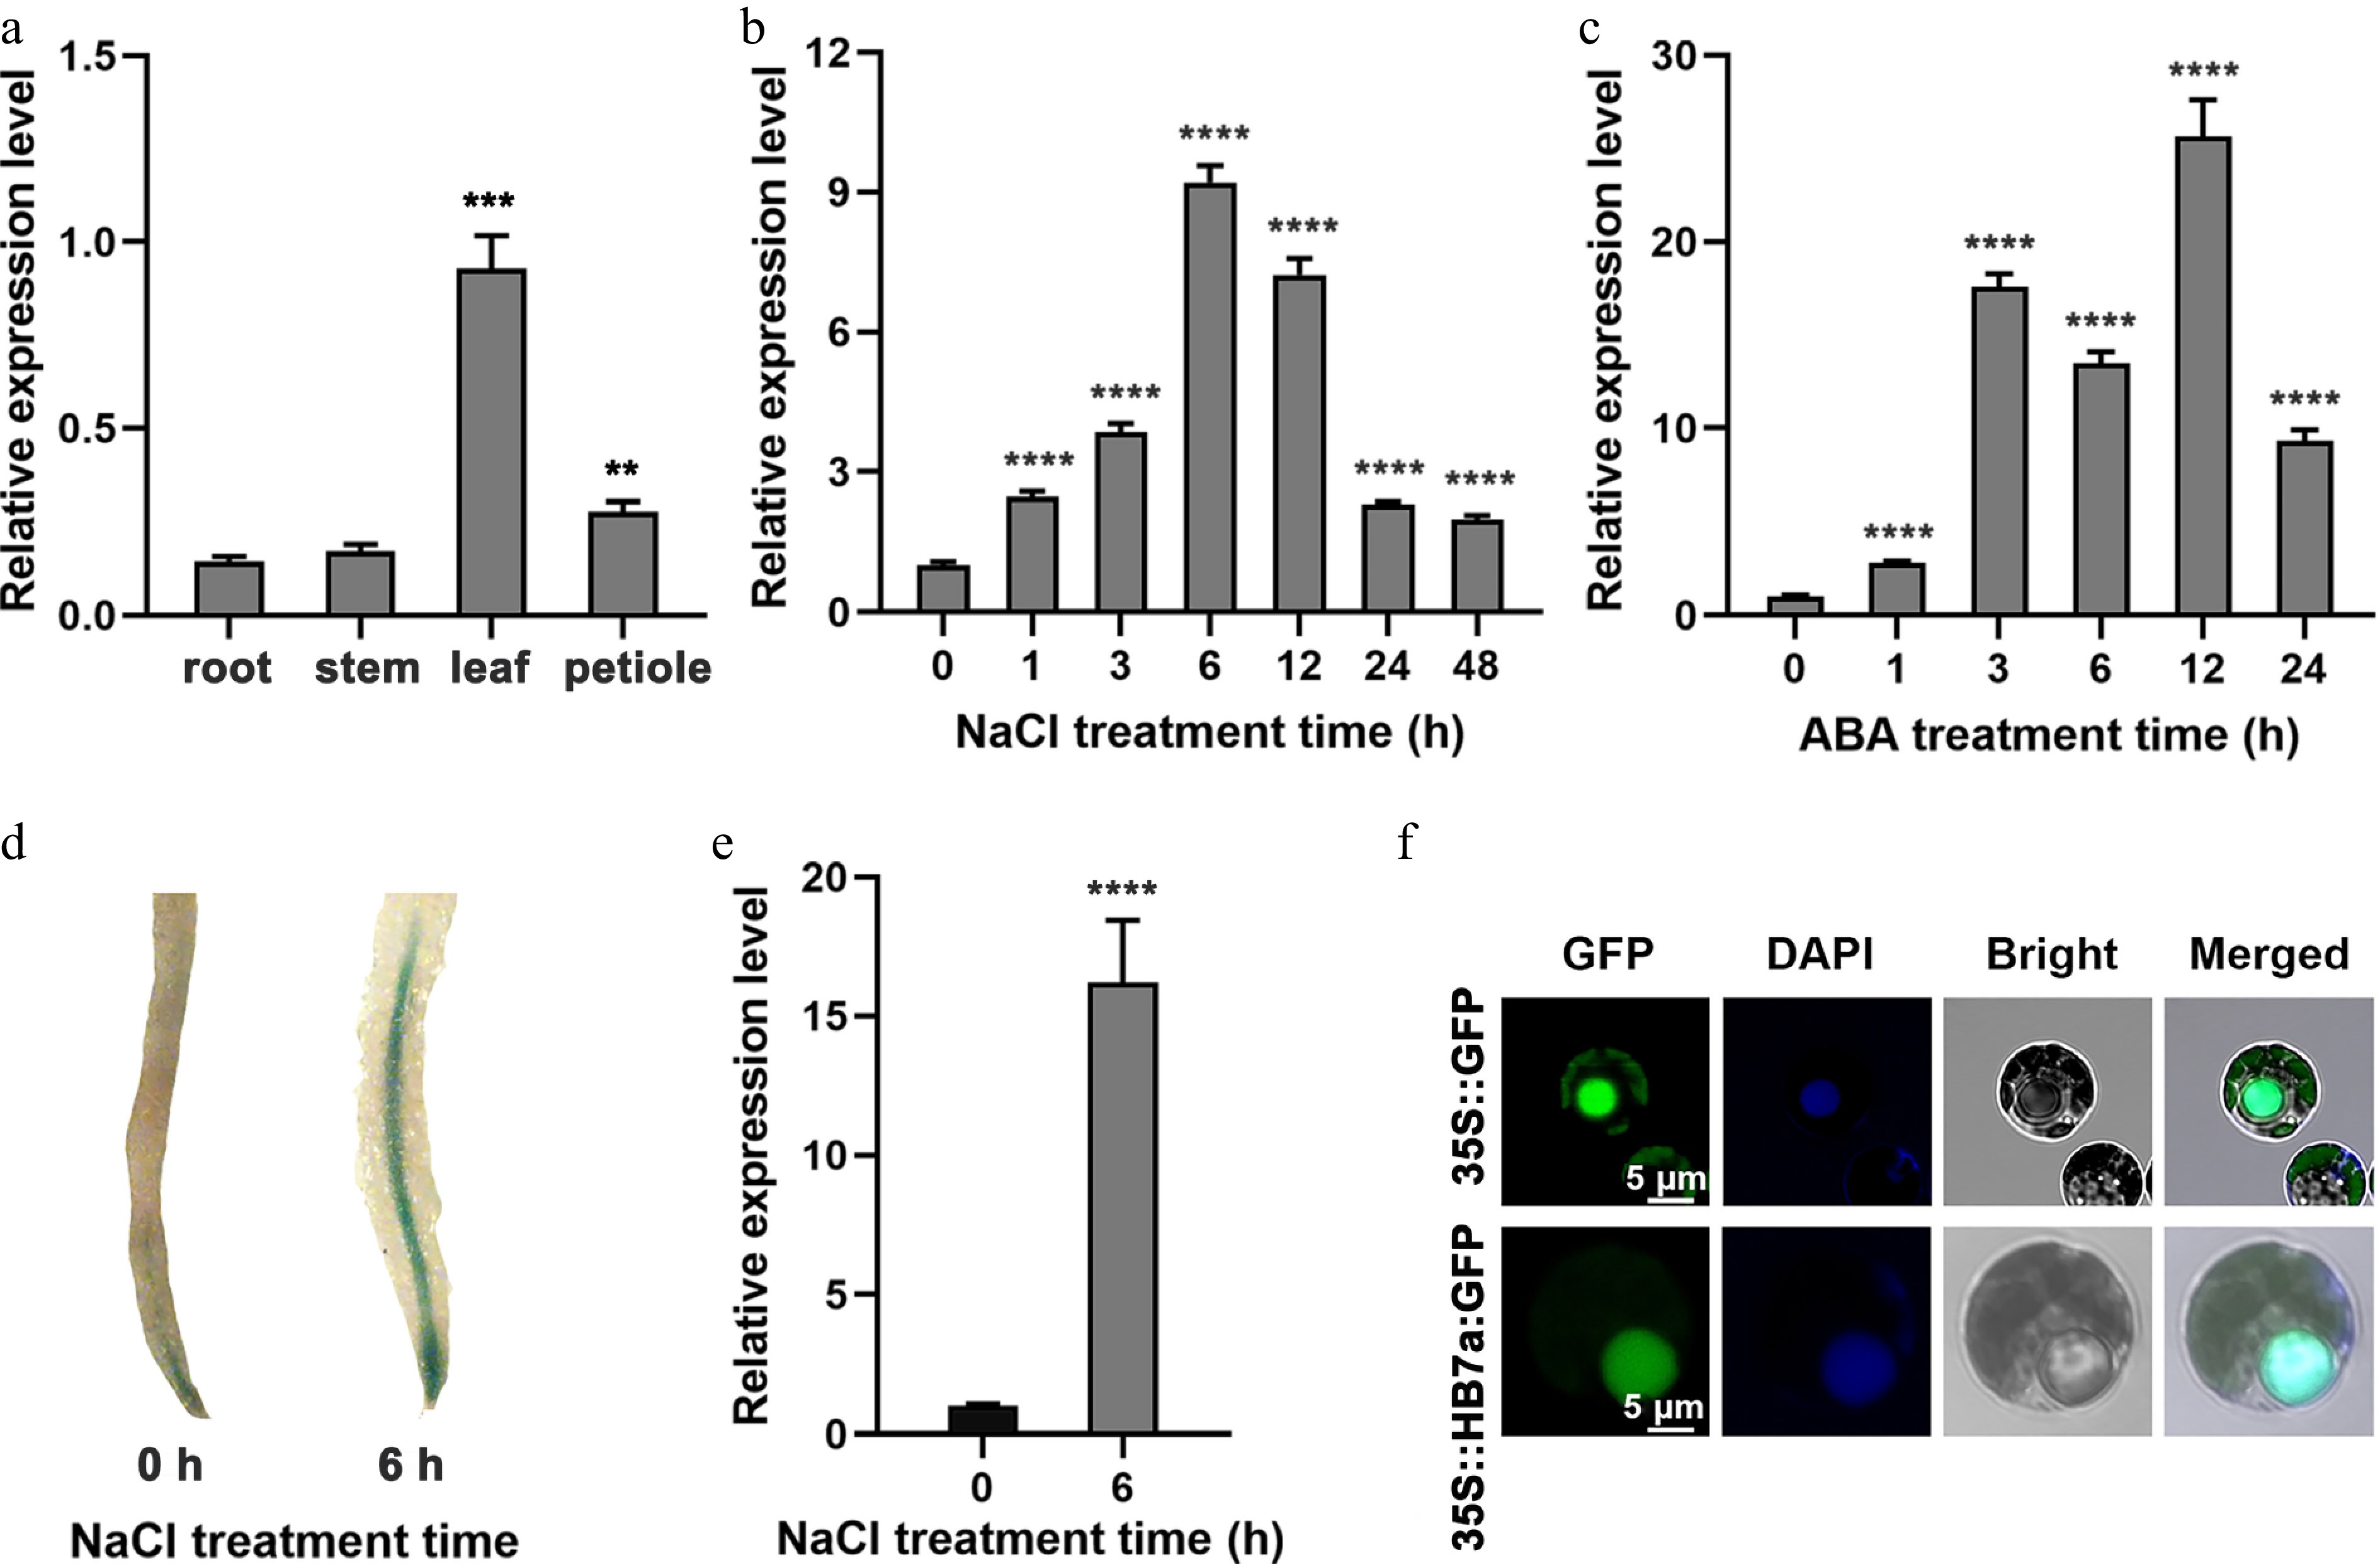
Figure 1.
Expression profiles of PagHB7a in Populus. (a) Relative expression levels of PagHB7a in different tissues analyzed by RT-qPCR. Relative expression of PagHB7a in total roots of 84K poplar under (b) 100 mM NaCl, and (c) 200 μM ABA (c) treatments for the indicated times. (d) Histochemical GUS staining of roots from ProPagHB7a::GUS transgenic plants under 100 mM NaCl treatment. (e) RT-qPCR analysis of GUS expression level in total roots of ProPagHB7a::GUS transgenic plants under 100 mM NaCl treatment. (f) Subcellular localization of PagHB7a-GFP in 84K poplar protoplasts; nuclei were stained with DAPI (4′,6-diamidino-2-phenylindole). In (a)–(c) and (e), error bars represent ± SD (n = 3). Asterisks indicate significant differences compared to the 0 h control (Student's t-test): * p < 0.05, ** p < 0.01, *** p < 0.001, **** p < 0.0001. Error bars represent SD values (n = 3).
-
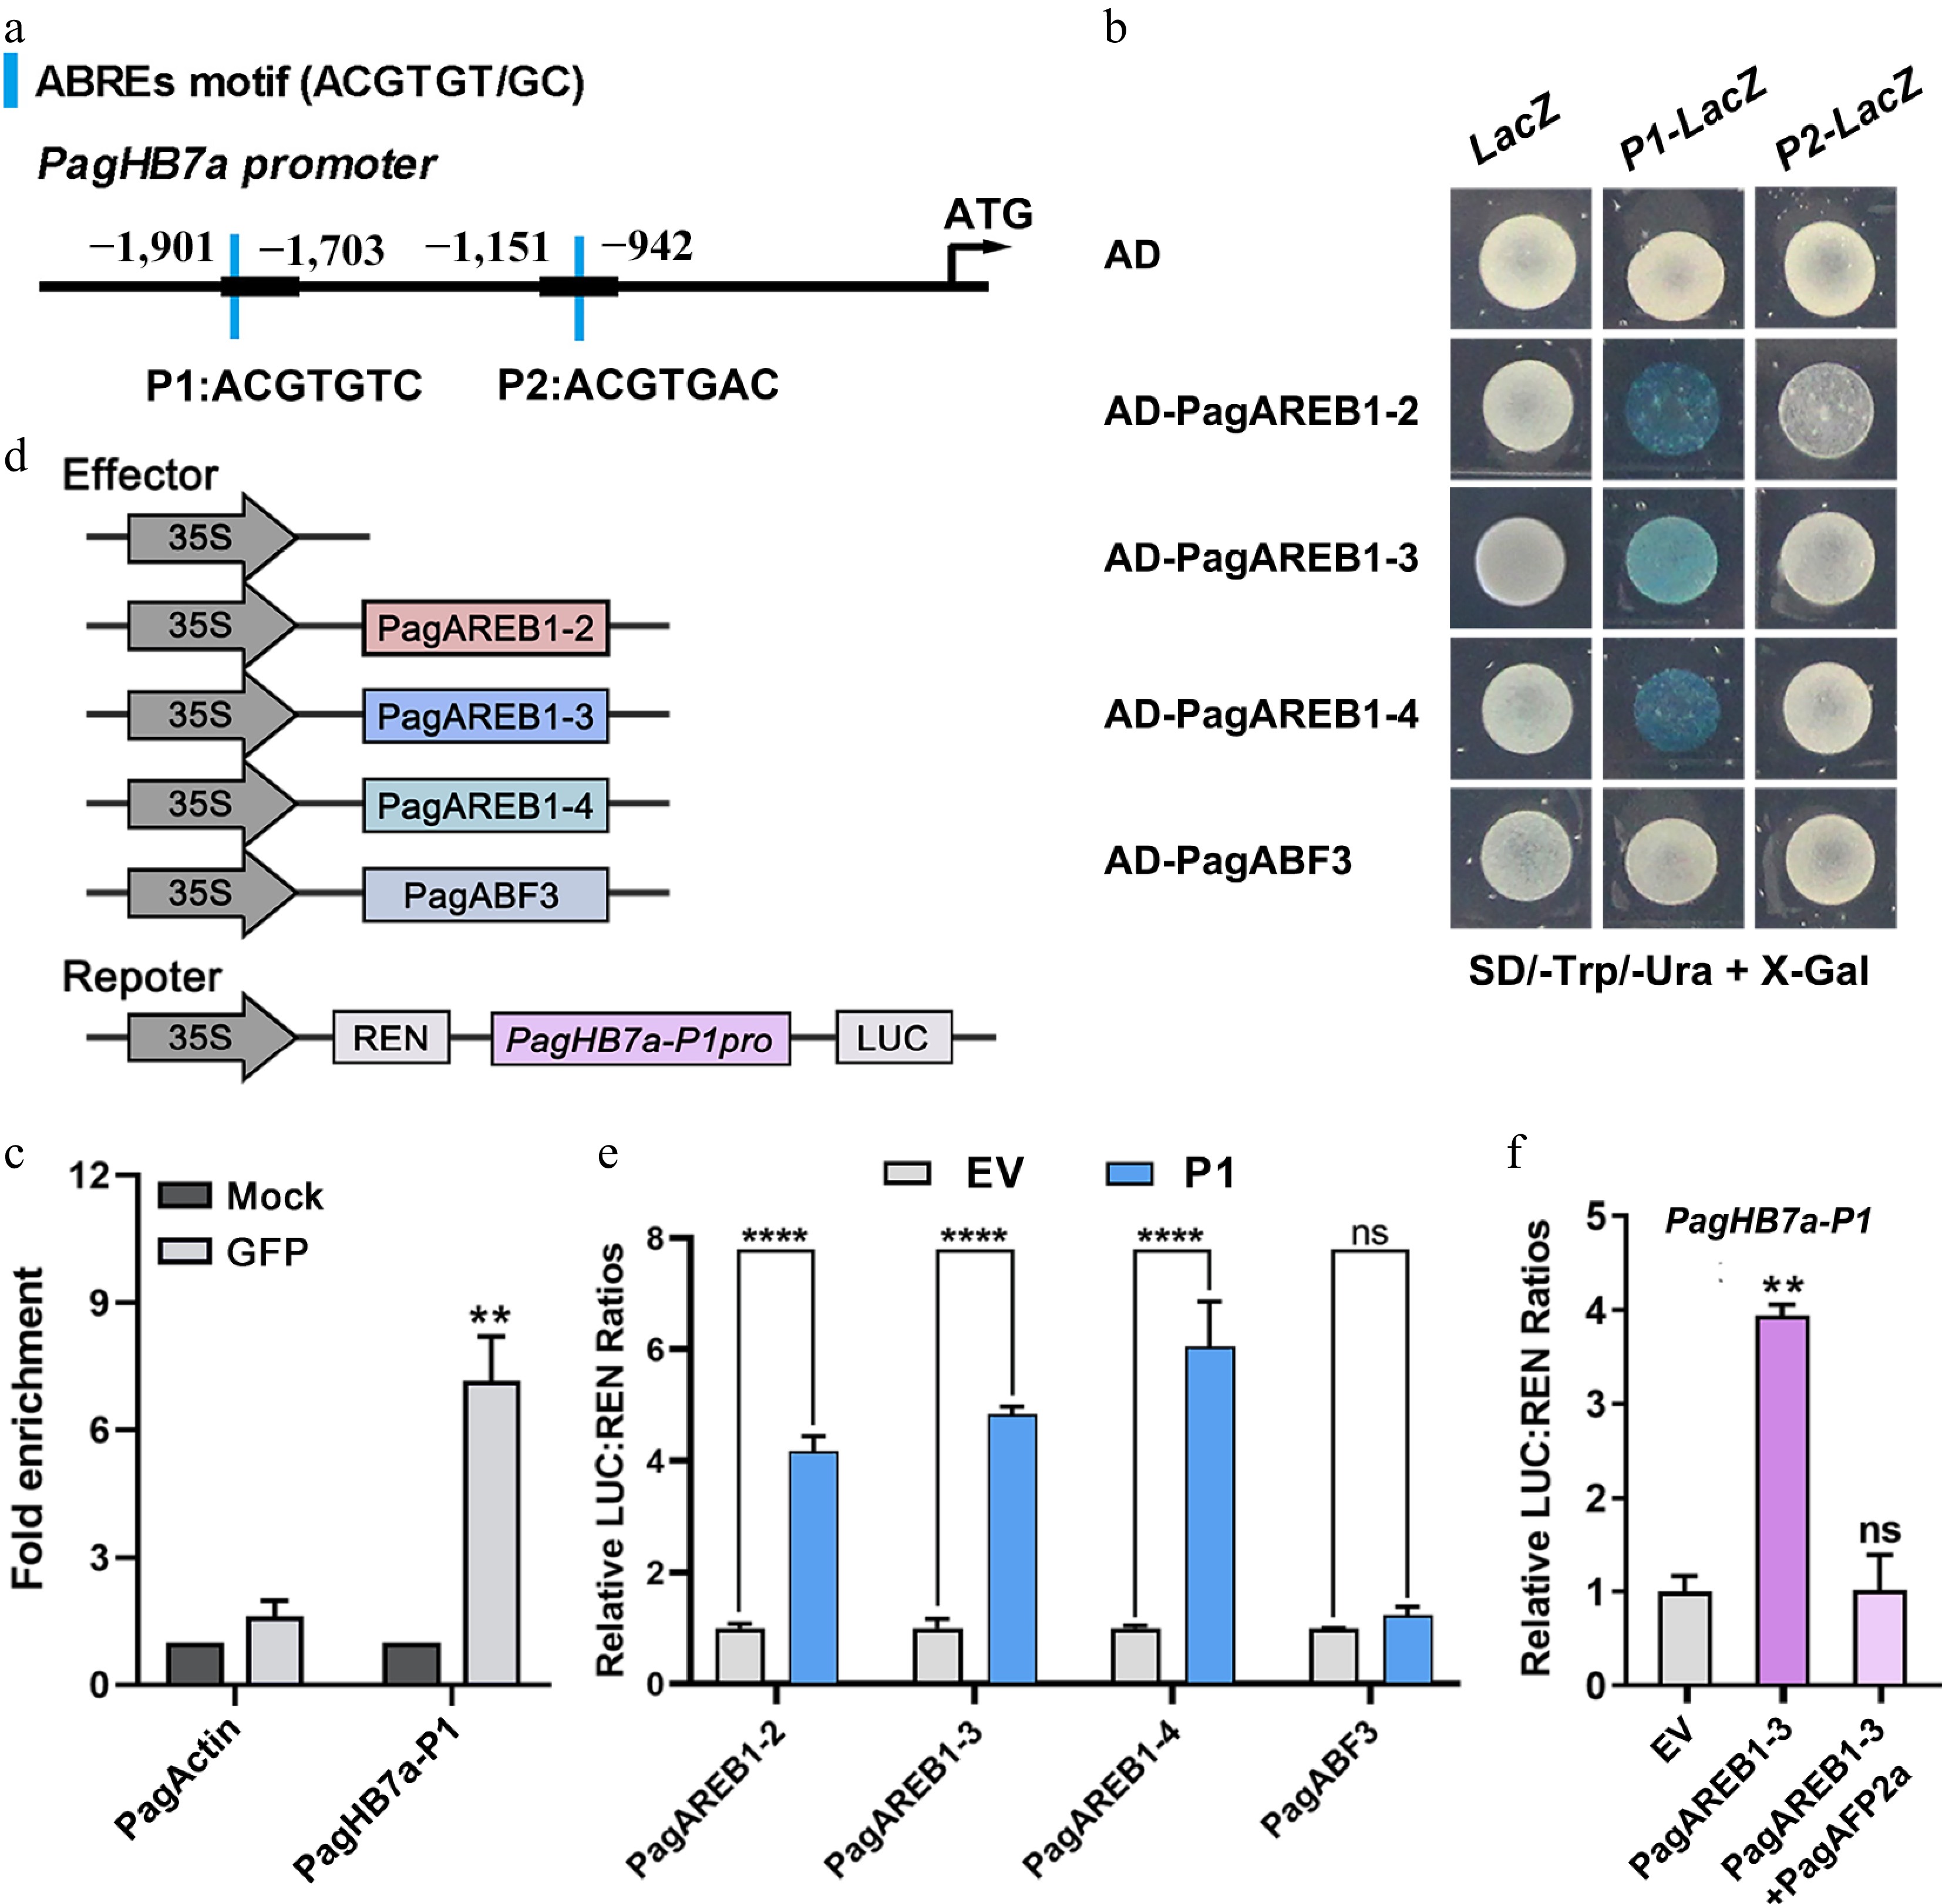
Figure 2.
PagHB7a is directly bound and activated by PagAREB1s. (a) Schematic diagram of the PagHB7a promoter. Blue bars indicate ABRE cis-elements; P1 and P2 denote promoter fragments containing ABRE motifs. (b) Yeast one-hybrid (Y1H) assay shows that PagAREB1-2, PagAREB1-3 and PagAREB1-4 bind to the PagHB7a promoter region containing P1. (c) ChIP-qPCR demonstrates that PagAREB1-3 binds to the PagHB7a promoter region containing P1 in vivo. Statistical comparisons between the Mock (no anti-GFP), and anti-GFP groups were performed using Student's t-test. ** p < 0.01. (d) Schematic representation of effector and reporter constructs used in dual-luciferase assays. (e) Dual-luciferase assay shows that PagAREB1-2, PagAREB1-3, and PagAREB1-4 activate the expression of firefly luciferase (LUC) gene driven by the PagHB7a promoter region containing P1 in tobacco leaves. (f) Dual-luciferase assays show that PagAREB1-3 activates LUC expression driven by the PagHB7a promoter region containing P1, while co-expression of PagAFP2a inhibits the activation. The relative LUC:REN ratio in control samples (transformed with the empty vector, EV) was normalized to a value of 1. Error bars represent SD (n = 3). Asterisks indicate significant differences (Student's t-test): ** p < 0.01; **** p < 0.0001.
-
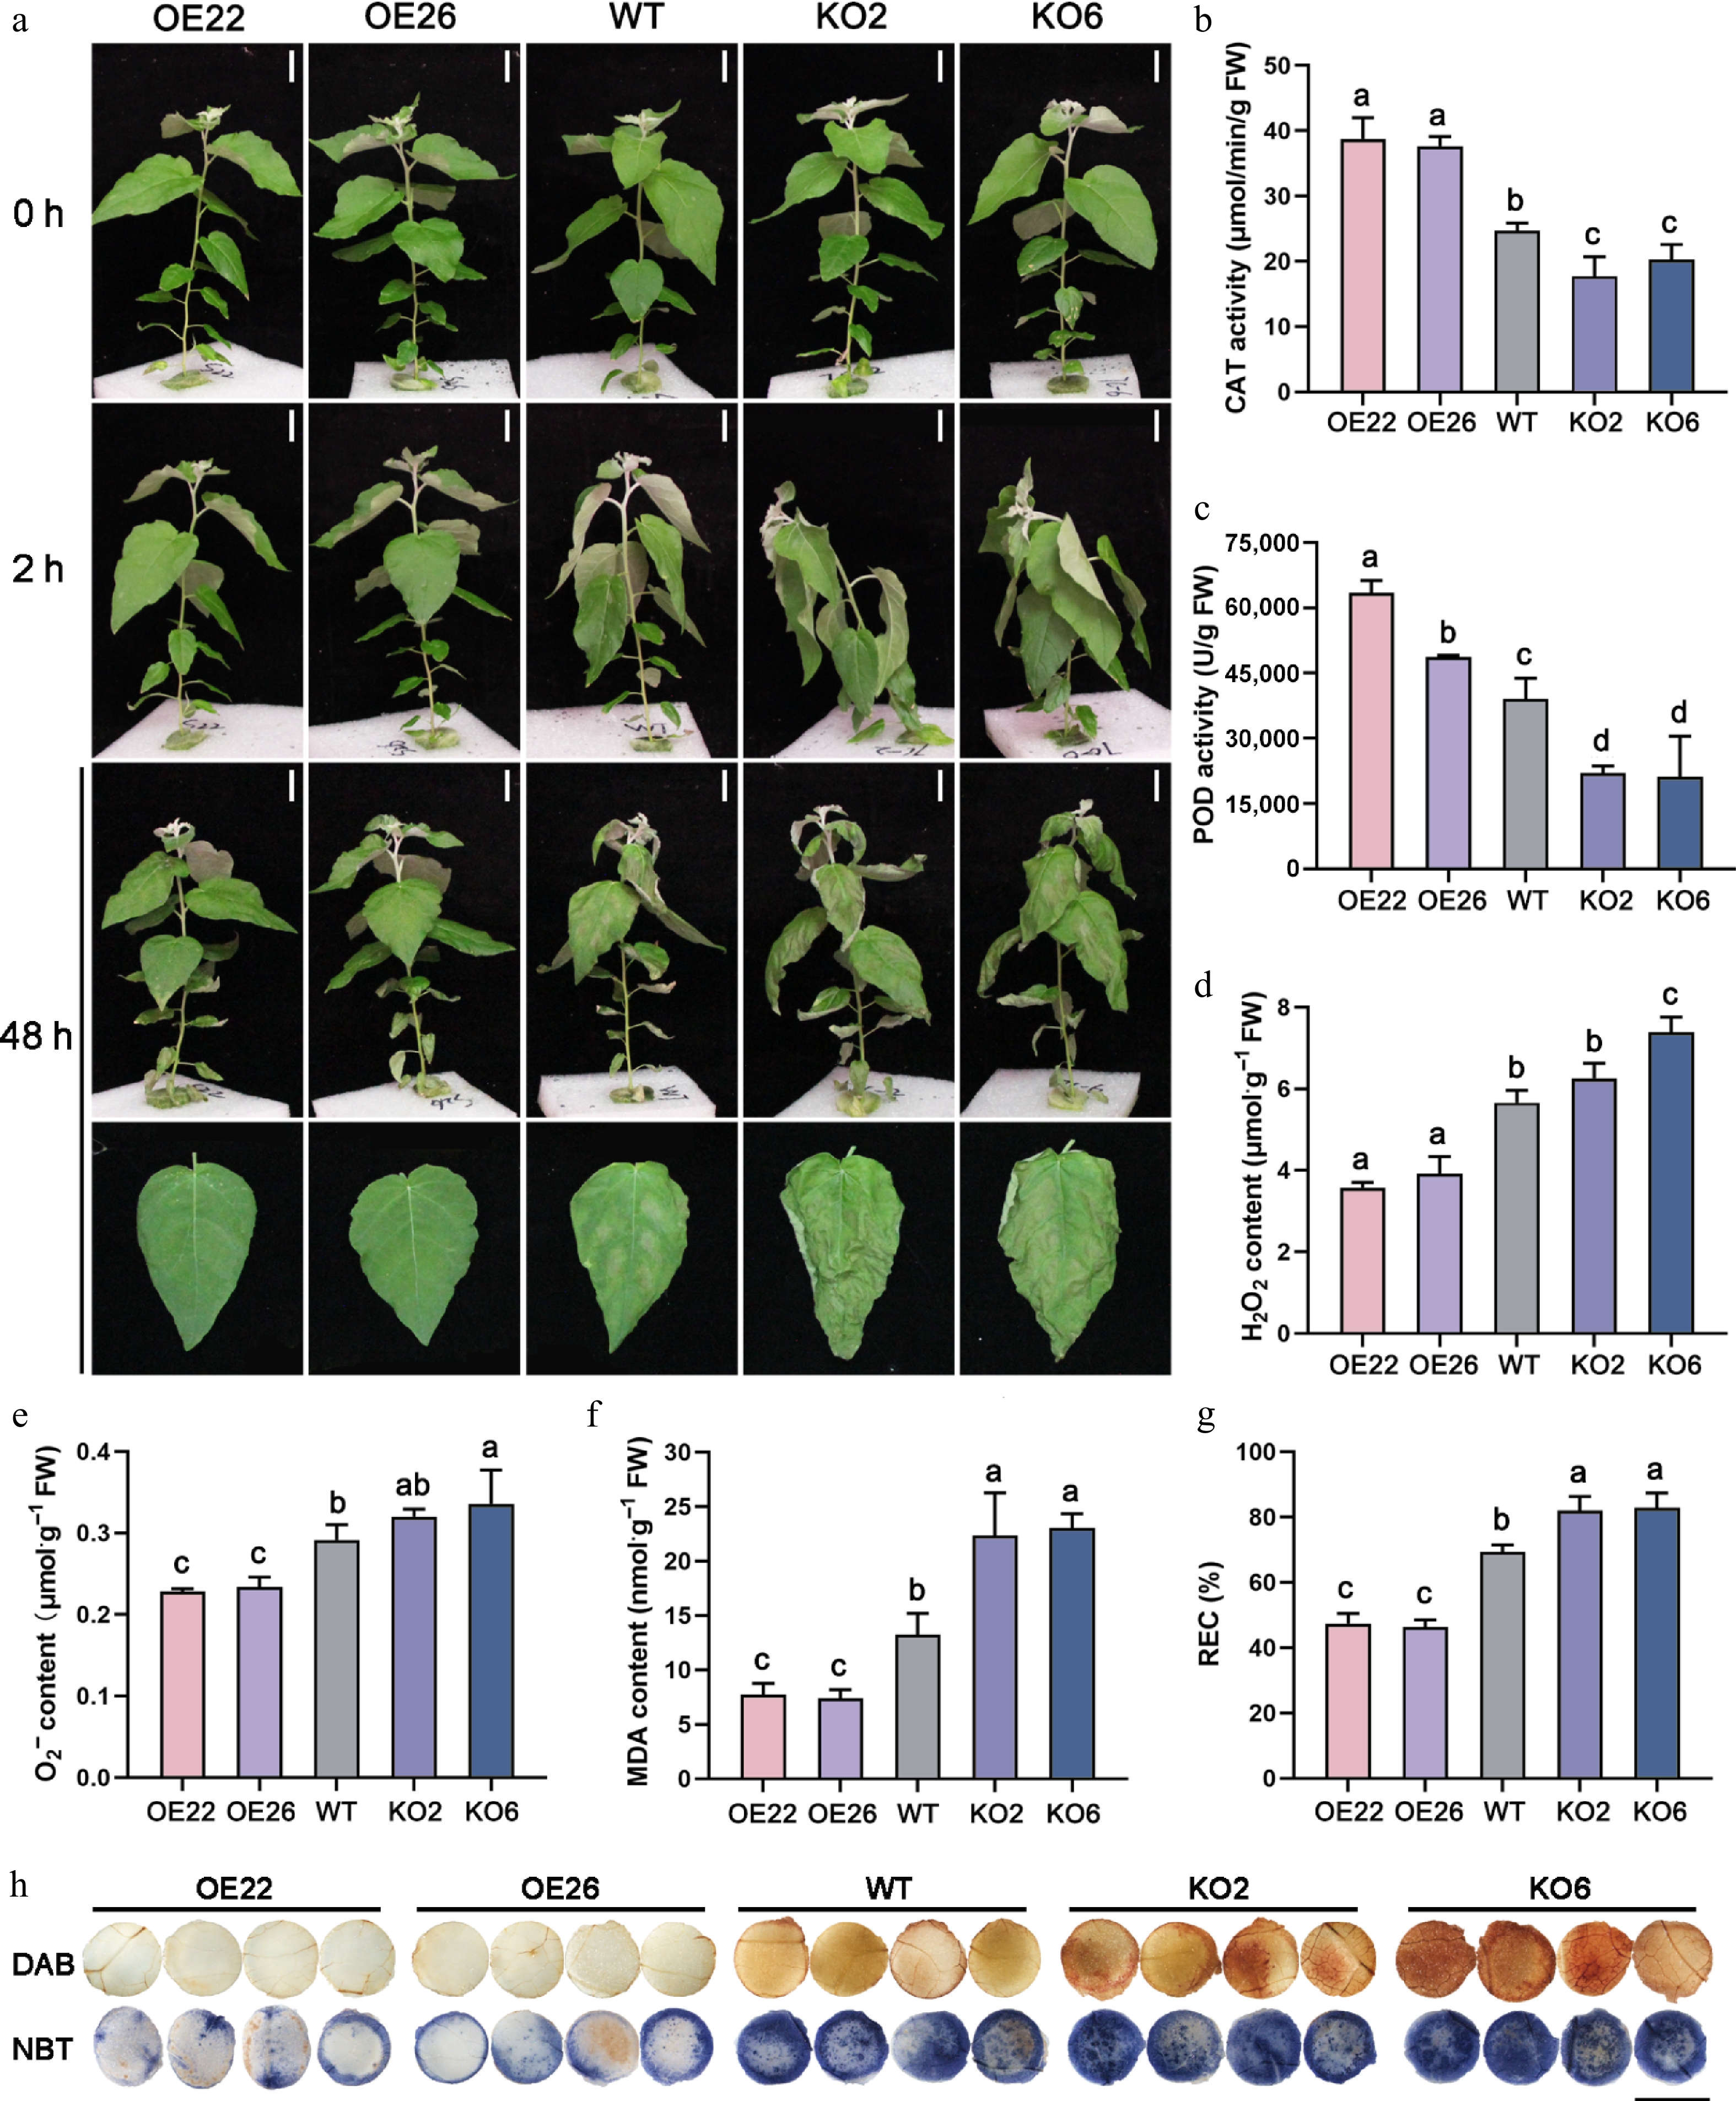
Figure 3.
PagHB7a is a positive regulator of short-term salt tolerance in poplar. (a) Phenotype of PagHB7a-OE, WT, and PagHB7a-KO plants before and after treated with 150 mM NaCl. Scale bars, 5 cm. The (b) catalase activity (CAT), (c) peroxidase activity (POD), (d) H2O2 content, (e) O2·− content, (f) malondialdehyde (MDA) content, and (g) relative electrical conductivity (REC) in PagHB7a-OE, PagHB7a-KO, and WT plants with 150 mM NaCl treatment. Error bars represent ± vSD (n = 3). Statistical significance was determined by one-way ANOVA with Tukey's post hoc test. Different letters represent significant differences. (h) Histochemical staining of reactive oxygen species using DAB (3,3'-diaminobenzidine), and NBT (nitroblue tetrazolium) in leaves of plants under 150 mM NaCl treatment. Scale bars = 6 mm.
-
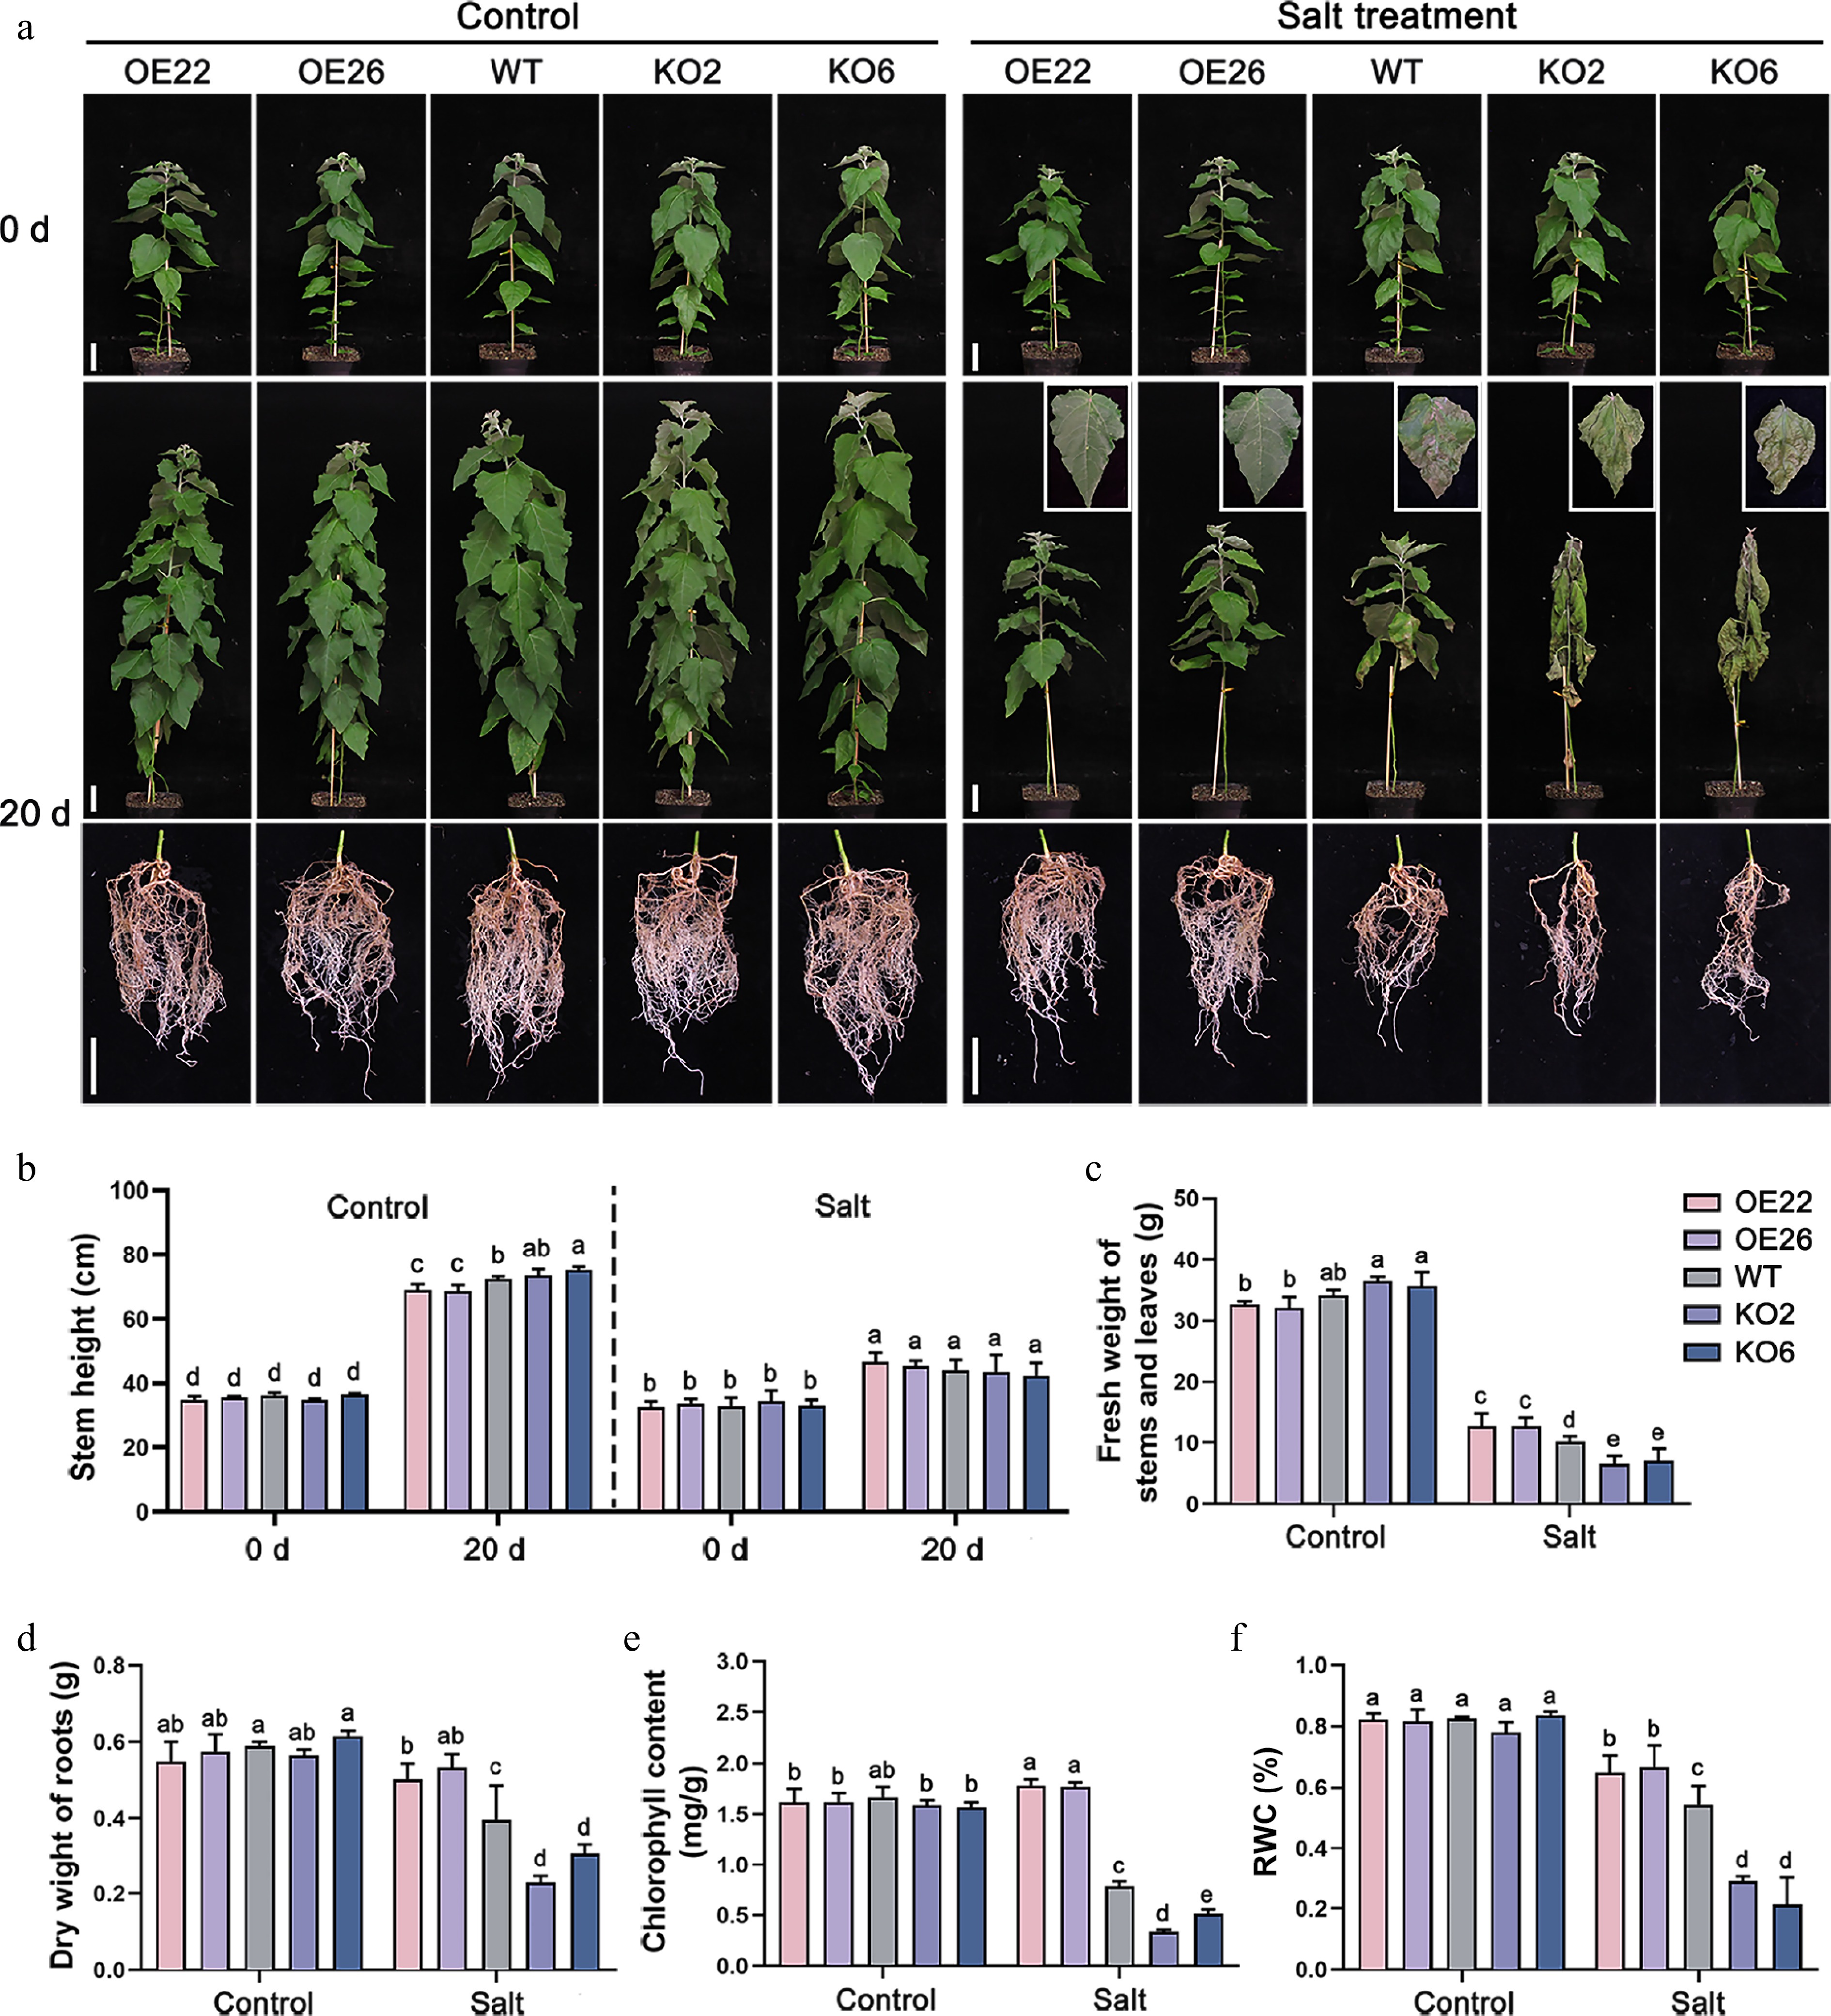
Figure 4.
PagHB7a is a positive regulator of long-term salt tolerance in poplar. (a) Phenotypes of PagHB7a-OE, WT, and PagHB7a-KO plants treated with or without (Control) 100 mM NaCl treatment in soil. Scale bar = 5 cm. (b) Stem height of PagHB7a-OE, WT, and PagHB7a-KO plants under control conditions, or after treatment with 100 mM NaCl treatment. Quantification analysis of (c) fresh weight of stems and leaves, (d) dry weight of roots, (e) chlorophyll content, and the (f) relative water content (RWC) of PagHB7a-OE, WT, and PagHB7a-KO plants under control conditions or after treatment with 100 mM NaCl for 20 d. Statistical significance was determined by one-way ANOVA with Tukey's post hoc test. Different letters represent significant differences. Error bars represent SD values (n = 3).
-
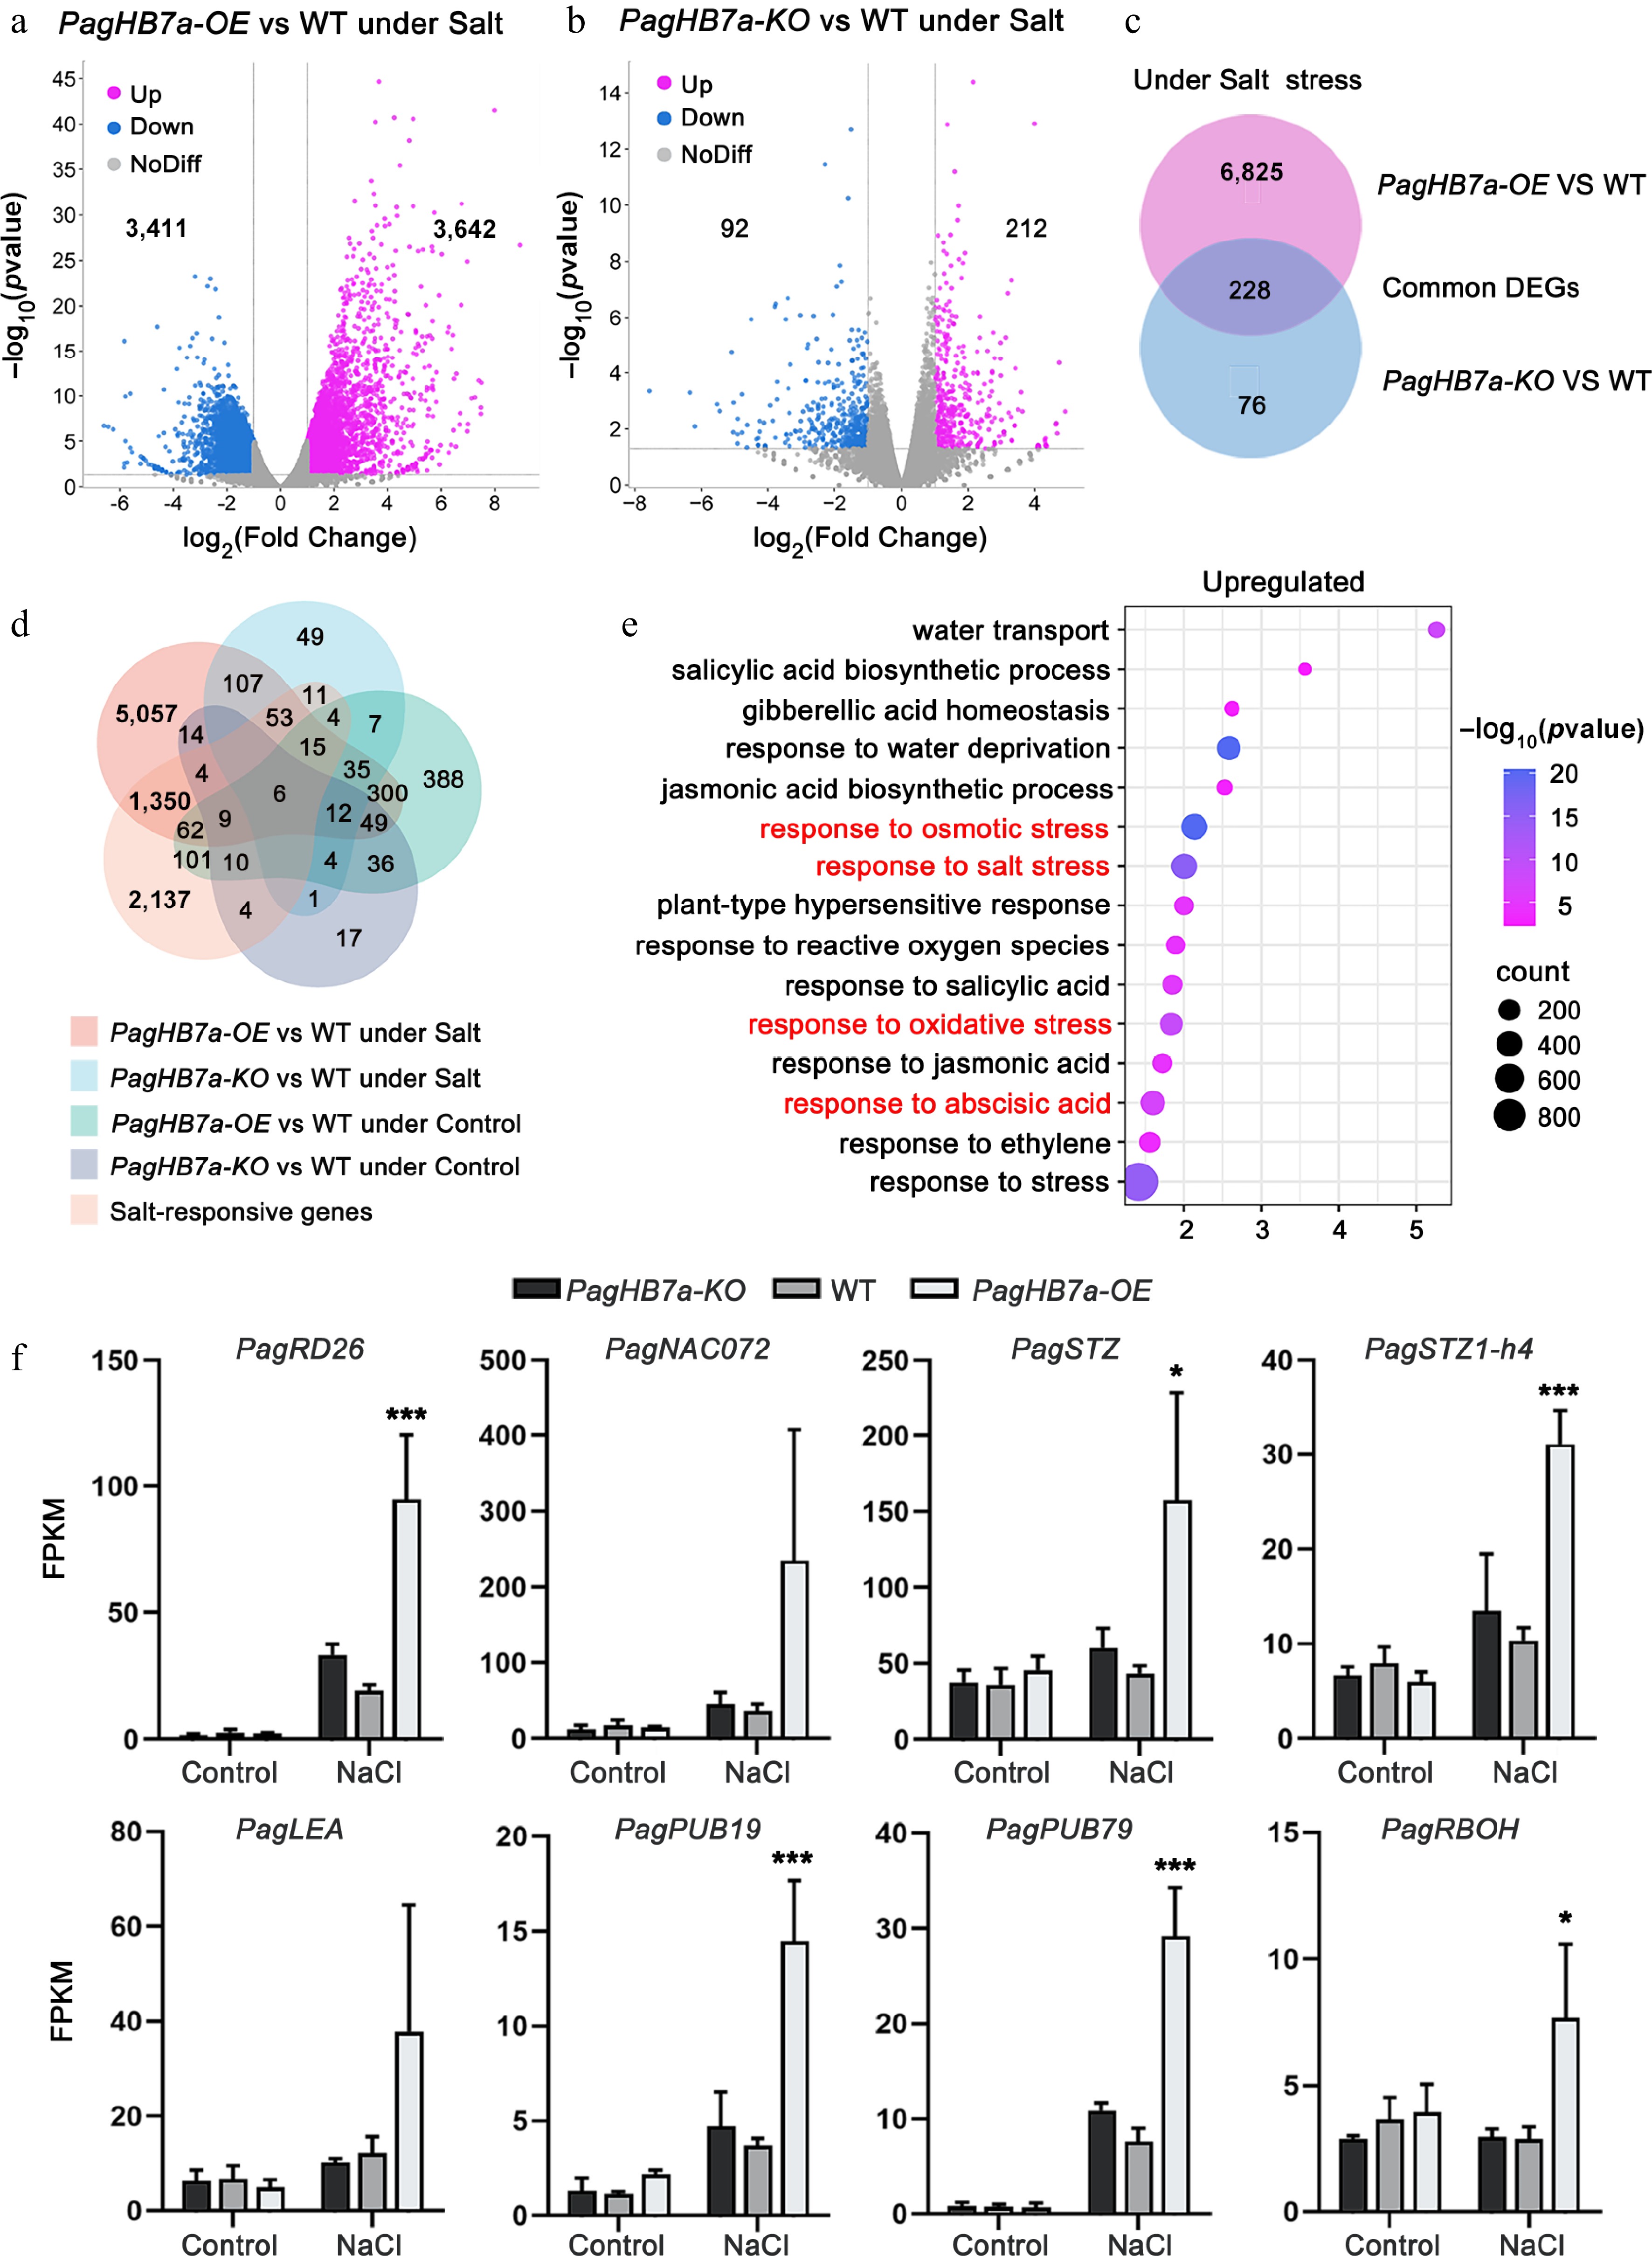
Figure 5.
Transcriptome analysis of PagHB7a-OE, PagHB7a-KO, and WT plants. Volcano plots showing differentially expressed genes (DEGs) in (a) PagHB7a-OE, and (b) PagHB7a-KO plants compared to WT under NaCl treatment (p-adjust < 0.05, log2(Fold Change) ≥ 2.0). The x-axis represents log2 transformed gene expression level, and the y-axis represents the −log10 transformed p-adjust. Each dot represents a single gene. Purple and blue dots denote significantly upregulated and downregulated genes, respectively. Grey dots represent genes without significant changes in expression. (c) Venn diagram illustrating the overlap of DEGs between PagHB7a-OE and PagHB7a-KO plants under NaCl treatment conditions. (d) Venn diagram showing DEGs shared among five comparison groups. (e) Gene Ontology (GO) enrichment analysis of upregulated DEGs in PagHB7a-OE under NaCl treatment. Terms with large gene hit and low p-adjust. The size of the circles indicates the number of hit genes, and the color represents the significance level based on the adjusted p-value. (f) Expression of representative stress-responsive DEGs in PagHB7a-OE, PagHB7a-KO, and WT plants under 100 mM NaCl treatment for 6 h. Gene expression levels are shown as mean FPKM from RNA-seq data. Asterisks denote significant differences compared to values of WT, * p < 0.05; ** p < 0.01; *** p < 0.001.
-
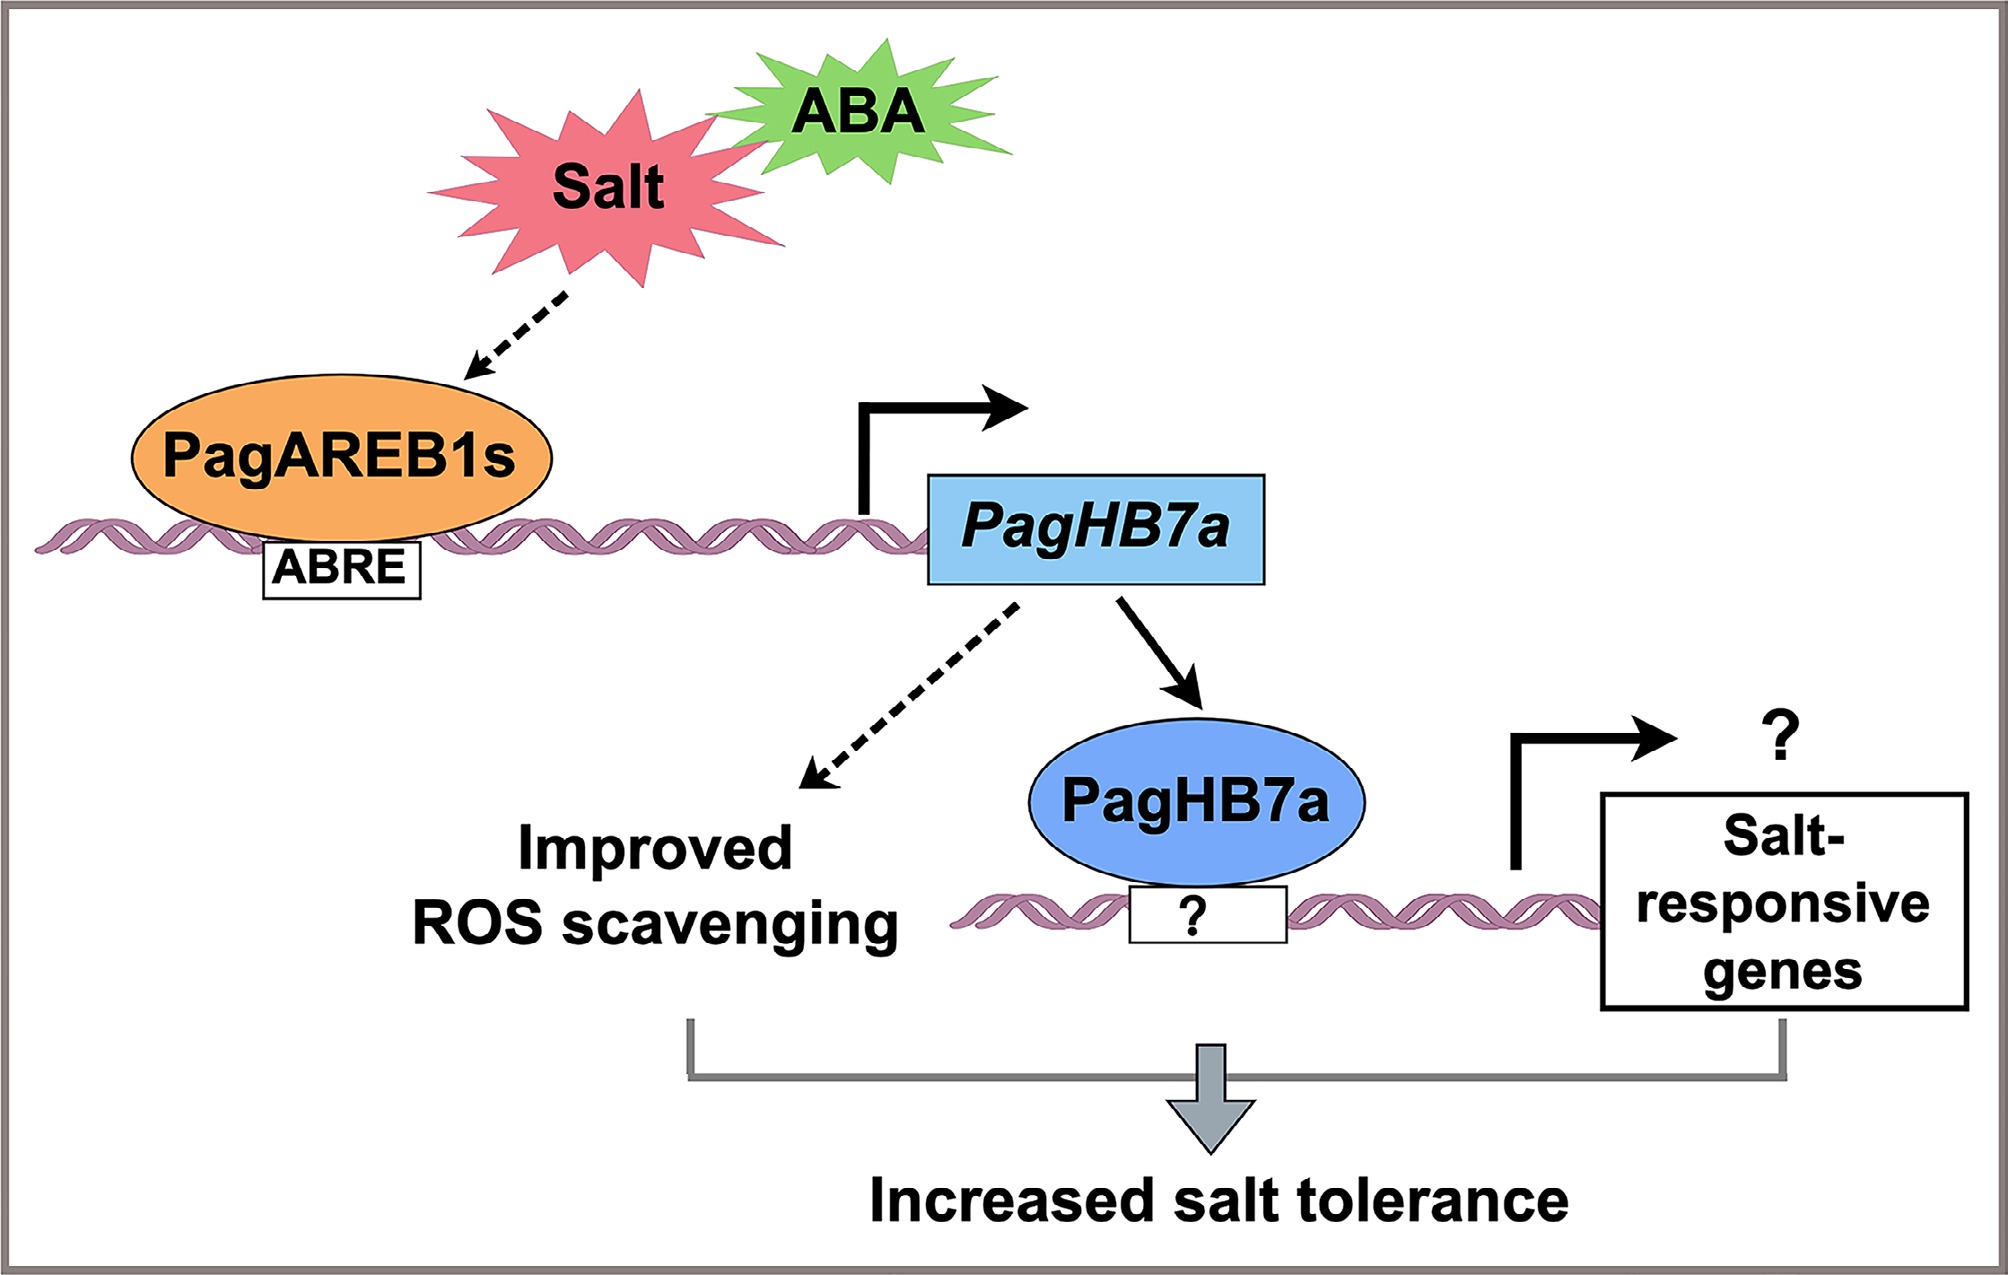
Figure 6.
Proposed model for the regulatory role of PagHB7a in salt stress response. Under salt stress, PagAREB1s, key transcription factors within the ABA signaling pathway, directly bind to the promoter of PagHB7a and activate its expression. The upregulation of PagHB7a enhances reactive ROS scavenging capacity, thereby improving salt tolerance in poplar. Additionally, PagHB7a may also contribute to salinity adaptation through direct activation of unidentified salt-responsive genes.
Figures
(6)
Tables
(0)