-
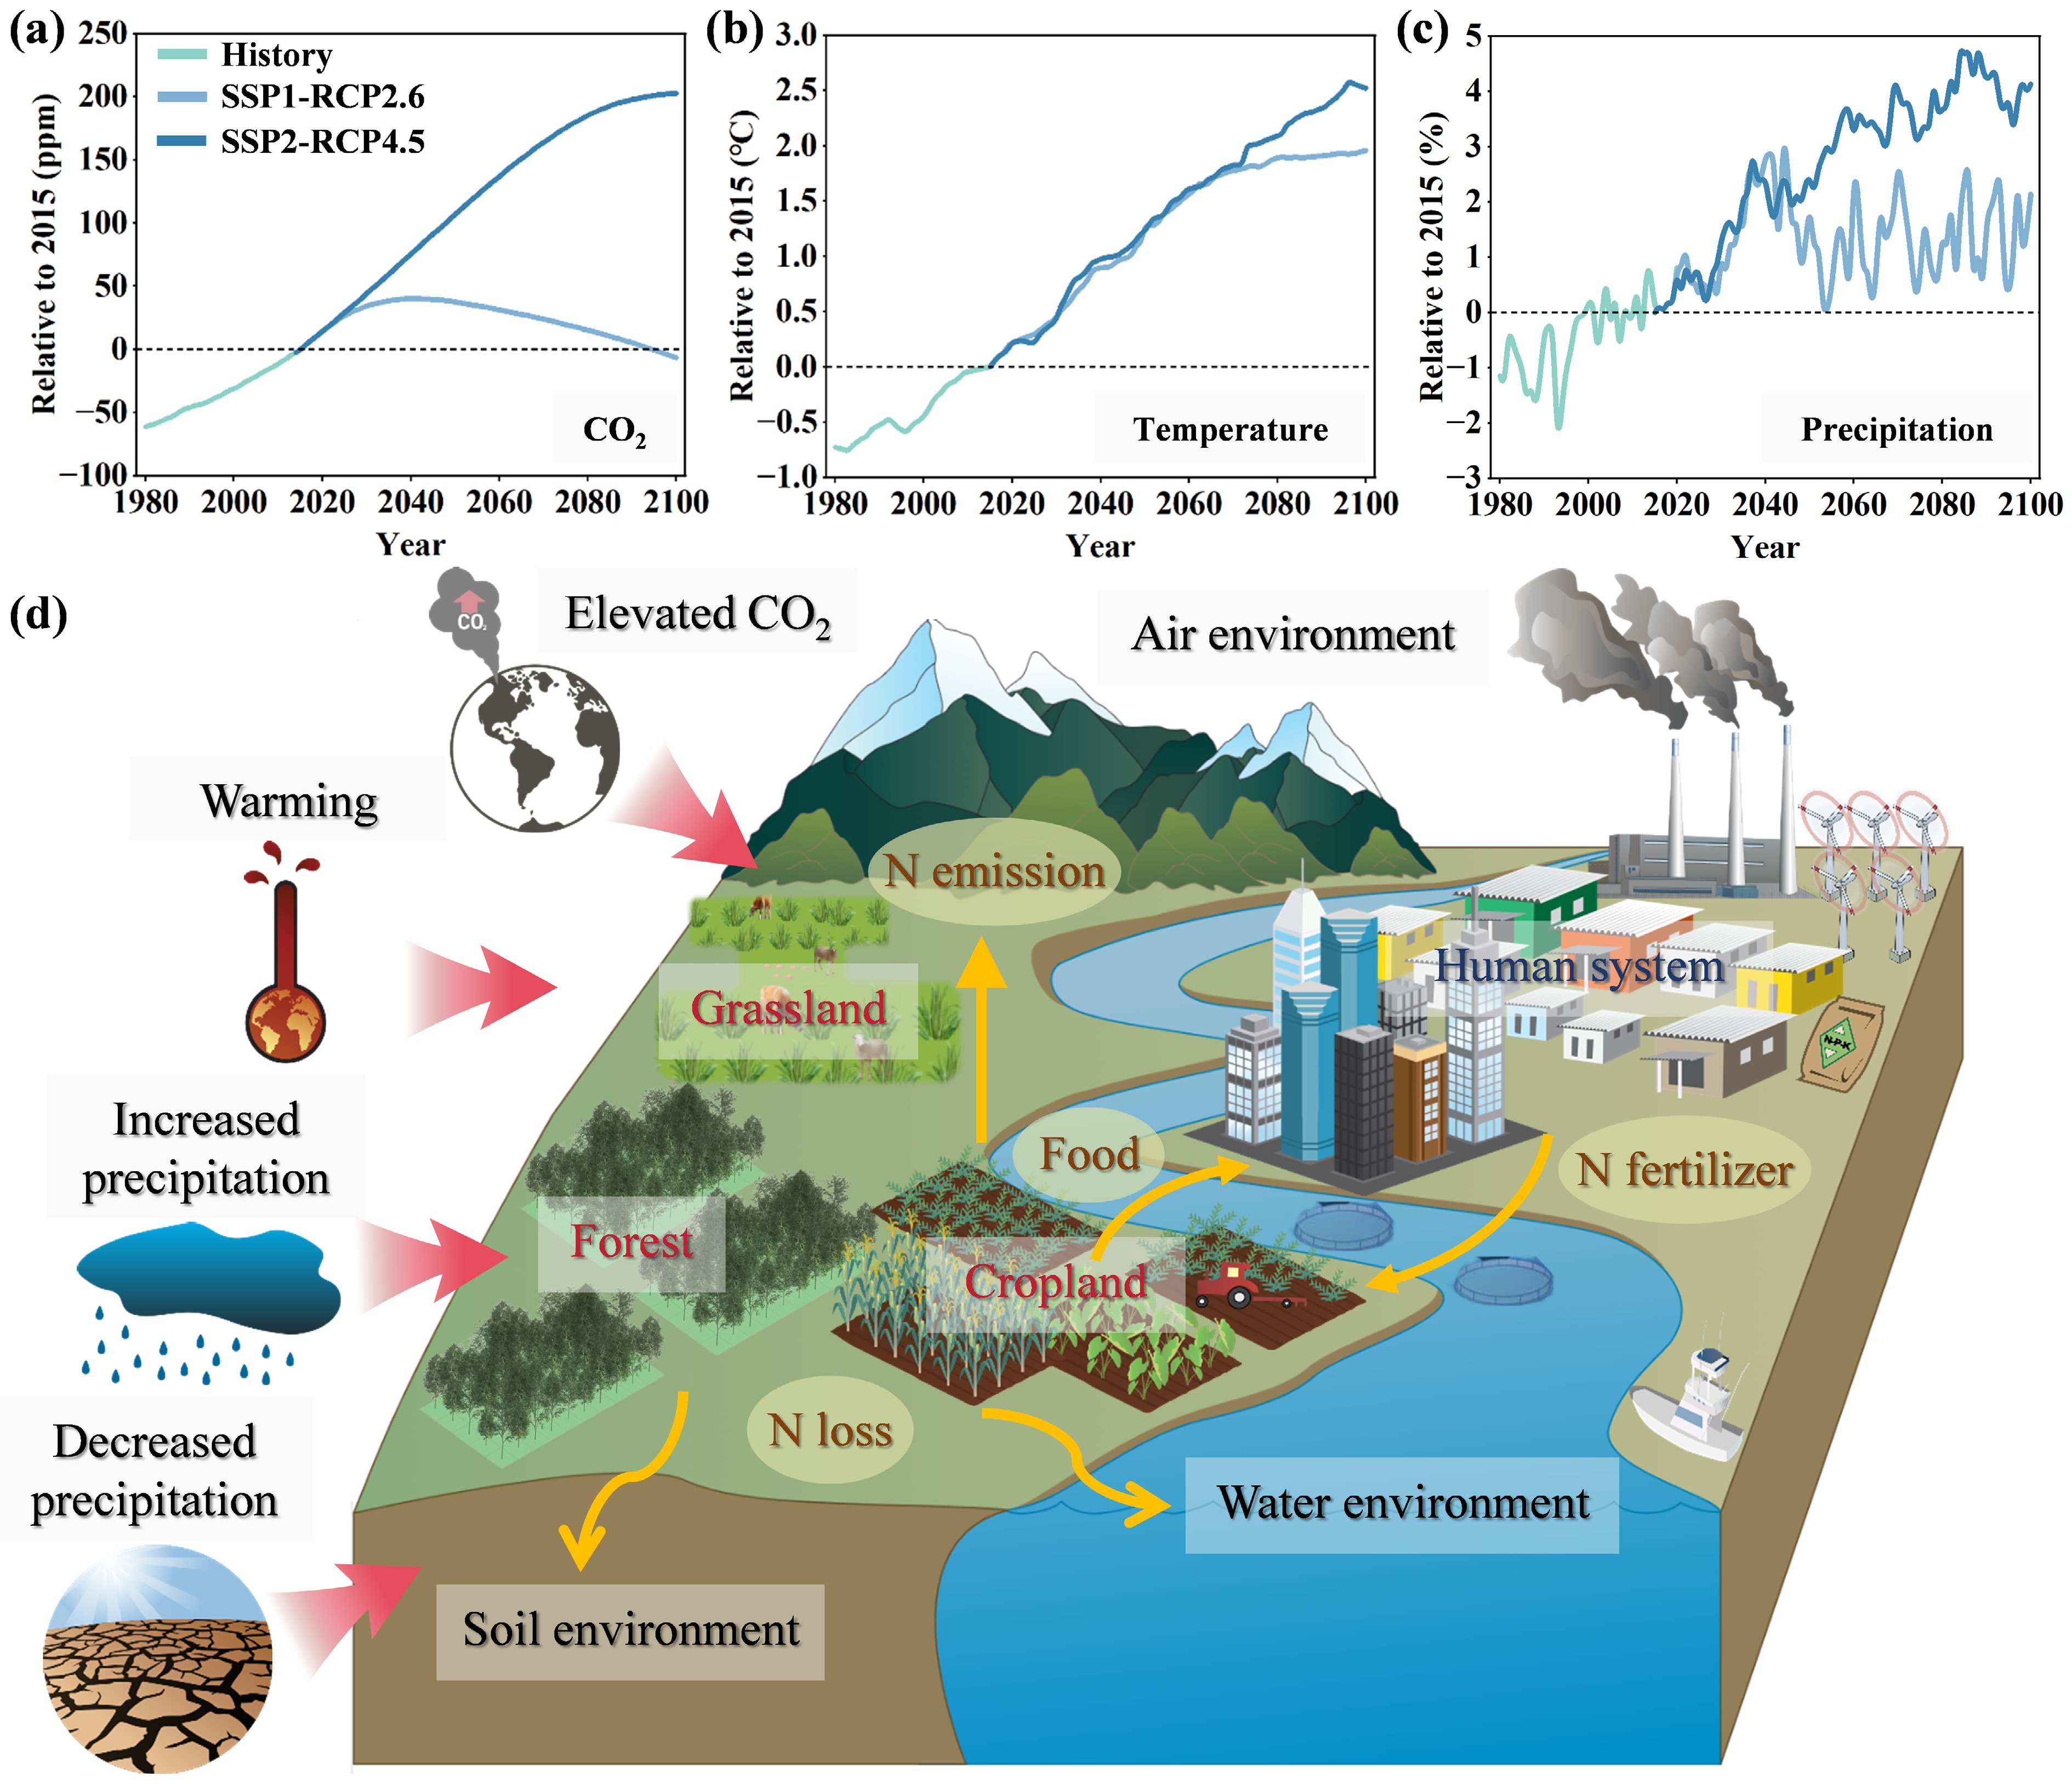
Figure 1.
Global climate change and terrestrial ecosystems. (a) Changes in global atmospheric CO2 from 1980 to 2100 under different Shared Socioeconomic Pathways-Representative Concentration Pathways (SSP-RCP) scenarios. (b) Changes in global air temperature from 1980 to 2100 under different SSP-RCP scenarios. (c) Changes in global land precipitation from 1980 to 2100 under different SSP-RCP scenarios. (d) Effects of different climate change factors on the nitrogen cycle in global terrestrial ecosystems. Yellow arrows denote interactions between systems; Red arrows indicate the impacts of climate change on terrestrial ecosystems. N, nitrogen. The symbols are from Integration and Application Network (
https://ian.umces.edu/media-library/ ). -
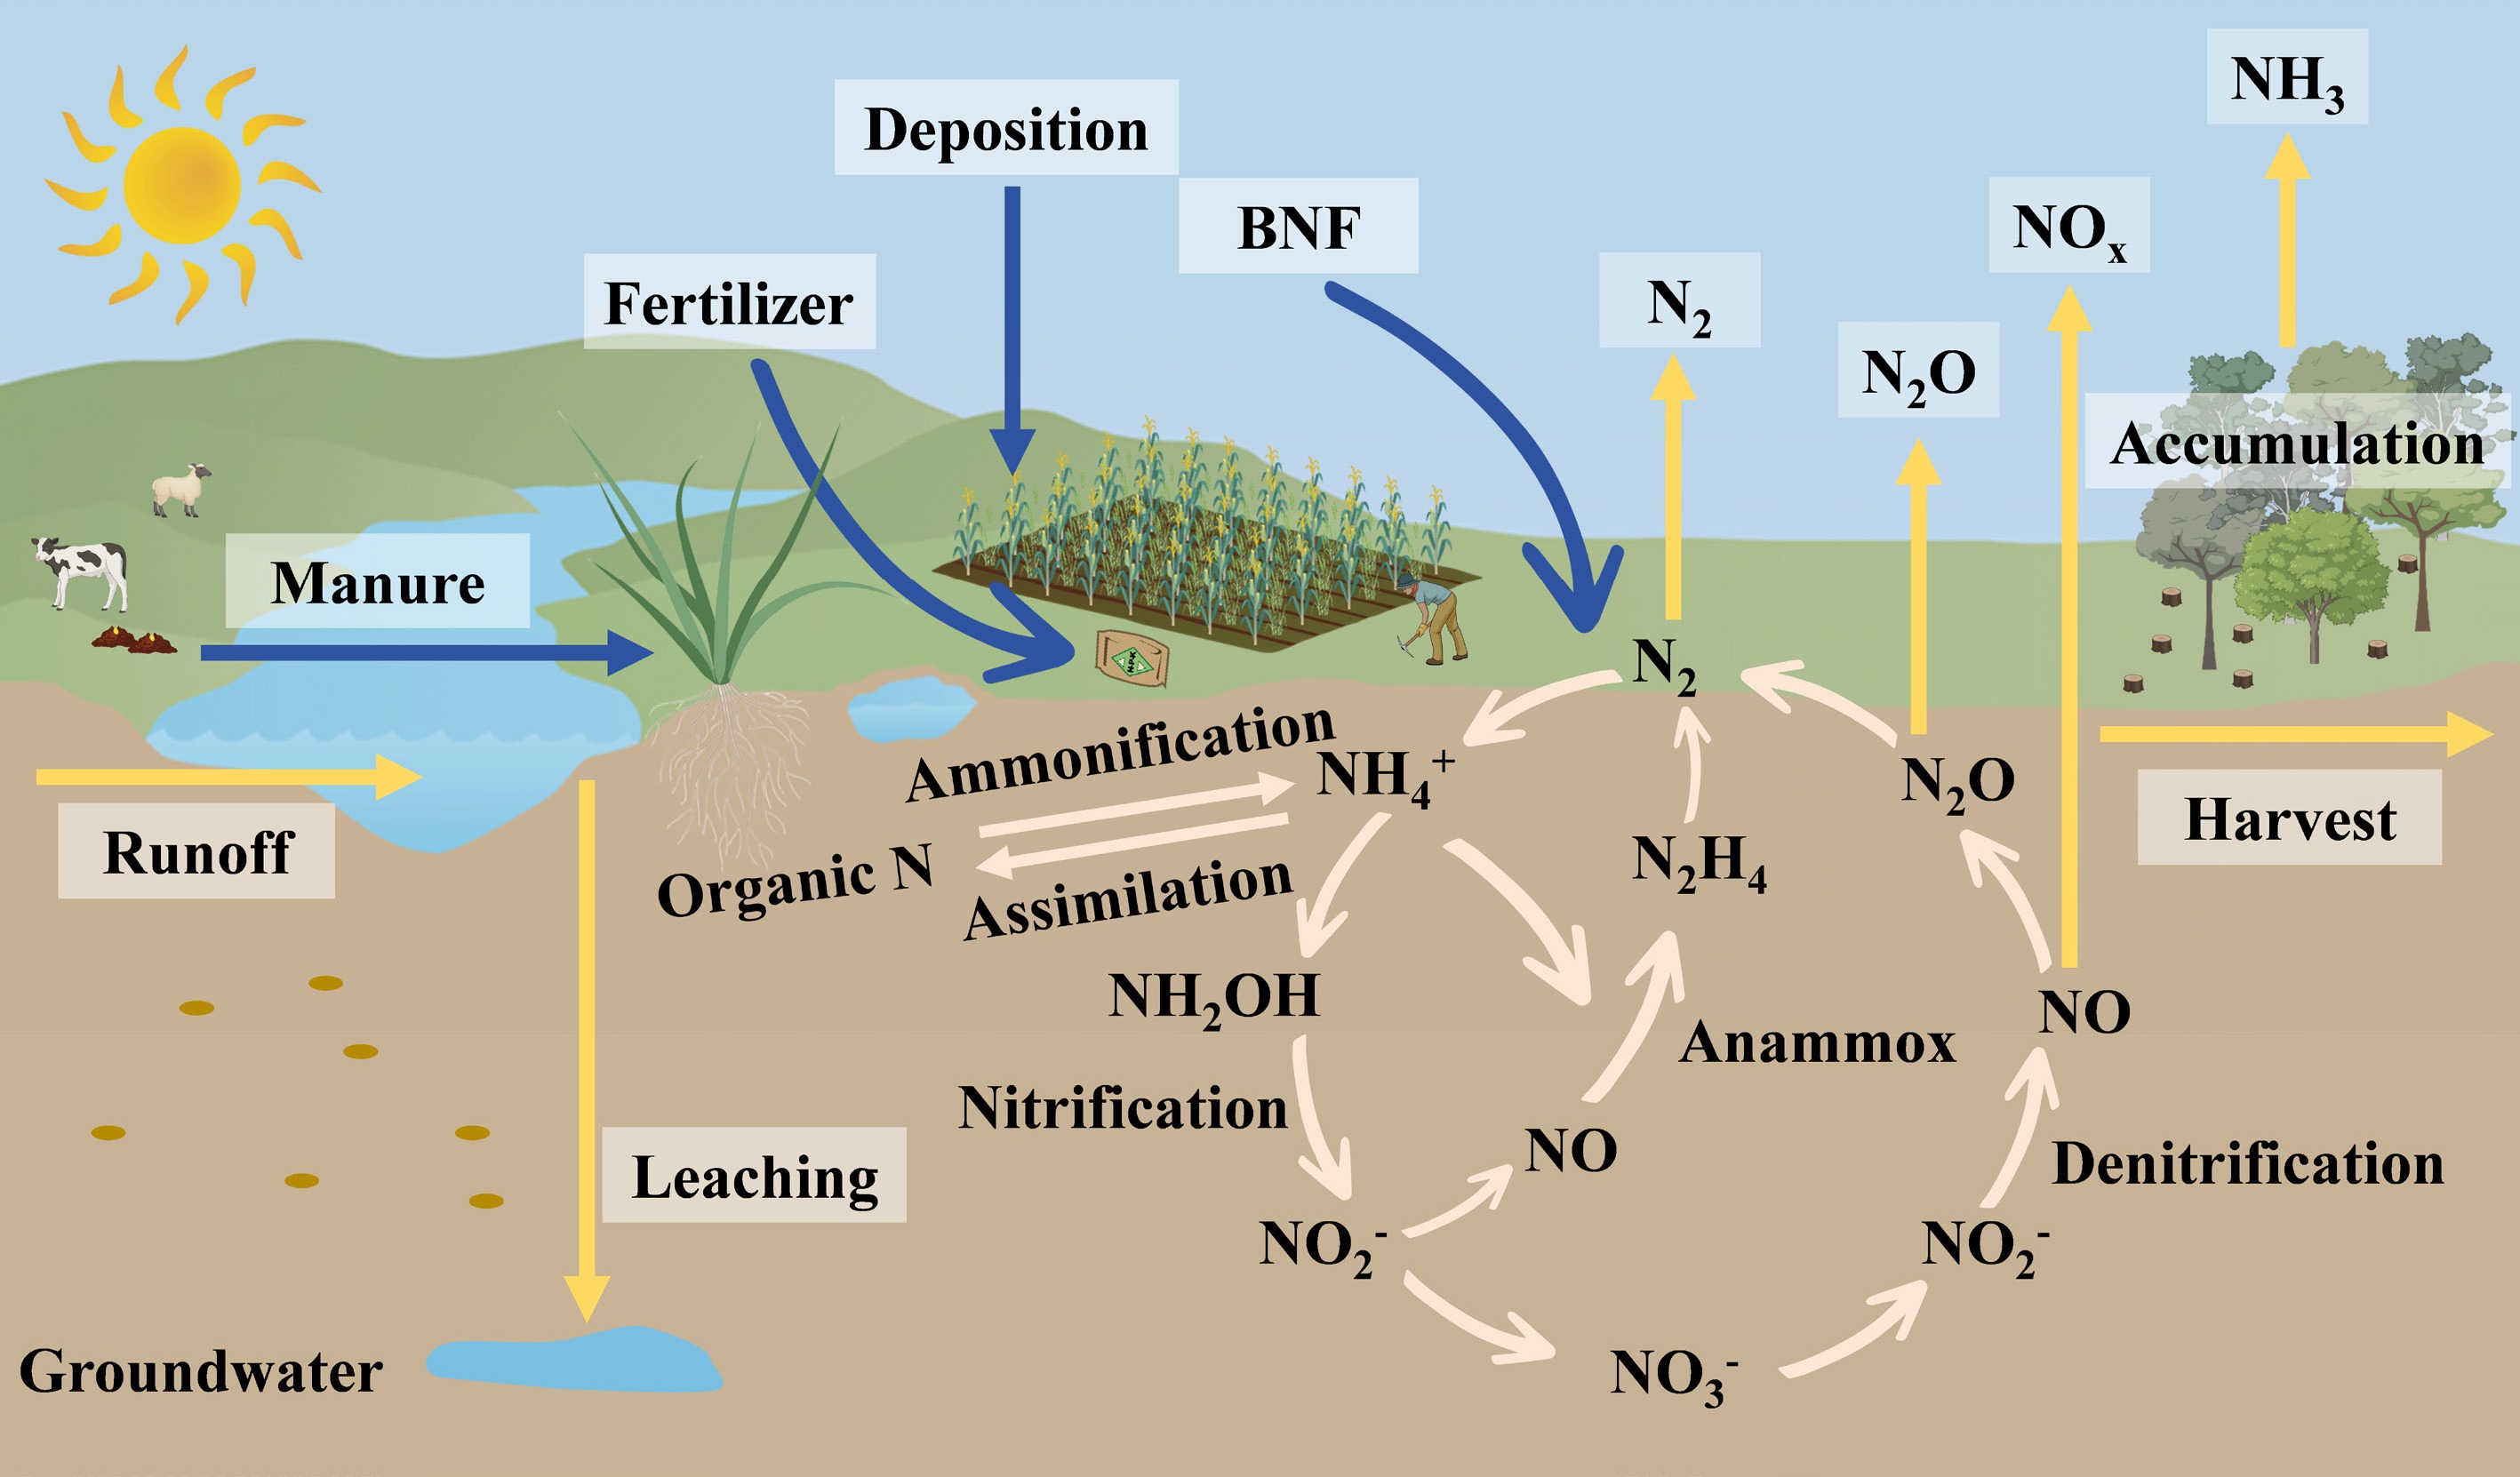
Figure 2.
Nitrogen flows in terrestrial ecosystems. Nitrogen inputs and outputs are differentiated by blue and yellow arrows, respectively. Nitrogen inputs include biological nitrogen fixation (BNF), deposition, fertilizer, and manure. Nitrogen outputs include harvest, reactive nitrogen losses, and non-reactive nitrogen emissions. Simplified soil nitrogen cycle, such as ammonification, ammonium assimilation, BNF, nitrification, denitrification, and anaerobic ammonium oxidation (anammox) are shown in light pink arrows. The symbols are from the Integration and Application Network (
https://ian.umces.edu/media-library/ ). -
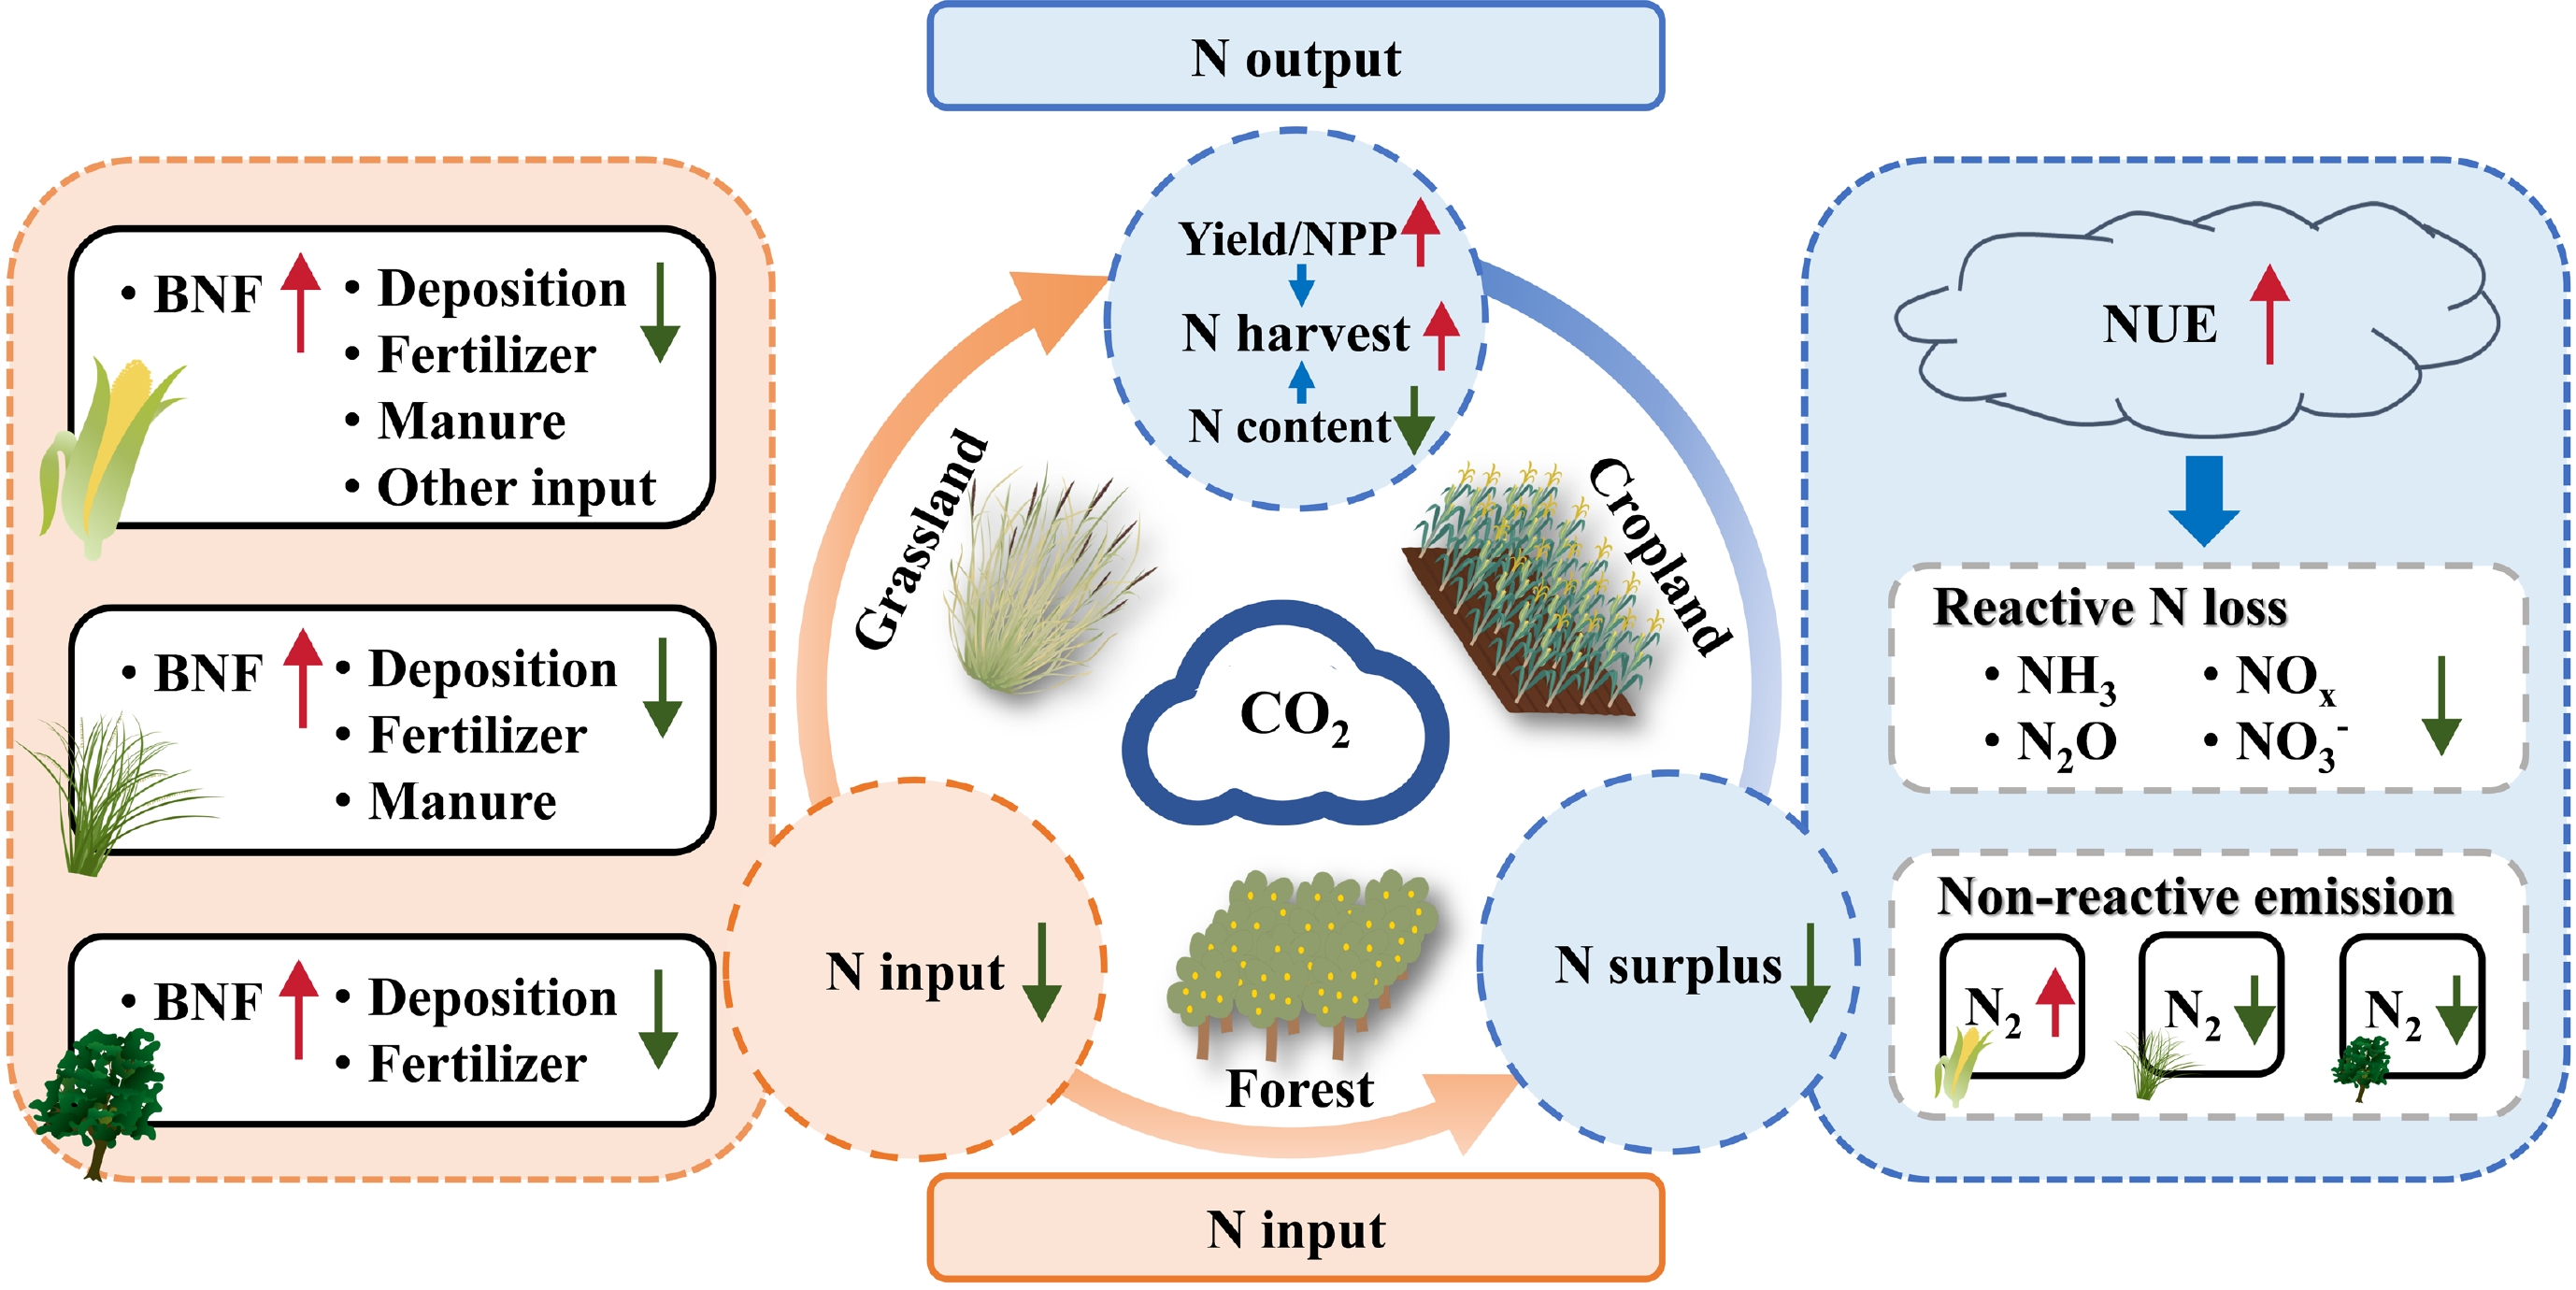
Figure 3.
The impacts of elevated CO2 levels on terrestrial nitrogen cycles. The orange box represents changes in nitrogen input. The blue box represents changes in nitrogen output. Red arrows indicate positive effects, green arrows represent suppressive effects, and blue arrows indicate their interrelations. BNF, biological nitrogen fixation; NPP, net primary productivity; NUE, nitrogen use efficiency; NH3, ammonia; N2O, nitrous oxide; NOx, nitrogen oxides; NO3−, nitrate leaching and runoff; N, nitrogen. Specific ecological processes corresponding to each arrow: Red arrow → increased BNF → increased nitrogen input; Green arrow → decreased deposition/fertilizer/manure/other input → decreased nitrogen input; Red arrow → increased yield/NPP → increased nitrogen harvest; Green arrow → decreased nitrogen content → decreased nitrogen harvest; Red arrow → increased NUE → decreased nitrogen surplus; Green arrow → decreased ammonia/nitrous oxide/nitrogen oxides/nitrate leaching and runoff → decreased nitrogen surplus. The symbols are from the Integration and Application Network (
https://ian.umces.edu/media-library/ ). -
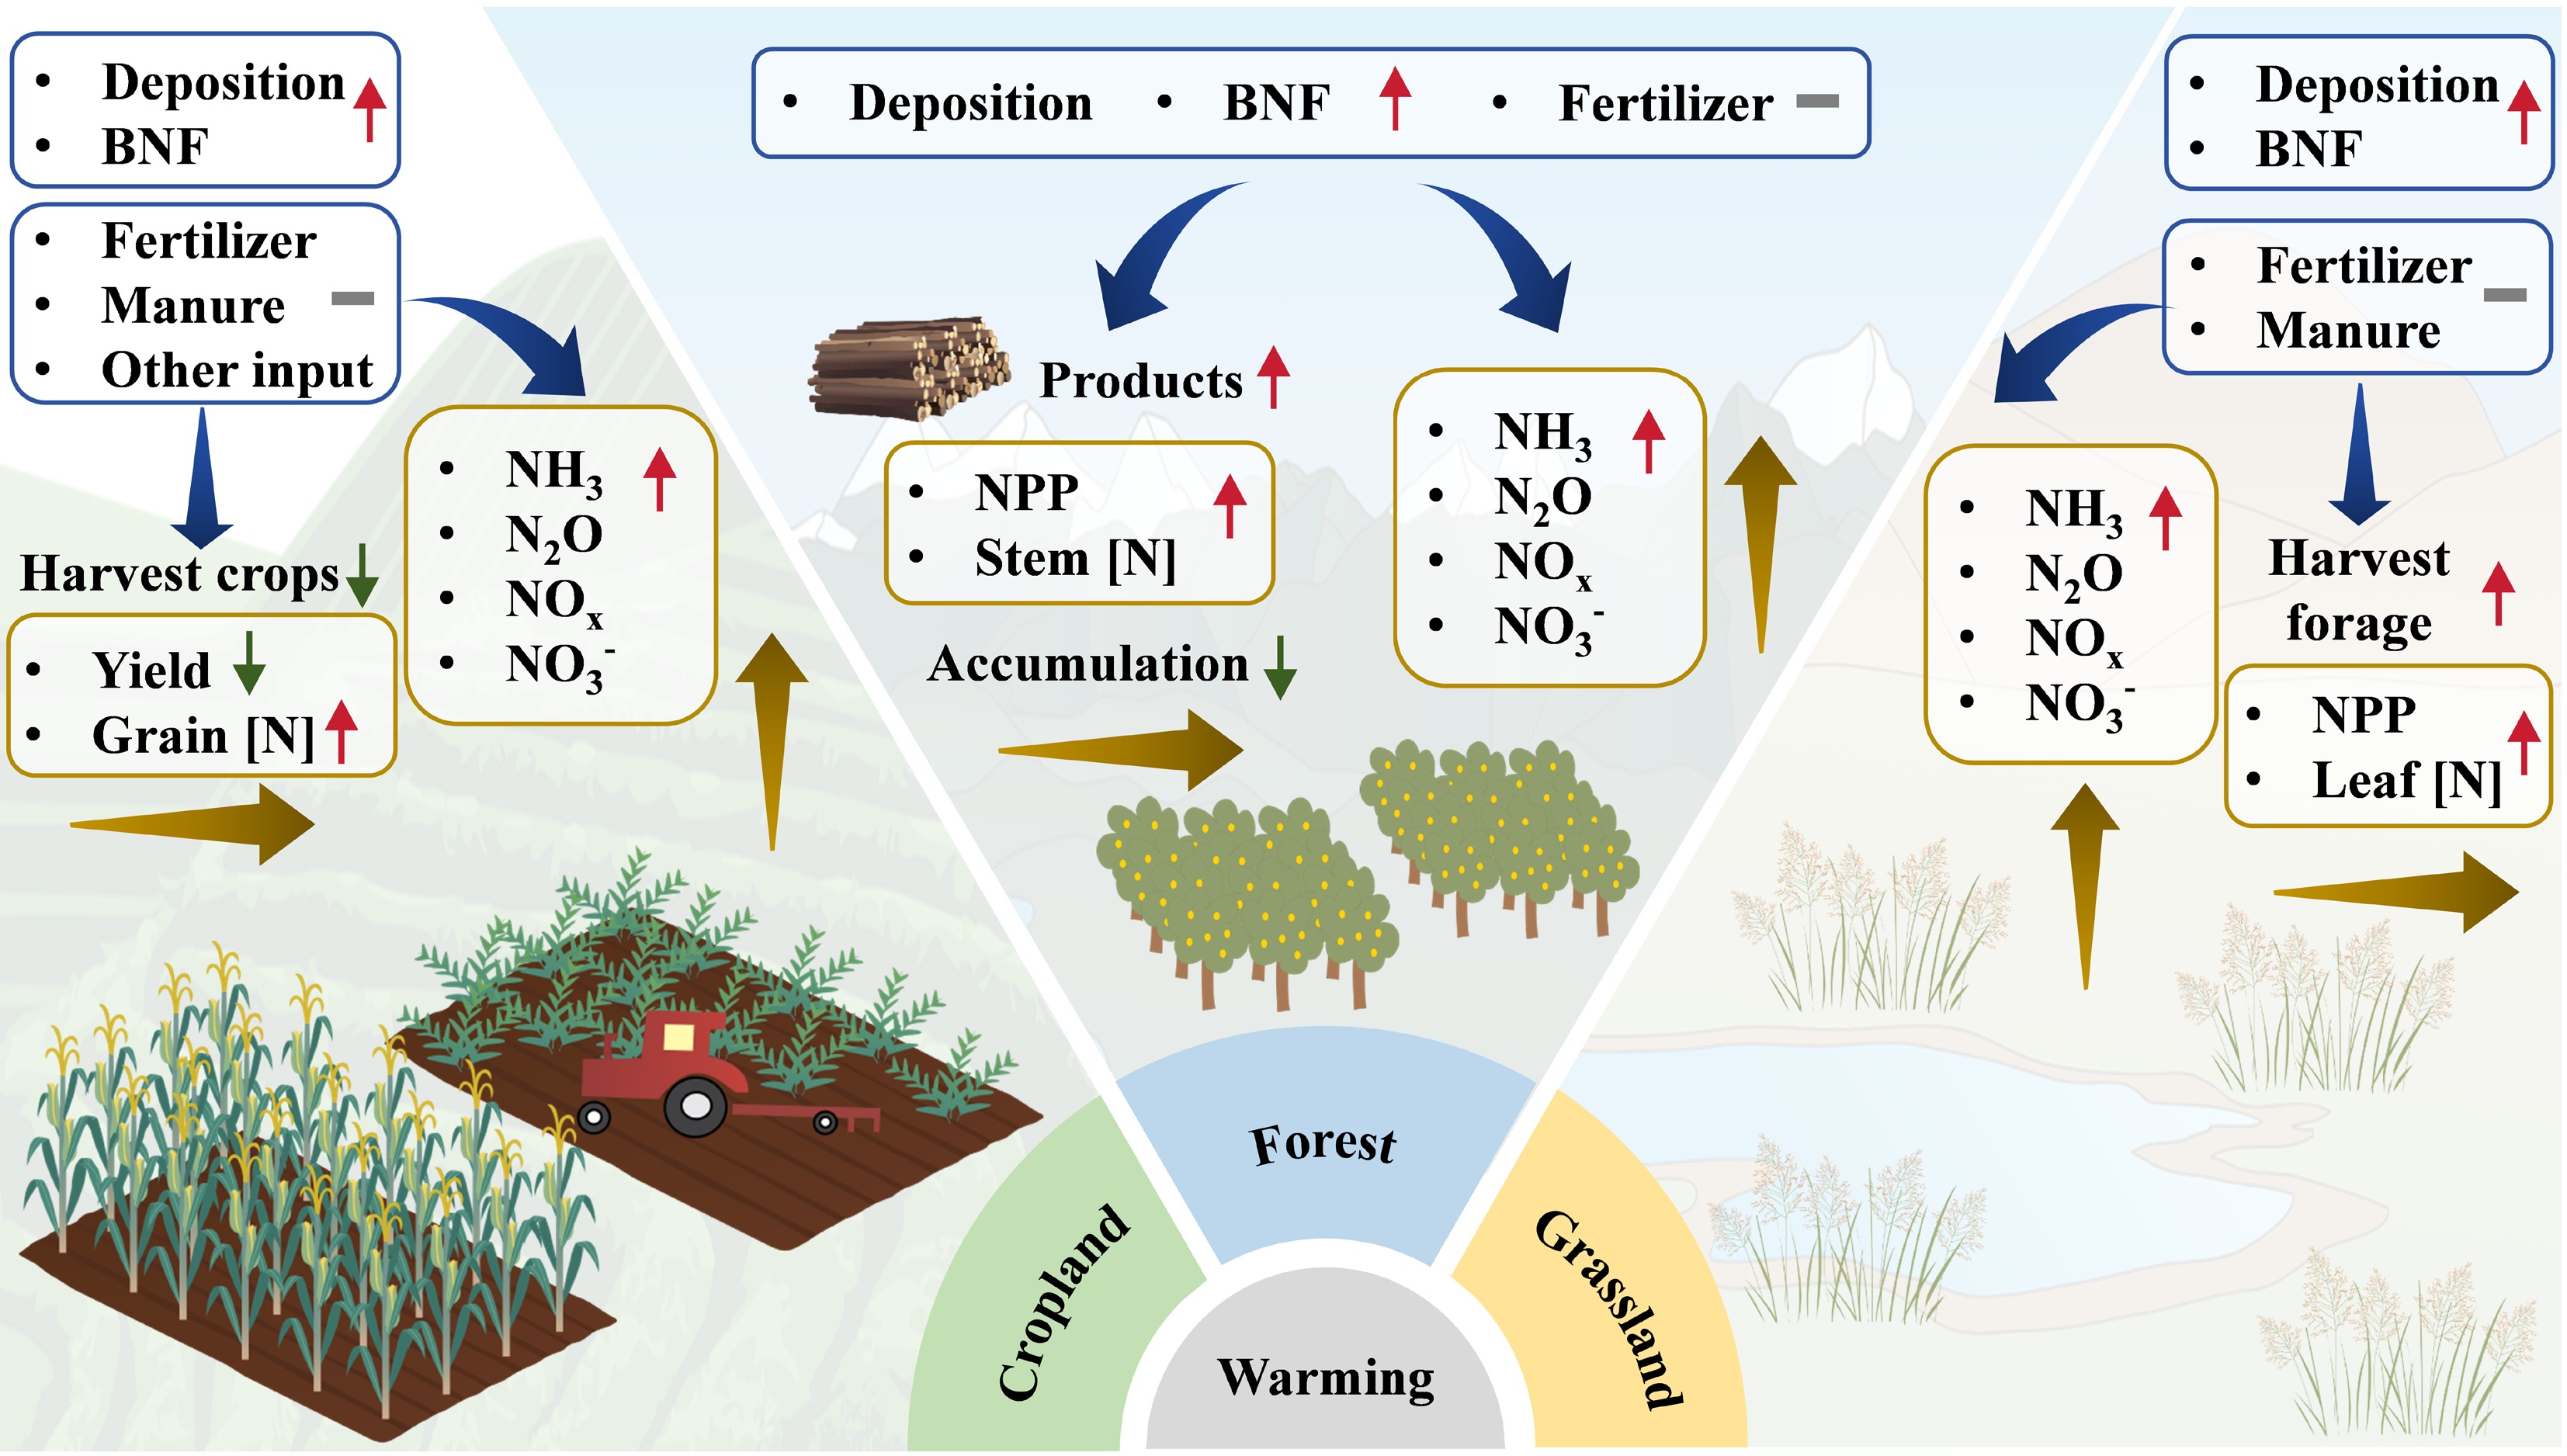
Figure 4.
The impacts of global warming on terrestrial nitrogen cycles. The left box represents the impacts of warming on the cropland nitrogen cycles. The middle box represents the impacts of warming on the forest nitrogen cycles. The right box shows the impacts of warming on the nitrogen cycle in grasslands. The nitrogen fluxes, including nitrogen input and output, are shown by blue and yellow arrows, respectively. Red arrows indicate positive effects, while green arrows represent suppressive effects. The gray solid lines indicate nonsignificant effects. Feedback mechanisms differ across various ecosystems. BNF, biological nitrogen fixation; NPP, net primary productivity; NUE, nitrogen use efficiency; NH3, ammonia; N2O, nitrous oxide; NOx, nitrogen oxides; NO3−, nitrate leaching and runoff; [N], nitrogen content. Specific ecological processes corresponding to each arrow: Red arrow → increased BNF/deposition → increased nitrogen input; Gray solid line → unchanged fertilizer/manure/other input → unchanged nitrogen input; Green arrow → decreased yield → decreased nitrogen harvest; Red arrow → increased NPP → increased nitrogen harvest; Red arrow → increased nitrogen content → increased nitrogen harvest; Red arrow → increased ammonia/nitrous oxide/nitrogen oxides/nitrate leaching and runoff → increased nitrogen surplus; Green arrow → decreased nitrogen accumulation. The symbols are from the Integration and Application Network (
https://ian.umces.edu/media-library/ ). -
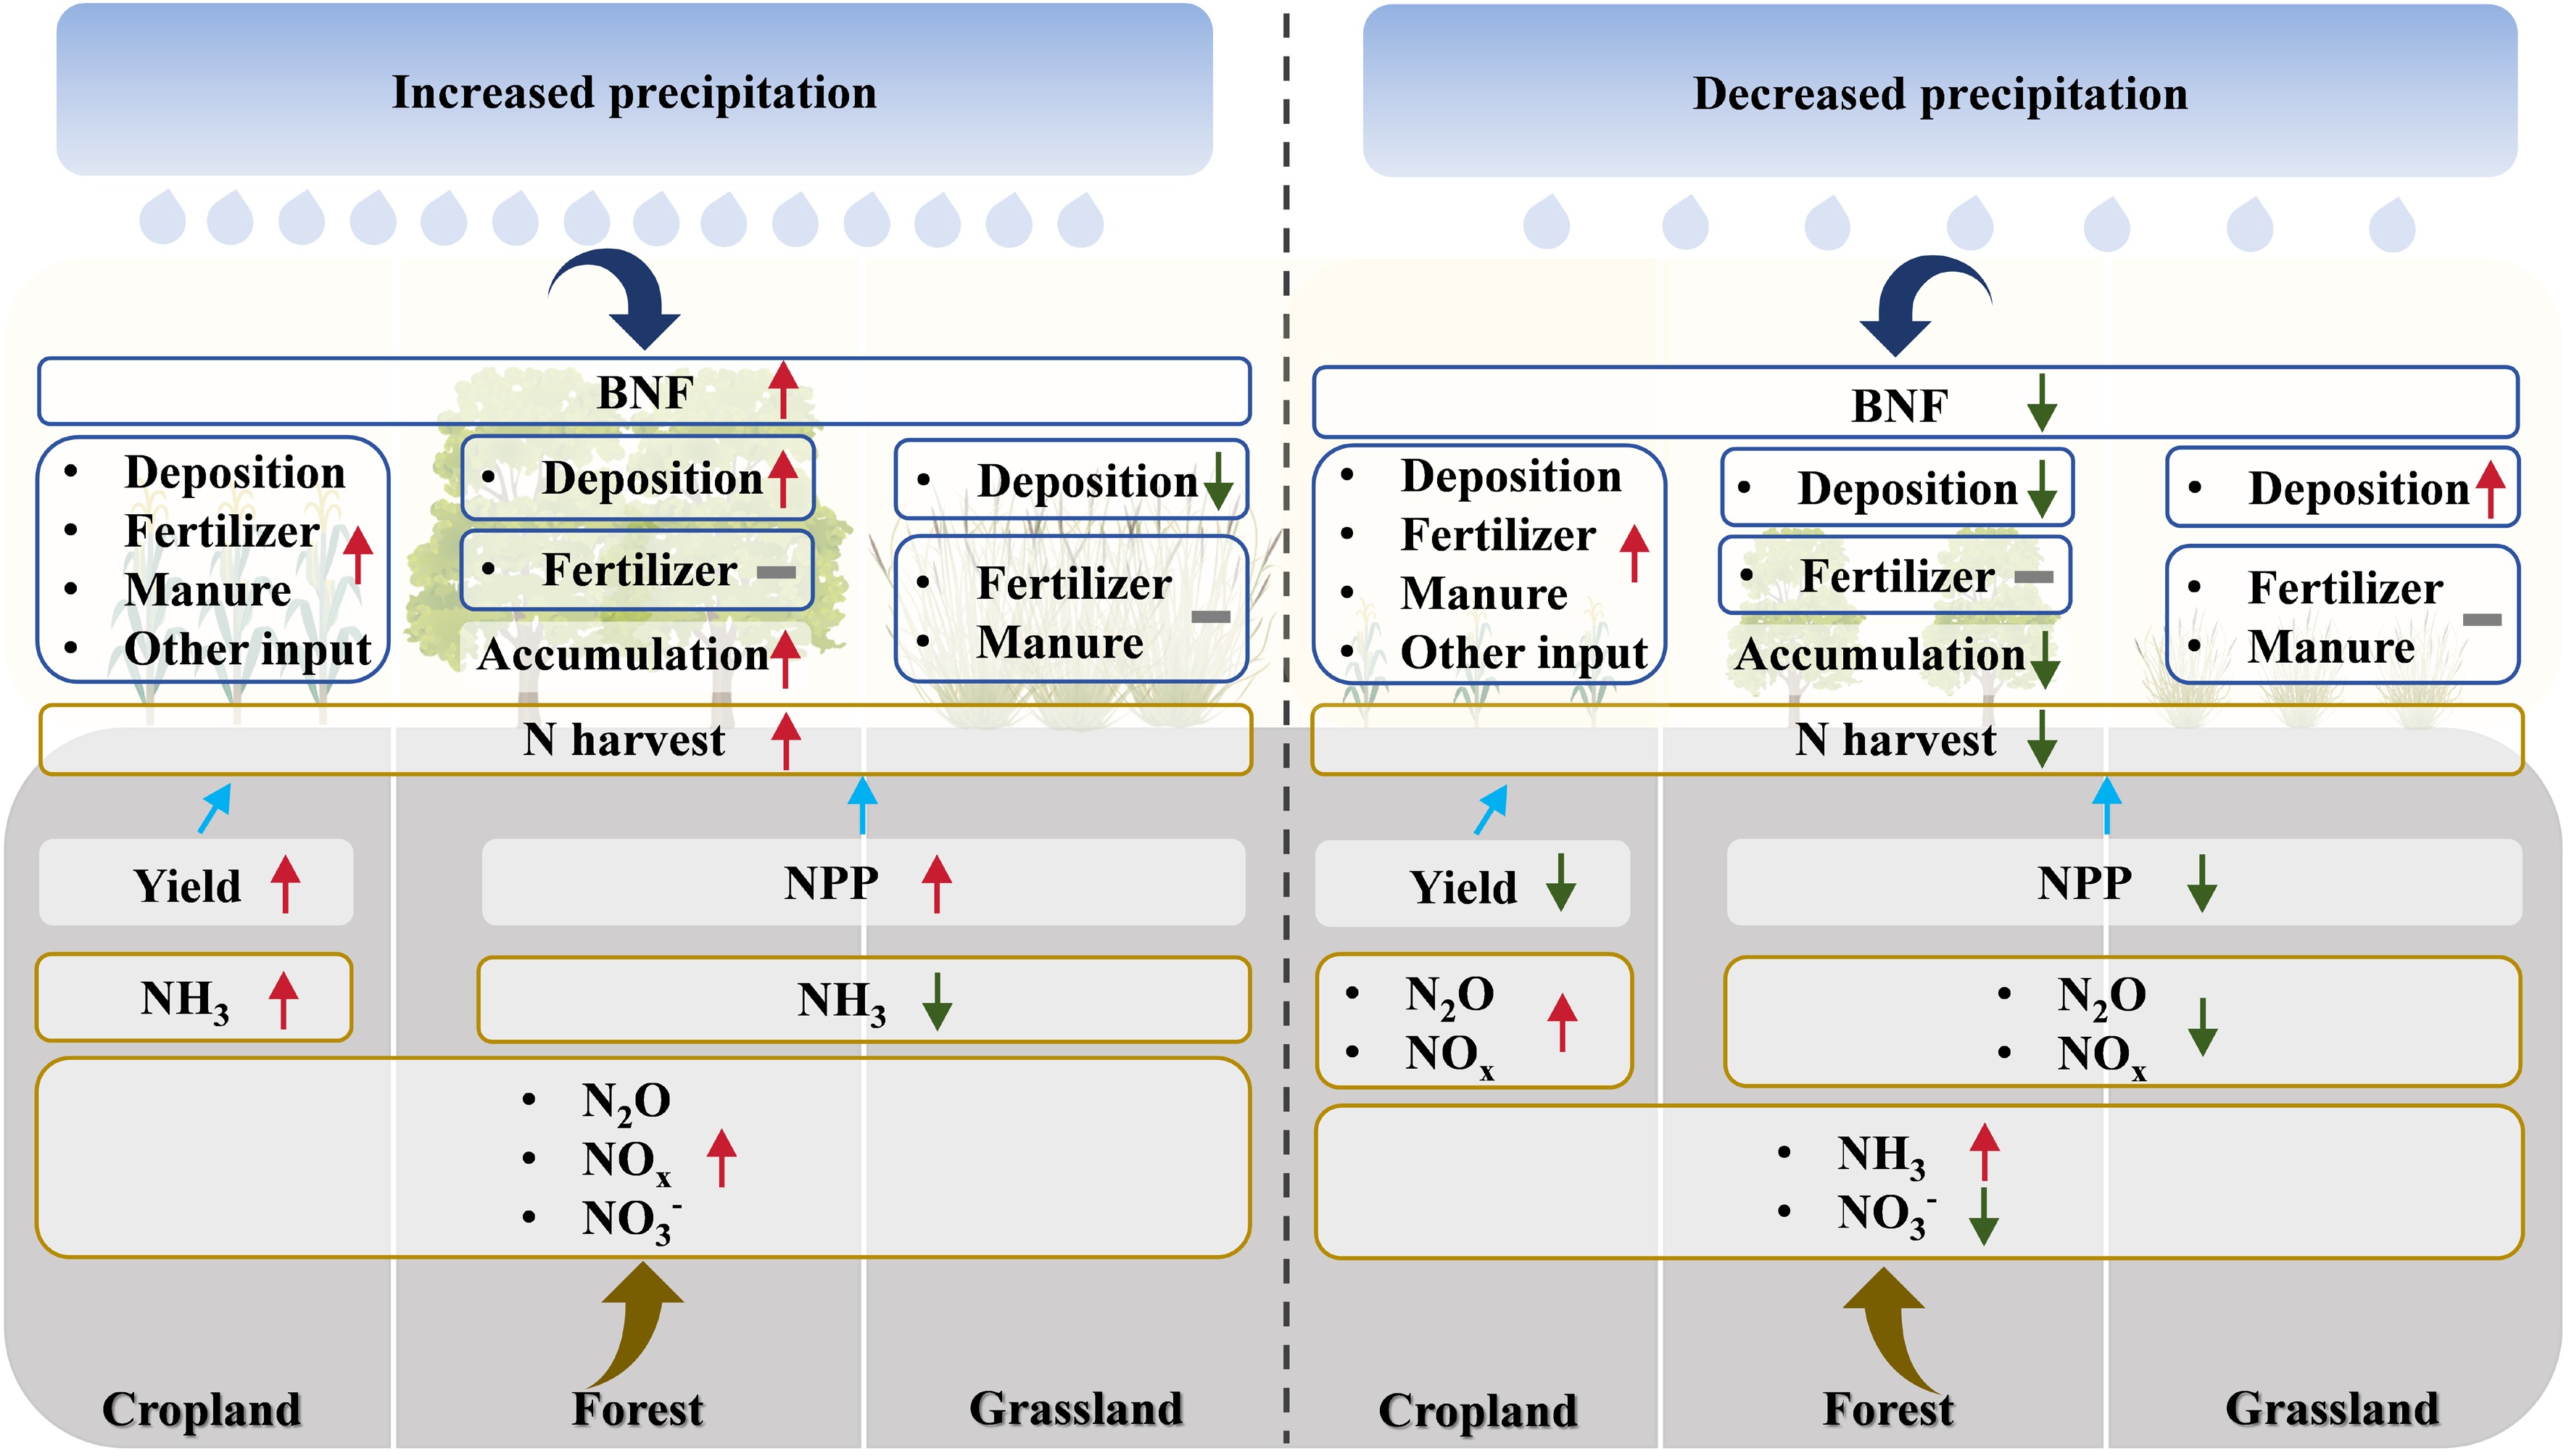
Figure 5.
The impacts of altered precipitation regimes on terrestrial nitrogen cycles. The left box represents the impacts of increased precipitation on the terrestrial nitrogen cycles. The right box represents the impacts of decreased precipitation on the terrestrial nitrogen cycles. The nitrogen fluxes, including nitrogen input and output, are shown by dark blue and yellow arrows and boxes, respectively. Red arrows indicate positive effects, green arrows represent suppressive effects, and light blue arrows indicate their interrelations. The gray solid lines indicate nonsignificant effects. Nitrogen deposition, based on combined ammonia and nitrogen oxides, varies across ecosystems due to differing feedback mechanisms. BNF, biological nitrogen fixation; NPP, net primary productivity; NH3, ammonia; N2O, nitrous oxide; NOx, nitrogen oxides; NO3−, nitrate leaching and runoff; N, nitrogen. Specific ecological processes corresponding to each arrow: Red or green arrow → increased or decreased BNF/deposition/fertilizer/manure/other input → increased or decreased nitrogen input; Gray solid line → unchanged fertilizer/manure → unchanged nitrogen input; Red or green arrow → increased or decreased yield/NPP → increased or decreased nitrogen harvest; Red or green arrow → increased or decreased ammonia/nitrous oxide/nitrogen oxides/nitrate leaching and runoff → increased or decreased nitrogen surplus; Red or green arrow → increased or decreased nitrogen accumulation. The symbols are from the Integration and Application Network (
https://ian.umces.edu/media-library/ ). -
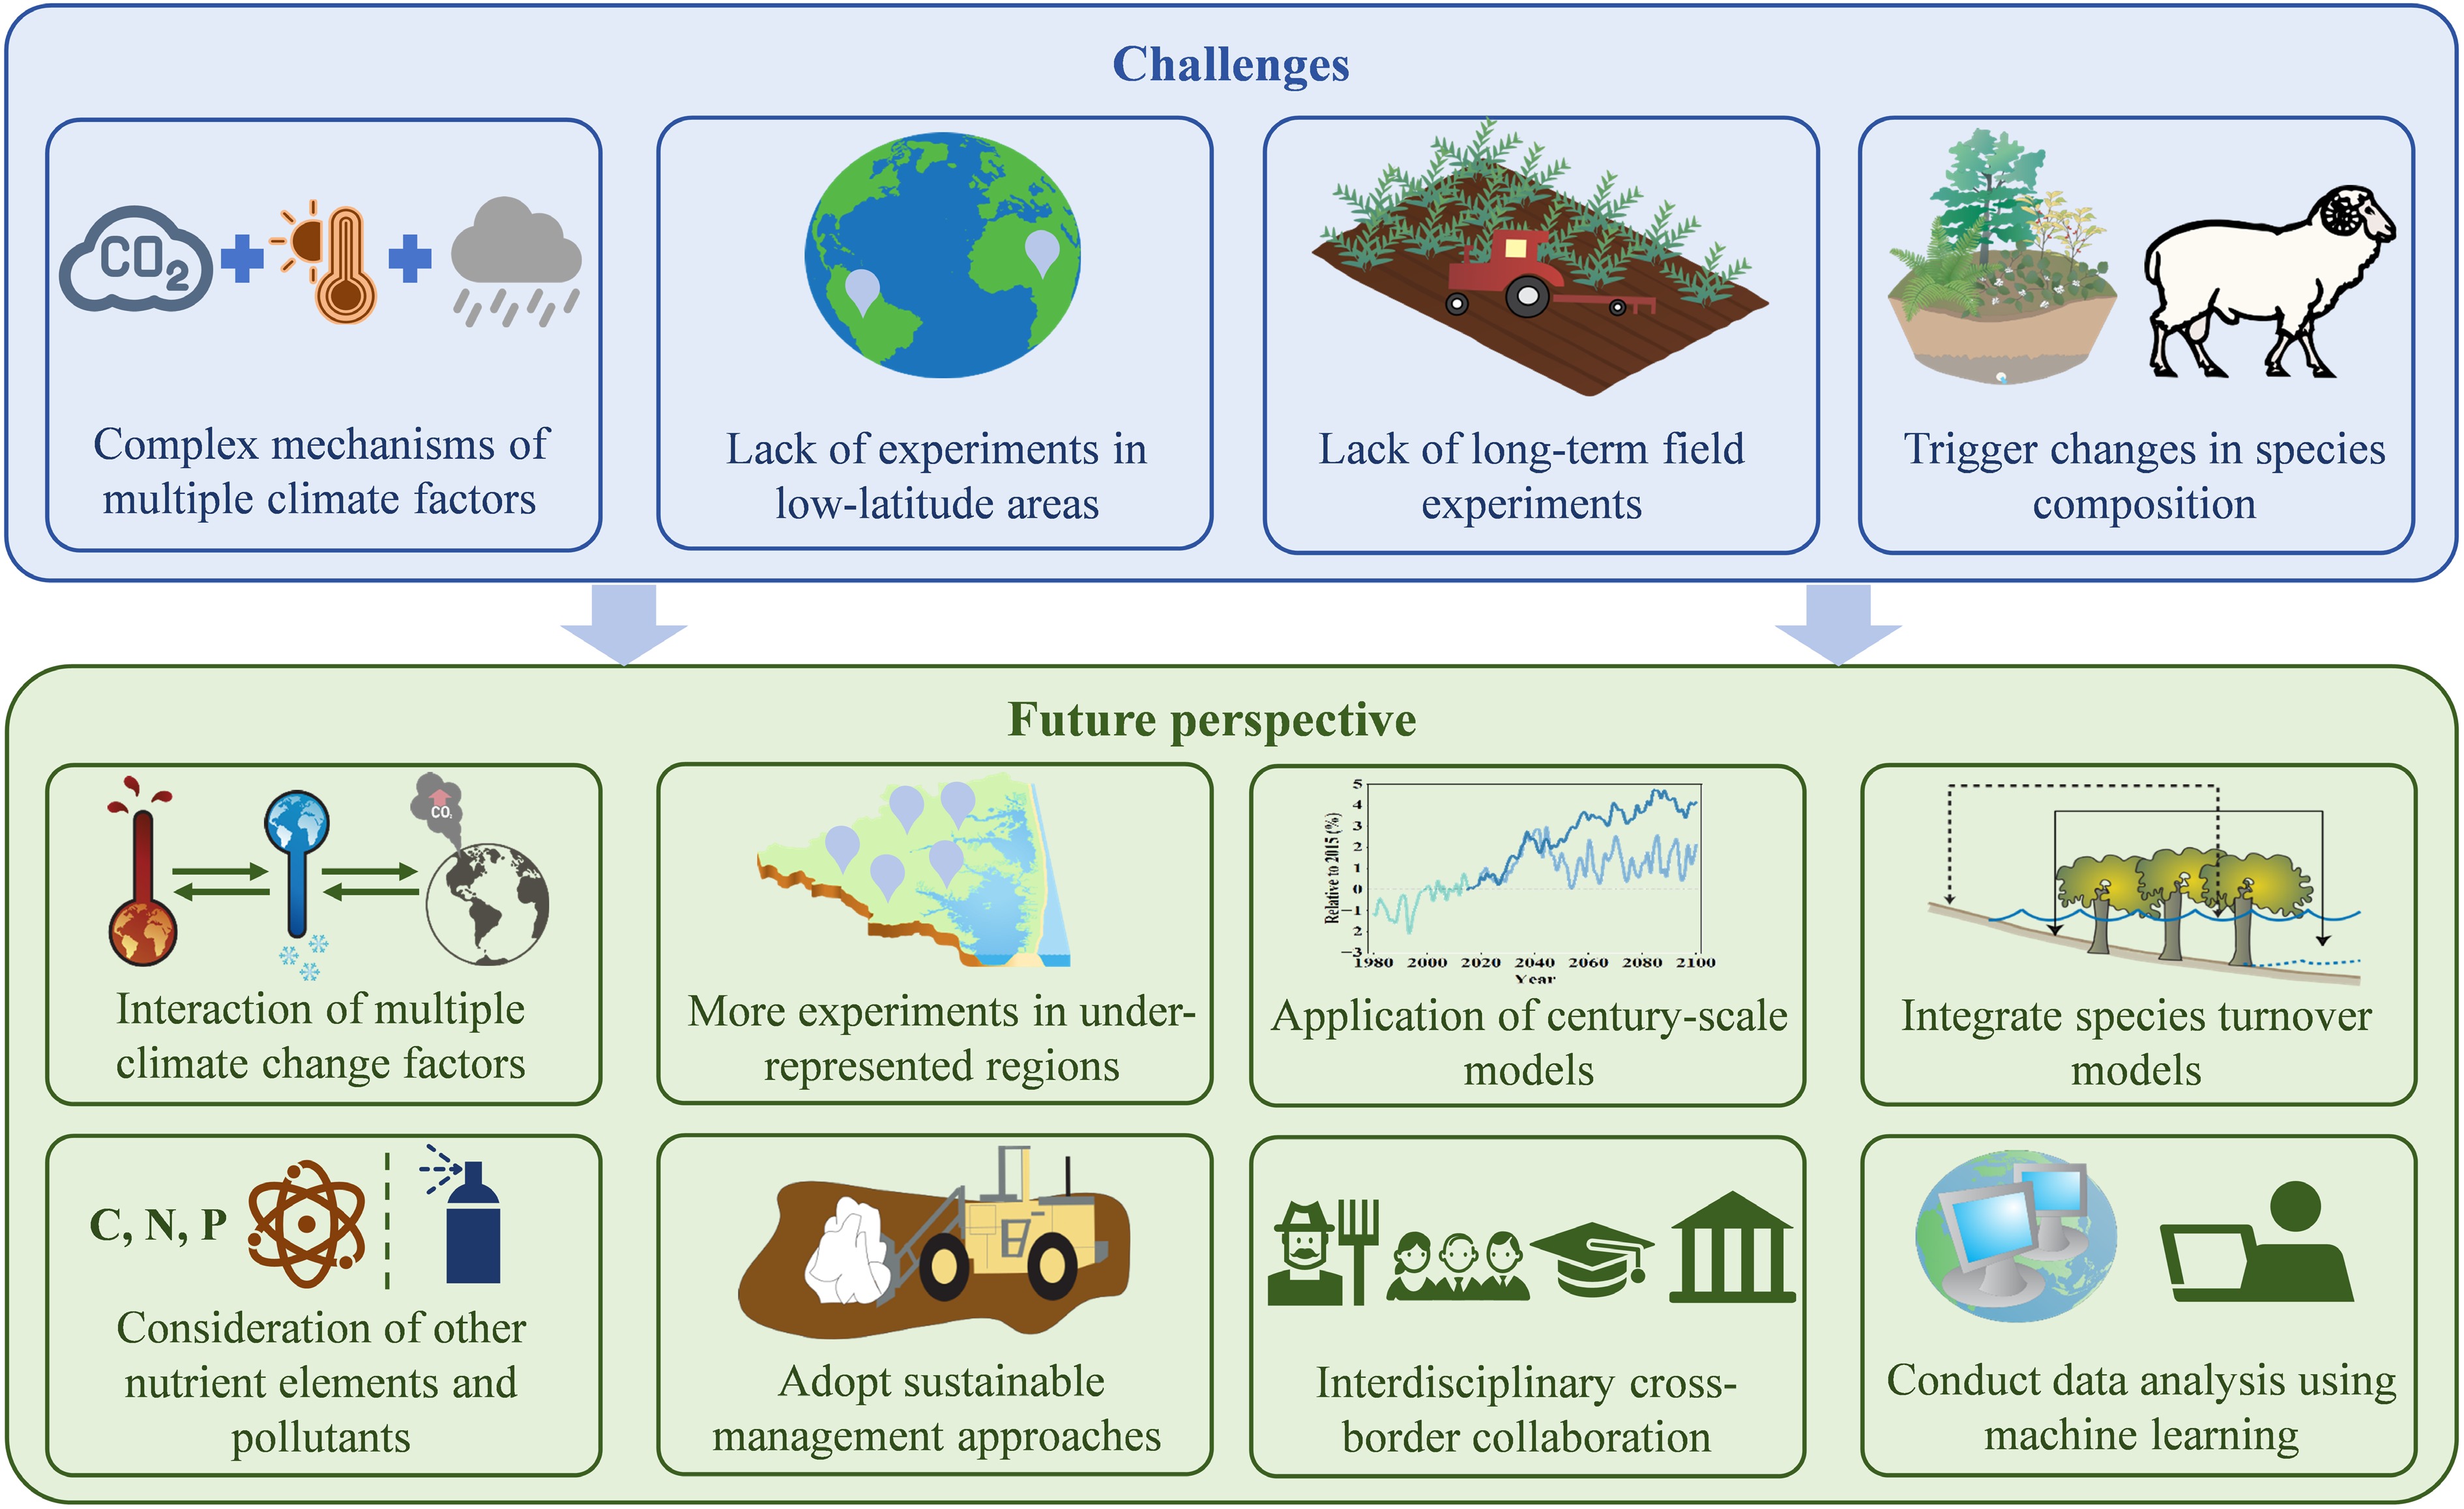
Figure 6.
Challenges and future perspective on terrestrial nitrogen cycles under global climate change. The symbols are from the Integration and Application Network (
https://ian.umces.edu/media-library/ ). -
Variable Description Yield Crop yield is a metric of the quantity of harvested crop production per land area. Net primary productivity NPP includes both aboveground net primary productivity (ANPP) and belowground net primary productivity (BNPP). Ammonia emission NH3 is emitted into the atmosphere from soil or water bodies of terrestrial ecosystems. Nitrous oxide emission N2O emission is released into the atmosphere during nitrification and denitrification. Nitrogen oxide emission NOx emission refers to a collection of N and oxygen compounds including NO, NO2, and N2O3. Nitrate leaching NO3− leaching is the movement of inorganic N from soil, fertilizer, and residues into groundwater or deep soil through rainfall or drip irrigation. Nitrate runoff NO3− runoff refers to the loss of inorganic N to surface water. Nitrogen use efficiency NUE is defined as the N harvest divided by the N input in the terrestrial ecosystems. Biological nitrogen fixation BNF is the conversion of N2 to NH4+ by N-fixing microorganisms, including symbiotic and non-symbiotic ones. Accumulation Accumulation is the process by which N is gradually retained and concentrated in soil, litter, and vegetation, mainly in forests, while N accumulation in croplands and grasslands is assumed stable and therefore not considered here. Denitrification Denitrification is the process by which denitrifying microorganisms convert NO3− to gaseous N (N2O, NO, and N2). Nitrification Nitrification is the process by which nitrifying microorganisms convert NH4+ to NO3− under aerobic conditions. Ammonification Ammonification refers to the conversion of organic N to NH4+ by microorganisms. Assimilation Assimilation is the process by which plants and microorganisms incorporate inorganic N (NH4+, NO3−) into organic compounds for growth and metabolism. Anammox Anammox is the process by which ammonium (NH4+) is oxidized with nitrite (NO2−) under anaerobic conditions to produce N2. Leaf nitrogen content Leaf [N] denotes the N content in the leaf of a plant. Grain nitrogen content Grain [N] denotes the N content in the grain of a plant. Stem nitrogen content Stem [N] denotes the N content in the stem of a plant. Table 1.
Terminologies included in this paper
-
Variable Ecosystem value Component Ecosystem value N input (Tg) Cropland: 253
Grassland: 138
Forest: 91BNF (Tg) Cropland: 40
Grassland: 16
Forest: 66Deposition (Tg) Cropland: 21
Grassland: 15
Forest: 21Fertilizer (Tg) Cropland: 141
Grassland: 27
Forest: 4Manure (Tg) Cropland: 51
Grassland: 80
Forest: /N harvest (Tg) Cropland: 118
Grassland: 95
Forest: 22N surplus (Tg) Cropland: 135
Grassland: 43
Forest: 32NH3 (Tg) Cropland: 29
Grassland: 9
Forest: 2N2O (Tg) Cropland: 5
Grassland: 1
Forest: 3NOx (Tg) Cropland: 2
Grassland: 0.4
Forest: 3NO3− (Tg)
(Including leaching and runoff)Cropland: 54
Grassland: 11
Forest: 11N2 (Tg) Cropland: 45
Grassland: 22
Forest: 13N accumulation (Tg) Forest: 37 NUE (%) Cropland: 47 Grassland: 69 Forest: 65 All nitrogen budgets refer to the year 2020. The cropland data are derived from the Integrated Model to Assess the Global Environment (IMAGE), the grassland data from the Model of Agricultural Production and its Impact on the Environment (MAgPIE), and the forest data from the Dynamic Land Ecosystem Model (DLEM). Table 2.
Nitrogen fluxes in croplands, grasslands, and forests derived from models in 2020
Figures
(6)
Tables
(2)