-
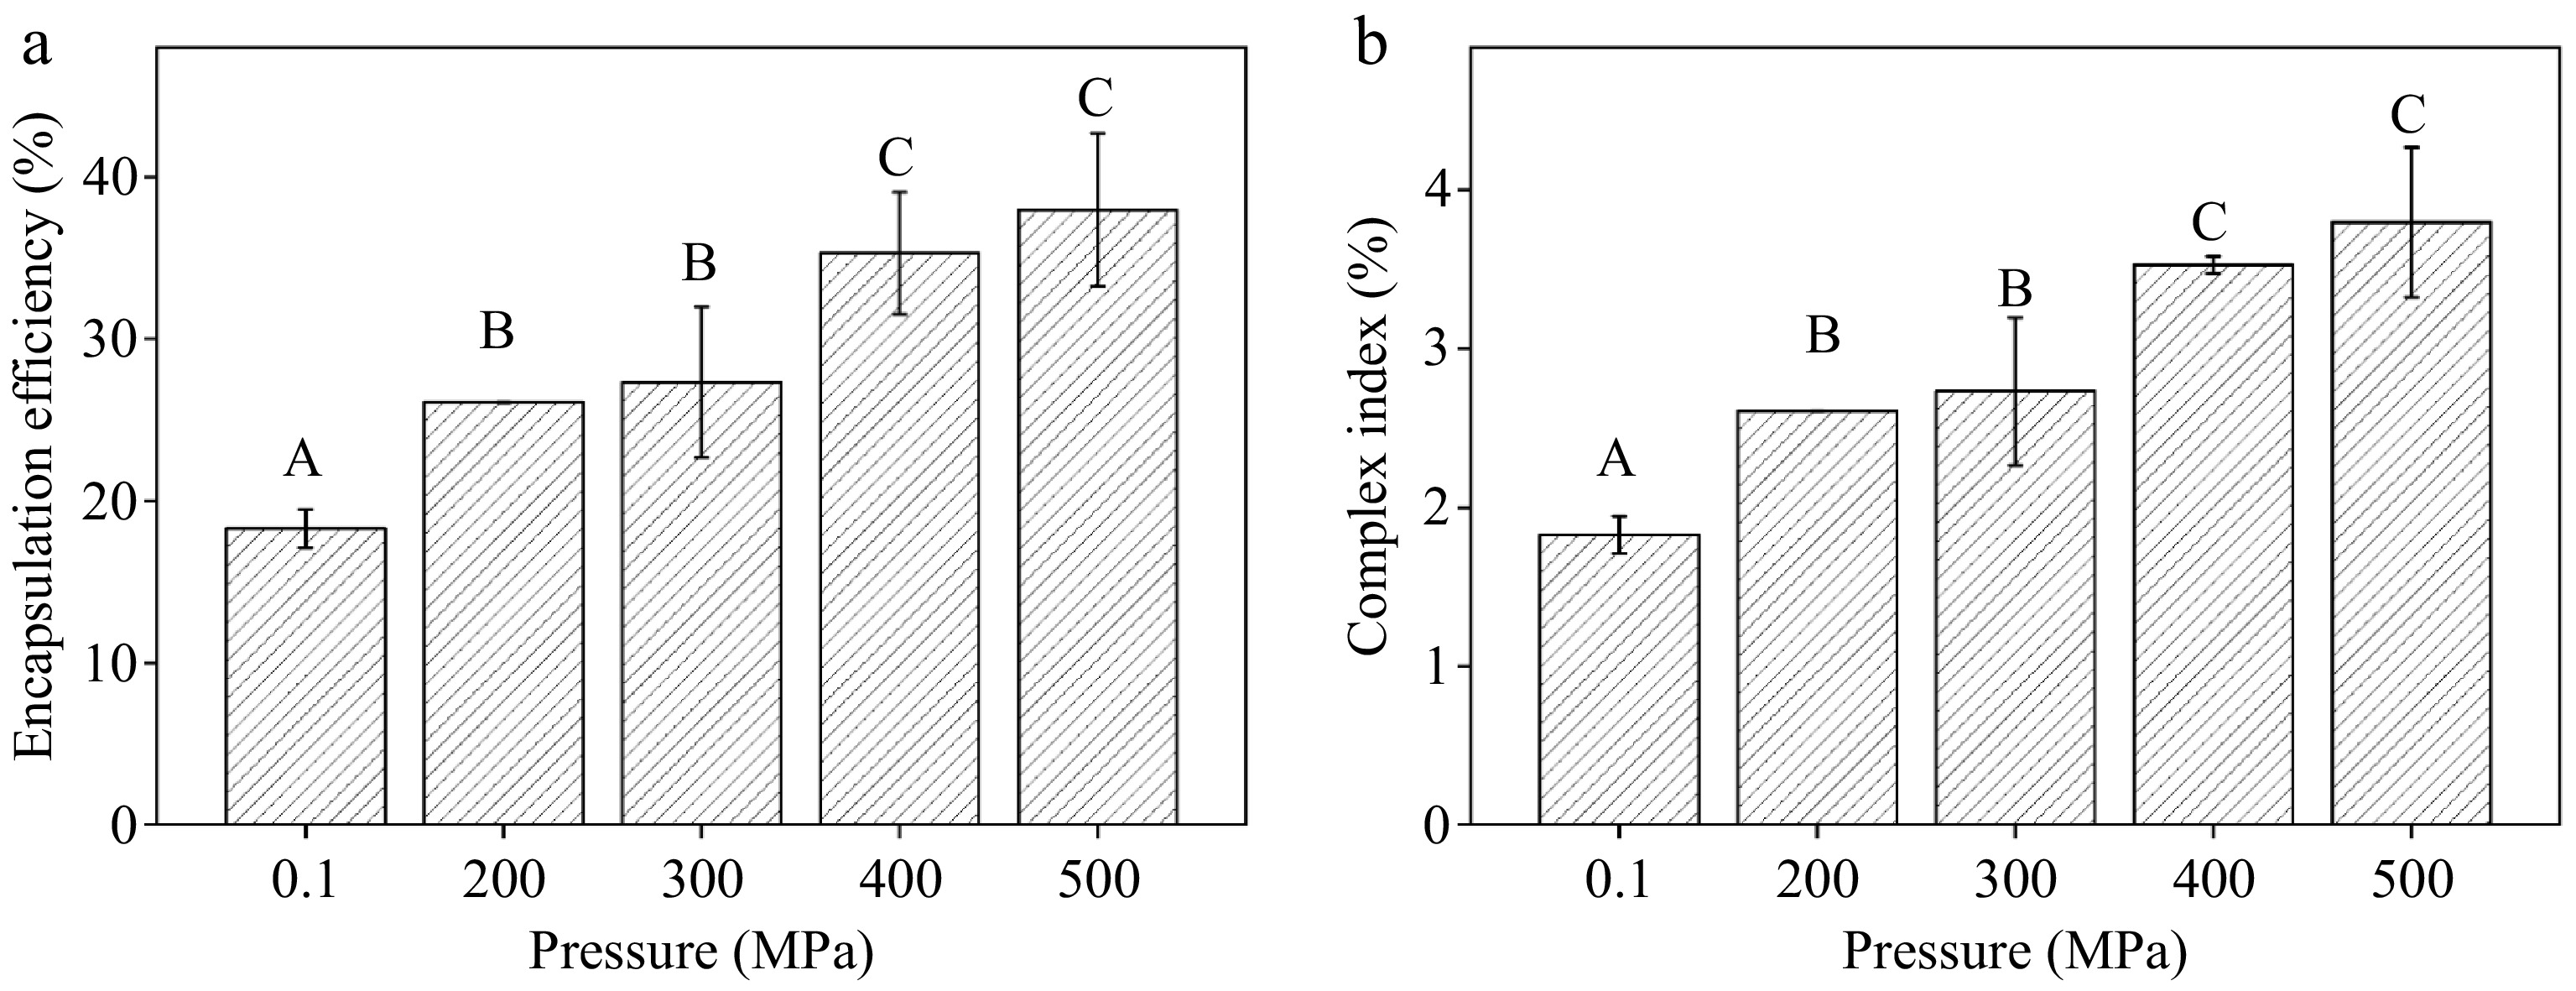
Figure 1.
Effect of different pressures on the (a) encapsulation efficiency, and (b) complex index of the CS-LA complex. Note: uppercase letters indicate significant differences in encapsulation efficiency and binding between corn starch-linoleic acid complexes under different pressure conditions (p < 0.05).
-

Figure 2.
Morphology characterization of natural corn starch (CS), gelatinized CS, and corn starch-linoleic acid complex (SLC) treated for 10 min under 0.1, 200, 300, 400, and 500 MPa. (a) SEM, and (b) fluorescence microscopy. Red arrows indicate FA distribution.
-

Figure 3.
Structural changes of corn starch (CS), and corn starch-linoleic acid complex (SLC) treated with different pressures at 30 °C for 10 min. (a), (b) FT-IR, (c), (d) Raman spectra, and (e), (f) XRD patterns.
-
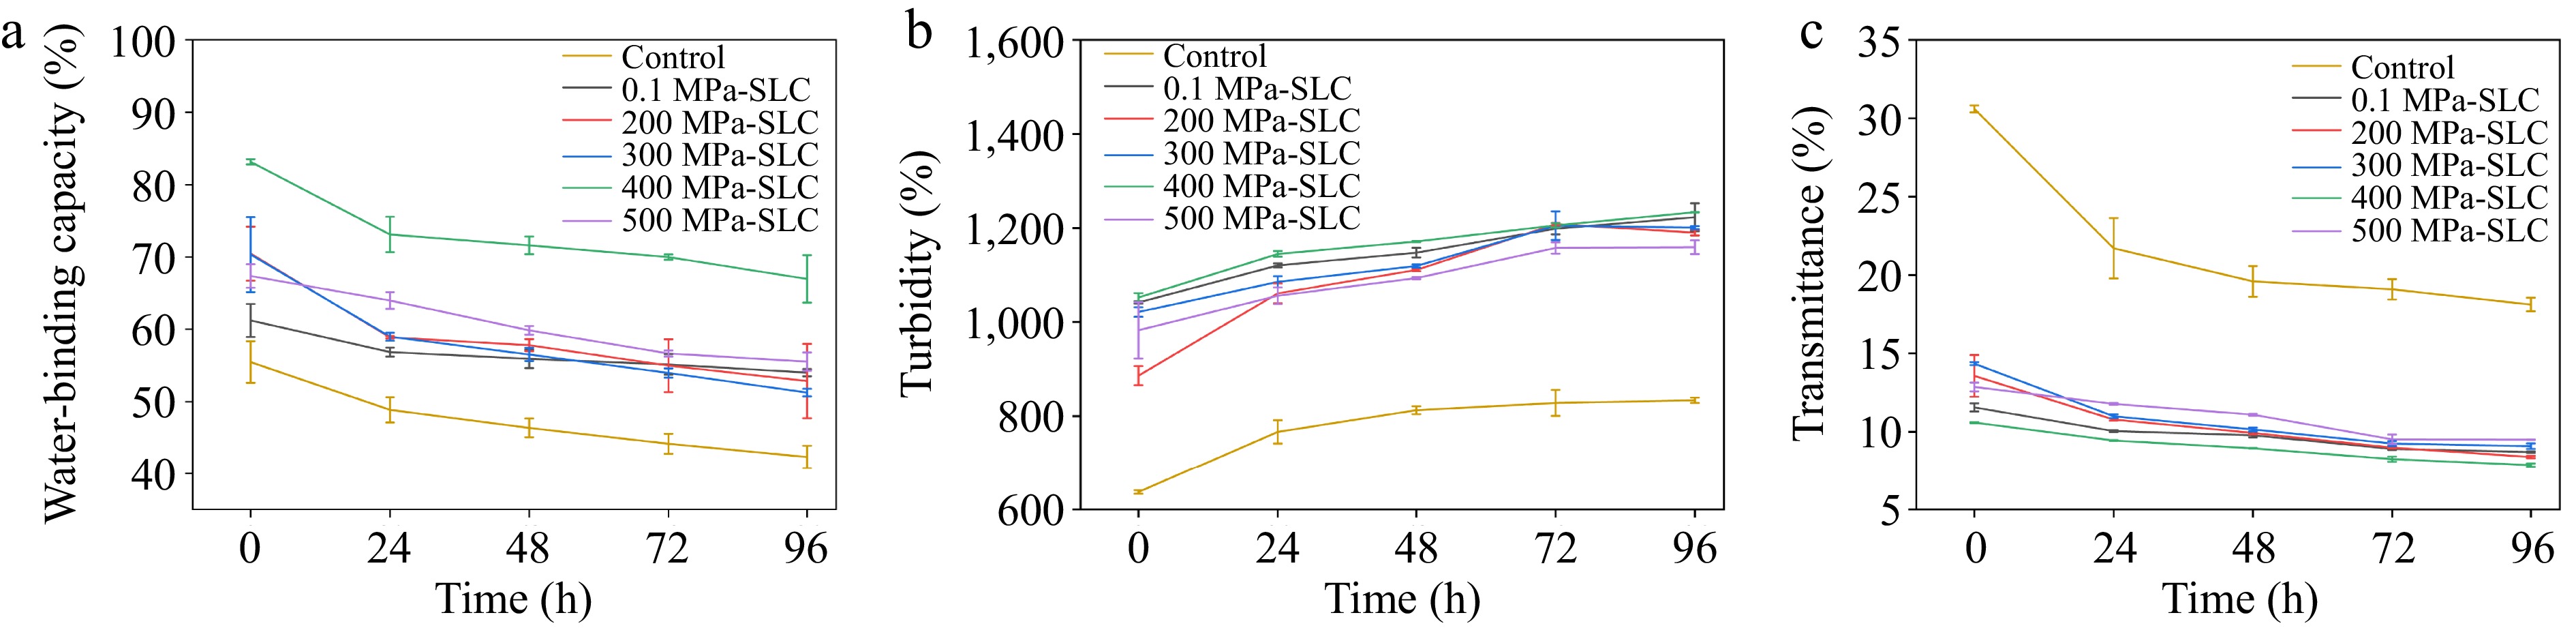
Figure 4.
(a) Freeze-thaw stability, (b) transmittance, and (c) turbidity of corn starch-linoleic acid complex treated under different pressures for 10 min.
-
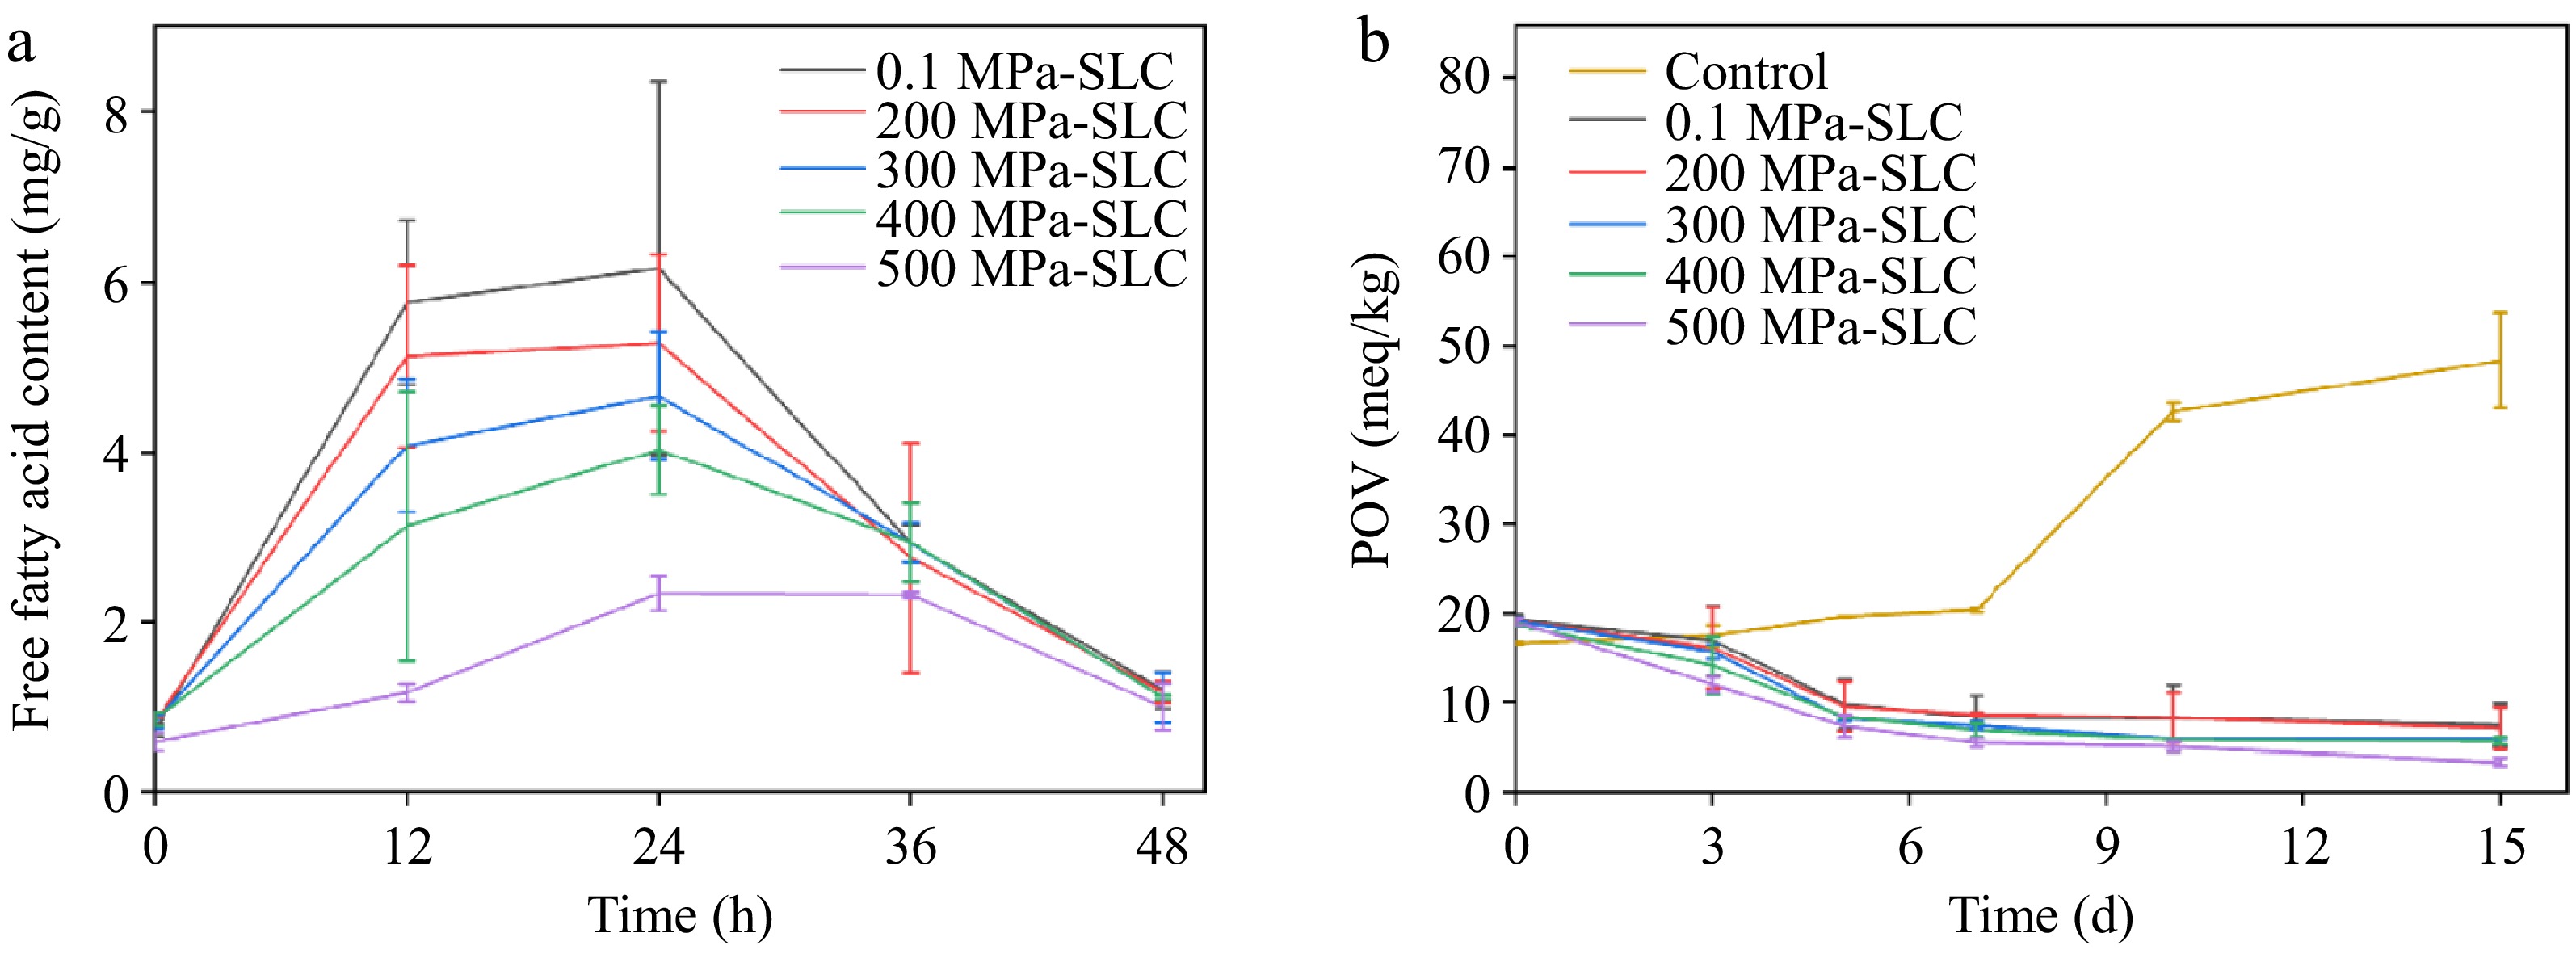
Figure 5.
(a) Free fatty acid content of CS-LA complex treated with different pressures during drying. (b) POV of CS-LA complex treated with different pressures for 10 min and LA during storage at 65 °C.
-
Sample Chemical shift of 13C NMR (ppm) Peak area Relative
crystallinity (%)C1 C2/ C3/ C5 C4 C6 Total Diffraction Natural corn starch − − − − 106793.82 39574.44 37.06 Pure corn starch 103.12 72.29 81.17 61.21 − − − 0.1 MPa-SLC 102.92 72.35 81.70 60.71 183290.33 47882.69 26.12 200 MPa-SLC 102.92 72.35 81.73 60.62 108689.70 30566.98 28.12 300 MPa-SLC 102.92 72.41 81.92 60.62 154480.18 44752.87 28.97 400 MPa-SLC 102.92 72.47 81.92 60.62 150872.57 46488.66 30.81 500 MPa-SLC 102.92 72.41 81.67 60.62 152855.50 46956.81 30.72 Table 1.
Parameters of structural properties and 13C NMR results of corn starch and corn starch-linoleic acid complex treated with different pressures at 30 °C for 10 min.
-
Sample T0 ( °C) Tp ( °C) Tc ( °C) ΔH (J/g) 0.1 MPa-starch 99.27 ± 0.47BC 107.86 ± 0.54BC 116.97 ± 0.30C 11.02 ± 1.19A 200 MPa-starch 99.54 ± 0.42BC 107.08 ± 1.96BC 118.29 ± 1.01BC 8.60 ± 0.53BC 300 MPa-starch 99.96 ± 0.54BC 107.92 ± 0.94BC 118.20 ± 0.74BC 8.09 ± 0.21C 400 MPa-starch 99.10 ± 0.51C 107.92 ± 0.94BC 119.66 ± 0.16AB 8.77 ± 0.73BC 500 MPa-starch 99.49 ± 2.14BC 106.36 ± 0.49BC 117.54 ± 0.42C 8.54 ± 0.34BC 0.1 MPa-SLC 101.04 ± 0.66BC 105.61 ± 1.95C 118.27 ± 1.02BC 8.87 ± 0.72BC 200 MPa-SLC 99.21 ± 0.82BC 106.24 ± 1.01BC 119.58 ± 1.17AB 9.05 ± 0.73BC 300 MPa-SLC 101.71 ± 1.31B 112.27 ± 0.13A 117.29 ± 1.51C 10.32 ± 0.36AB 400 MPa-SLC 104.82 ± 1.62A 112.65 ± 2.54A 120.80 ± 0.60A 11.49 ± 1.84A 500 MPa-SLC 100.15 ± 0.92BC 109.67 ± 1.44AB 118.81 ± 0.76BC 8.01 ± 0.63C Uppercase letters indicate significant differences (p < 0.05) in T0, Tp, Tc, and ΔH of pure starch, corn starch-linoleic acid complexes. Table 2.
DSC results of pure starch and corn starch-linoleic acid complex treated with different pressures for 10 min.
Figures
(5)
Tables
(2)