-
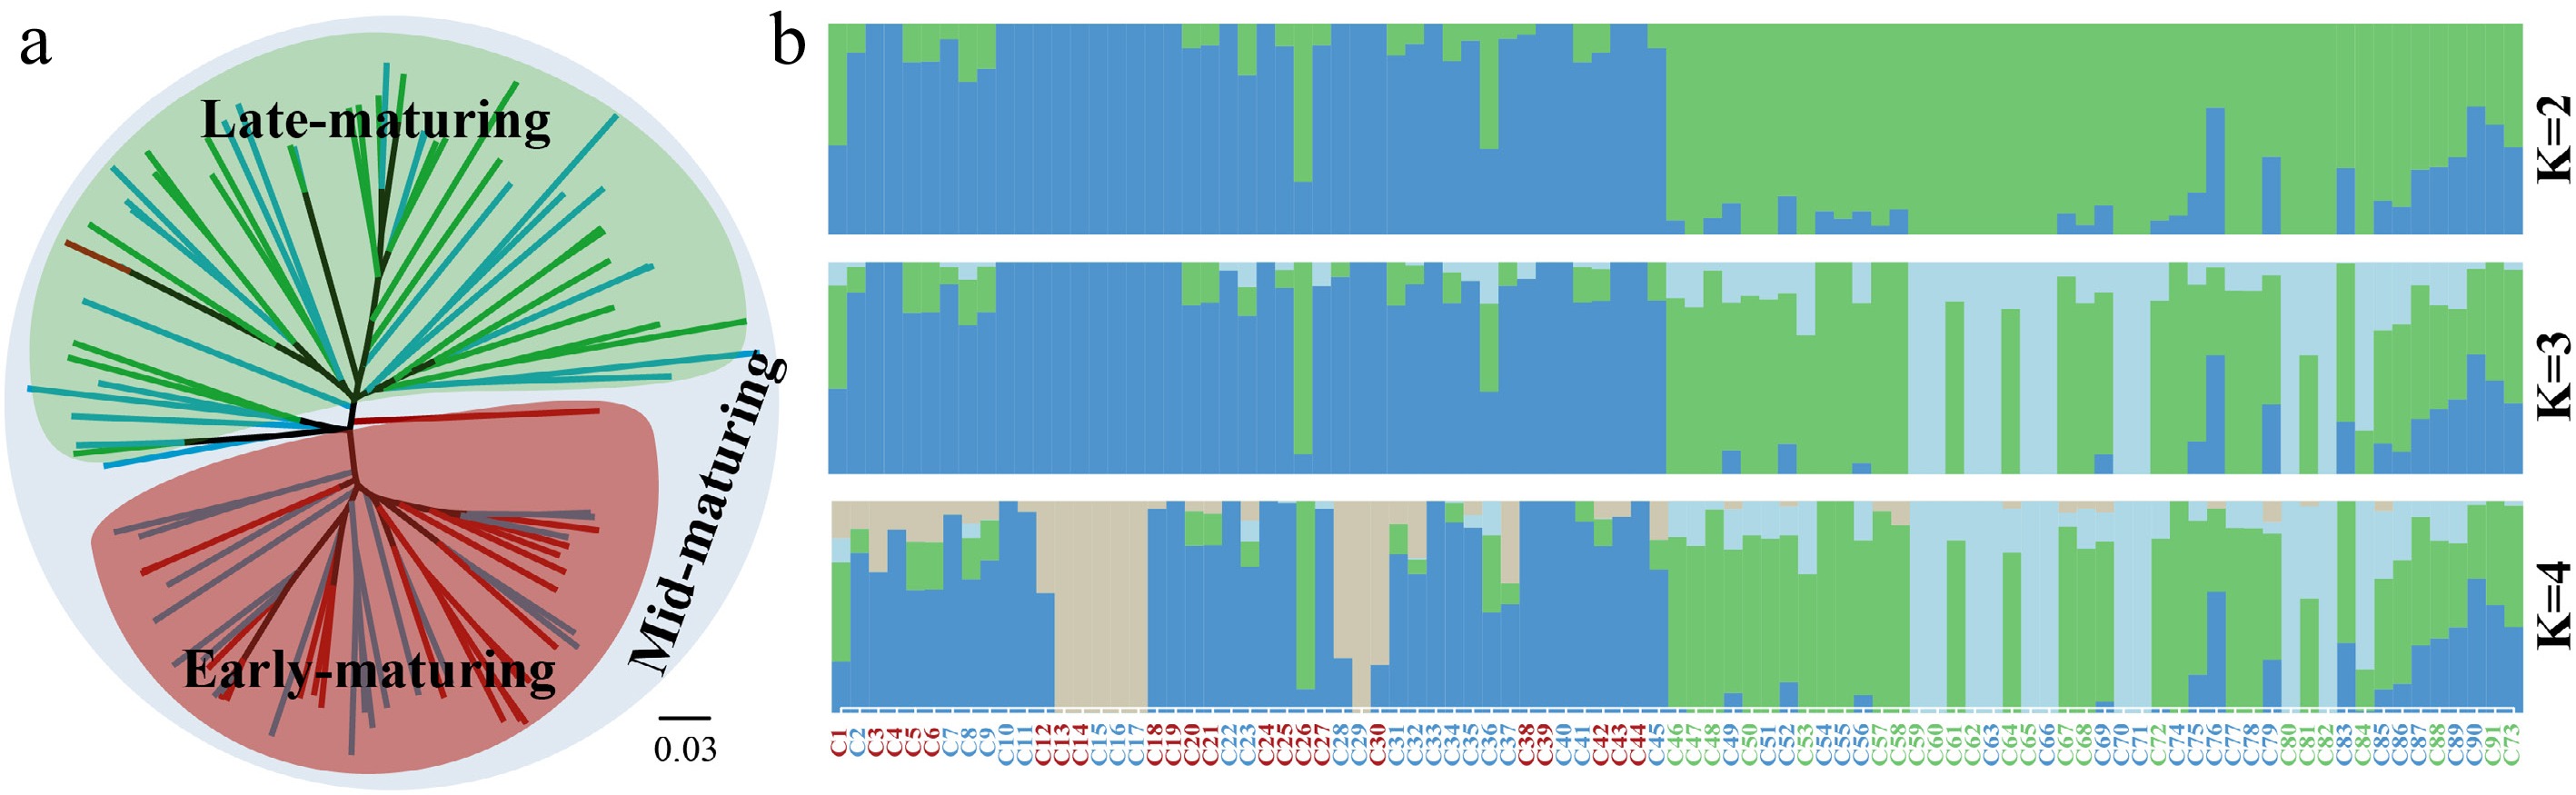
Figure 1.
Phylogenetic and genetic structure analyses of cabbage varieties with different maturation times. (a) A neighbour-joining phylogenetic tree constructed using whole-genome SNPs data. The red lines represent early-maturing of cabbages; green lines represent late-maturing of cabbages; blue lines represent mid-maturing of cabbages. The clades clustered by each maturity resource were identified with corresponding colors. (b) Genetic structure plots with K = 2–4. The y axis quantifies the proportion of the individual's genome from inferred ancestral populations, and x axis shows the different individuals. The color of the sample code represents the same meaning as in (a).
-
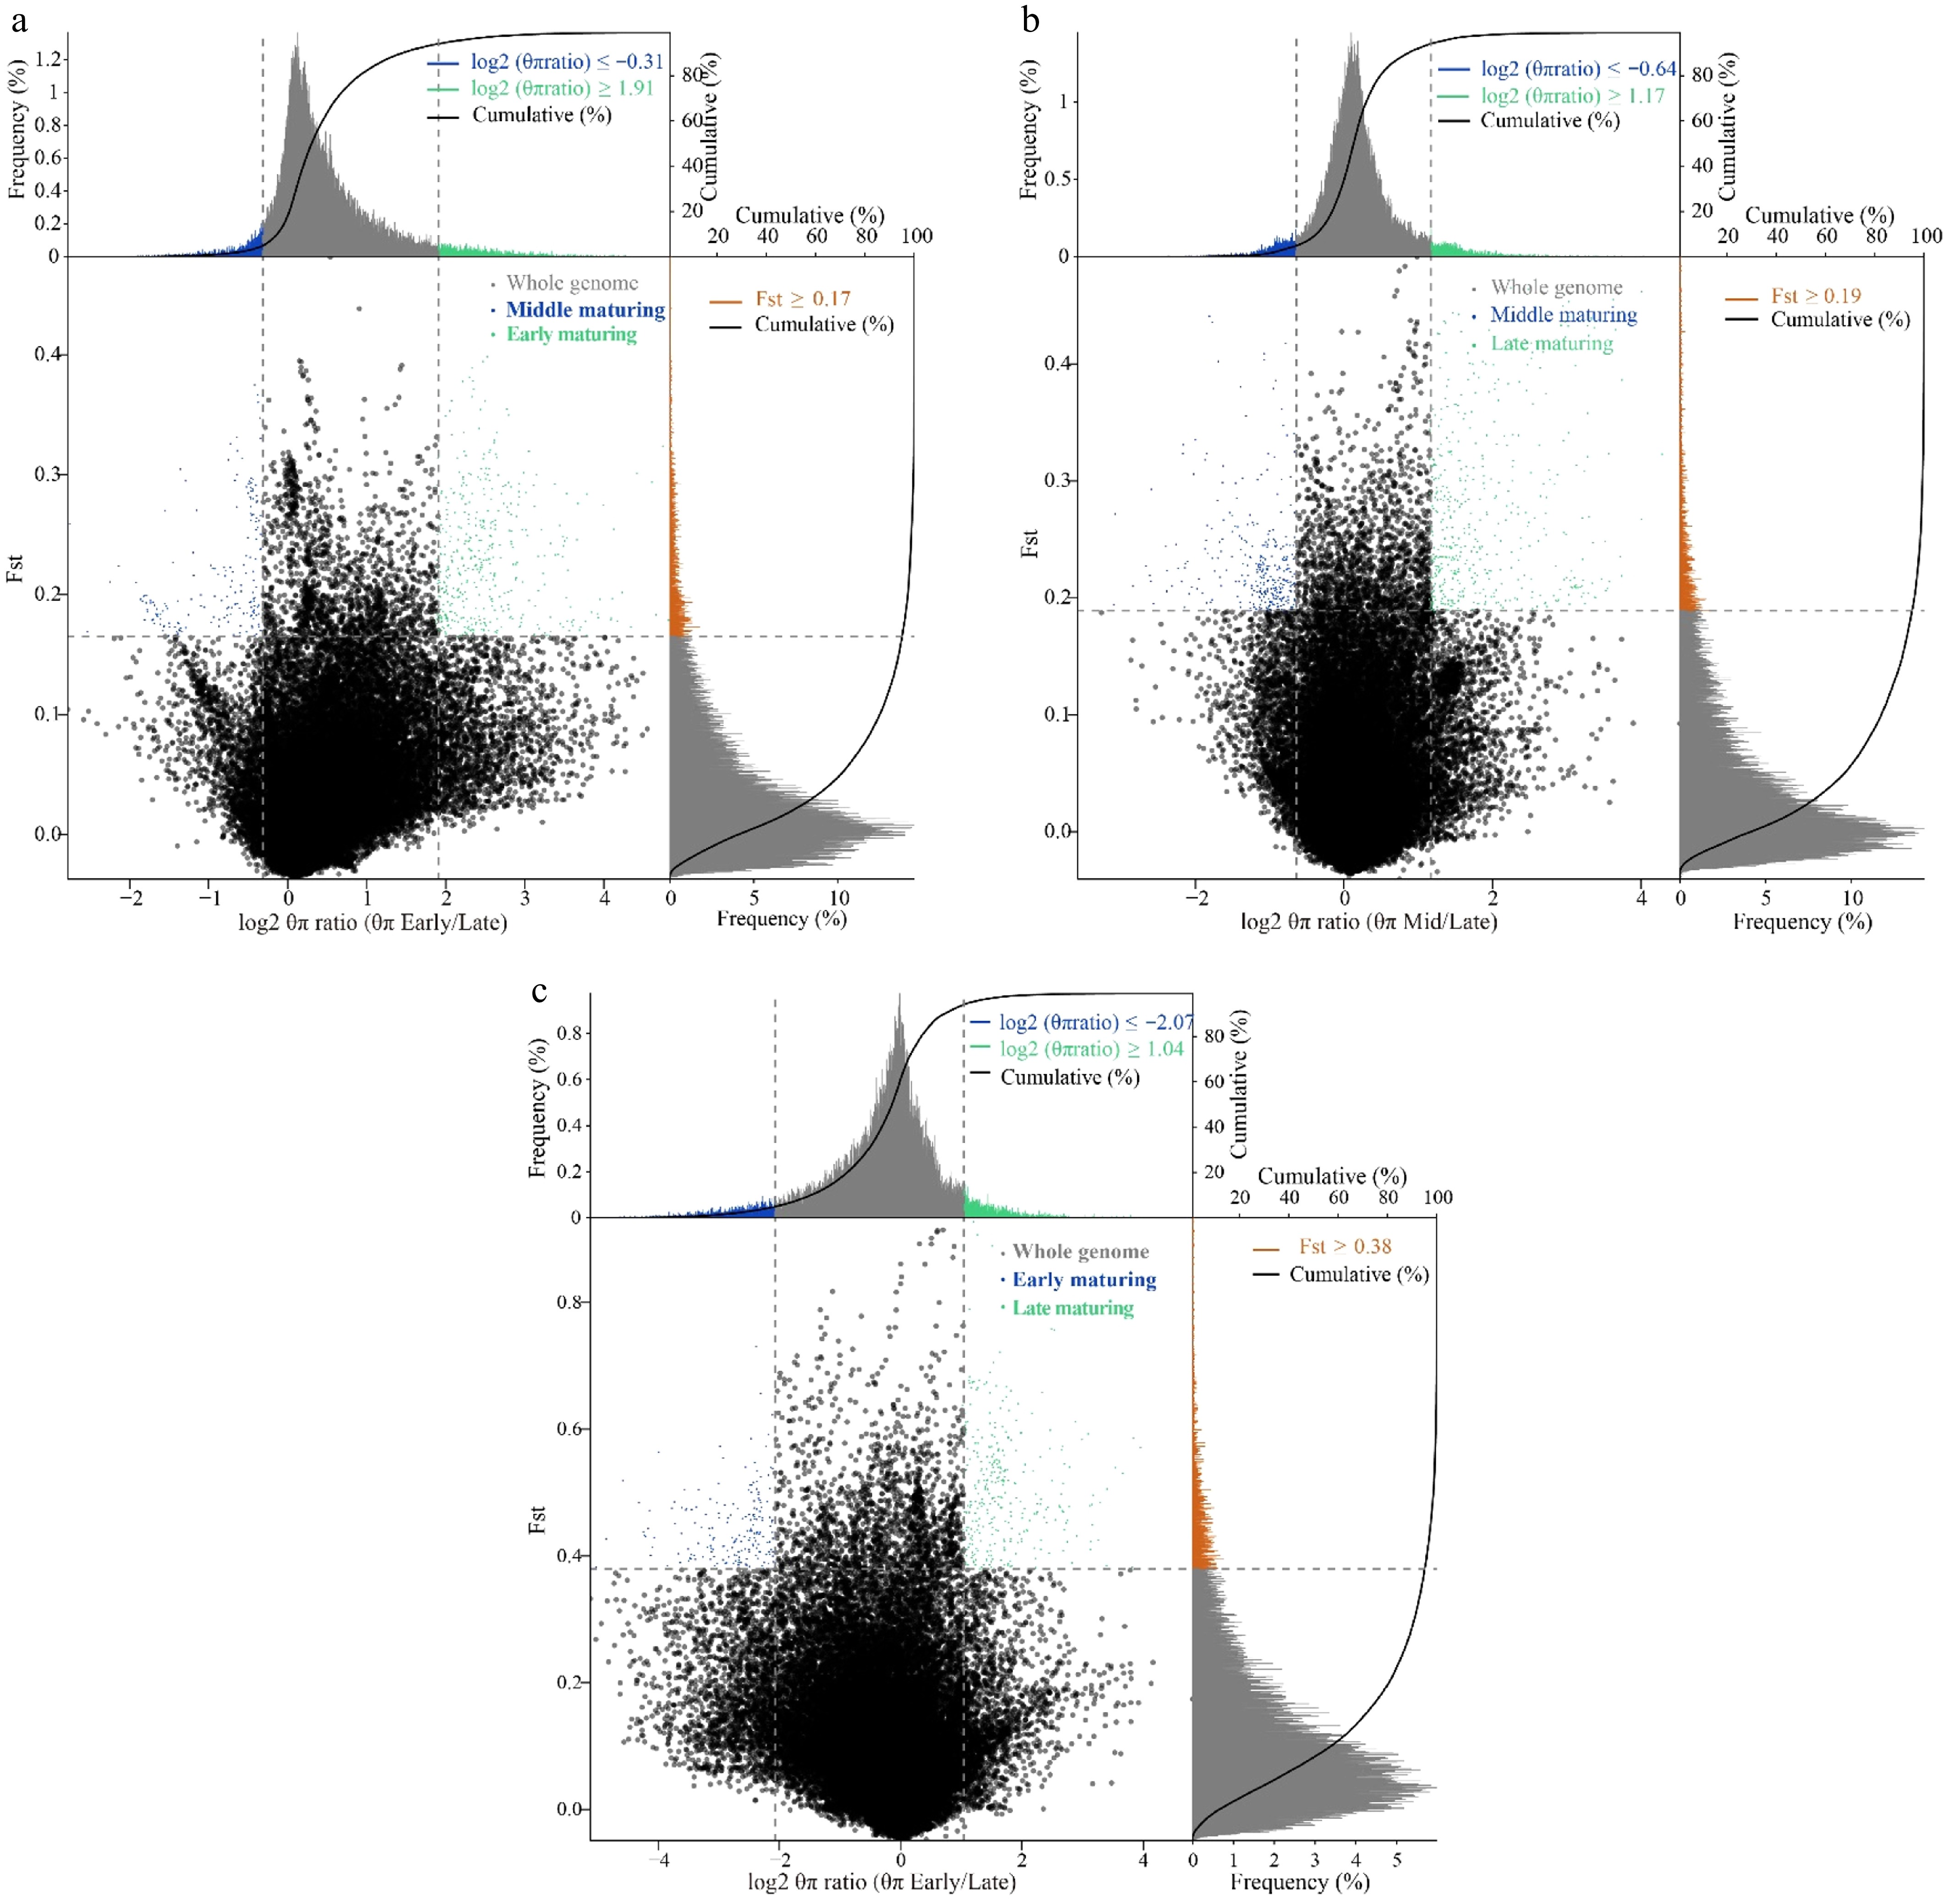
Figure 2.
Genomic regions with selection sweep signals in different mature cabbages. (a) Distribution of ln ratio (θπ, early/middle) and FST. Green dots represent windows fulfilling the selected regions requirement in early-maturing cabbages; blue dots represent selected regions in mid-maturing. (b) Distribution of ln ratio (θπ, middle/late) and FST. Blue dots represent selected regions in mid-maturing; green dots represent selected regions in late-maturing. (c) Distribution of ln ratio (θπ, early/late) and FST. Blue dots represent selected regions in early-maturing; green dots represent selected regions in late-maturing.
-
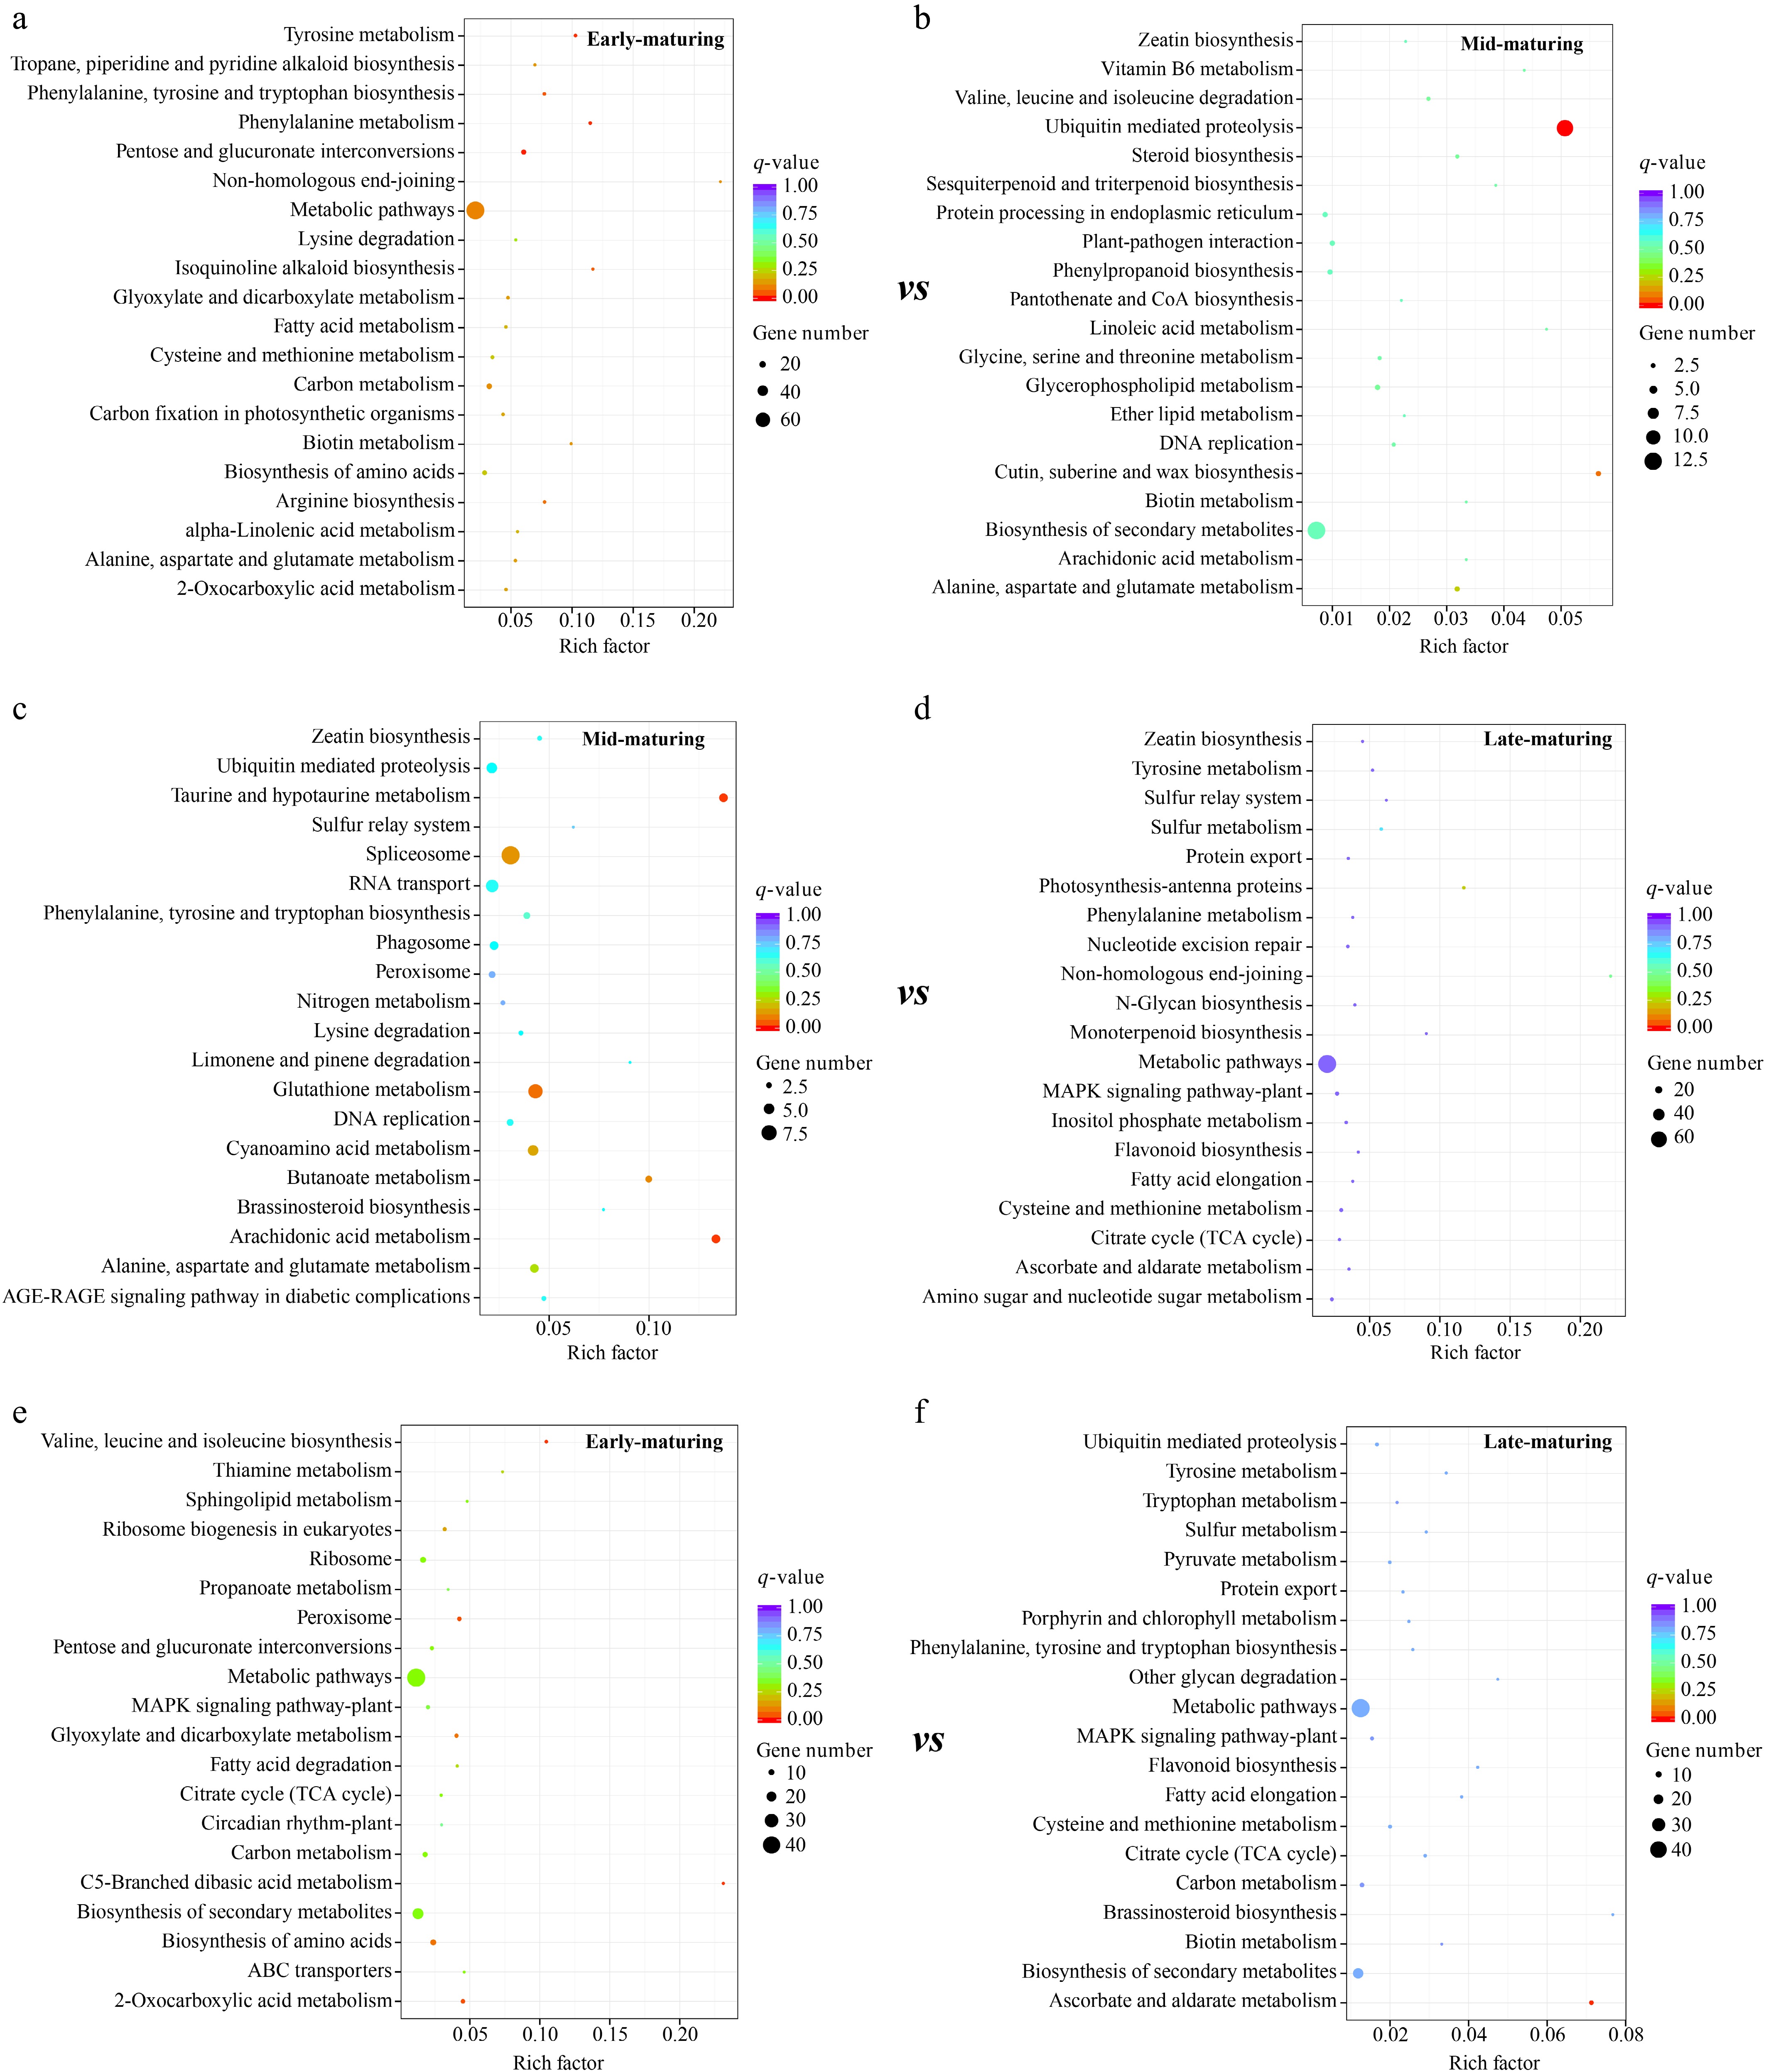
Figure 3.
KEGG pathway enrichment of the candidate genes in different mature cabbages. Enrichment result of candidate genes located in the (a) early-maturing and (b) mid-maturing resources respectively in early-maturing vs mid-maturing analysis; (c) mid-maturing and (d) late-maturing resources respectively in mid-maturing vs late-maturing analysis; (e) early-maturing and (f) late-maturing resources respectively in early-maturing vs late-maturing analysis.
-
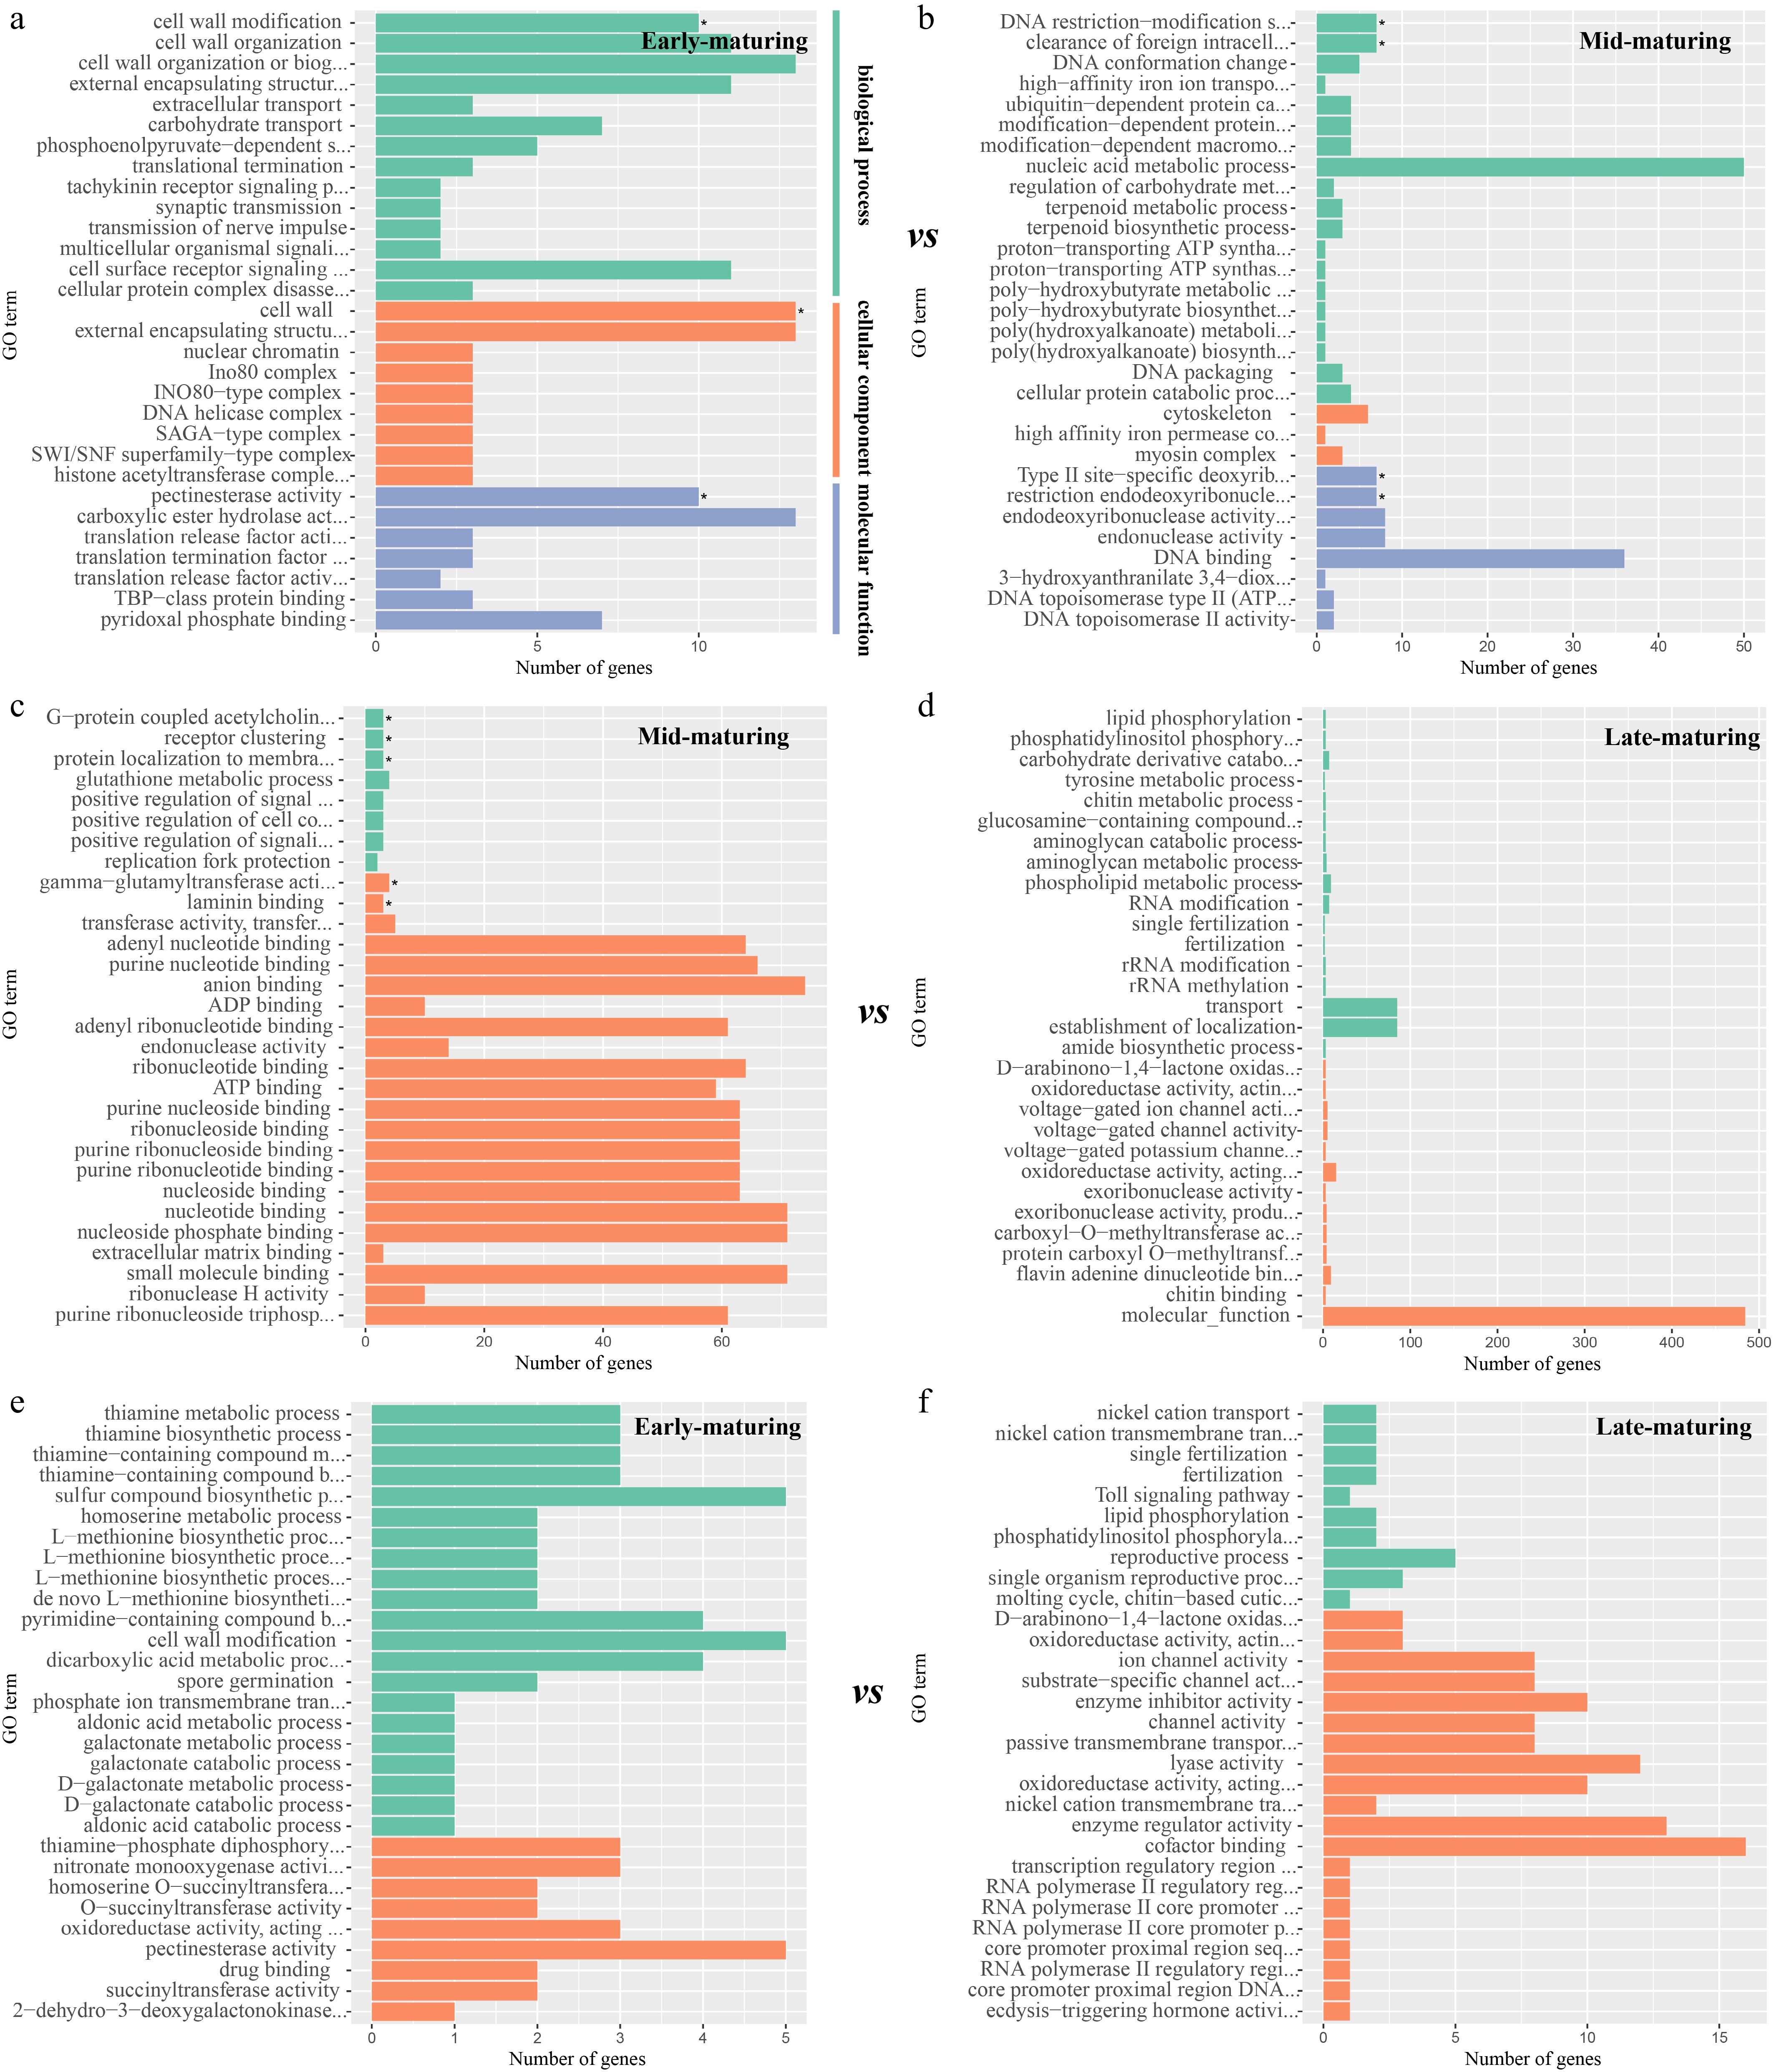
Figure 4.
GO annotation of the candidate genes in different mature cabbages. Annotation result of candidate genes located in the (a) early-maturing, and (b) mid-maturing resources respectively in early-maturing vs mid-maturing analysis. Result of candidate genes located in the (c) mid-maturing, and (d) late-maturing resources respectively in mid-maturing vs late-maturing analysis. Result of candidate genes located in the (e) early-maturing, and (f) late-maturing resources respectively in early-maturing vs late-maturing analysis.
-
Maturation With selection sweep signals Analysis among cabbages with different maturation times Early vs Mid Mid vs Late Early vs Late Early-maturing Regions 433 − 181 Candidate genes 818 − 456 Mid-maturing Regions 182 312 − Candidate genes 271 557 − Late-maturing Regions − 491 316 Candidate genes − 802 470 Table 1.
The numbers of regions and candidate genes with selection sweep signals in the comparative analysis of selective-sweep of cabbage varieties with different maturation times.
Figures
(4)
Tables
(1)