-
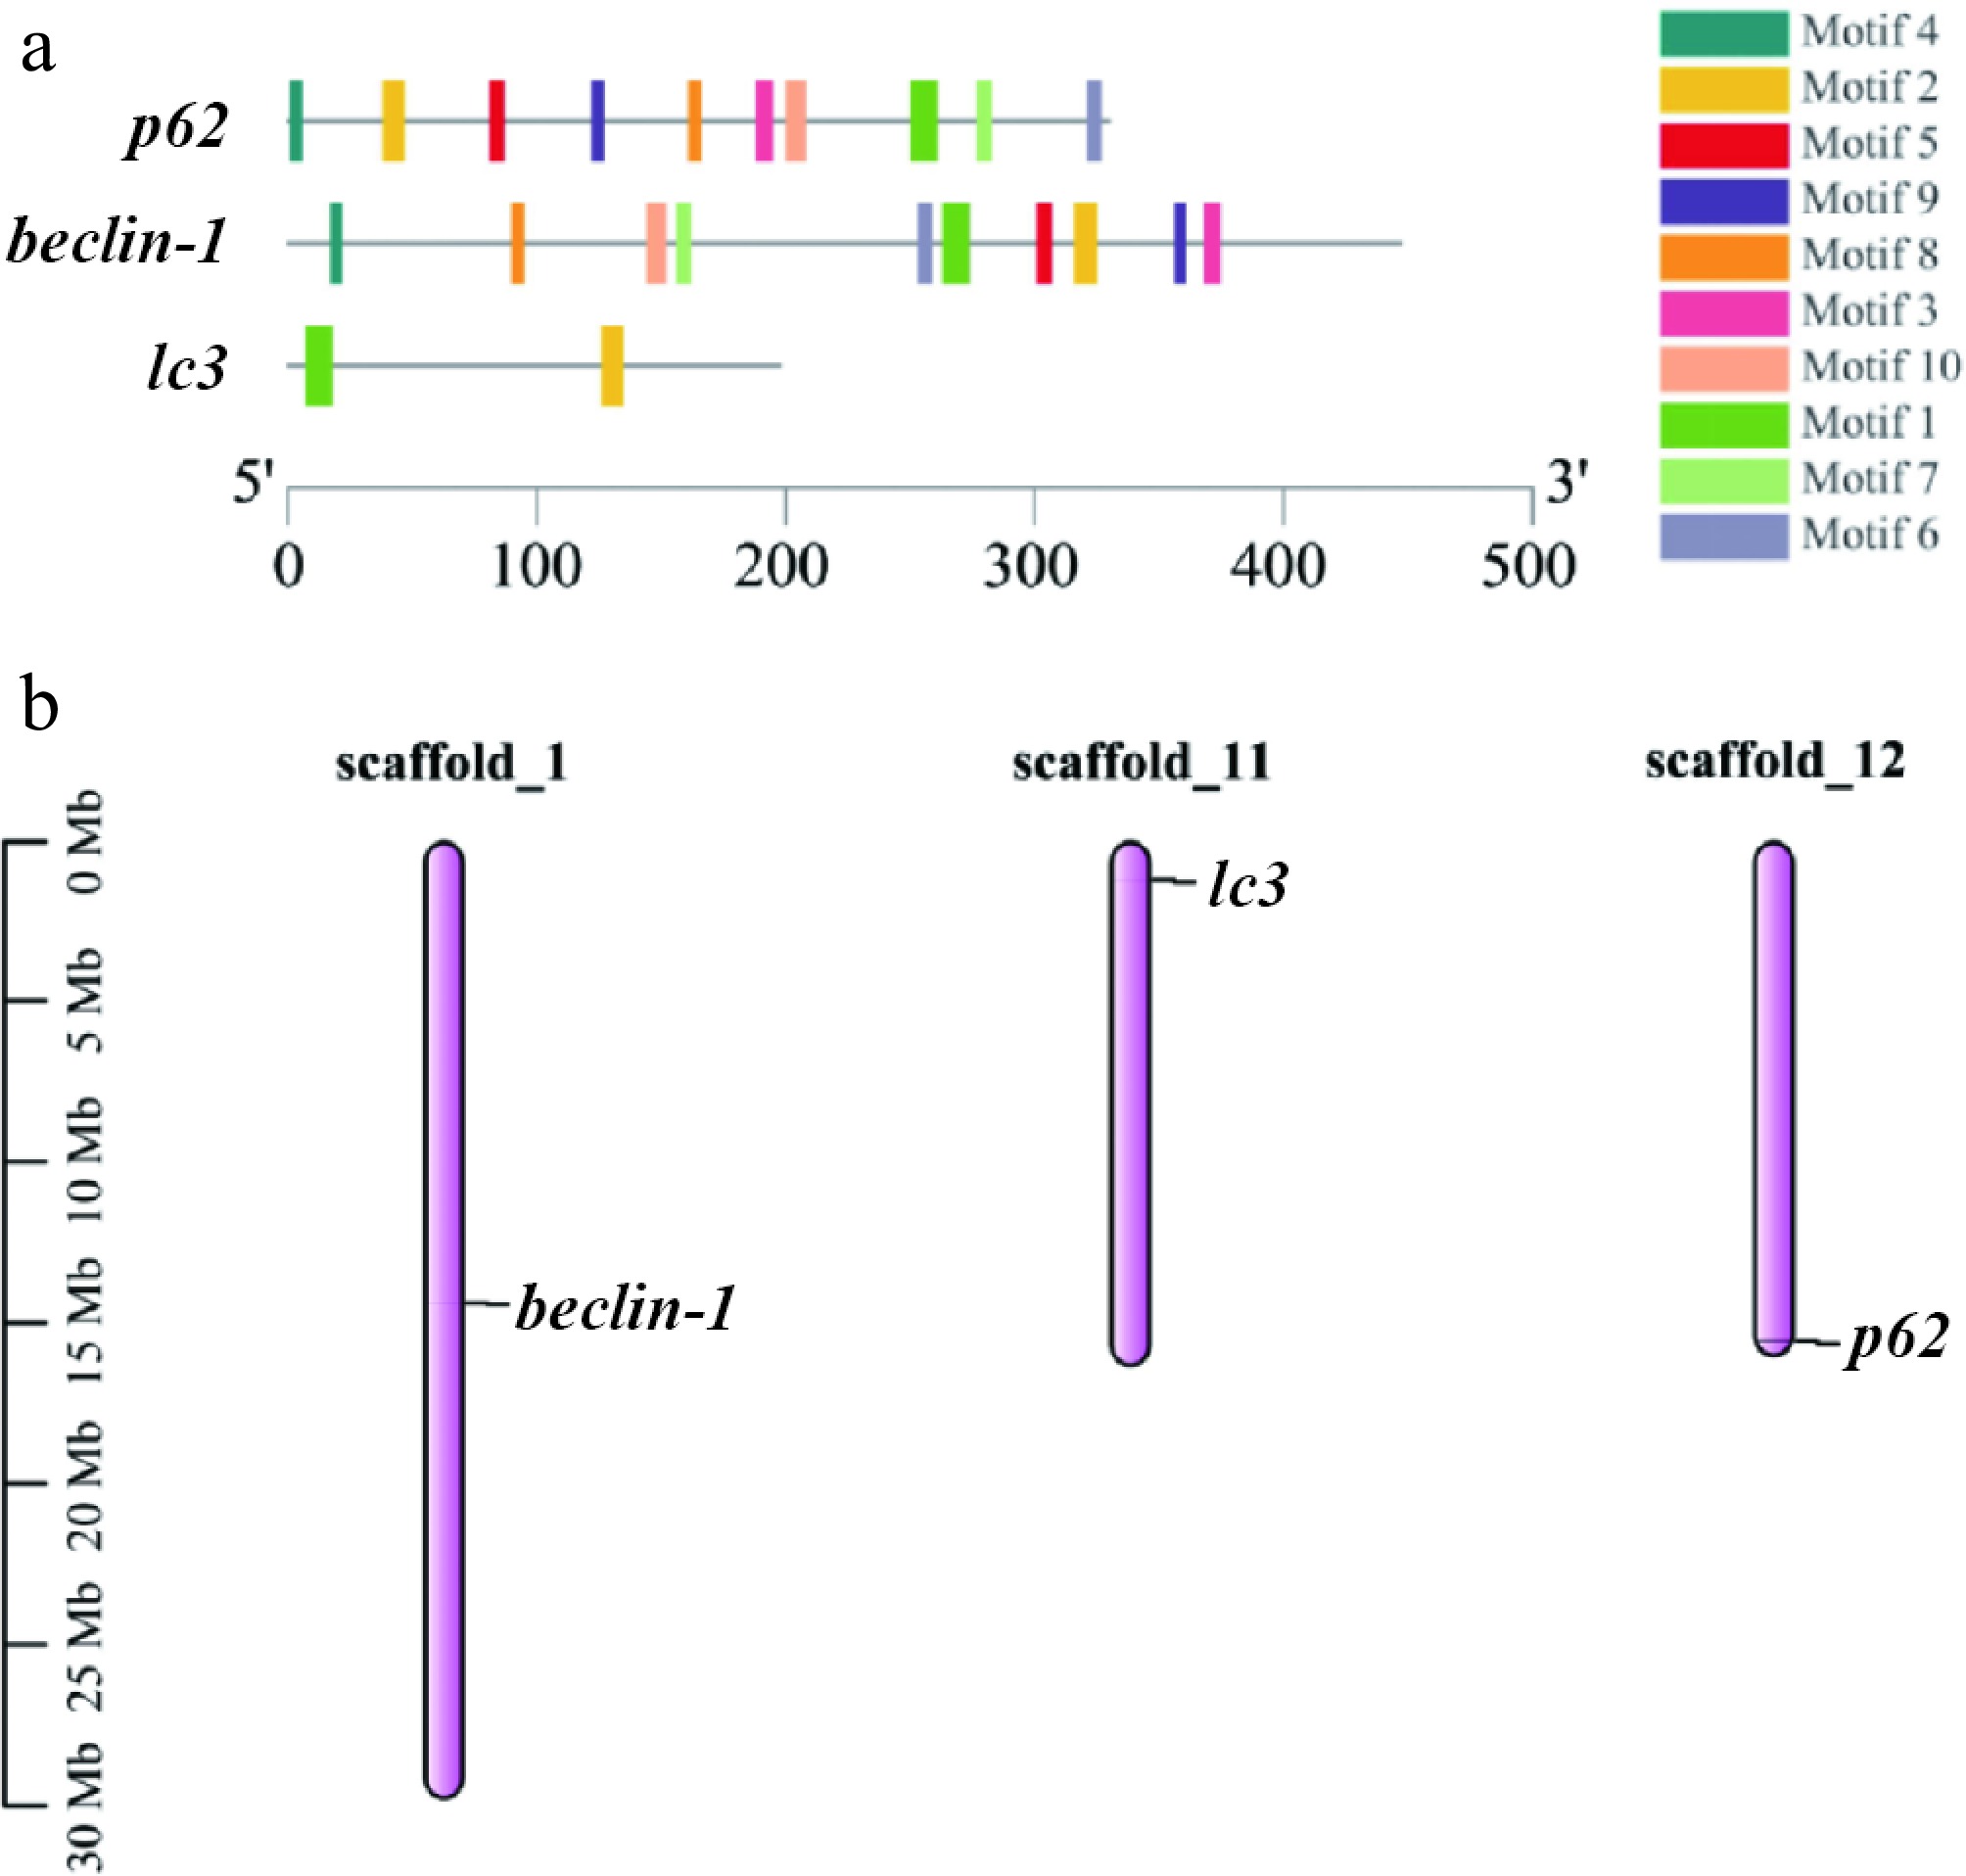
Figure 1.
Three autophagy genes are compared on the basis of their basic characteristics. (a) Conserved motifs in the three autophagy proteins, with the black line indicating nonconserved regions, and motif lengths proportionally represented. (b) The gene positions on the graph represent the average of their endpoints, with chromosome numbers above the bars and scale in megabases (Mb) on the left.
-
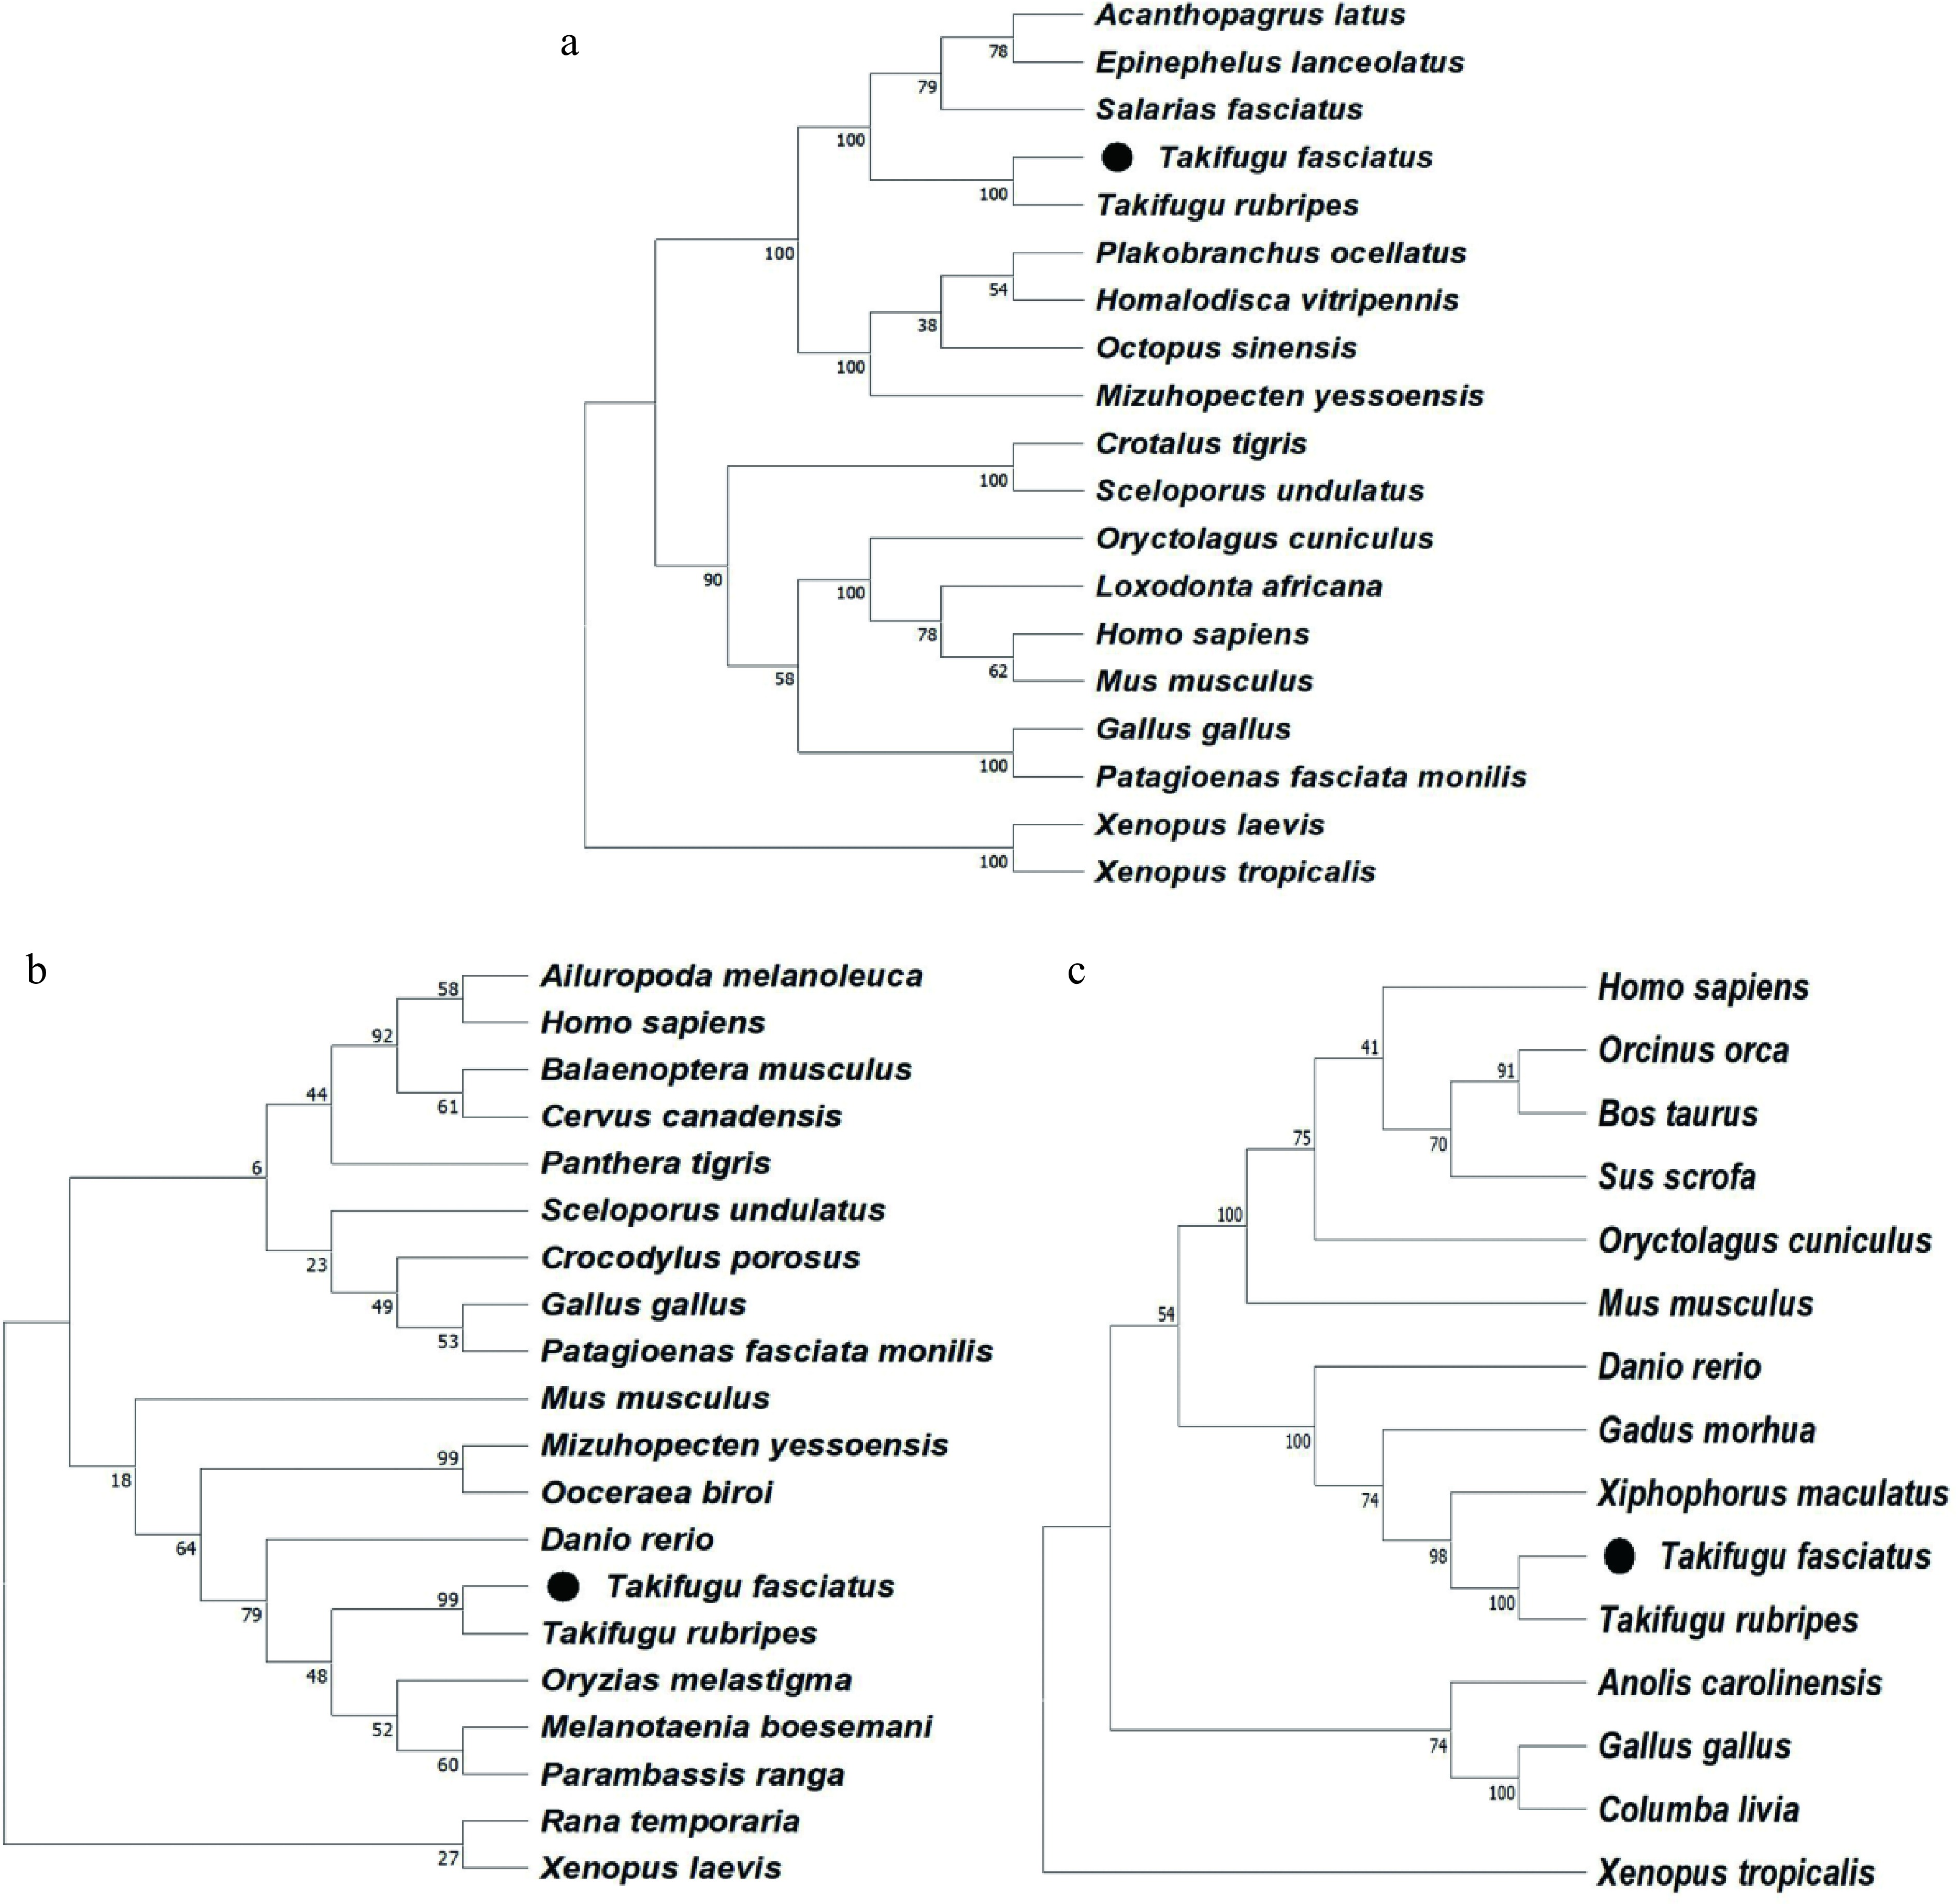
Figure 2.
Phylogenetic analysis of (a) lc3, (b) beclin-1, and (c) p62 from T. fasciatus and other animals.
-
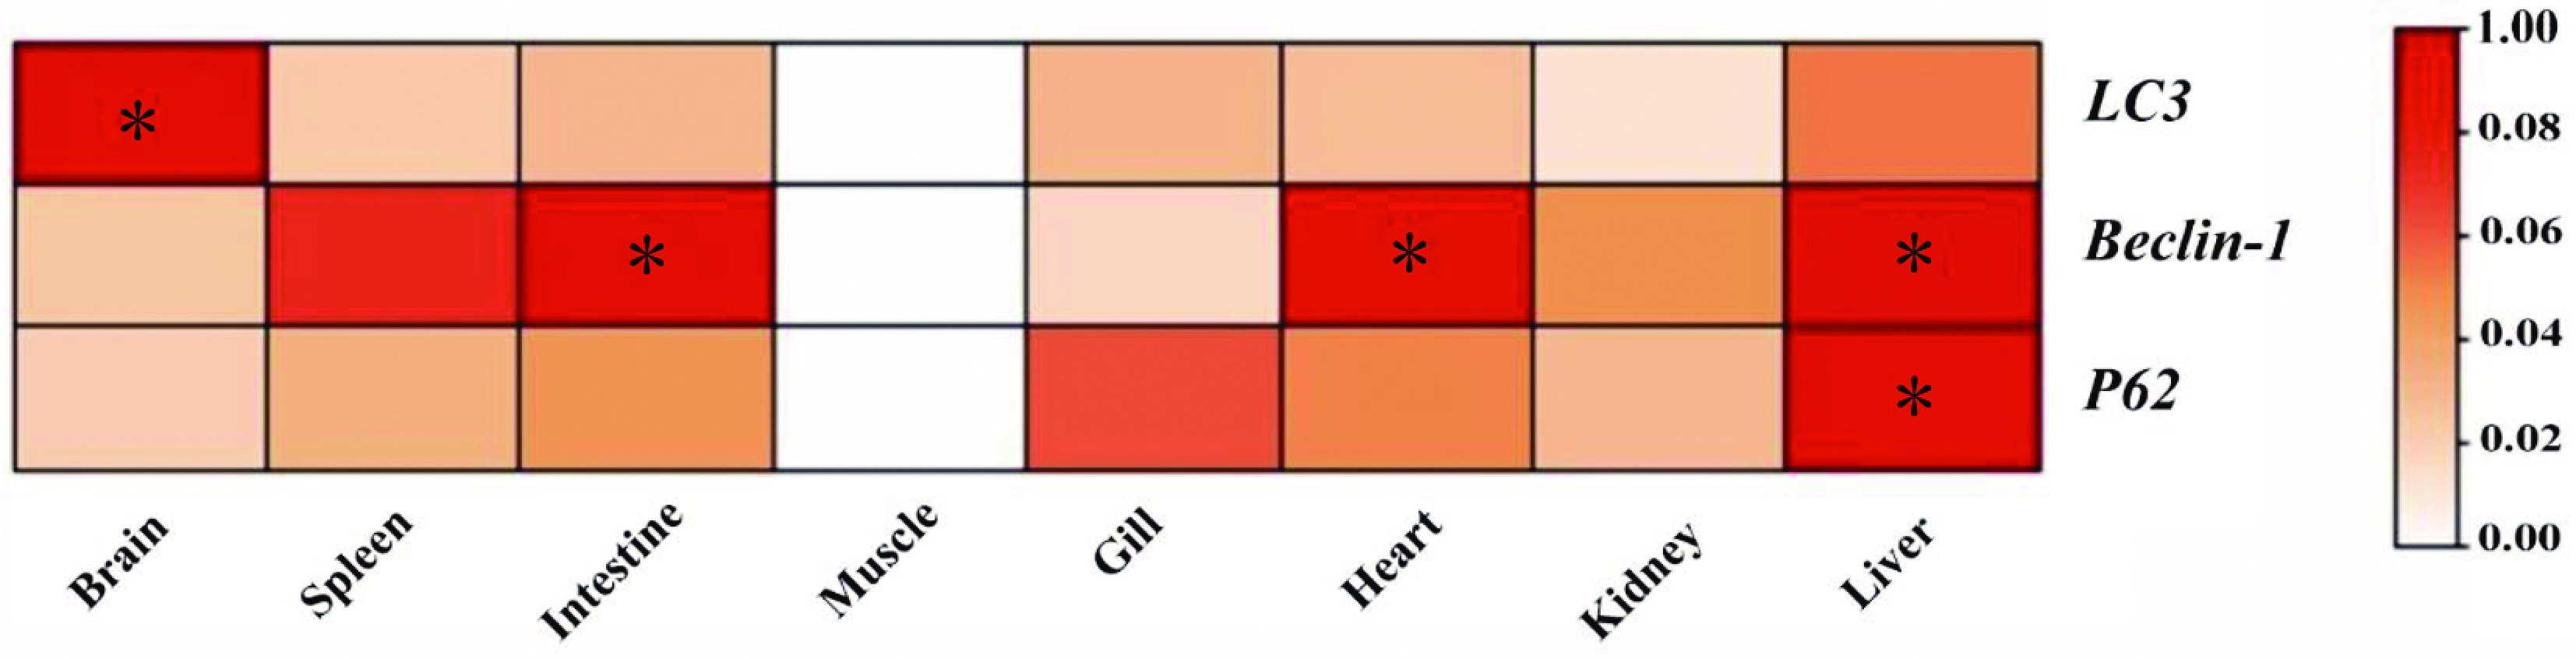
Figure 3.
Tissue-specific expression of autophagy genes in T. fasciatus. Figures marked with * represent significant differences at p < 0.05.
-
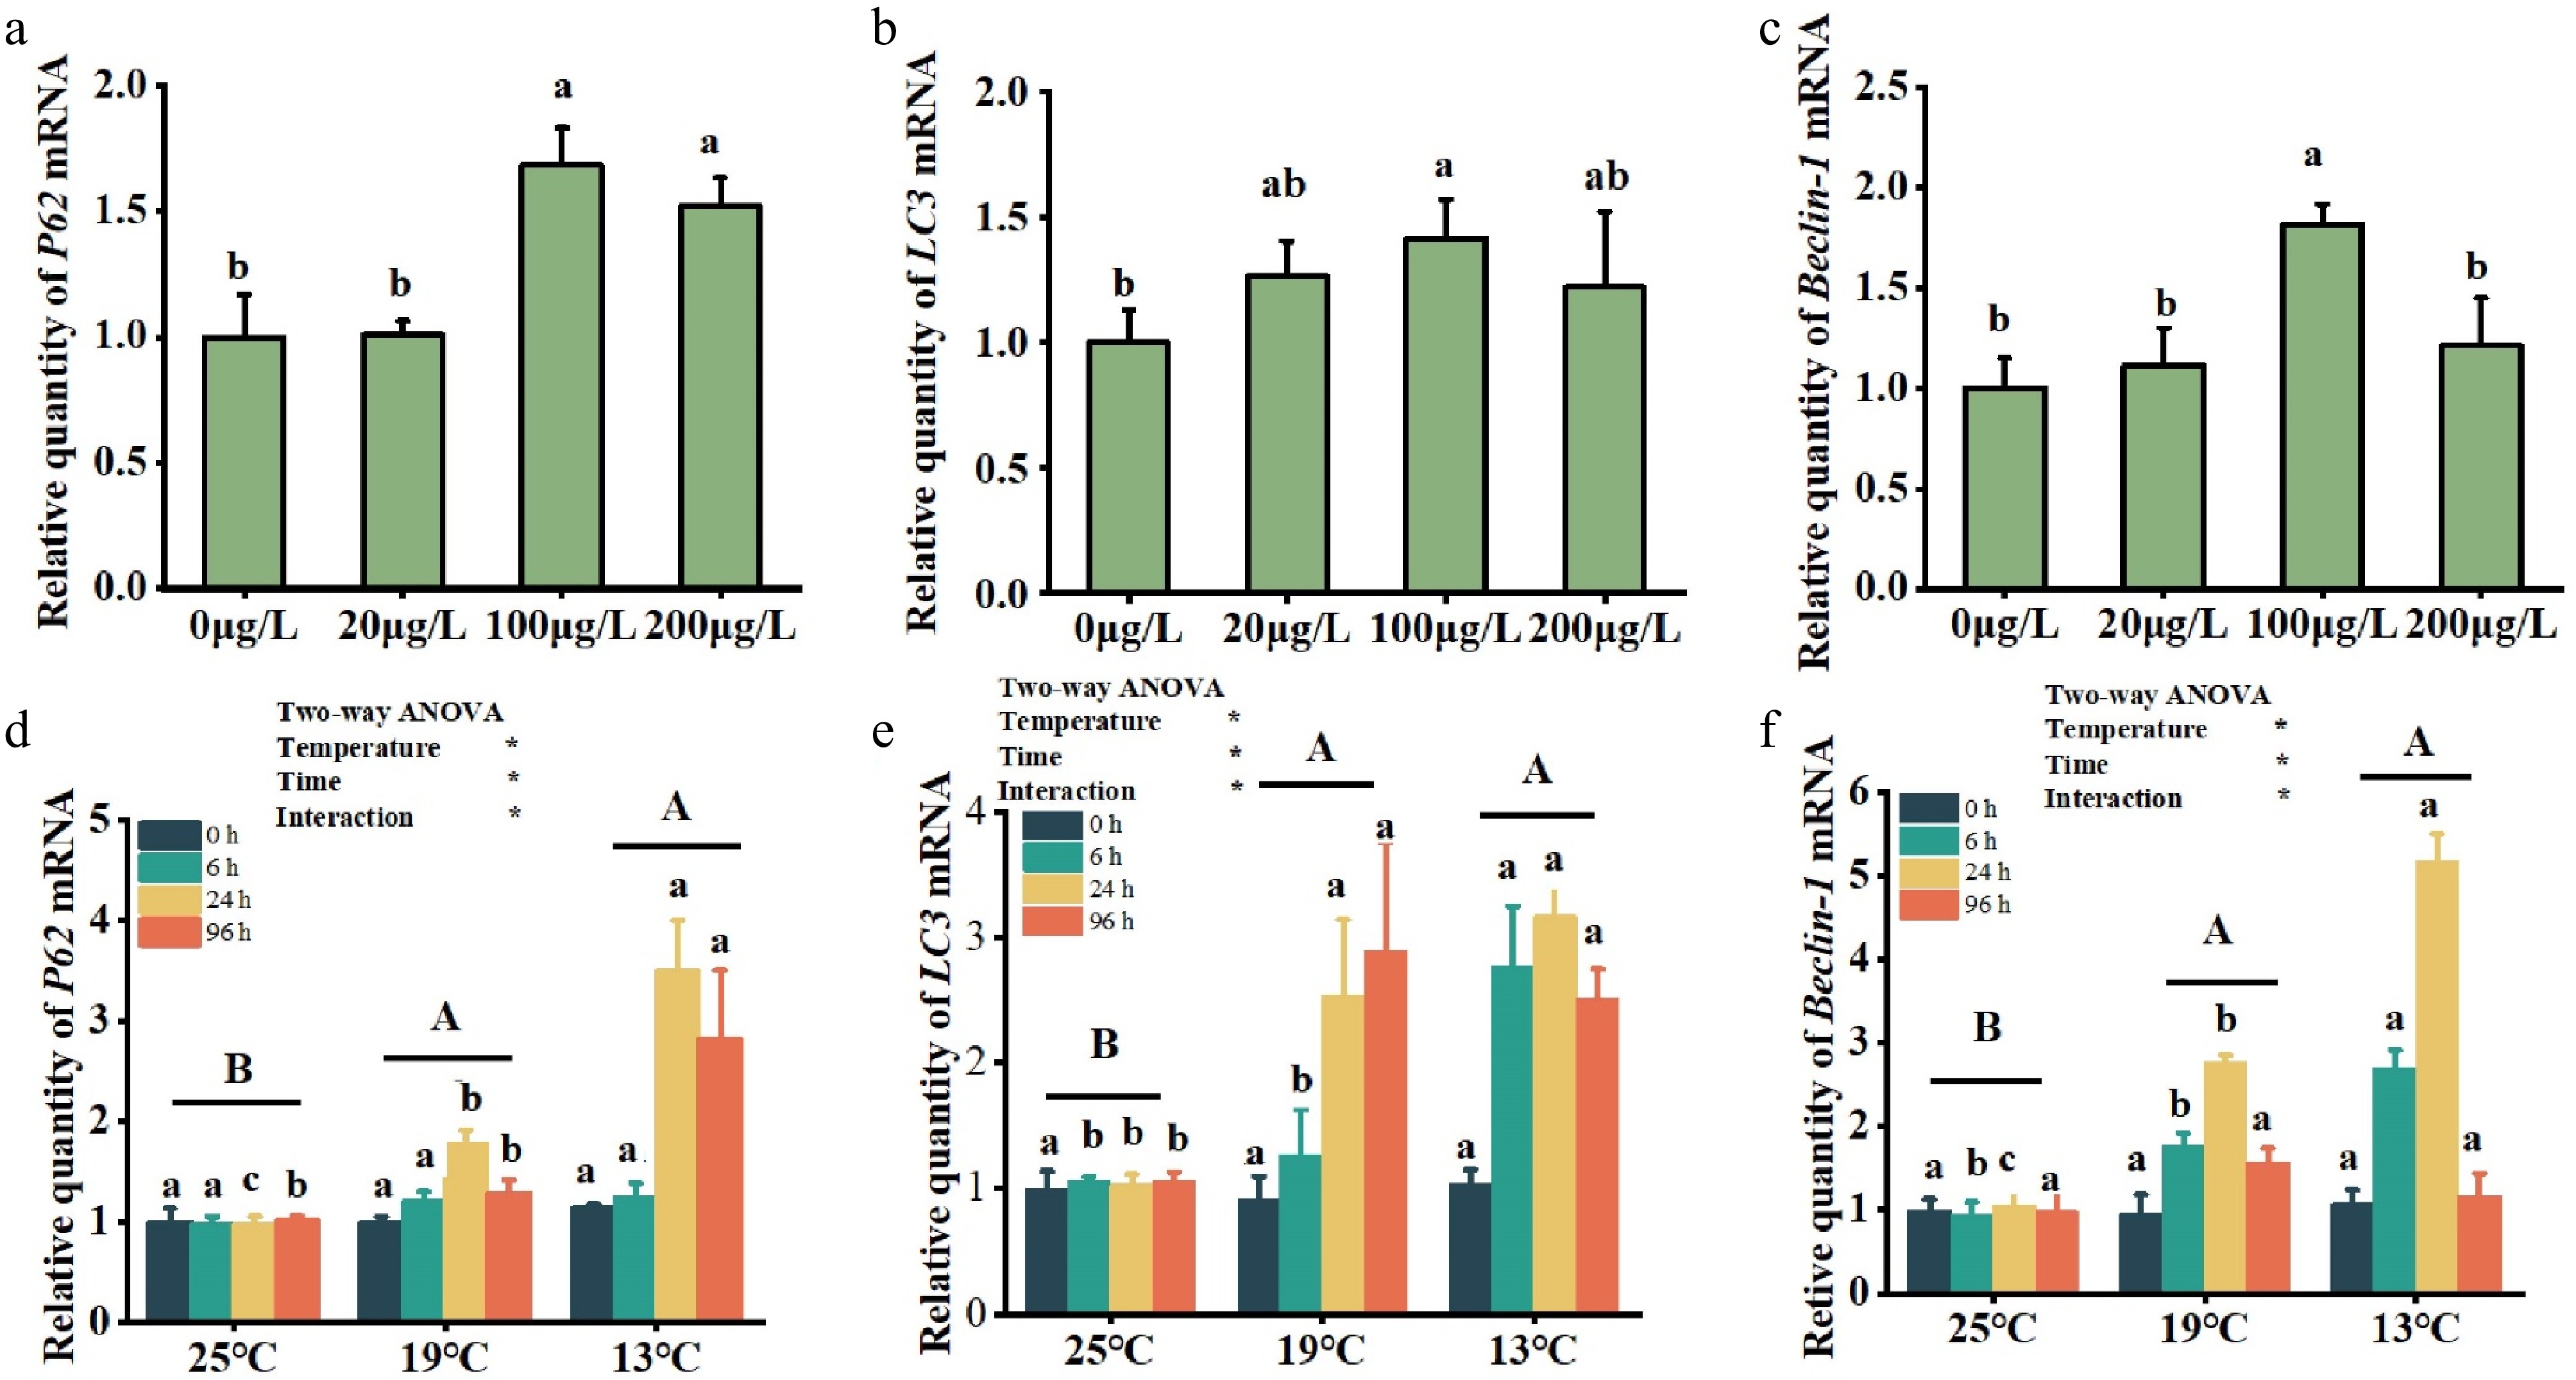
Figure 4.
Effect of different environmental factors on autophagy gene mRNA levels under Cu2+ treatment (a, b, c) and low temperatures (d, e, f). The means ± standard error of the mean (SEM) (n = 3) are used to express the data. Significant differences (p < 0.05) between treatments within the same timeframe are denoted by different lowercase letters.
-
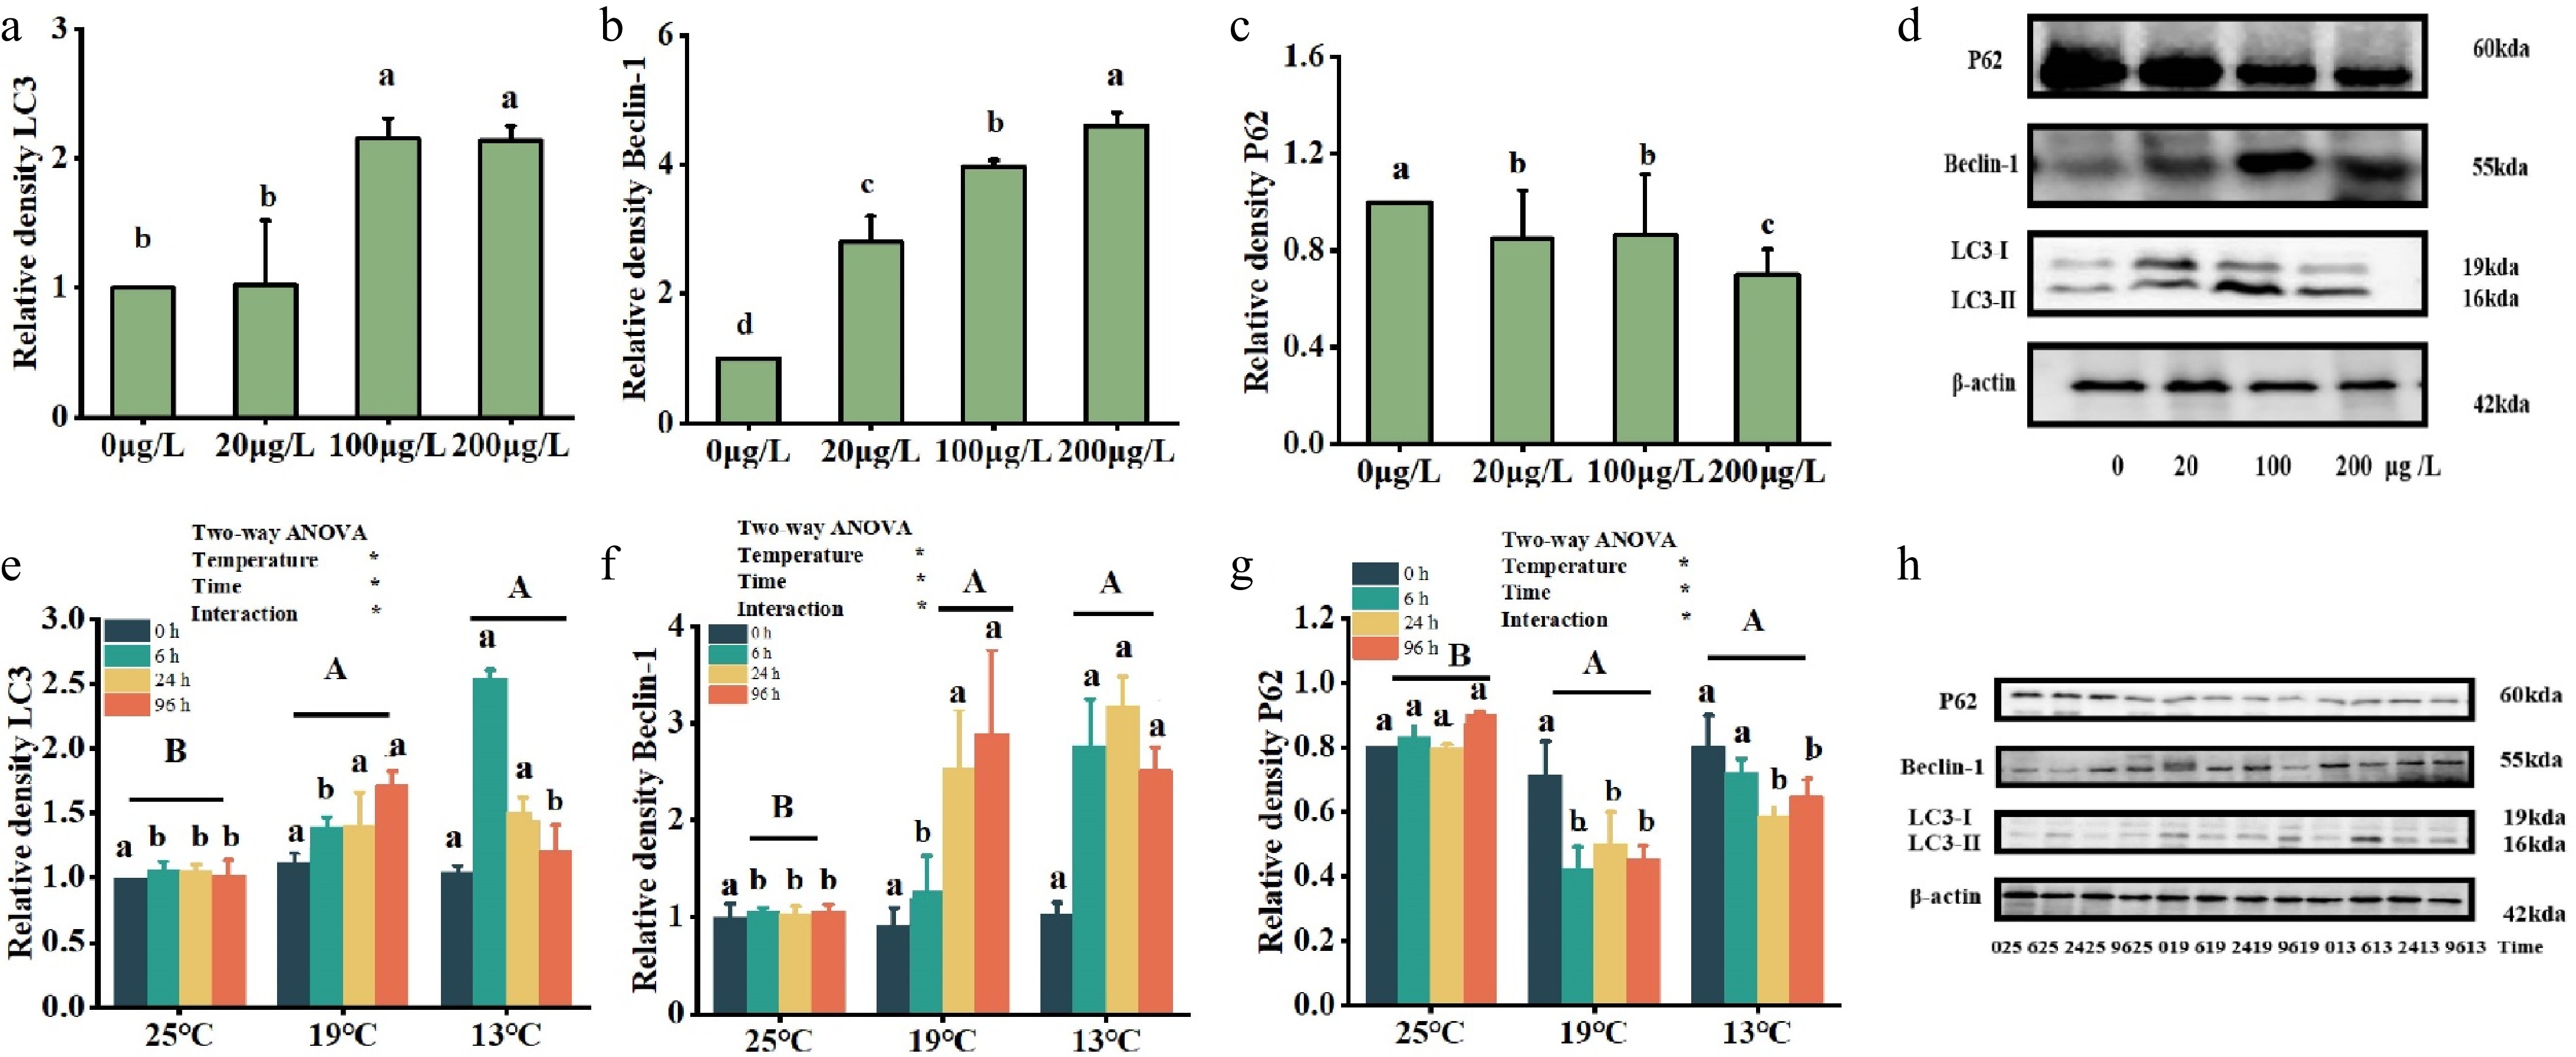
Figure 5.
Effects of multiple environmental factors on protein levels of autophagy genes udner Cu2+ treatment (a, b, c) and low-temperature treatment (e, f, g). Data are expressed as the means ± standard error of the mean (SEM) (n = 3). Significant differences (p < 0.05) between treatments within the same timeframe are denoted by different lowercase letters. (d, h) The abscissa is the temperature variables of 25 °C, 19 °C and 13 °C, with 25 °C as the control group, where each temperature is divided into four timeframes (0, 6, 24 and 96 h). Significant differences in the impact of various temperatures over the same time period are indicated by distinct lowercase letters (p < 0.05). Different capital letters represent significant variations in the effects of different temperature treatments (p < 0.05), while identical letters denote no significant difference.
-
Category Name Primer 5' RACE amplification M36-1 (GSP1) TCTCCGCCTGTTTACT M36-2 (GSP2) GCGGTCGAGGACATTAAAG M36-3 (GSP3) GCACCGCTGACACACGAA M37-1 (GSP1) CATGTTTACGTGGTCC M37-2 (GSP2) TCTCTCCTTTATACCGCTCG M37-3 (GSP3) ACGGGTATCTTGTTGGGG B962-1 (GSP1) GCAGAGGTACTCAAAG B962-2 (GSP2) CGTCCTGGTCCACCGCAAAC B962-3 (GSP3) TTGACCACCTCGTCCTTC 3' RACE amplification Y14-1 (GSP1) AGGAGGCTTGAGGTTCTTCTGGGACA Y14-3 (GSP2) AACTCGGAGGAGCAGTGGACCAAAGC Y15-1 (GSP1) TCAGAAAAGACCTTCAAACAAAGACGGAGC Y15-3 (GSP2) TTCCCATGCTGGACAAGACCAAGTTC C590-1 (GSP1) CTGCCTTCAGGTGGACAGCAACAT C590-2 (GSP2) AGTAGAGTCTTTGGCTCAGATGCT Table 1.
Primer sequences used in PCR.
-
Gene Forward (5'–3') Reverse (3'–5') Product size lc3 AGCGAACTCATCAAGATCATCAGGAG ATCCCGCTCTTGCTCGTAGACC 132 beclin-1 CAGAGAACGAATGCCAGAATTACAAGC CCTCCACCGTCTCCAGTTCCTC 144 p62 ACAGATGAAGGCGGTTGGTTGAC GTTAGGTTGTCTGGCGTACTGGATG 96 β-actin AAGCGTGCGTGACATCAA TGGGCTAACGGAACCTCT 155 Table 2.
Primer sequences used in qRT-PCR.
-
Features lc3 beclin-1 p62 Sequence similarity (fish–mammal) > 85% > 80% > 75% Chromosome location (Danio rerio) Chr5 Chr5 Chr11 Chromosome location (Oryzias latipes) Chr16 Chr18 Chr14 Chromosome location (Oreochromis) Chr7 Chr5 Chr9 Major subcellular localization Autophagosome membrane Endoplasmic reticulum–mitochondria contact sites Protein aggregates Localization-related function Autophagosome formation Autophagy initiation Selective autophagy Table 3.
Comparative analysis of lc3, beclin-1 and p62 in different fish species.
Figures
(5)
Tables
(3)