-
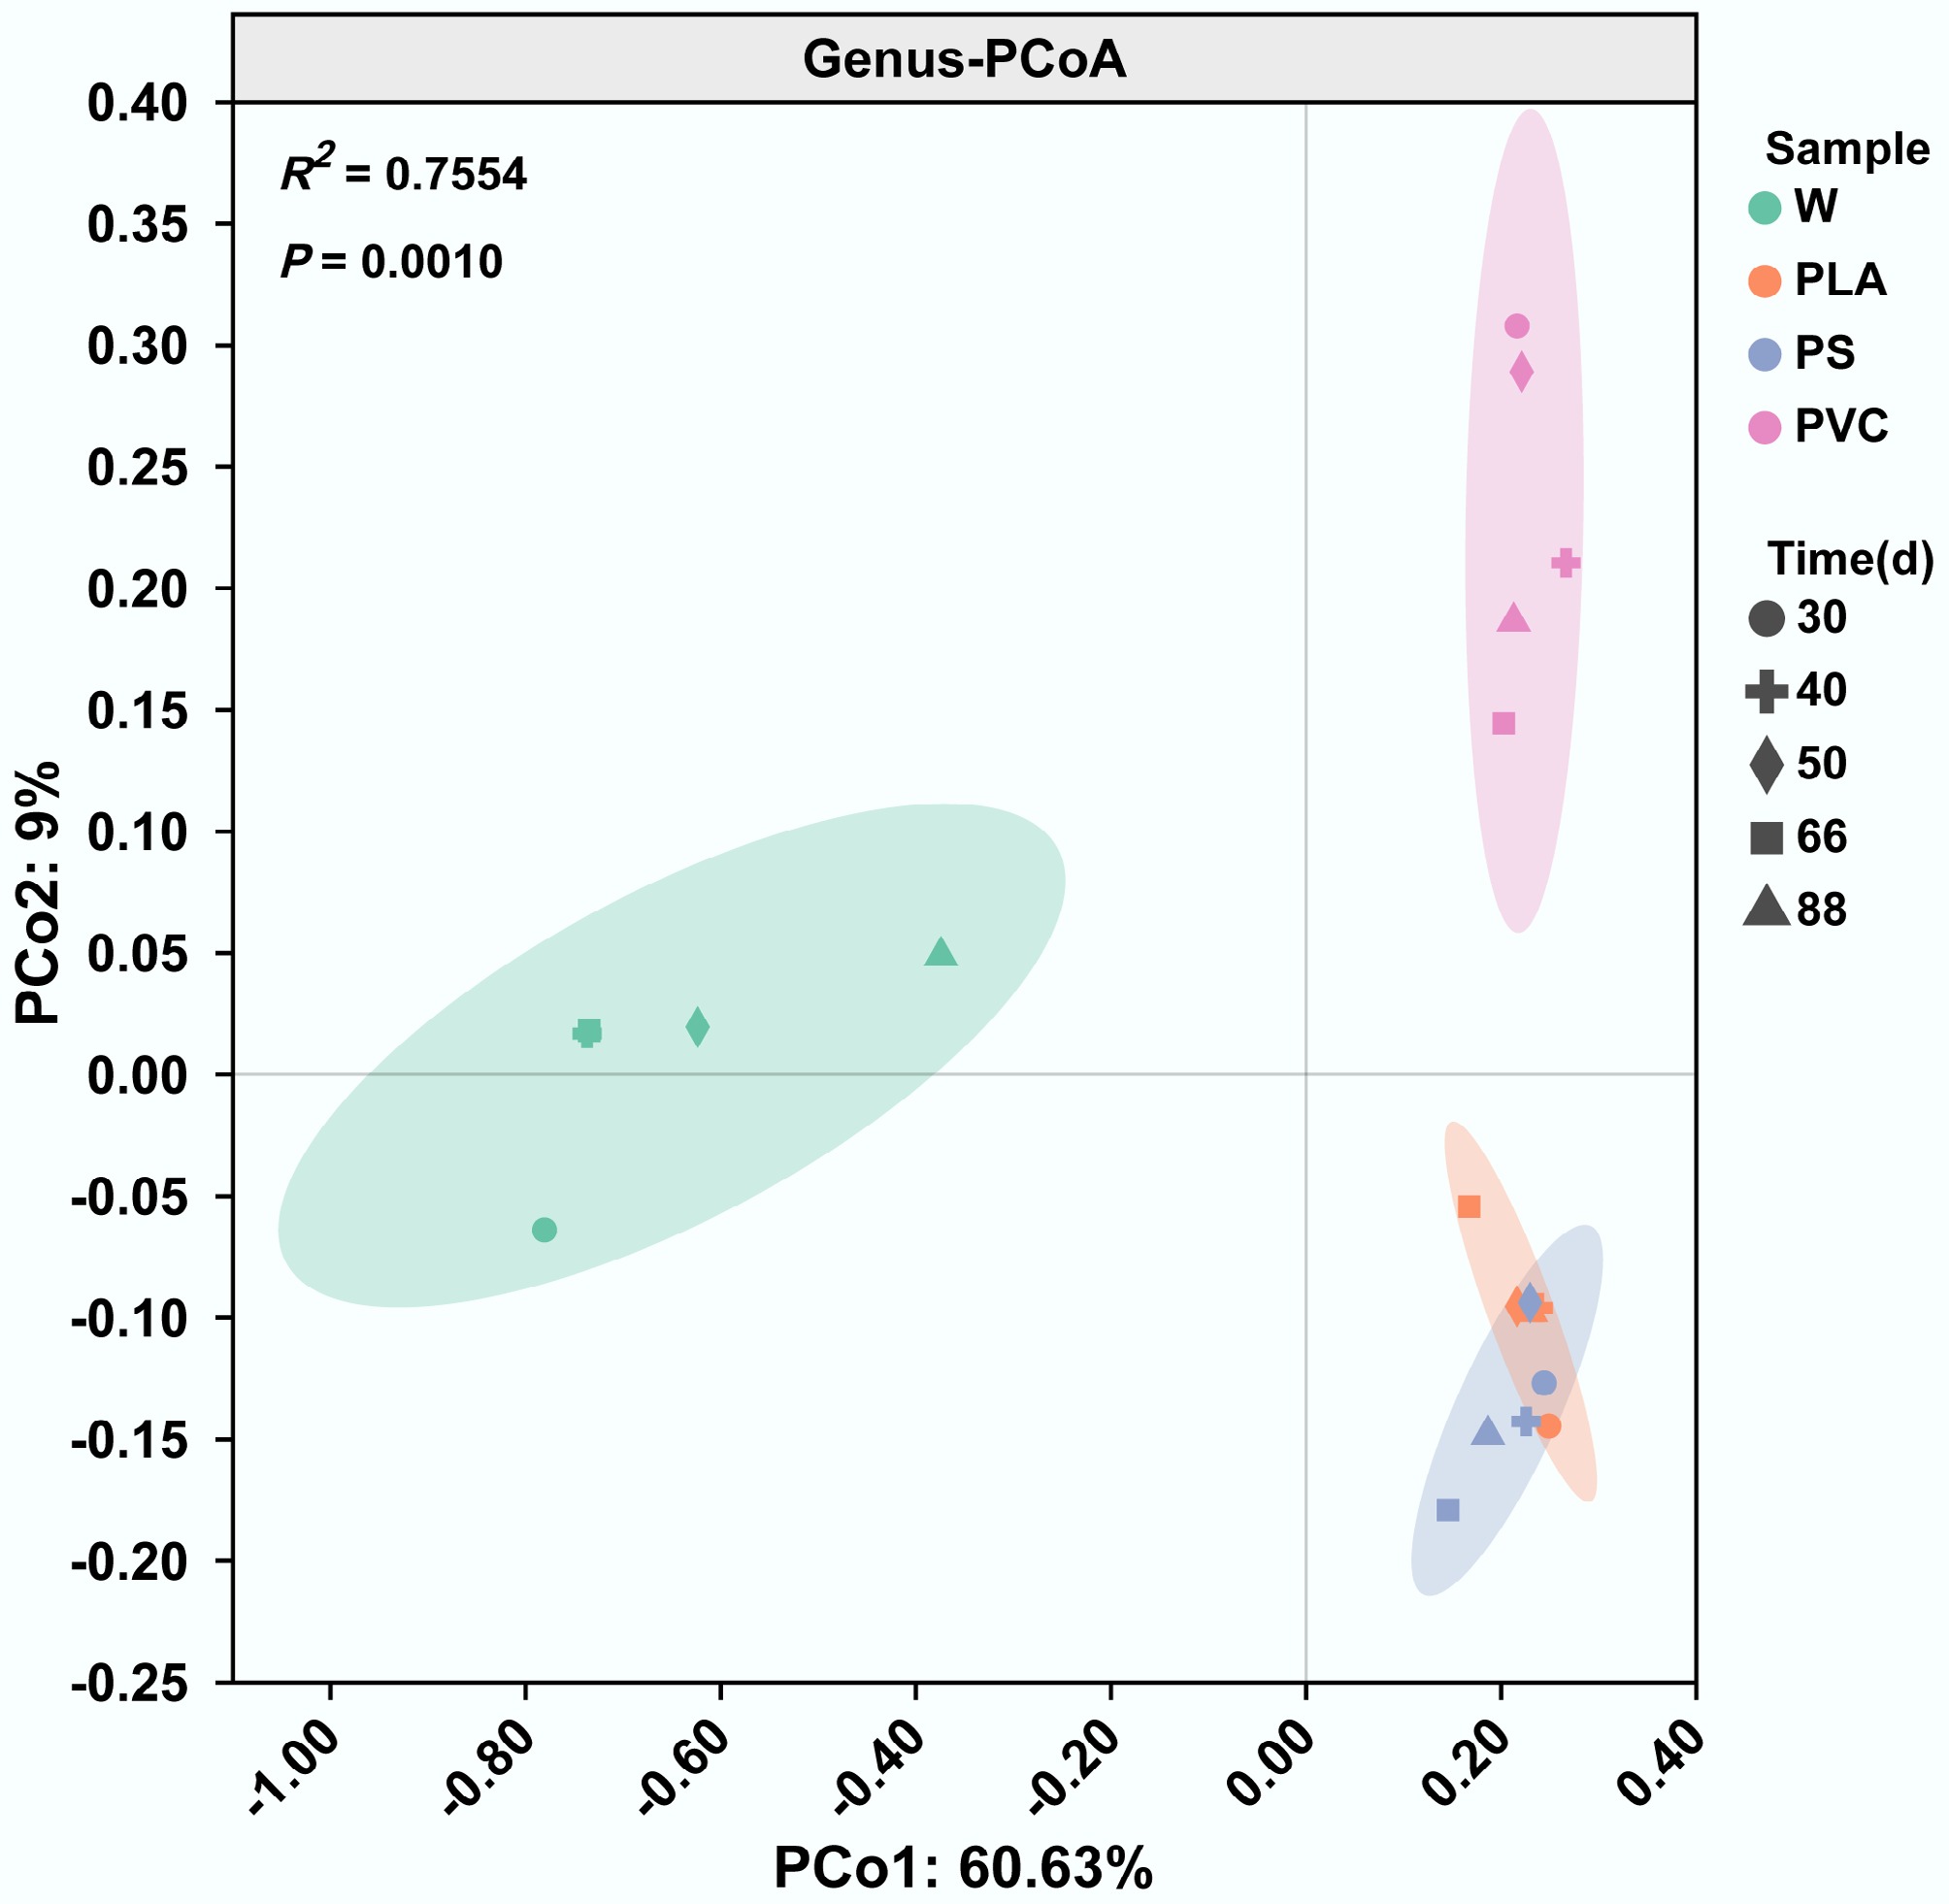
Figure 1.
Distinct microbial community structures assemble on plastic surfaces. Principal Coordinate Analysis (PCoA) based on Bray-Curtis dissimilarity of microbial communities at the genus level. Each point represents a sample from either river water (W) or the plastisphere of polylactic acid (PLA), polystyrene (PS), or polyvinyl chloride (PVC). Ellipses represent the 95% confidence interval for each group.
-
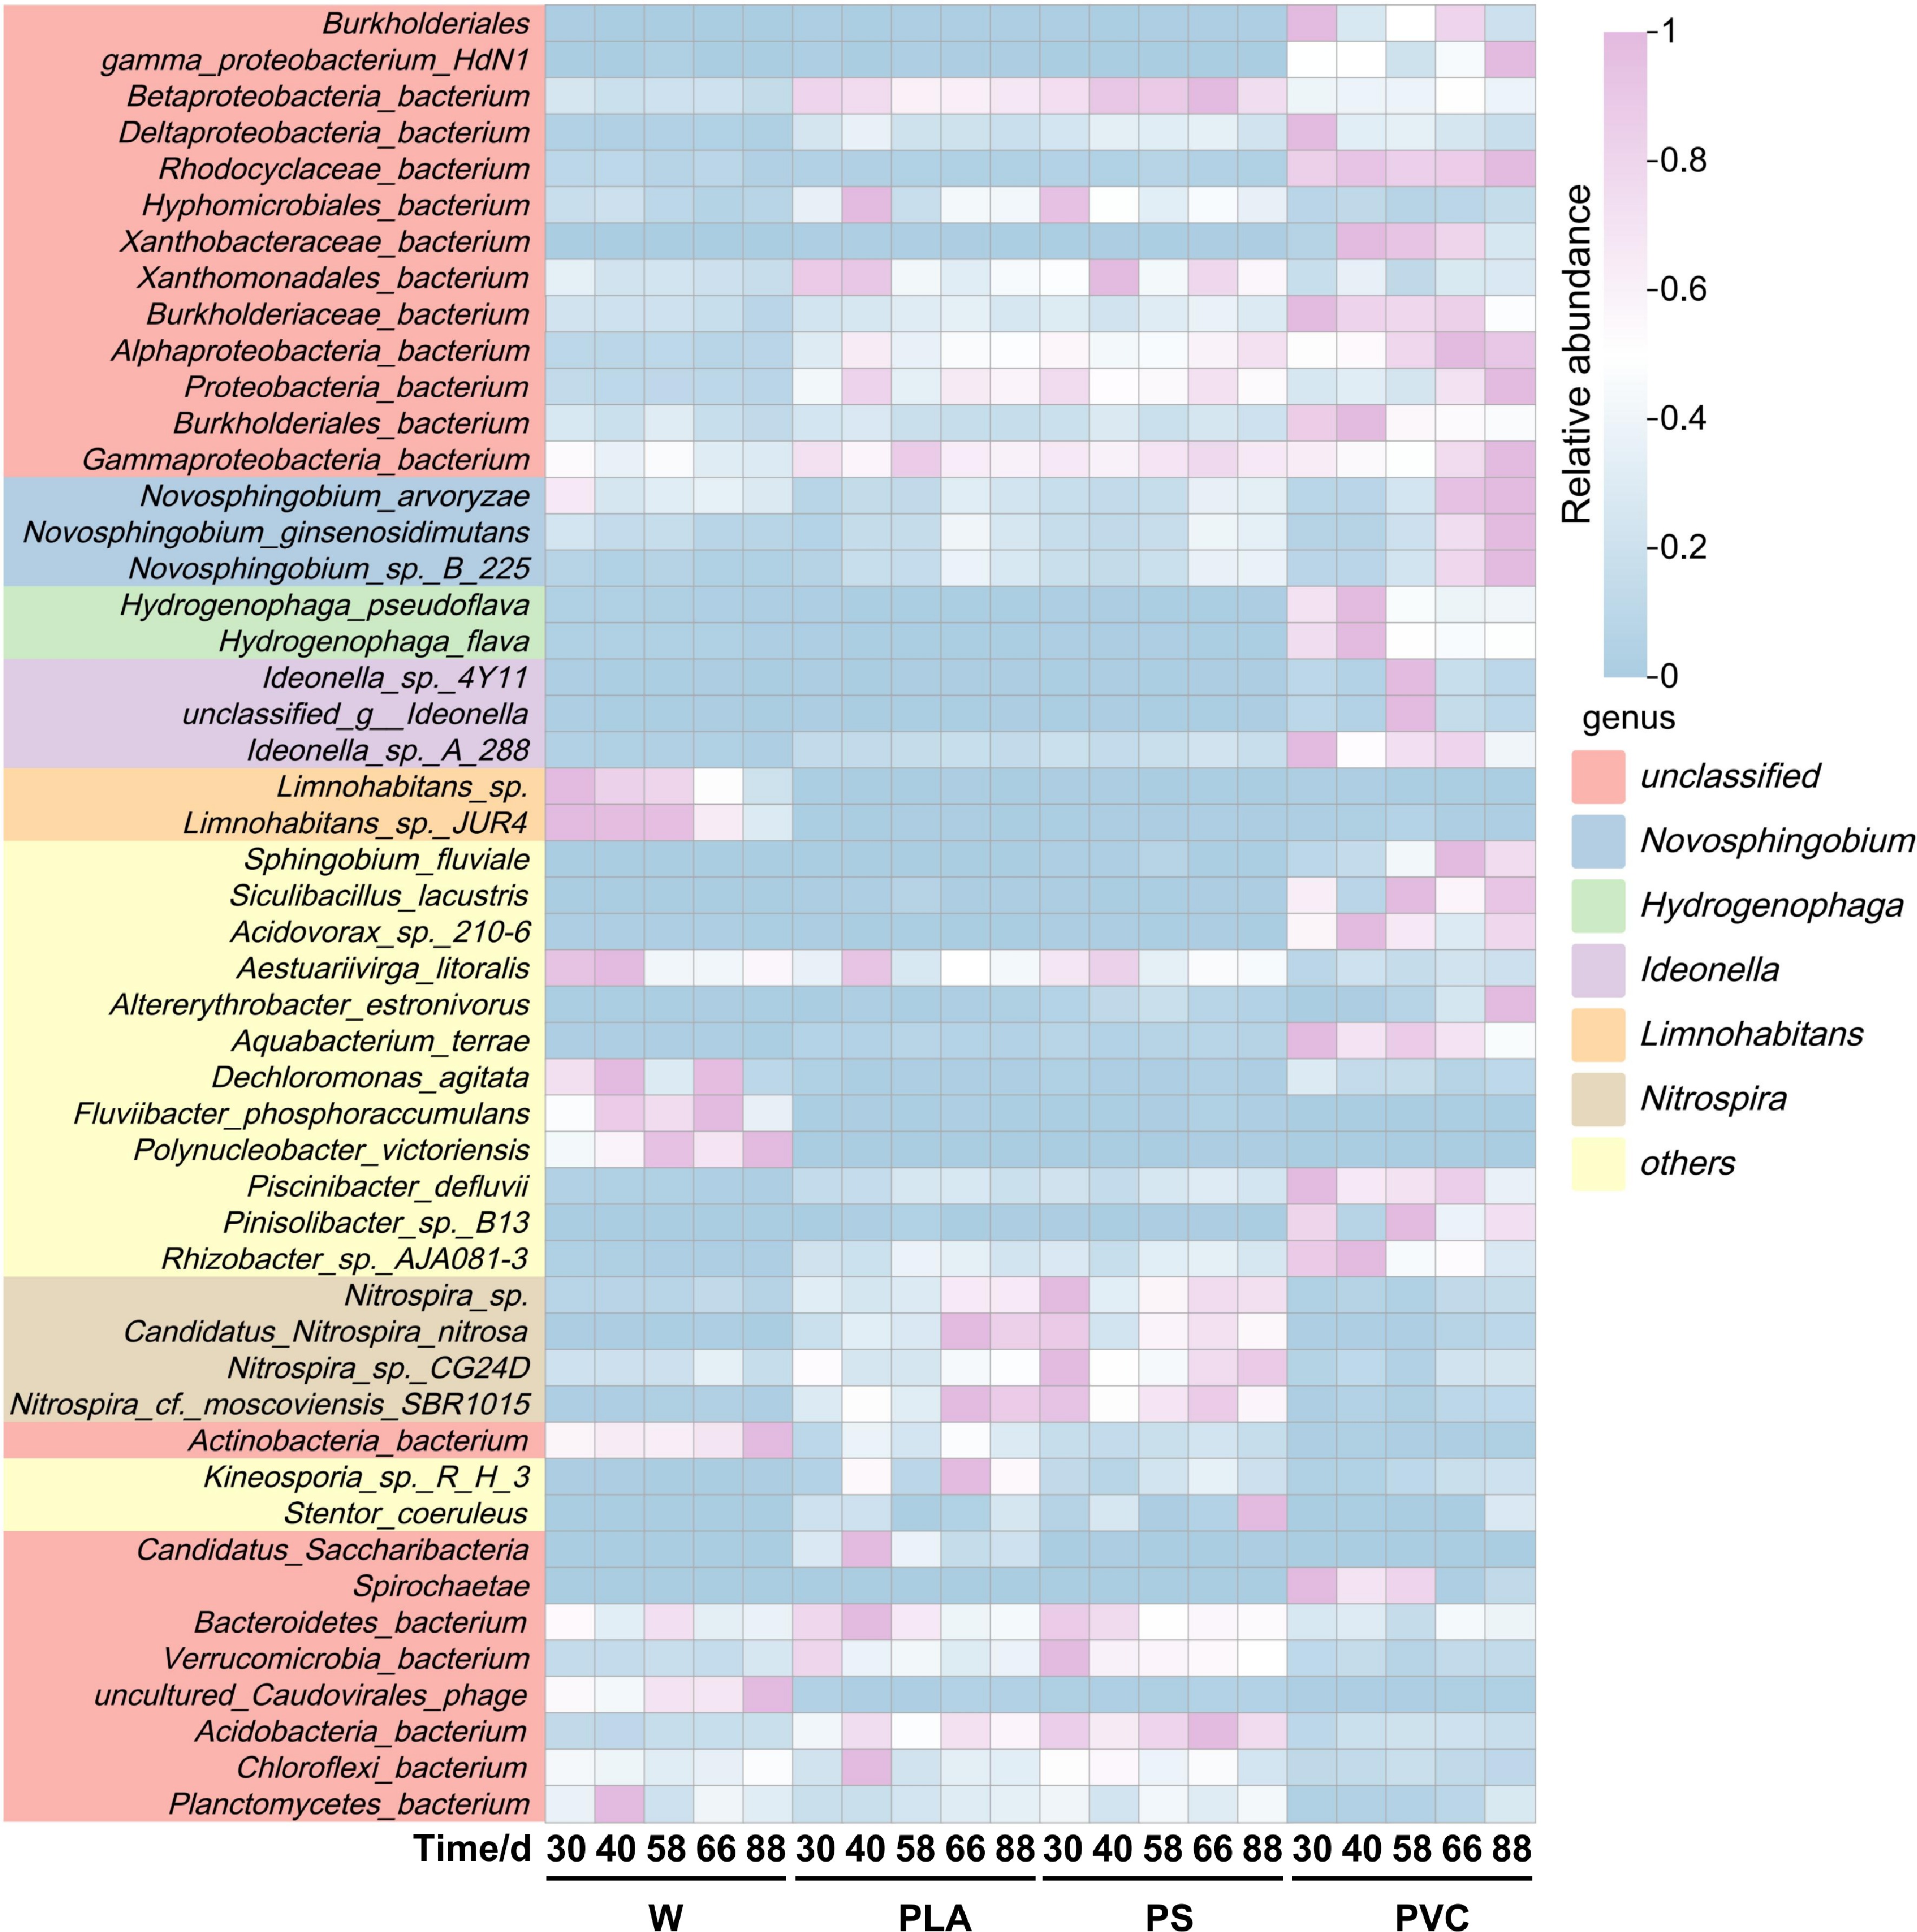
Figure 2.
Heatmap showing the relative abundance of the top 50 most abundant microbial species. Rows are clustered according to species abundance profiles, and columns are clustered by sample. The color key indicates the log-transformed relative abundance.
-
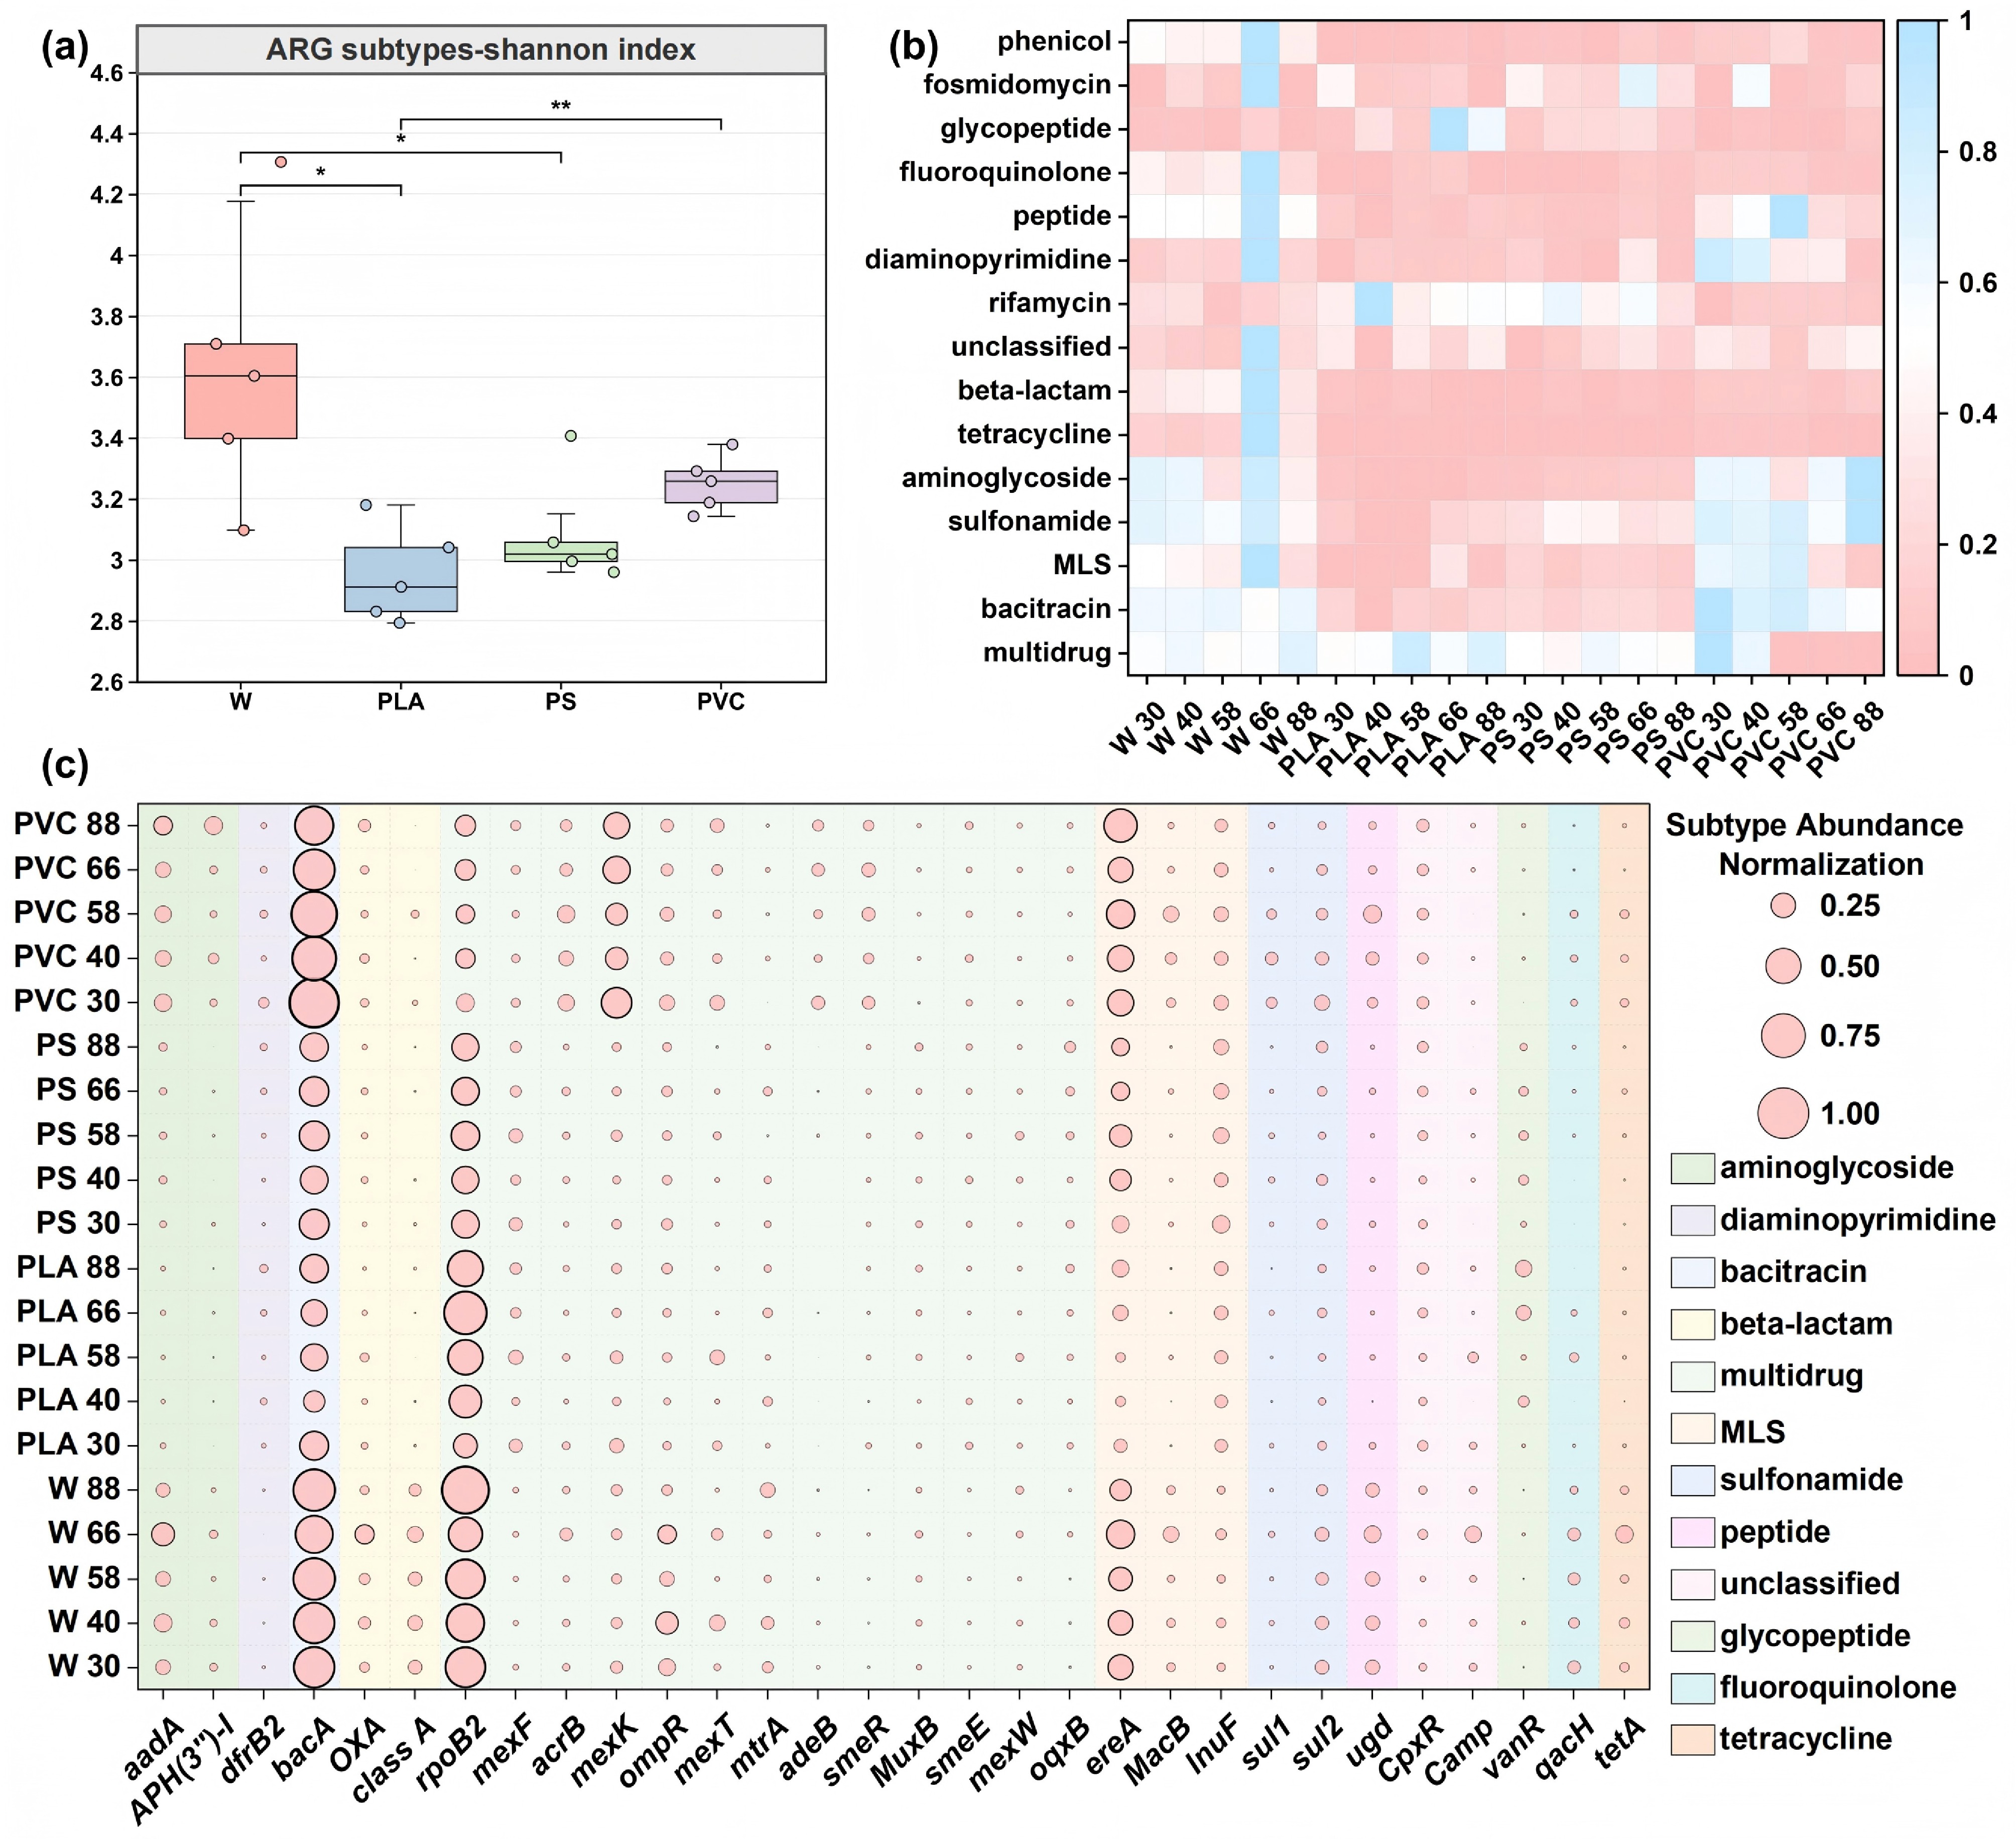
Figure 3.
Dynamics of antibiotic resistance genes (ARGs) reveal distinct risk profiles for different plastic types. (a) Alpha diversity (Shannon index) of ARG subtypes across sample groups. Boxplots display the median and interquartile range. (b) Relative abundance of major ARG types across all samples over the 88-d incubation. Abundances are normalized as copies per 16S rRNA gene. (c) Heatmap of the relative abundance of the top 30 most abundant ARG subtypes. The color intensity corresponds to the z-score normalized abundance of each subtype across all samples.
-
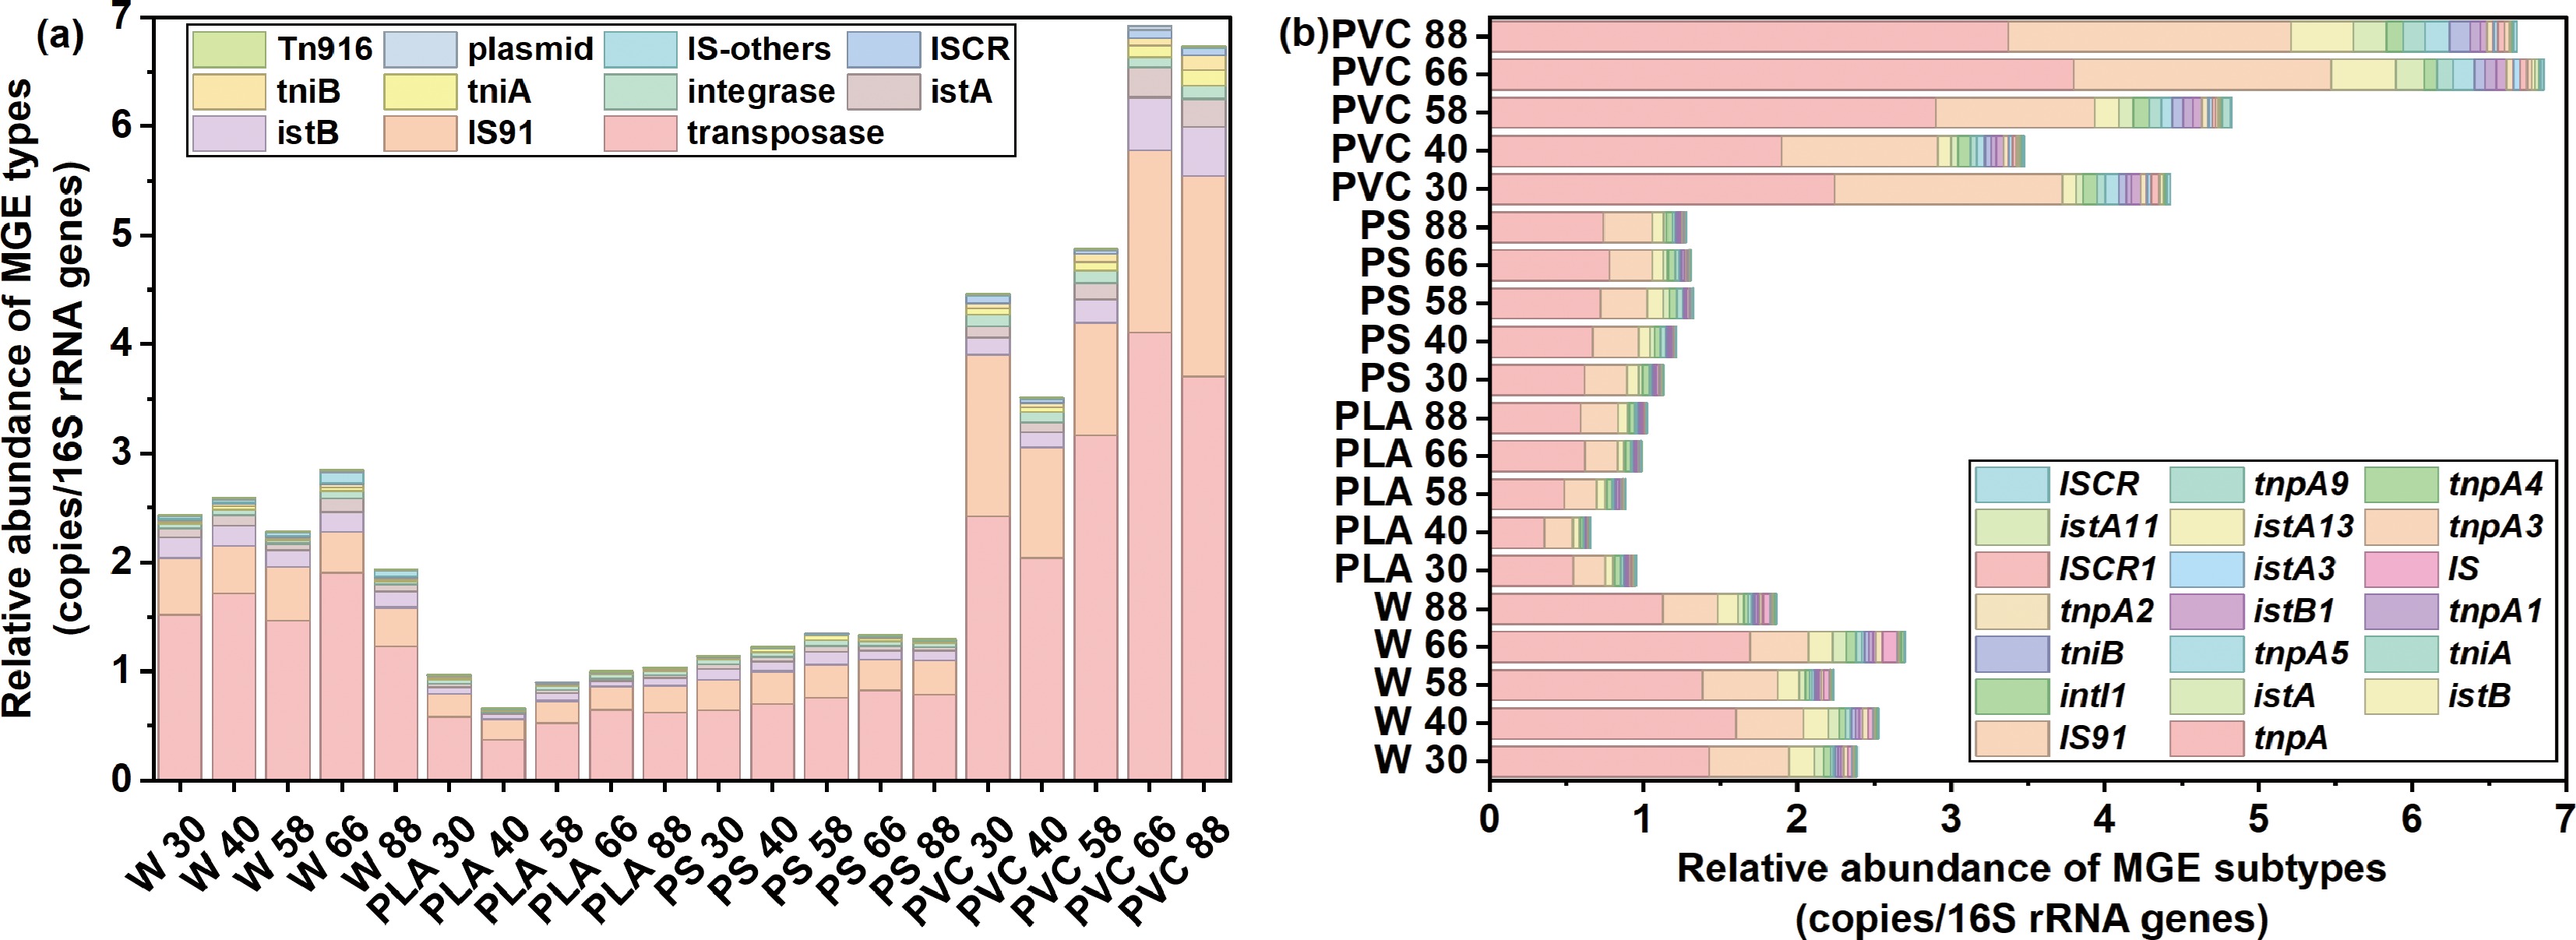
Figure 4.
Relative abundance of (a) types and (b) subtypes of mobile genetic element (MGE) in river water and plastispheres.
-
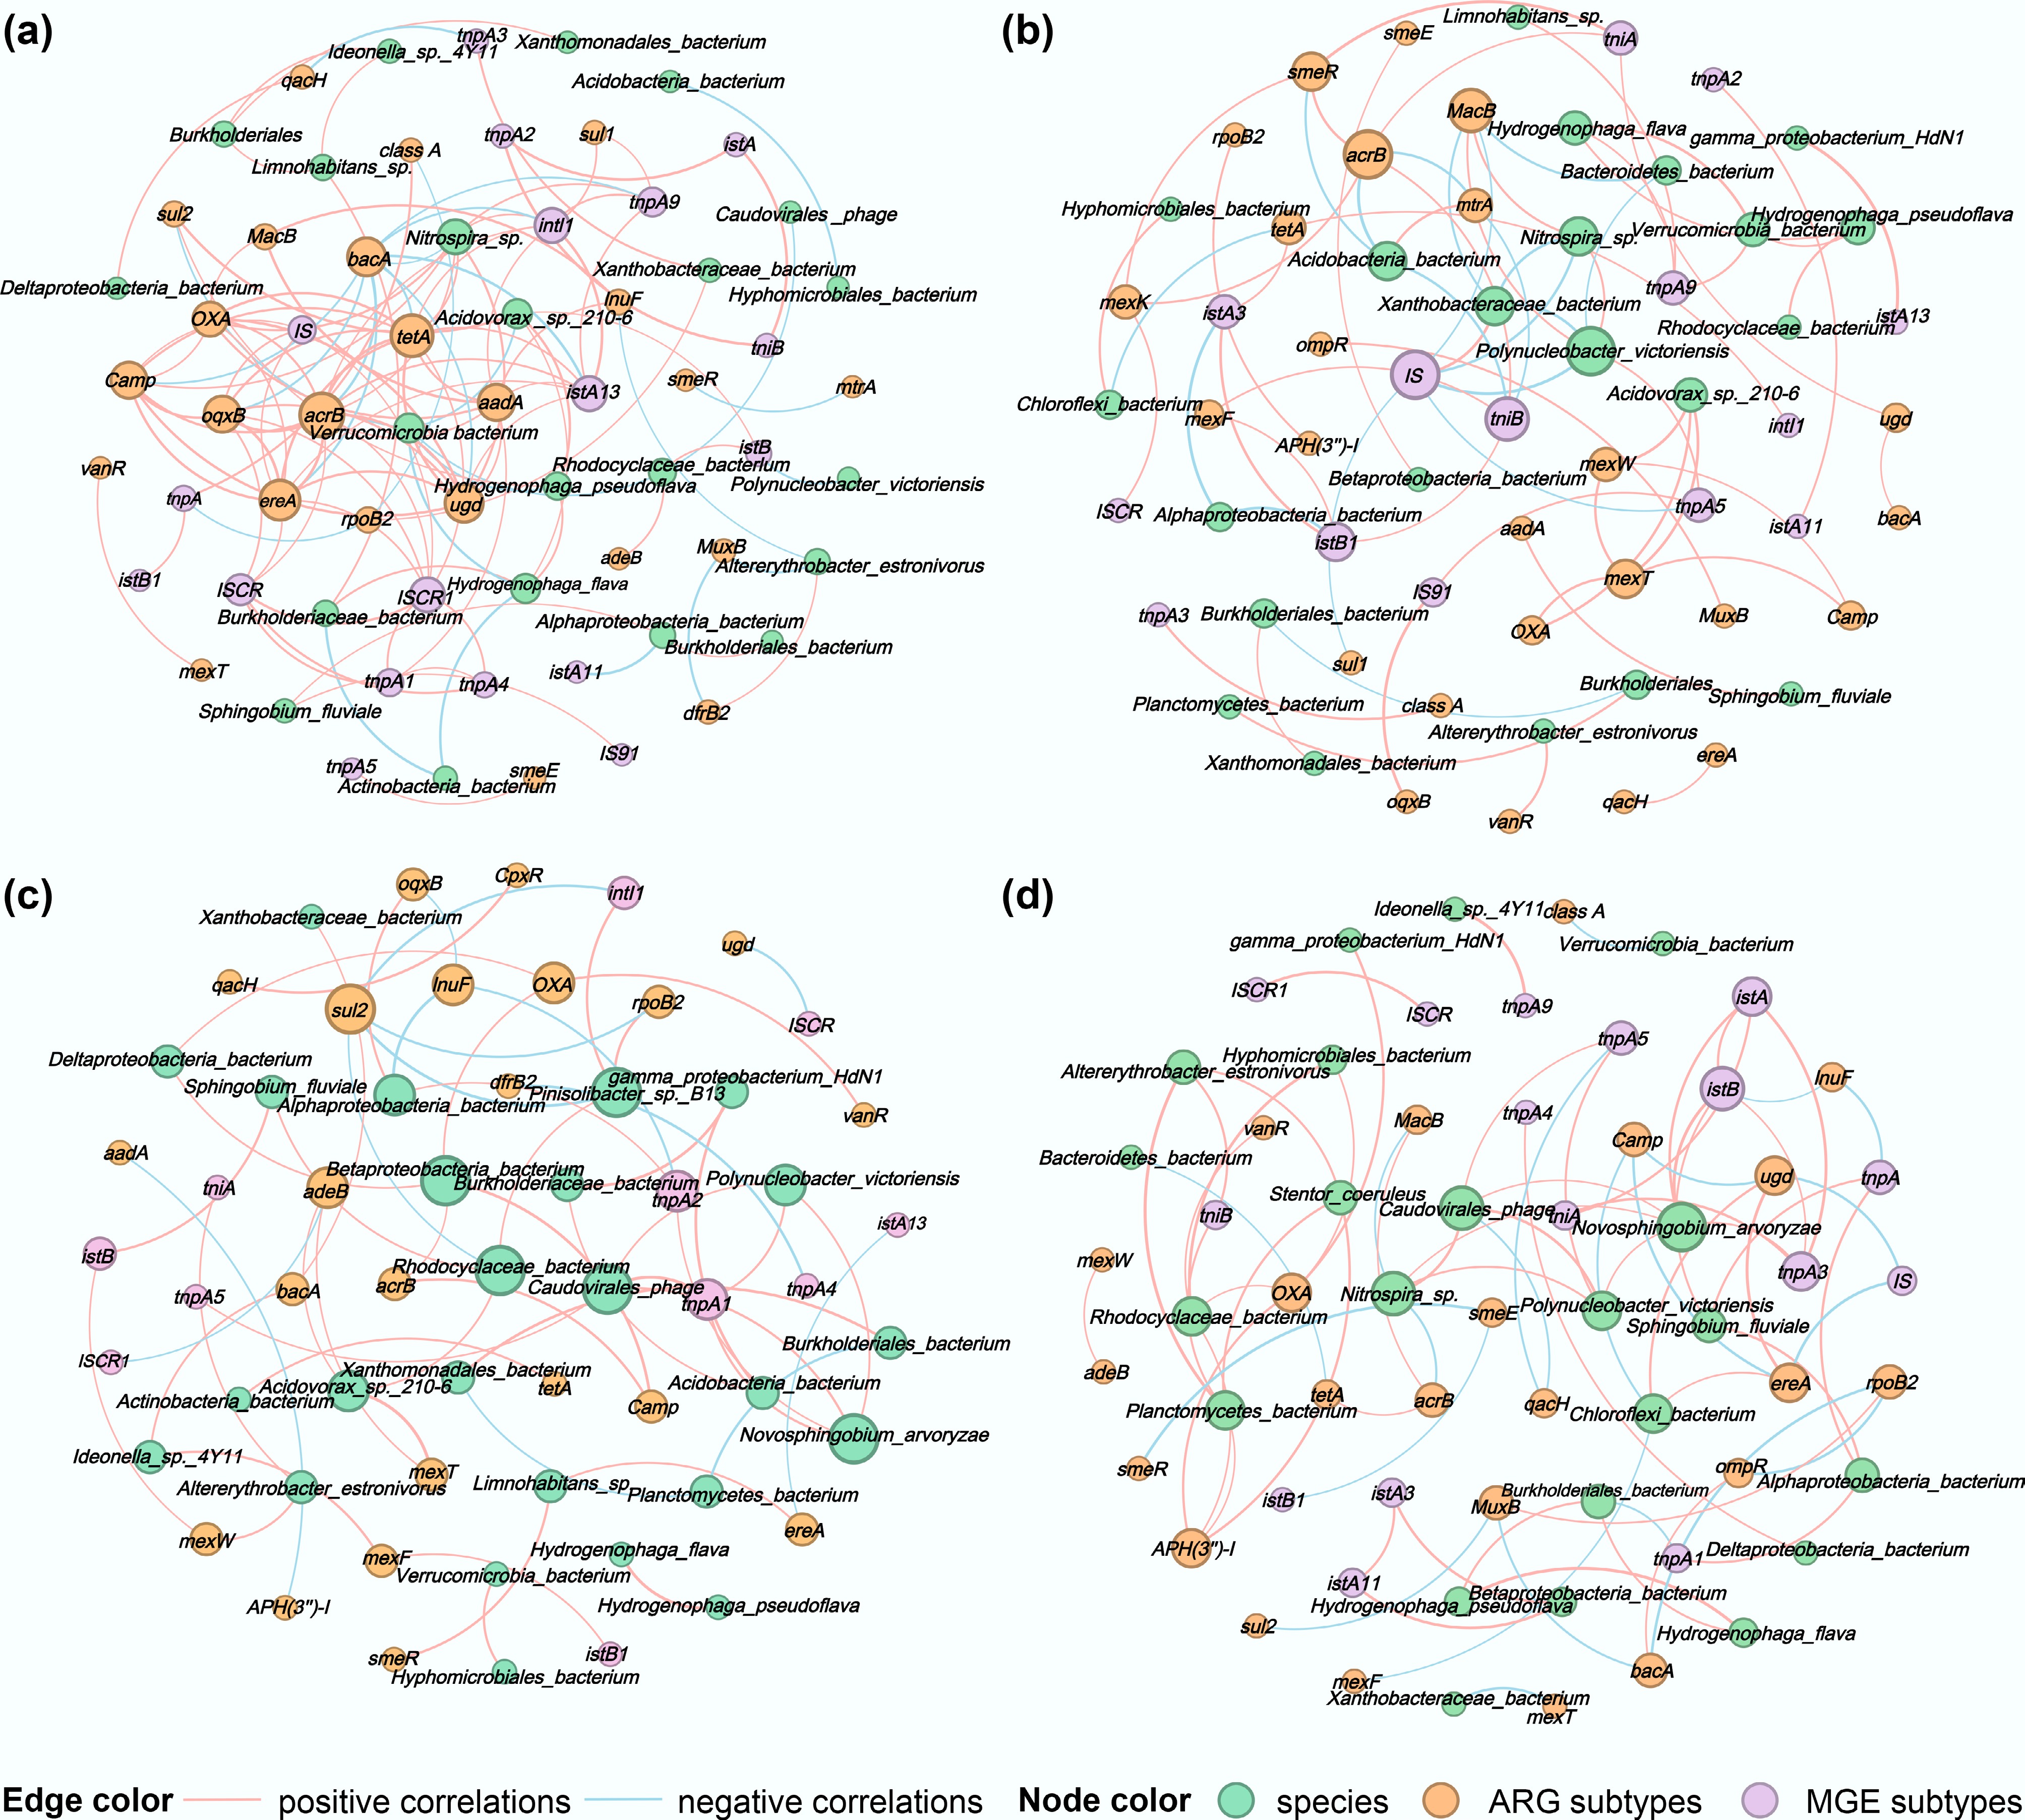
Figure 5.
Correlation network diagrams of surface microorganisms at the species level, ARG subtypes, and MGE subtypes for (a) water, (b) PLA, (c) PS, and (d) PVC. The nodes were colored by species, ARG, and MGE subtypes, and node size was ranked by degree (number of connections). The pink and blue edges represent positive and negative correlations, respectively. The thicker the line, the stronger the correlation.
-
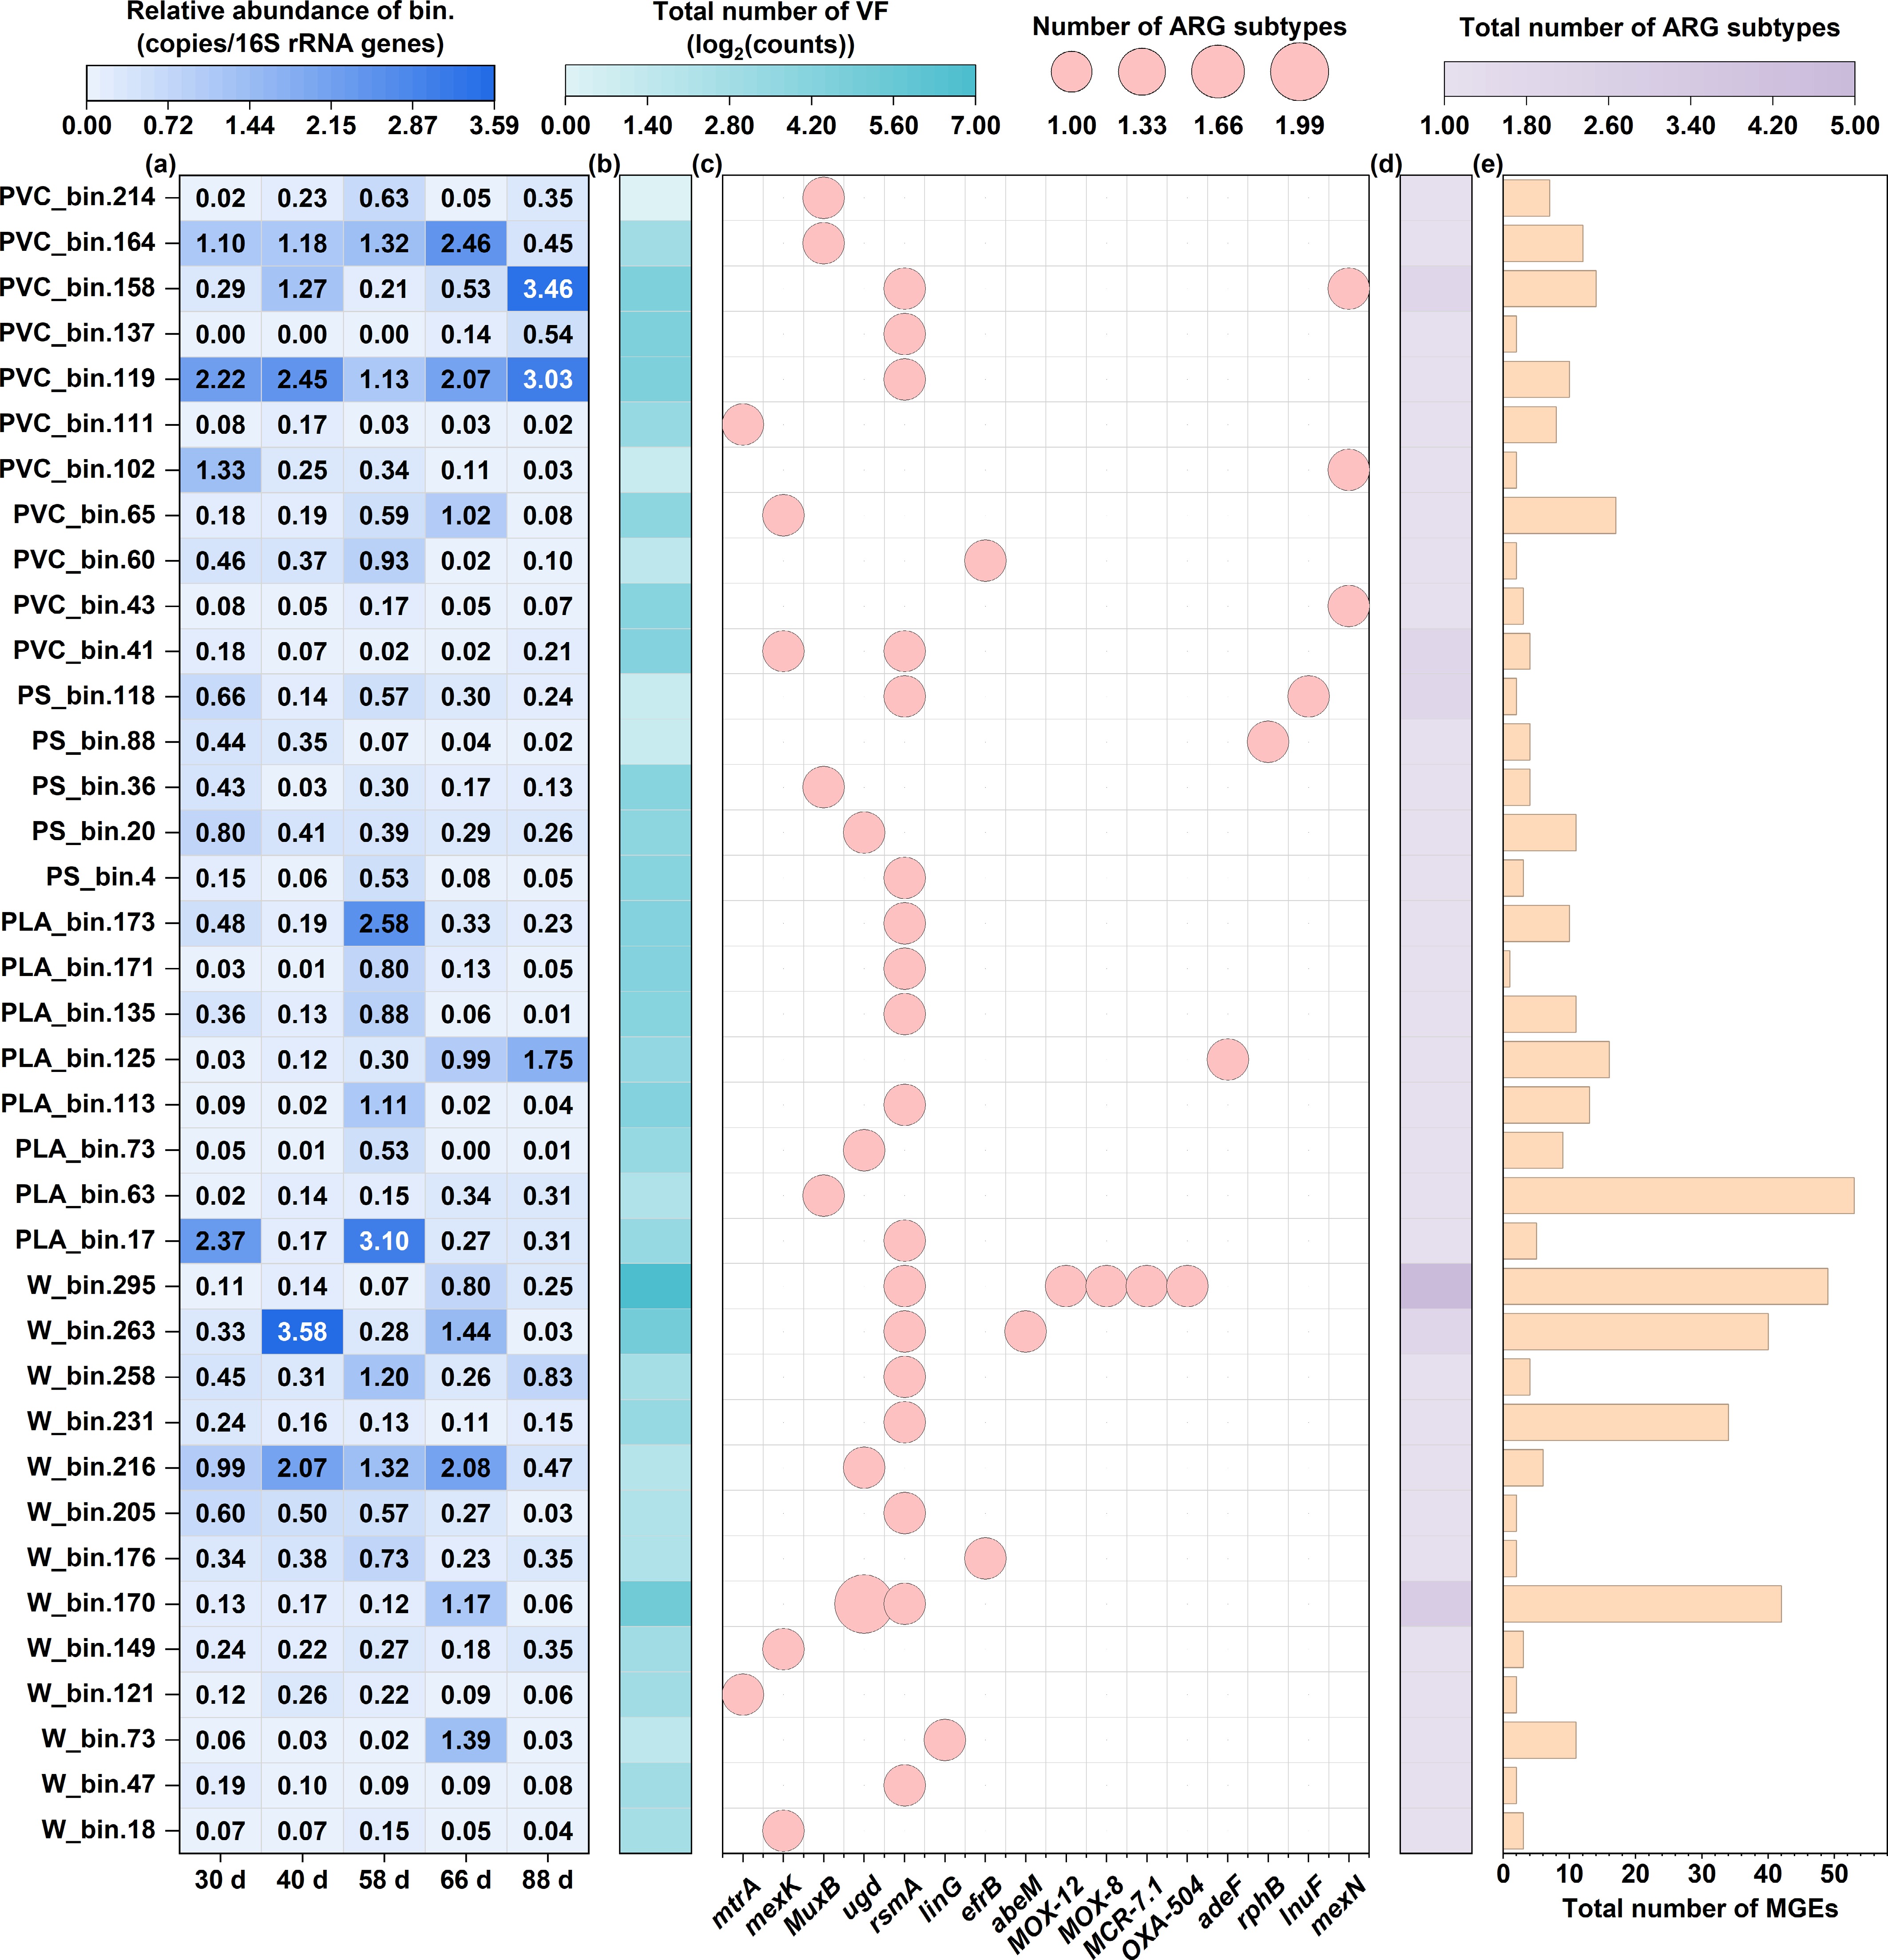
Figure 6.
The genome-centric analysis reveals the distribution of risk-associated genes across 37 high-quality MAGs. (a) Relative abundance heatmap of each MAG across all samples. (b) Total count of VFs identified per MAG. (c) Presence/absence matrix of ARG subtypes across the MAG. (d) Total count of unique ARG subtypes identified per MAG. (e) Total count of MGEs identified per MAG, indicating the potential for horizontal gene transfer.
Figures
(6)
Tables
(0)