-
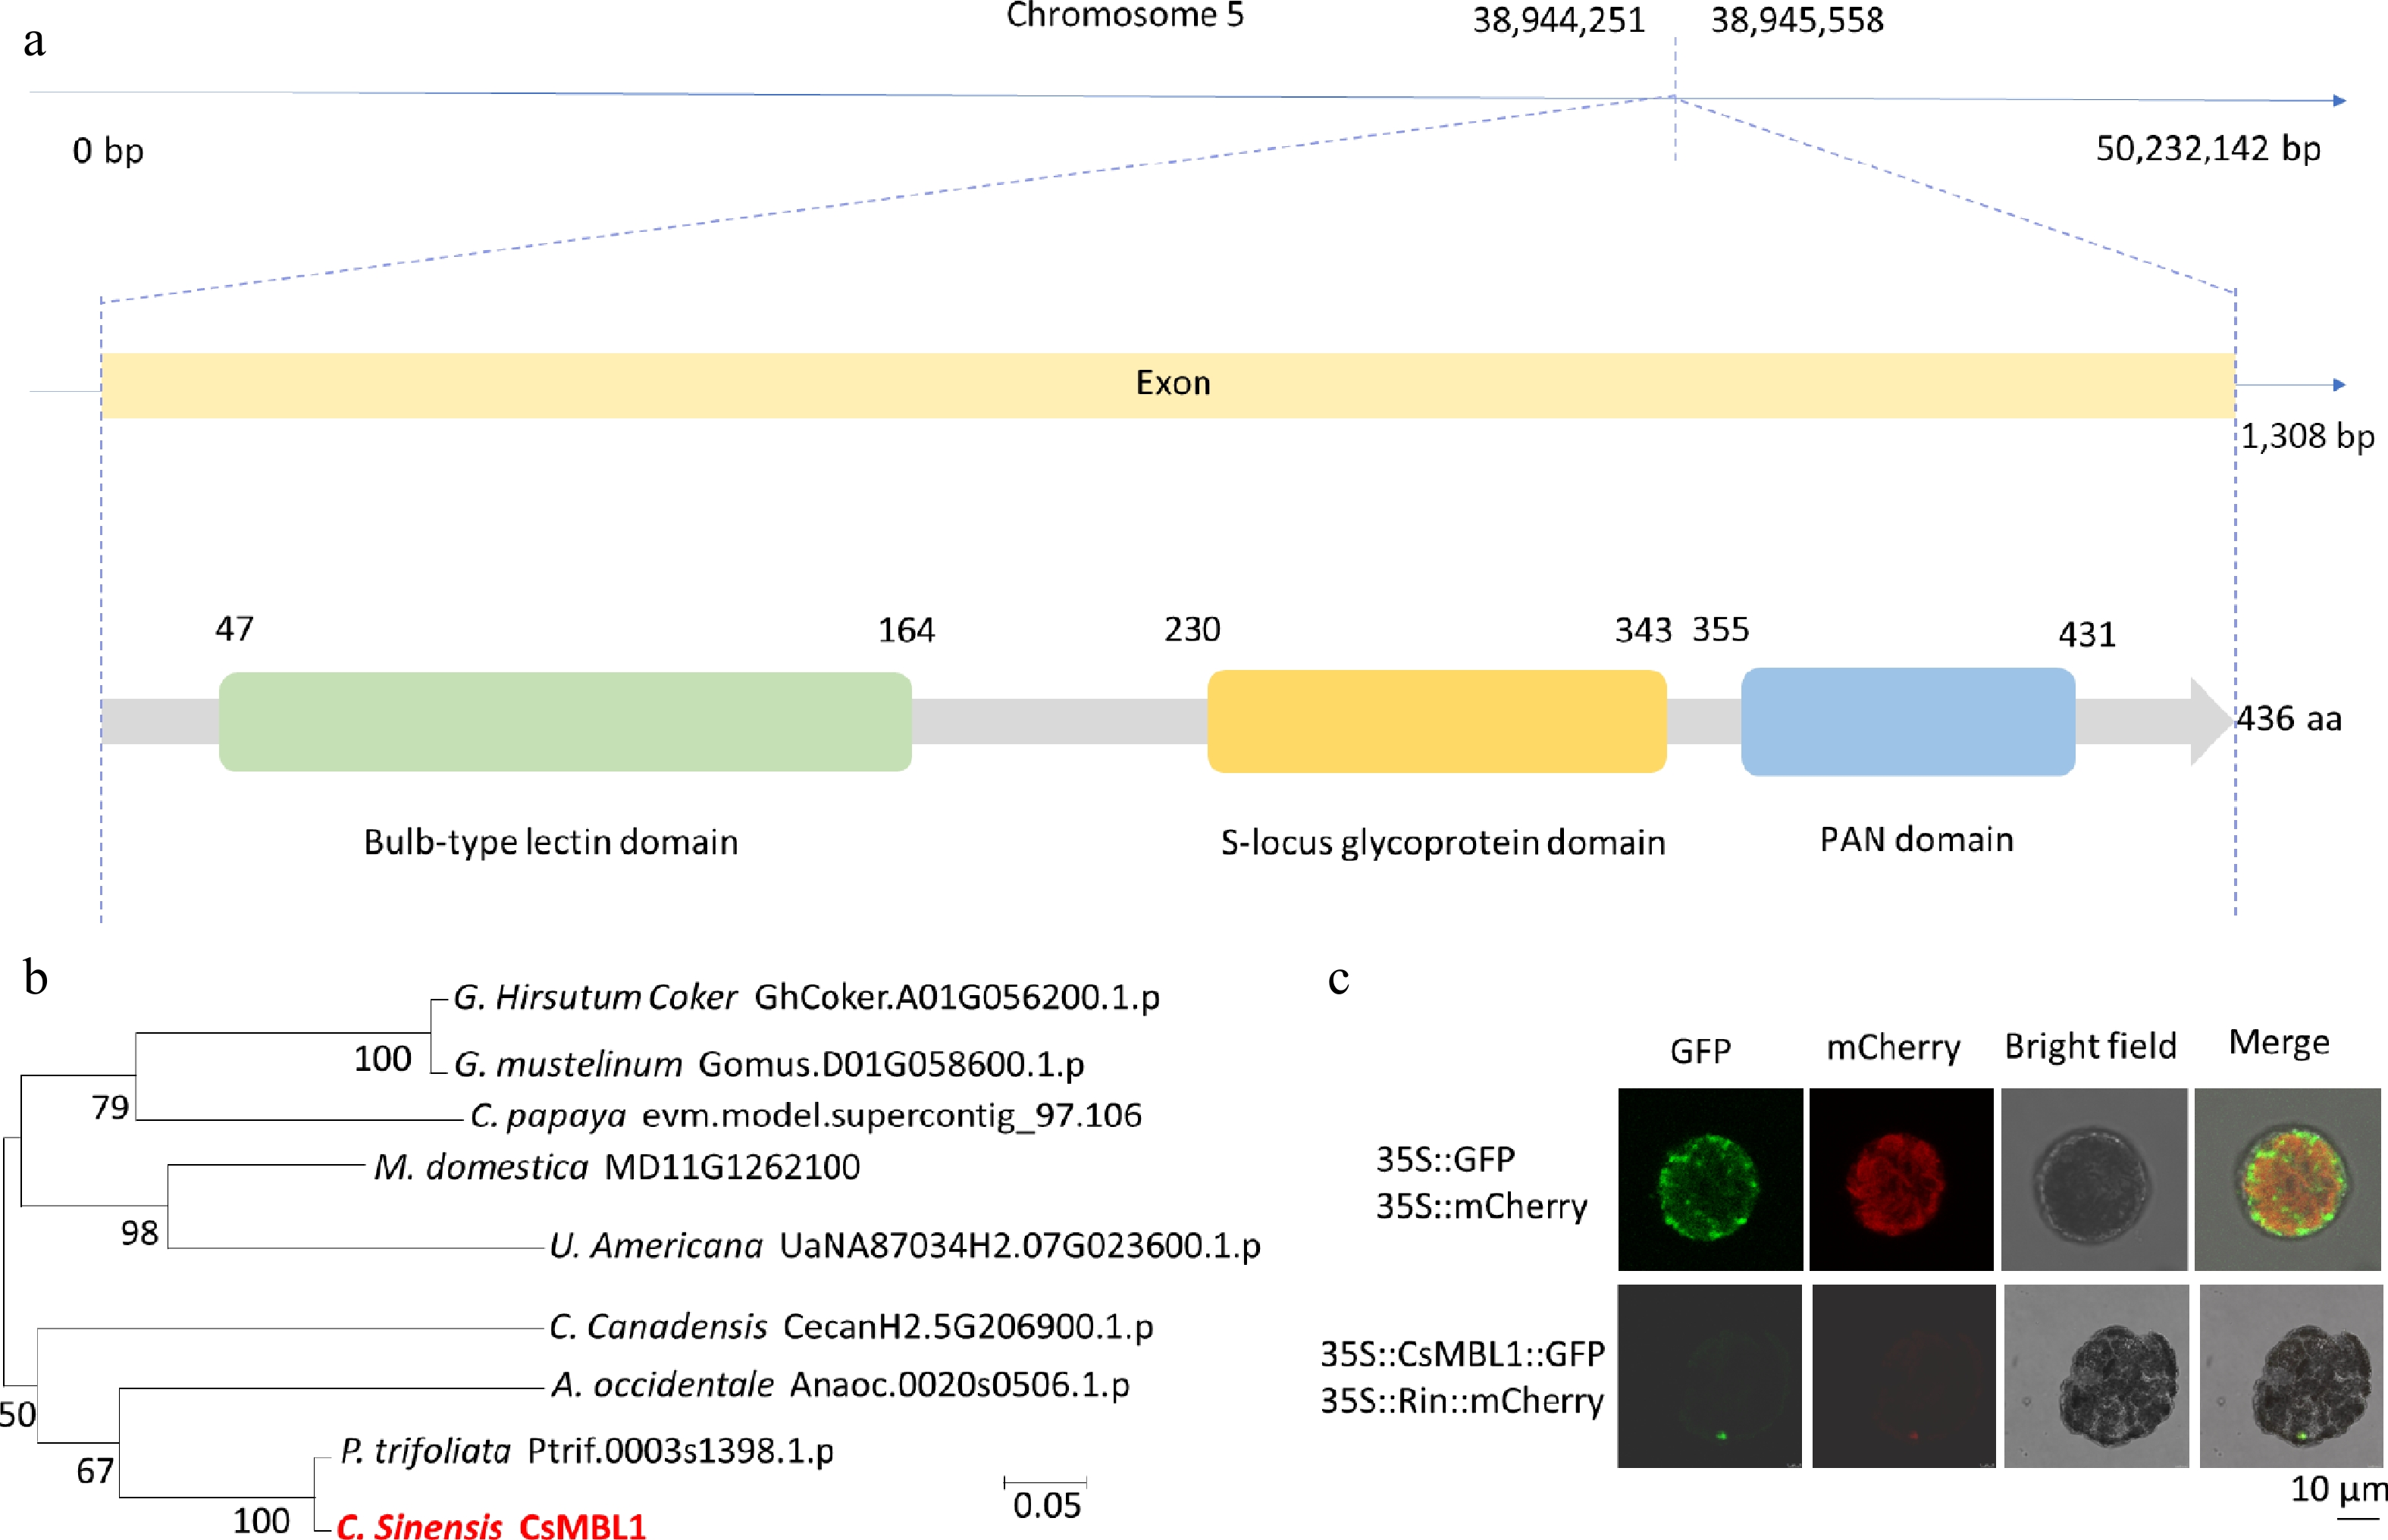
Figure 1.
Expression analysis and bioinformatics characterization of CsMBL1. (a) Chromosomal localization of CsMBL1 was identified using CPDB (internal reference), and its exon-intron structure was determined using GSDS V2.0. CsMBL1's functional domains were identified using HMMER. (b) MEGA X (bootstrap: 500, Poisson model) was employed to construct a maximum likelihood phylogenetic tree of CsMBL1 and its homologous proteins. Tree branches were proportional, with lengths representing the number of substitutions per site. Source species and protein IDs are indicated on the right side of the phylogenetic tree. (c) CsMBL1 had a subcellular localization in Nicotiana benthamiana protoplasts. Images show GFP (green fluorescent protein), mCherry (red fluorescent protein), bright field, and merged channels. Scale bar = 10 μm.
-
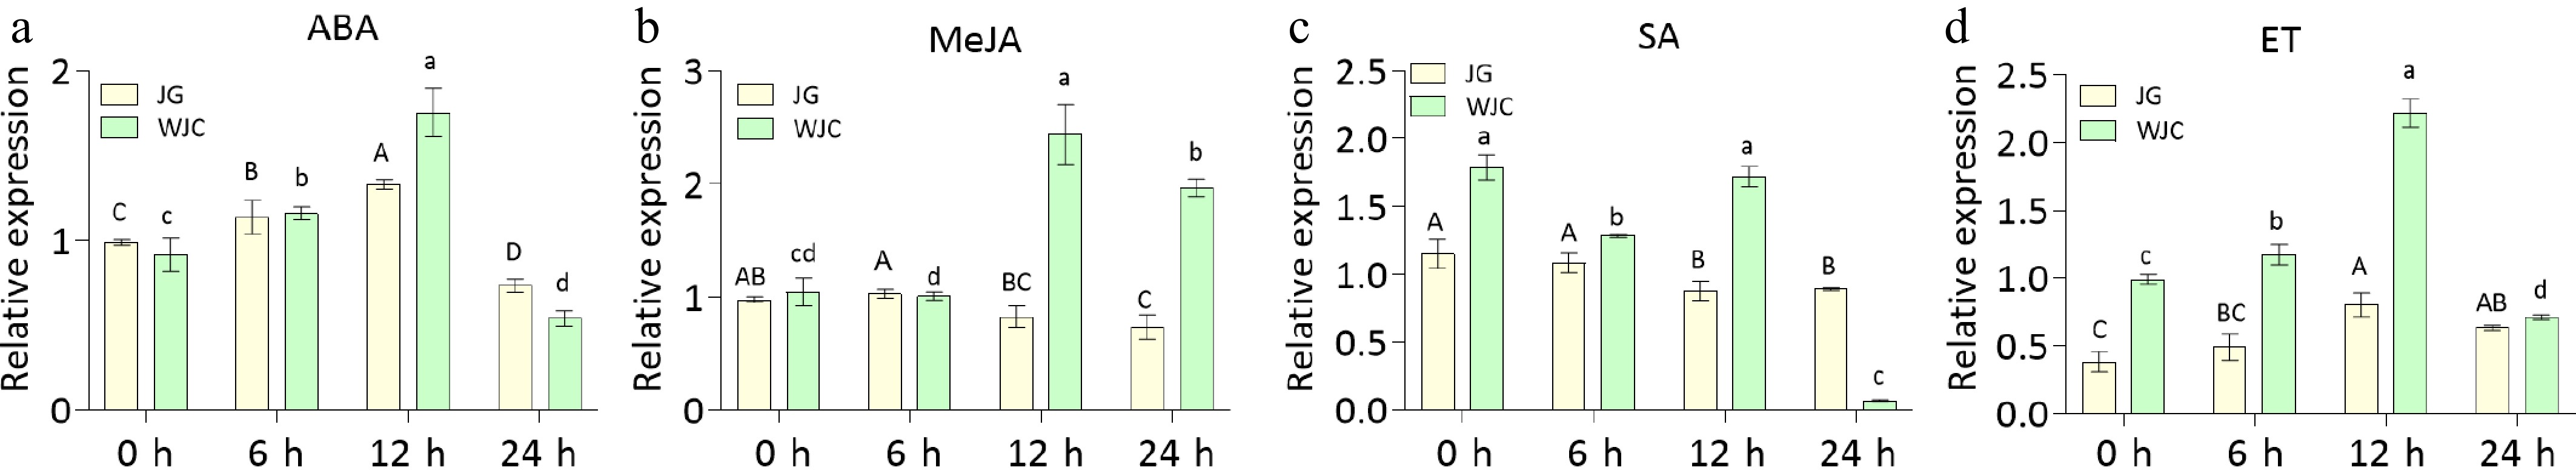
Figure 2.
Effects of phytohormone treatments on CsMBL1 expression in plants. qRT-PCR analysis of CsMBL1 expression in kumquat and Wanjincheng leaves following treatments with (a) ABA, (b) MeJA, (c) SA, (d) ET, and H2O (control). CsGAPDH (CPDB ID: Cs_ont_5g044290) was used as the internal reference gene. Statistical comparisons were performed using ANOVA with Duncan's multiple range test. WJC: Wanjincheng; JG: Kumquat.
-
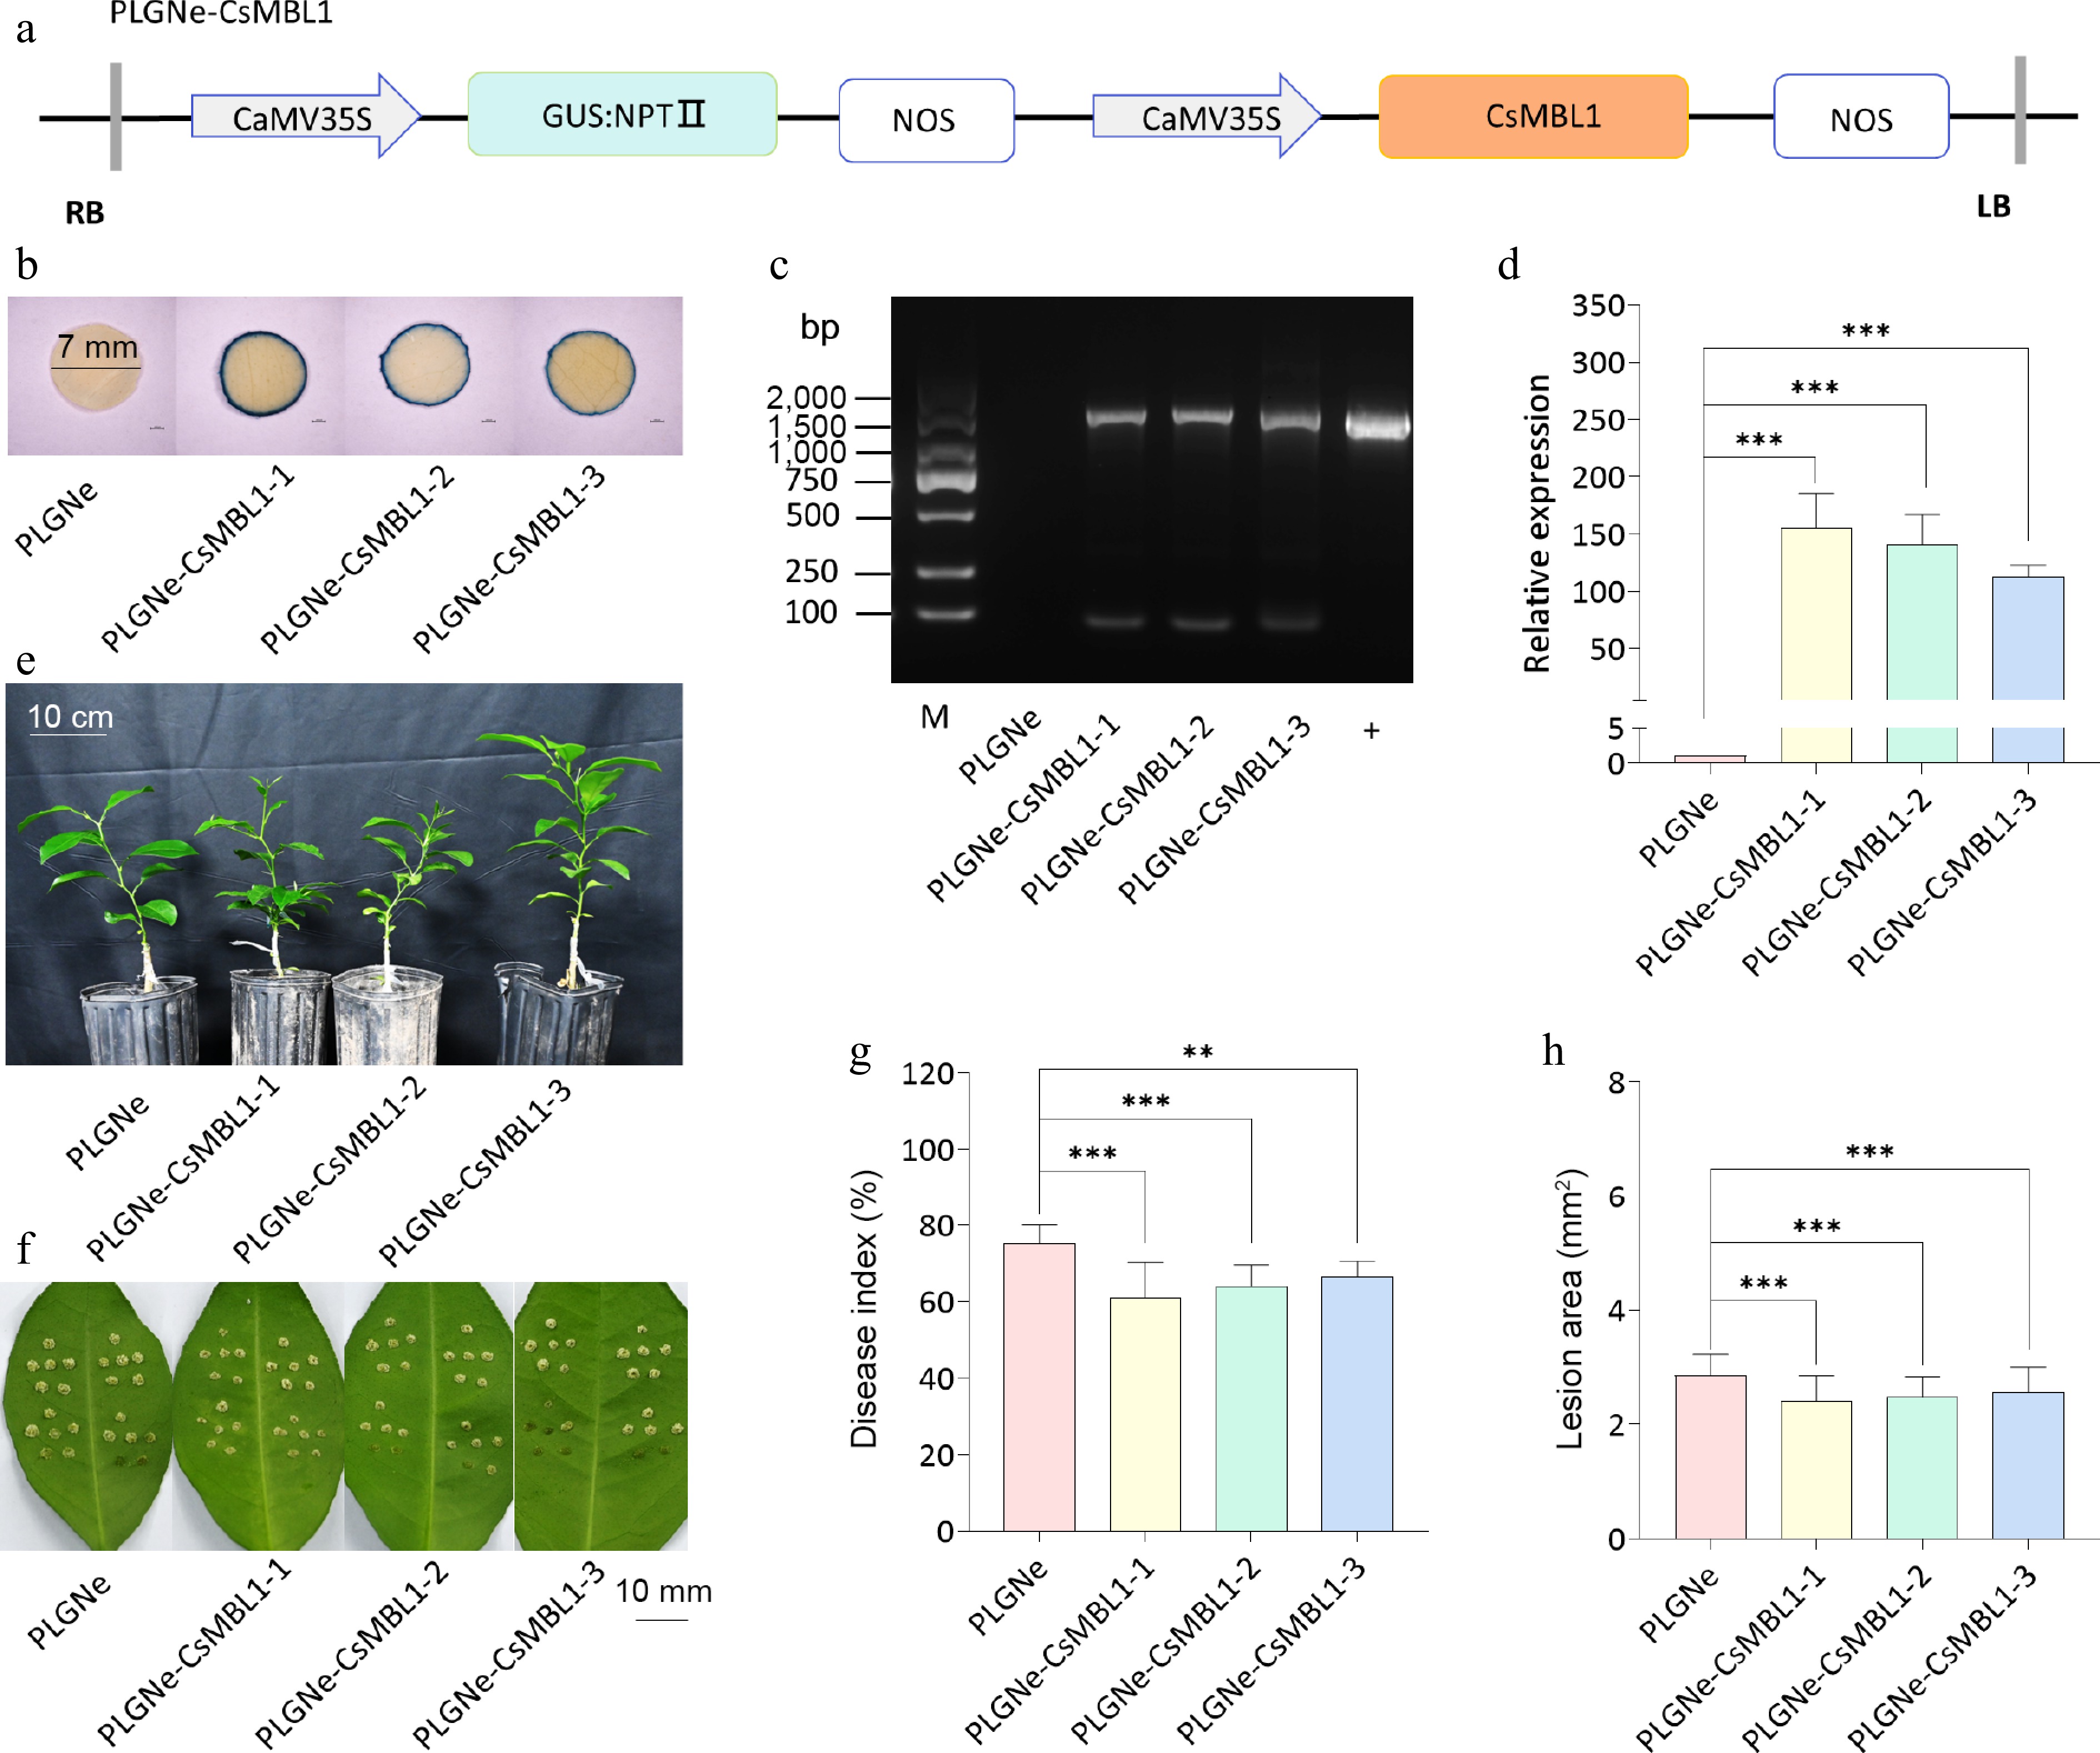
Figure 3.
Effects of CsMBL1 overexpression on citrus canker resistance. (a) CsMBL1 overexpression vector. (b) GUS staining results. Blue staining indicates transgenic plants. (c) PCR validation of transgenic plants. M: DNA marker; +: pLGNe-CsMBL1 plasmid. (d) The expression of CsMBL1 relative to CsGAPDH. The control value was set to 1. Data are presented as mean ± SD of three replicates. (e) Phenotype of transgenic plants. (f) citrus canker symptoms in Xcc-infected leaves at 10 dpi. (g) Lesion disease, and (h) area index in CsMBL1-overexpressing plants at 10 dpi. (b)−(h) pLGNe-CsMBL1-1, -2, -3: CsMBL1-overexpressing materials, while pLGNe: control plants carrying the pLGNe vector. Data was statistically analyzed using Tukey's multiple range test (p < 0.05). NPTII: neomycin phosphotransferase II, NOS: NOS terminator, 35S: CaMV 35S promoter, GUS: β-glucuronidase and npt-linked coding gene, LB: left border, RB: right border, dpi: days post-infection.
-
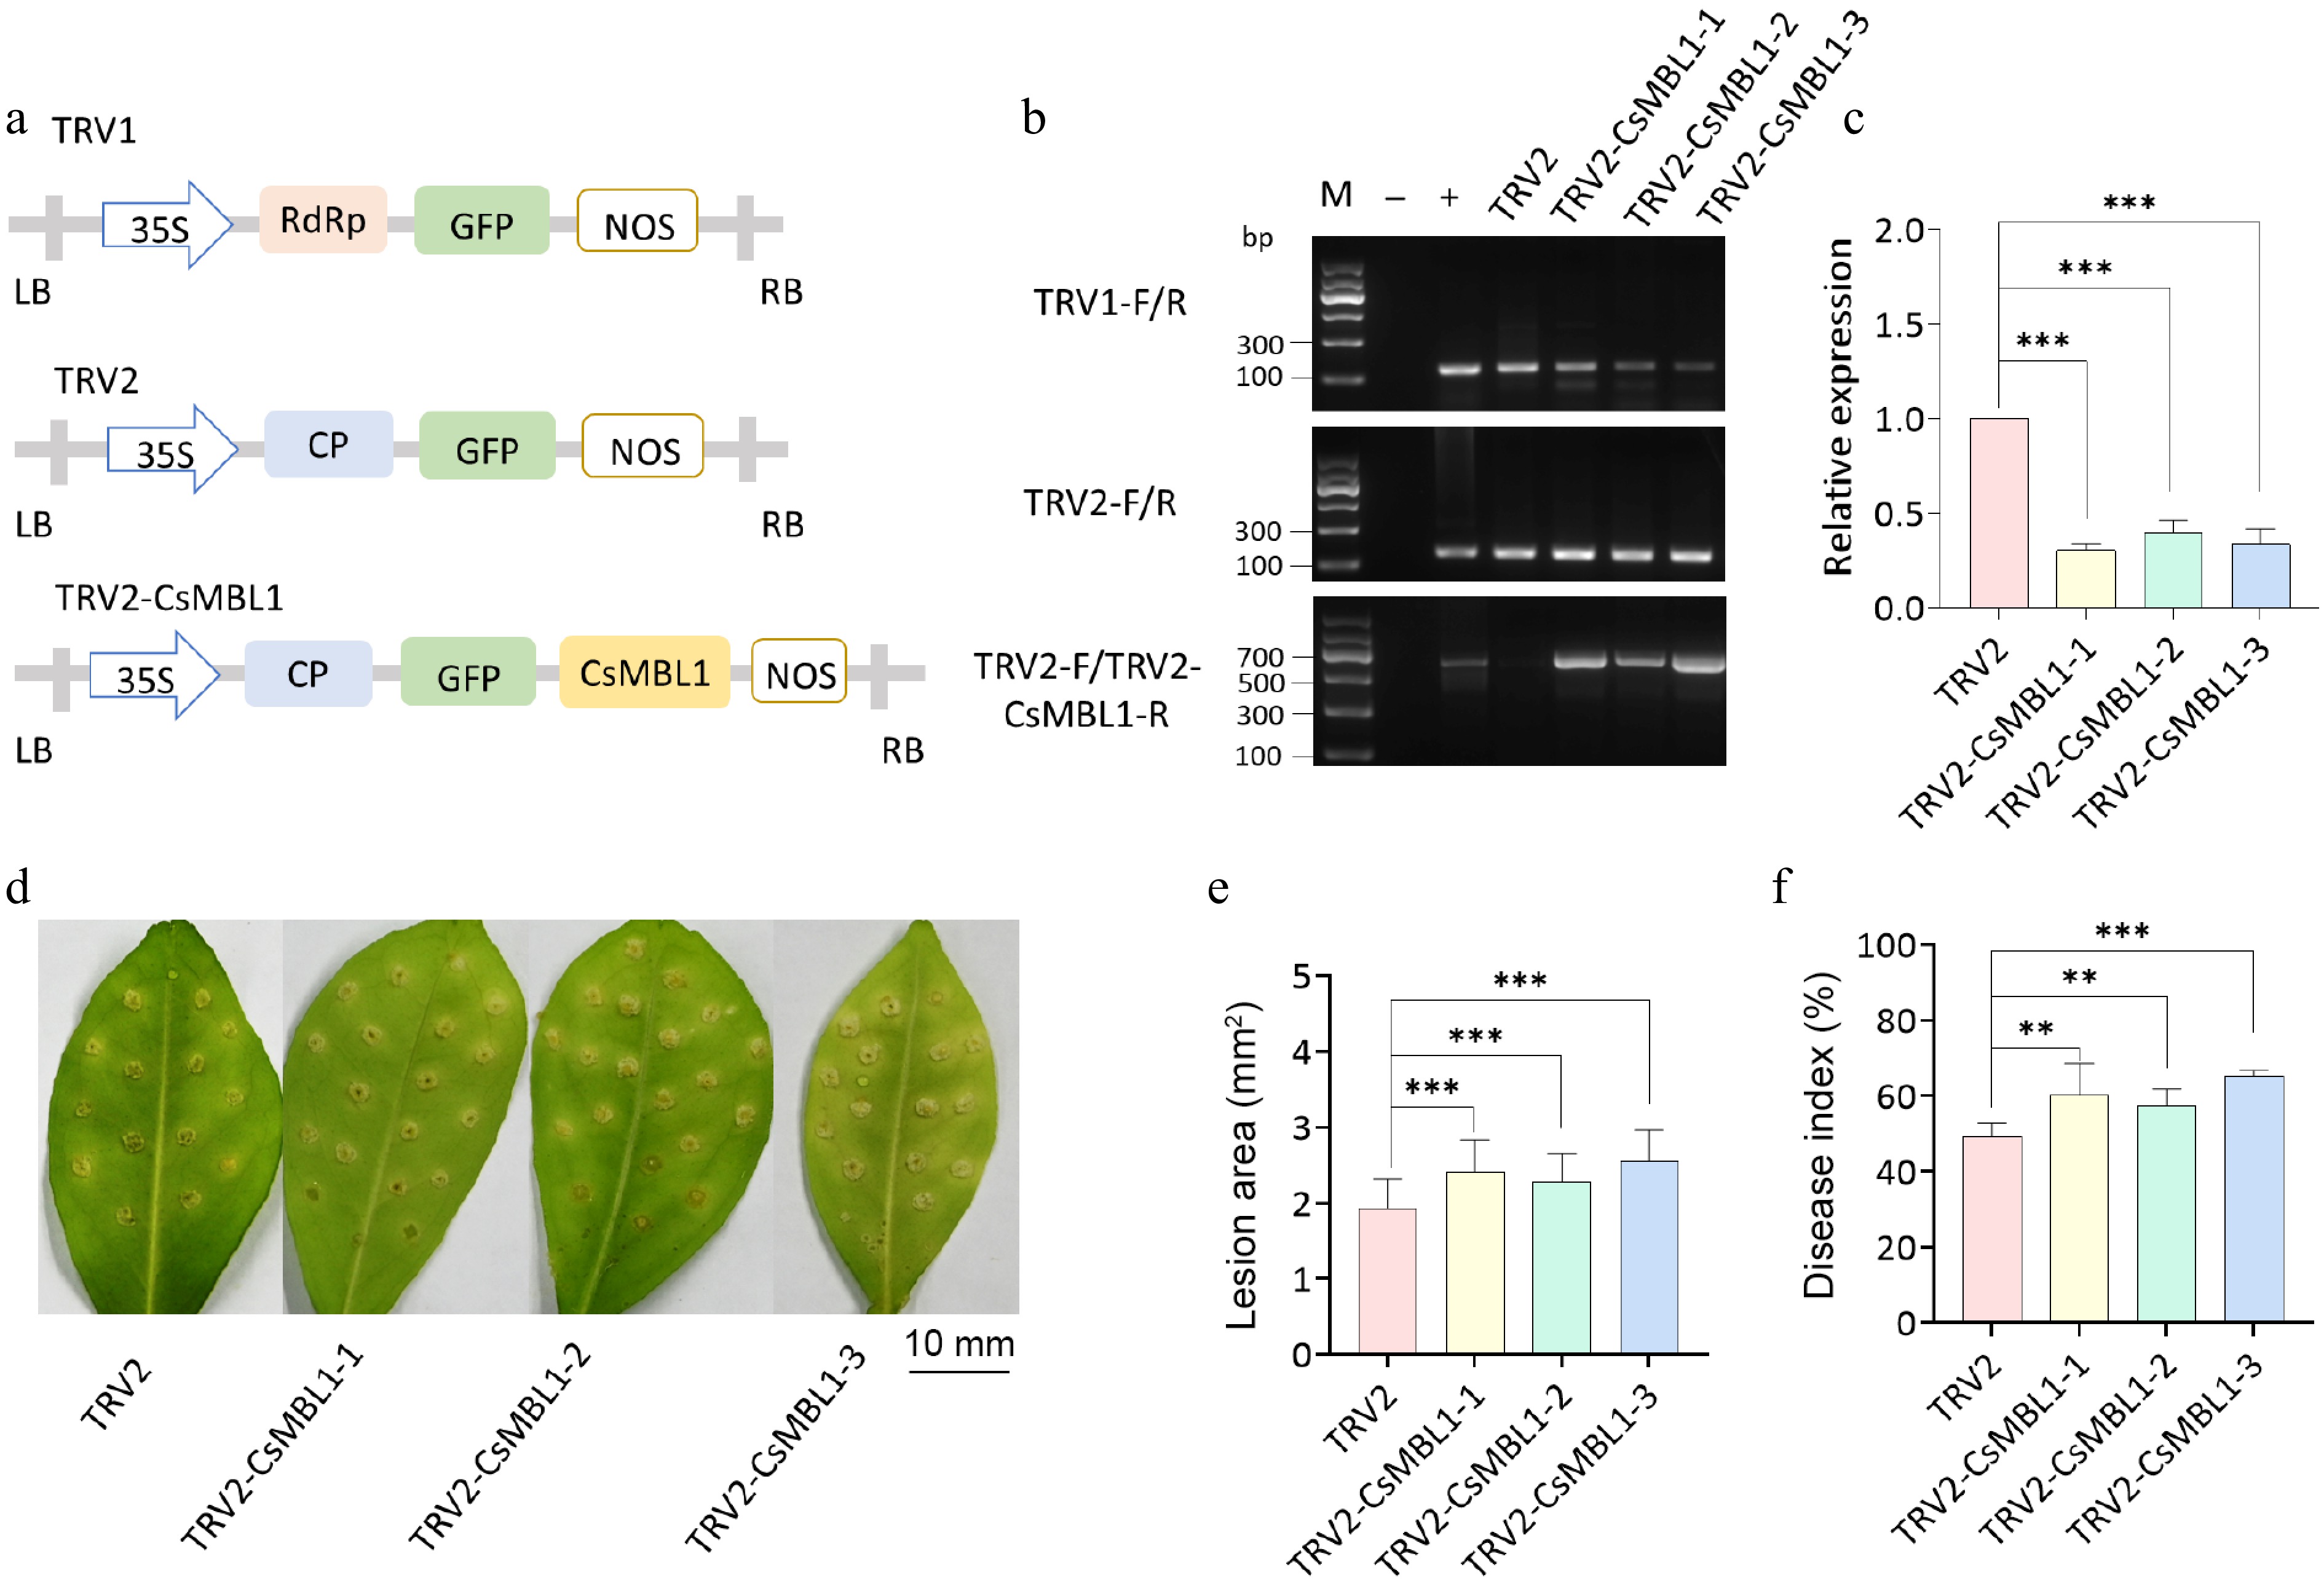
Figure 4.
Effect of CsMBL1 silencing on citrus canker resistance. (a) Plasmid used for VIGS. (b) Successful transformation of VIGS plants was confirmed by PCR. M indicates DNA Marker, "–" represents ddH2O, and "+" depicts plasmid. Primers used are shown on the left side of the gel electrophoresis image. (c) Relative CsMBL1 expression was assessed by qRT-PCR using CsGAPDH as a control. The control value was set to 1, and the data represent the average of three biological replicates. (d) Disease symptoms, (e) lesion area, and (f) disease index of Xcc-infected VIGS plants at 10 dpi. (b)–(f) TRV2-CsMBL1-1, -2, and -3: CsMBL1 VIGS plants; TRV2: control plants carrying the TRV2 vector (ANOVA with Tukey's multiple range test, p < 0.05). VIGS: virus-induced gene silencing (VIGS), 35S: Cauliflower mosaic virus 35S promoter, NOS: NOS terminator, GFP: green fluorescent protein, RdRp: RNA-dependent DNA polymerase, CP: coat protein, LB: left border, RB: right border.
-
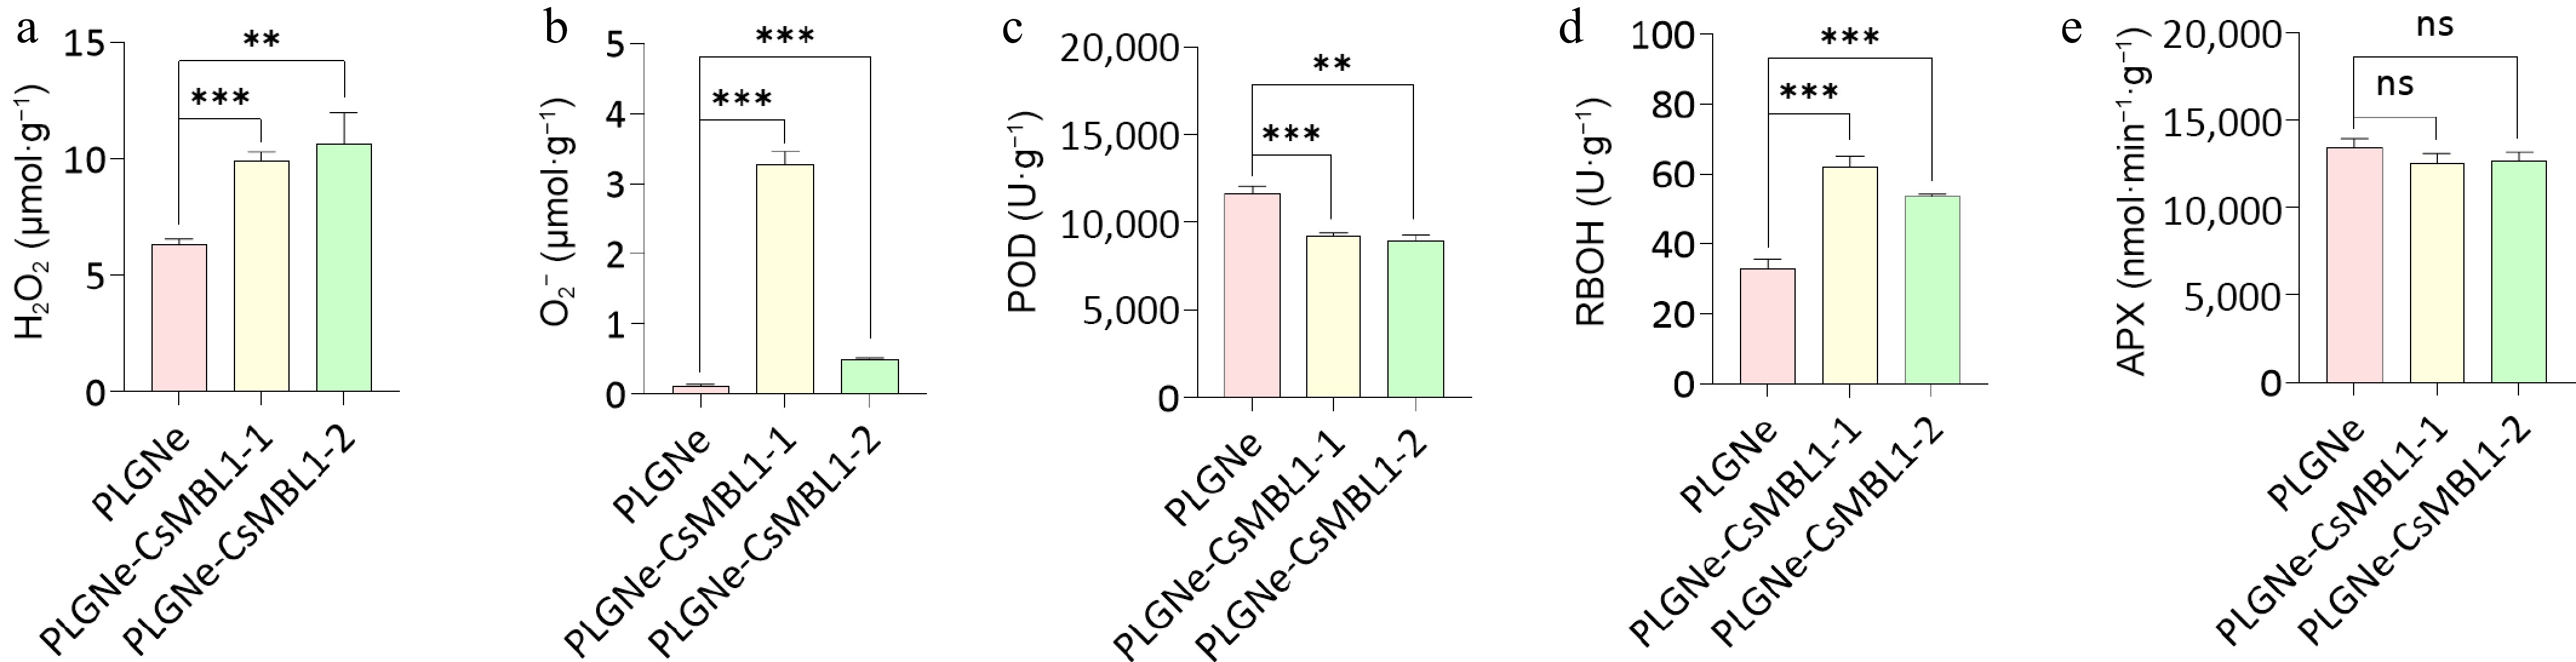
Figure 5.
Effects of CsMBL1 overexpression on plant ROS levels. The contents of (a) H2O2, (b) O2−, and activities of (c) POD, (d) RBOH, and (e) APX were measured in CsMBL1-overexpressing plants. PLGNe-CsMBL1-1/-2: CsMBL1-overexpressing transgenic lines, PLGNe: Control plants carrying the empty PLGNe vector. Data were analyzed by ANOVA with Tukey's multiple range test, p < 0.05.
-
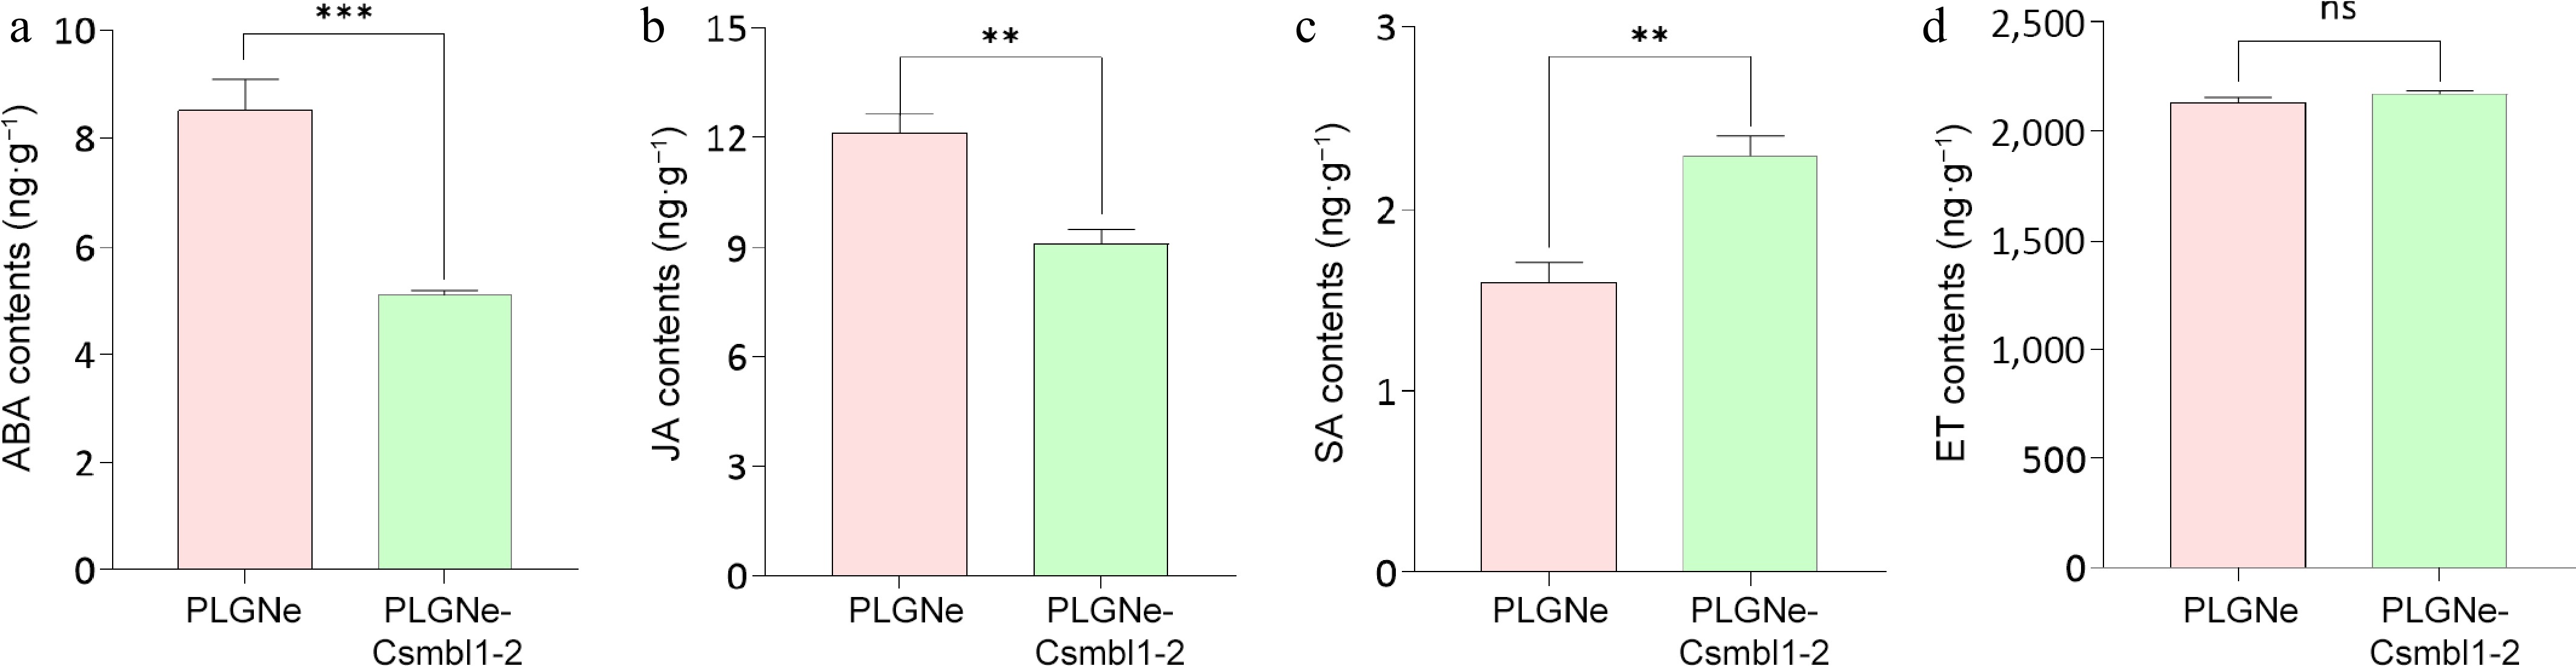
Figure 6.
Effects of CsMBL1 overexpression on phytohormone levels. Concentrations of (a) ABA, (b) JA, (c) SA, and (d) ET were measured in CsMBL1-overexpressing plants. In (a)−(d): PLGNe-CsMBL1-2: CsMBL1-overexpressing plants. PLGNe: Control plants with an empty PLGNe vector. Data were statistically analyzed by ANOVA with Tukey's multiple range test (p < 0.05).
Figures
(6)
Tables
(0)