-
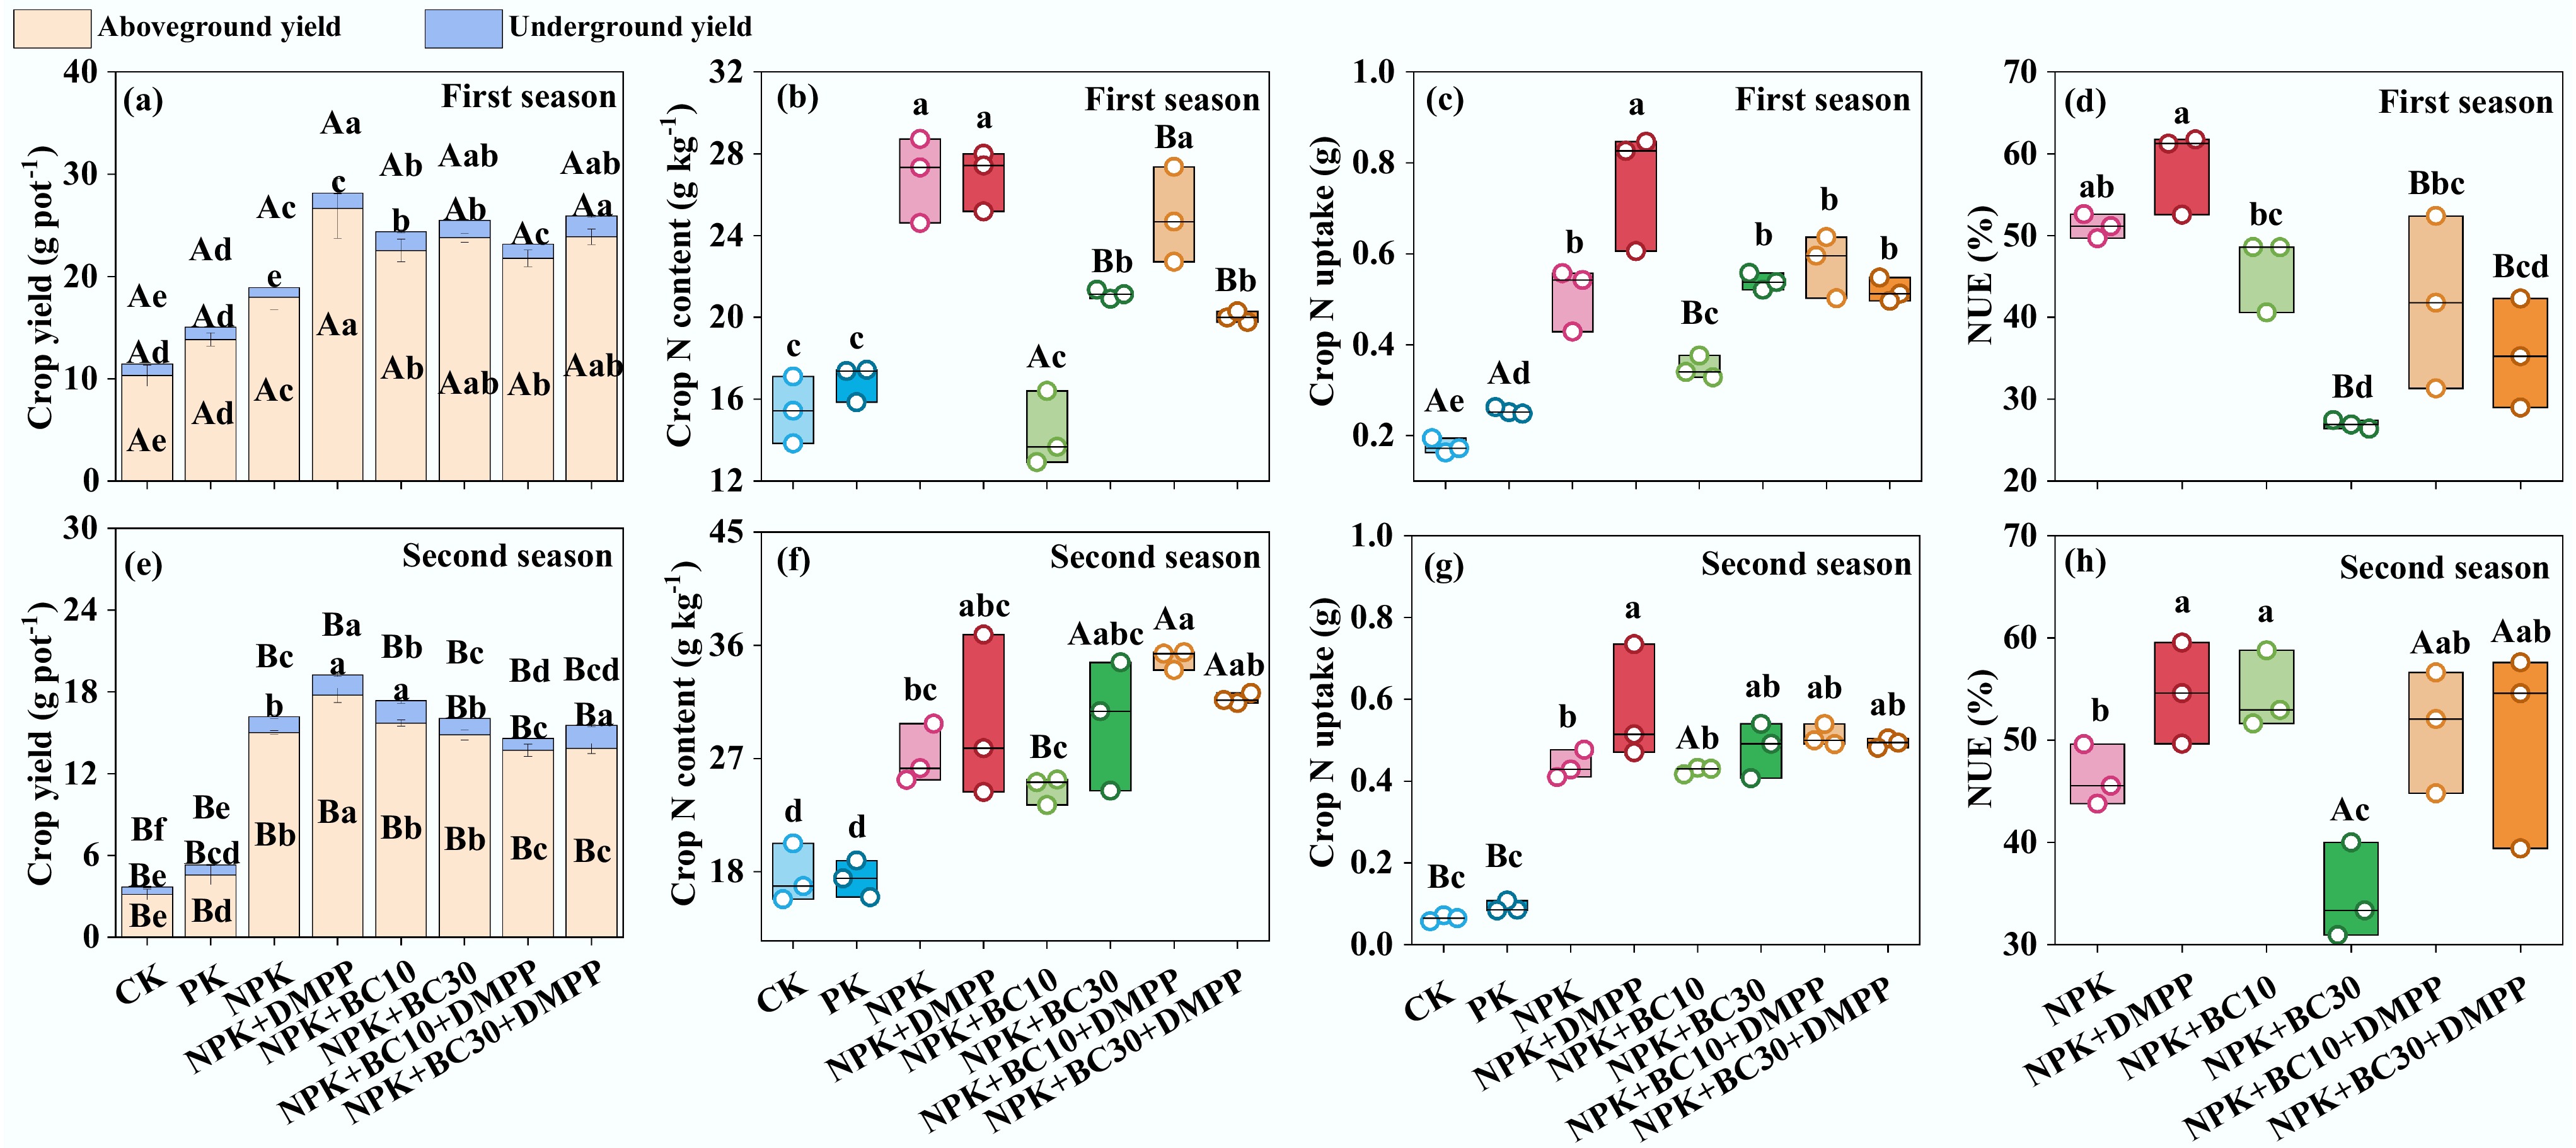
Figure 1.
Changes in (a), (e) crop yield, (b), (f) crop N content, (c), (g) crop N uptake, (d), (h) NUE after fertilizer application during the first and second seasons. Different lowercase and uppercase letters indicate significant differences between fertilization treatments and growing seasons, respectively. The absence of letters indicates no significant differences. The values represent the average ± standard deviation (n = 3).
-
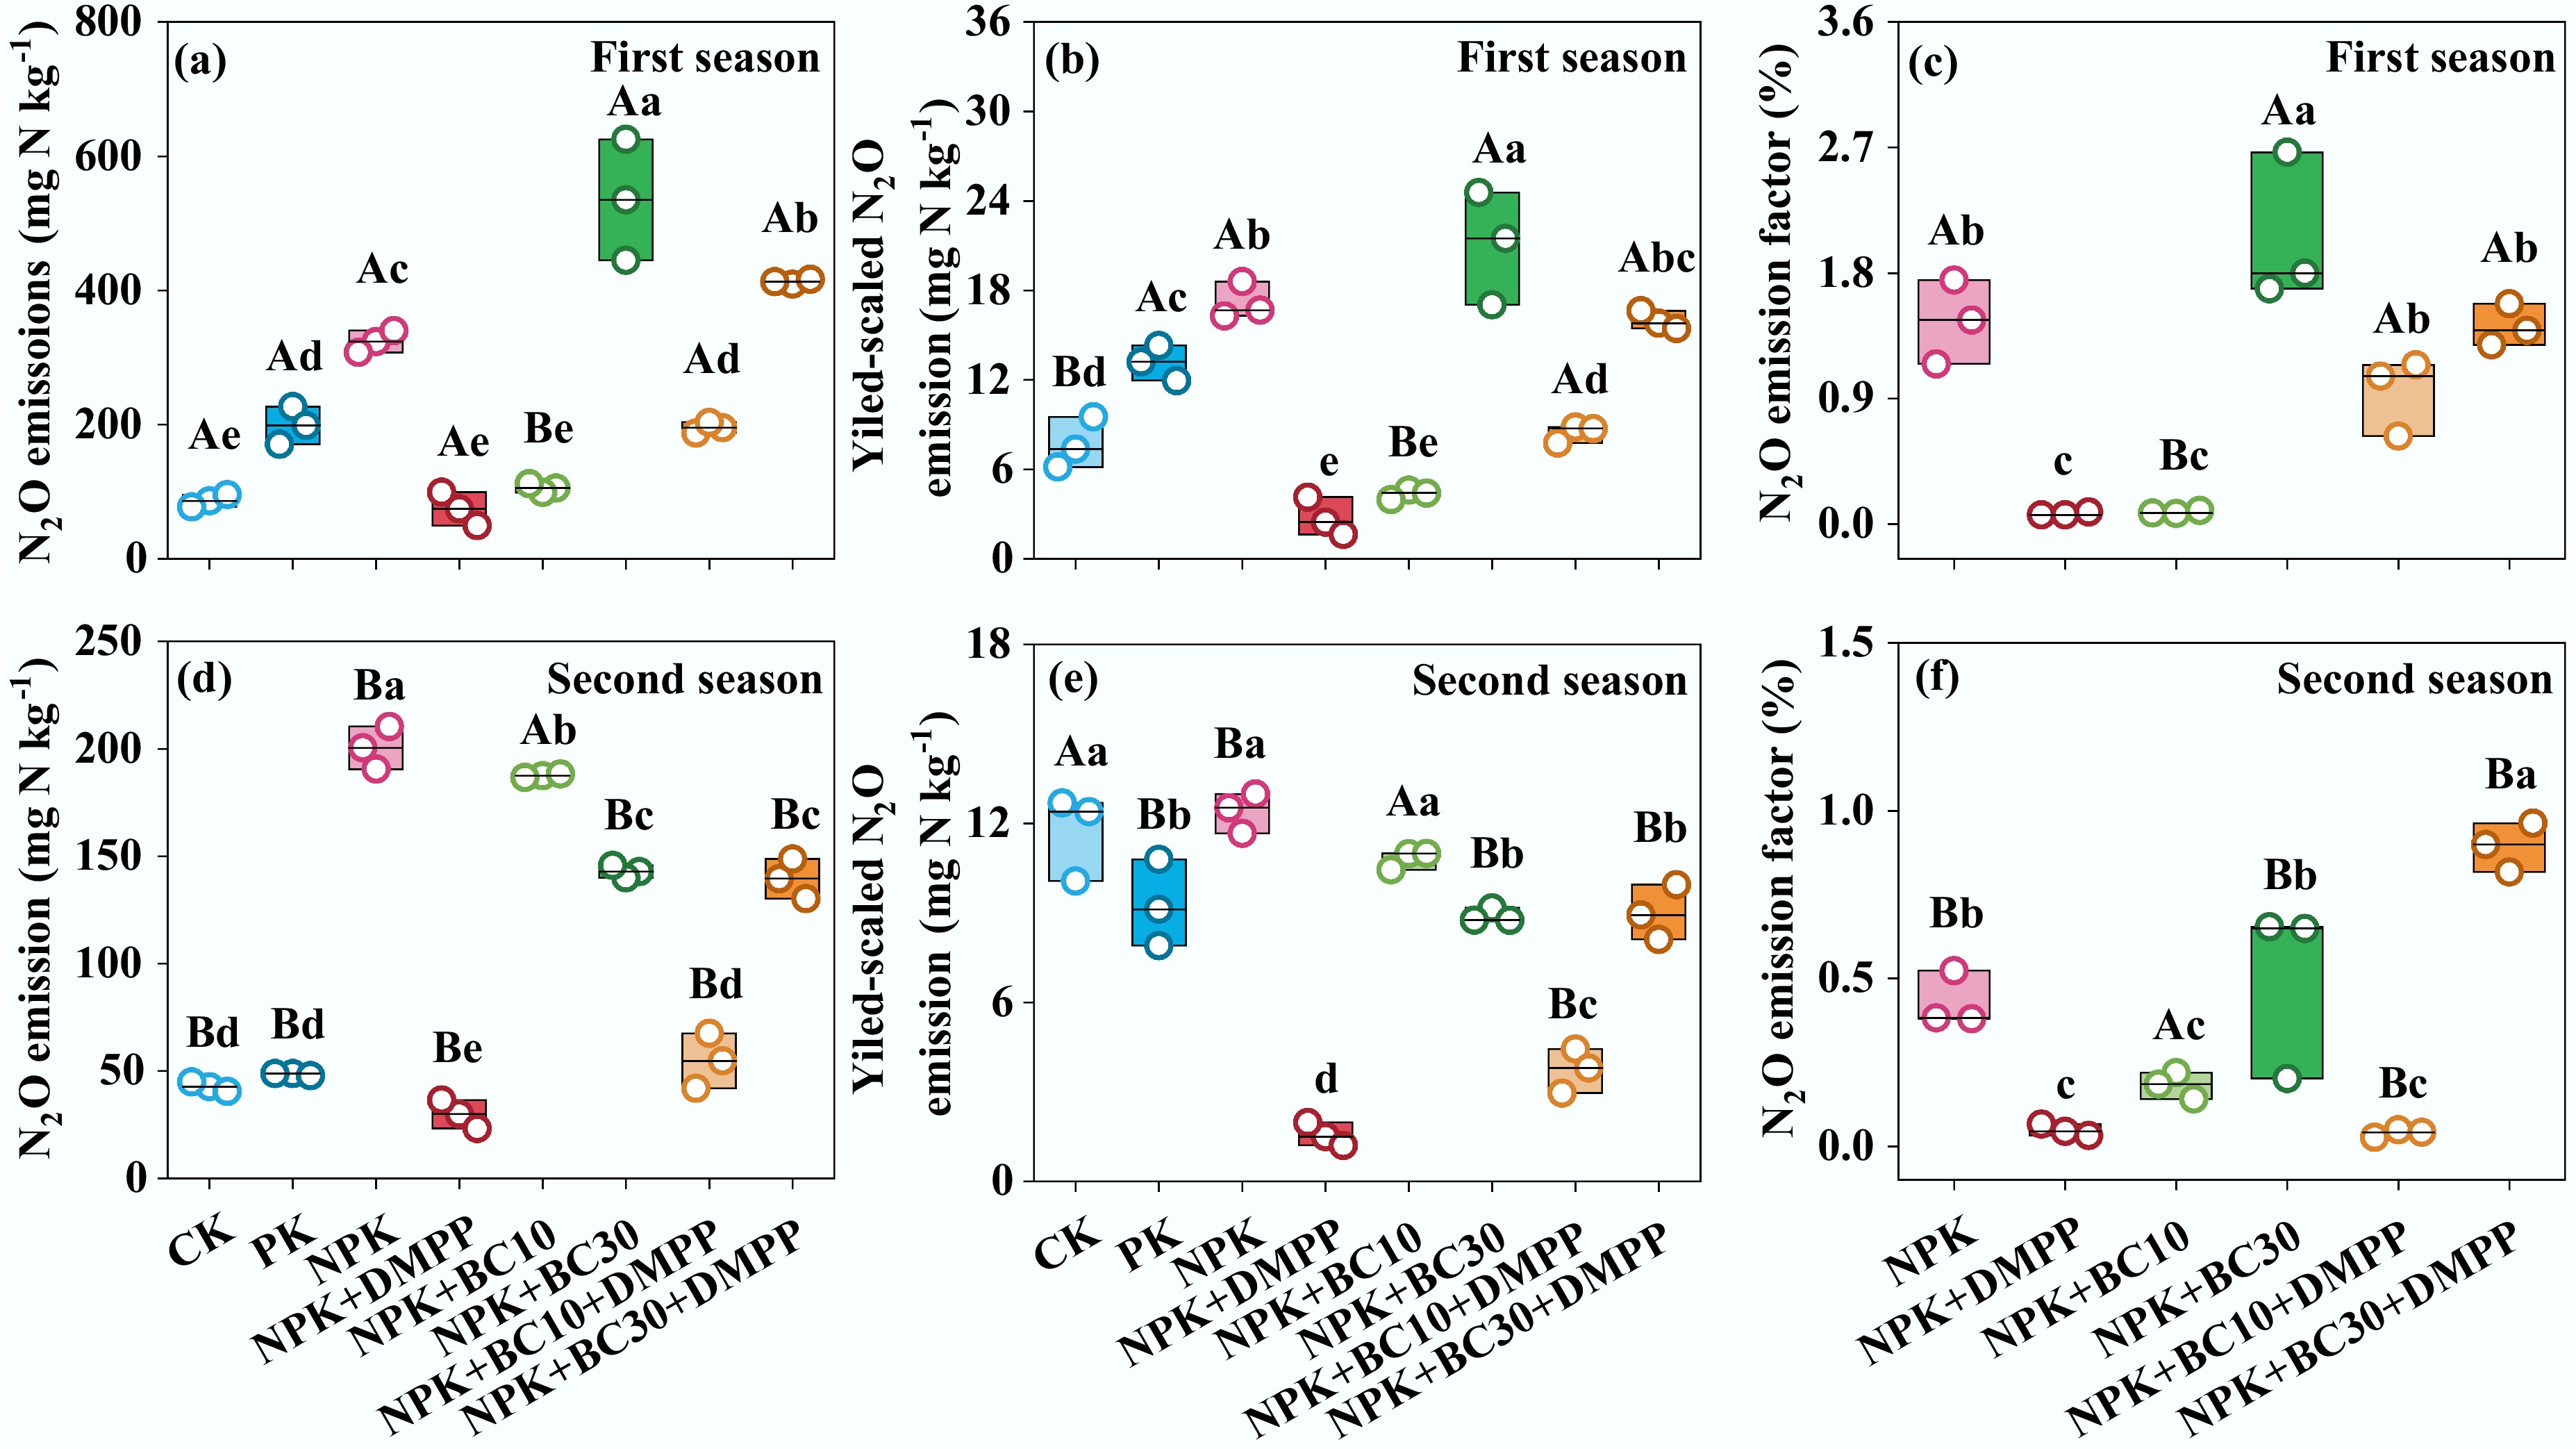
Figure 2.
Changes in (a), (d) cumulative N2O emission, (b), (e) yield-scaled N2O emission, and (c), (f) N2O emission factor after fertilizer application during the first and second seasons. Different lowercase and uppercase letters indicate significant differences between fertilization treatments and growing seasons, respectively. The absence of letters indicates no significant differences. The values represent the average ± standard deviation (n = 3).
-
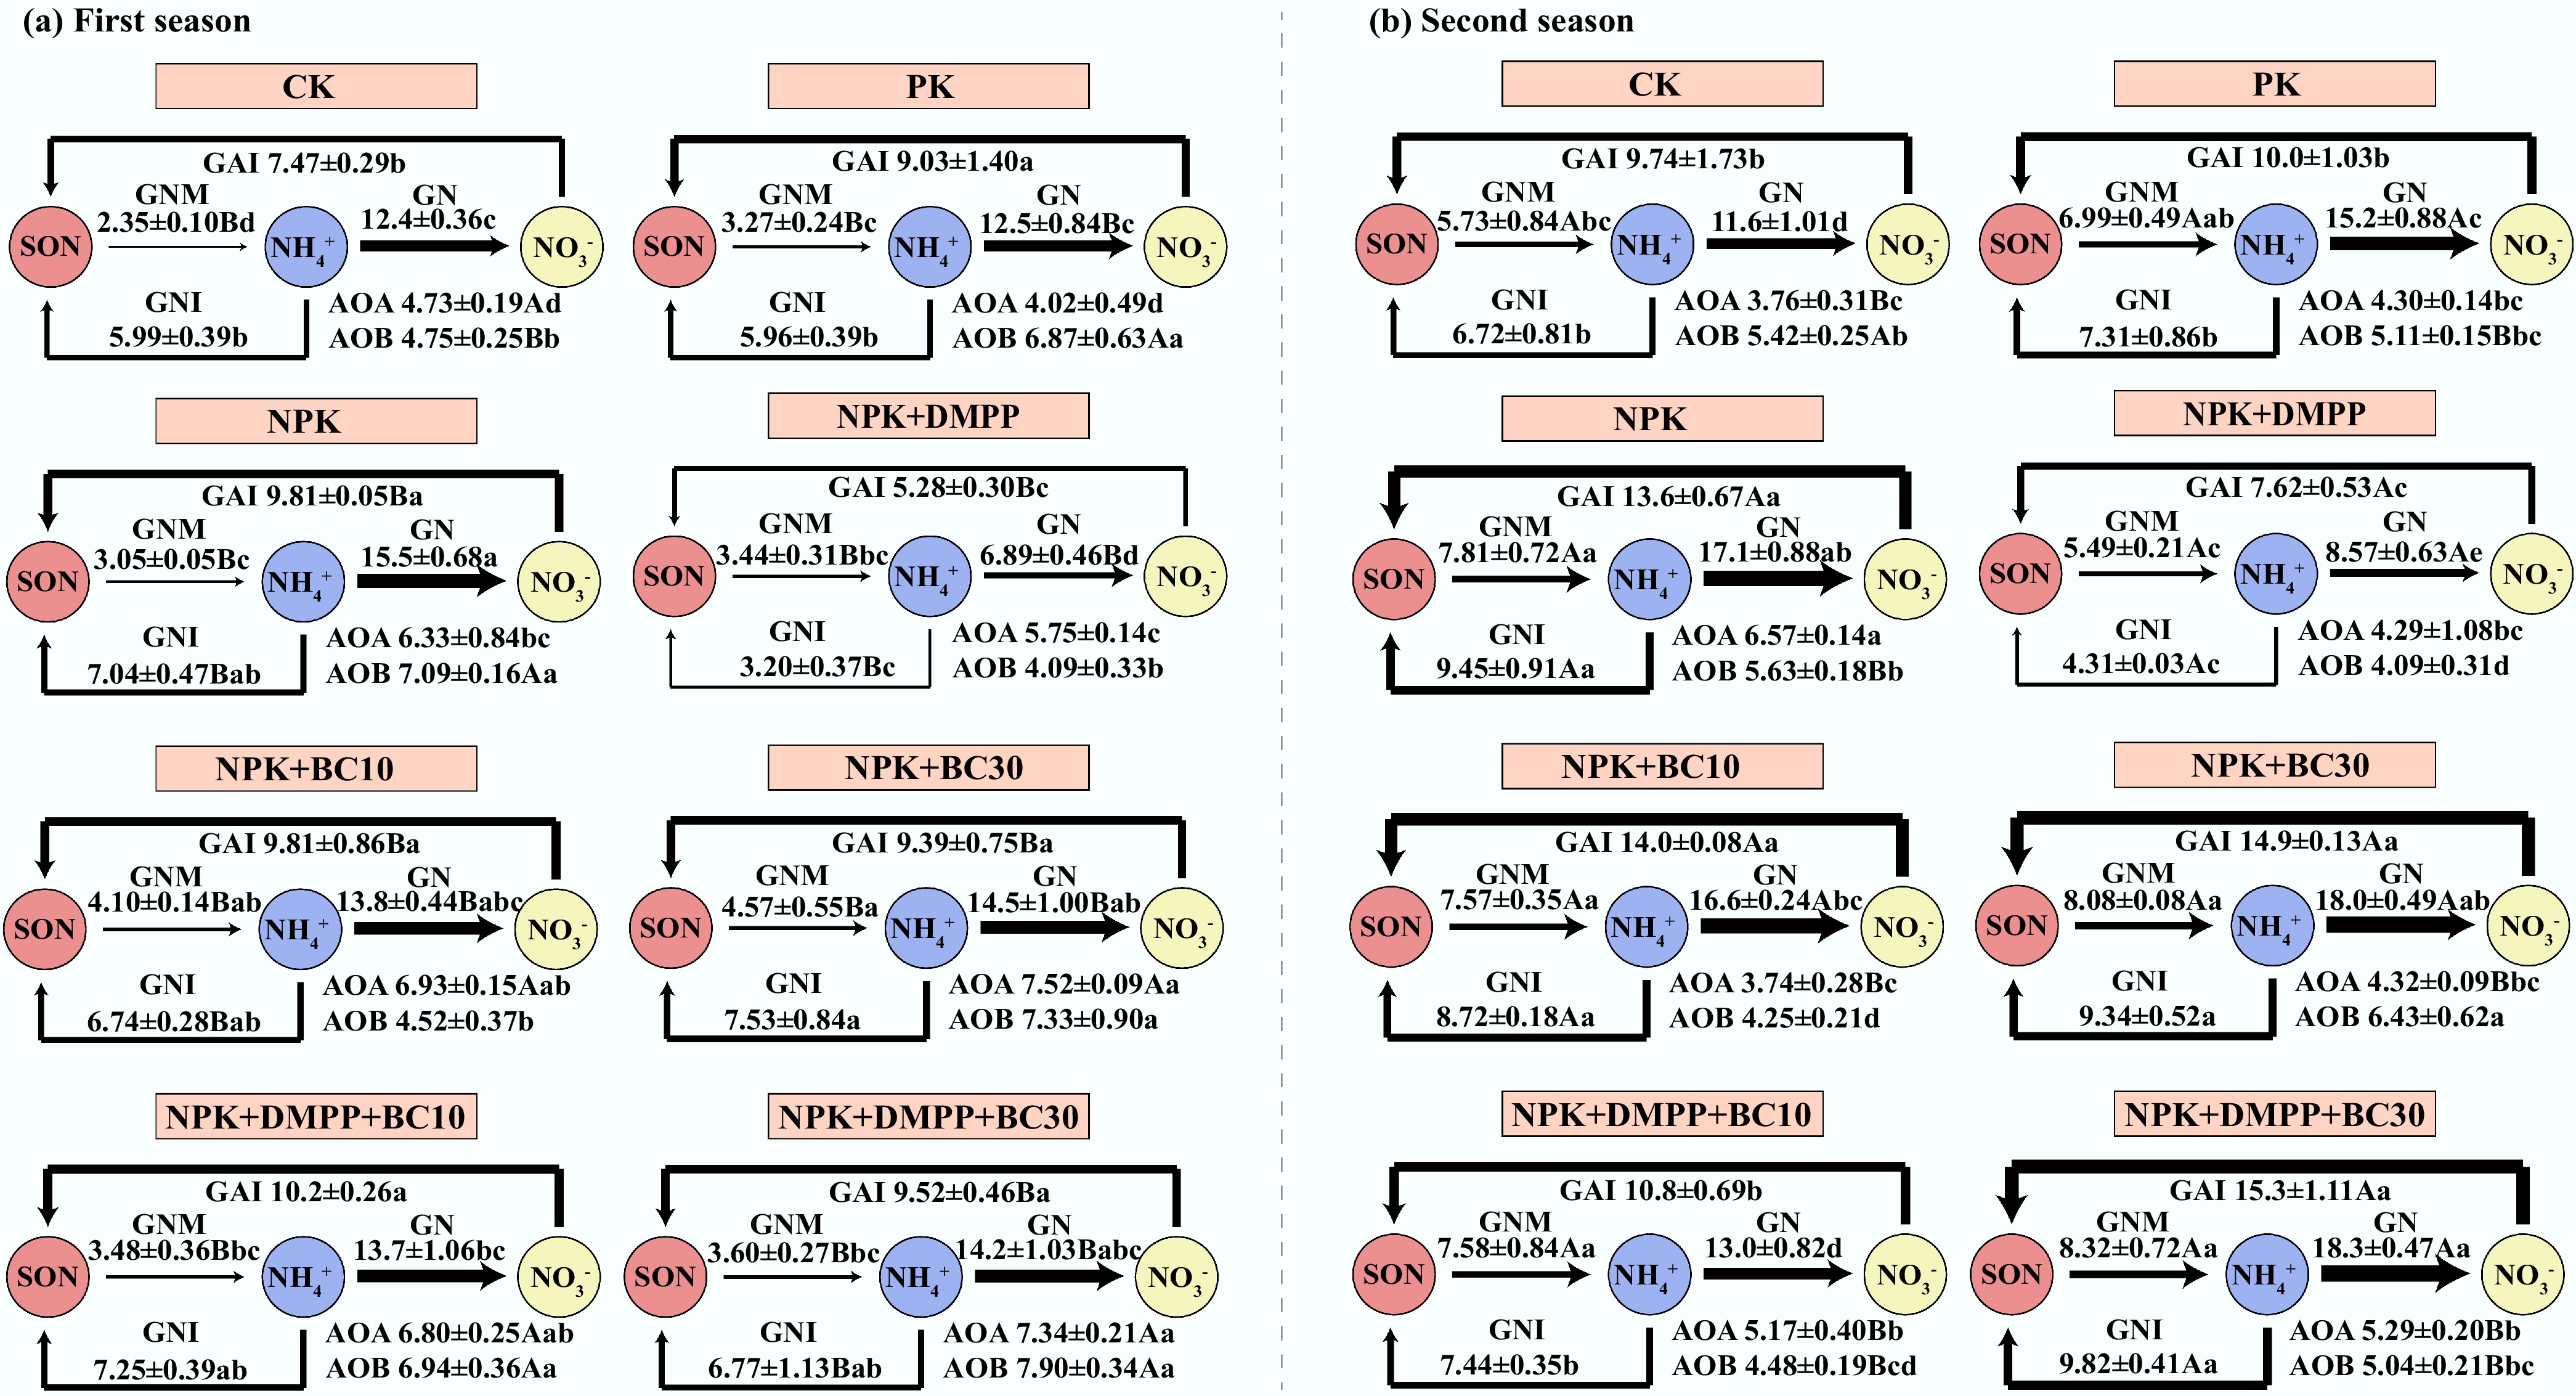
Figure 3.
Changes in soil inorganic N supply, microbial immobilization rates, and N cycling functional gene abundances after fertilizer application during the first and second seasons. All N-cycling functional gene abundances were log-transformed. Different lowercase and uppercase letters indicate significant differences between fertilization treatments and growing seasons, respectively. The absence of letters indicates no significant differences. The values represent the average ± standard deviation (n = 3).
-
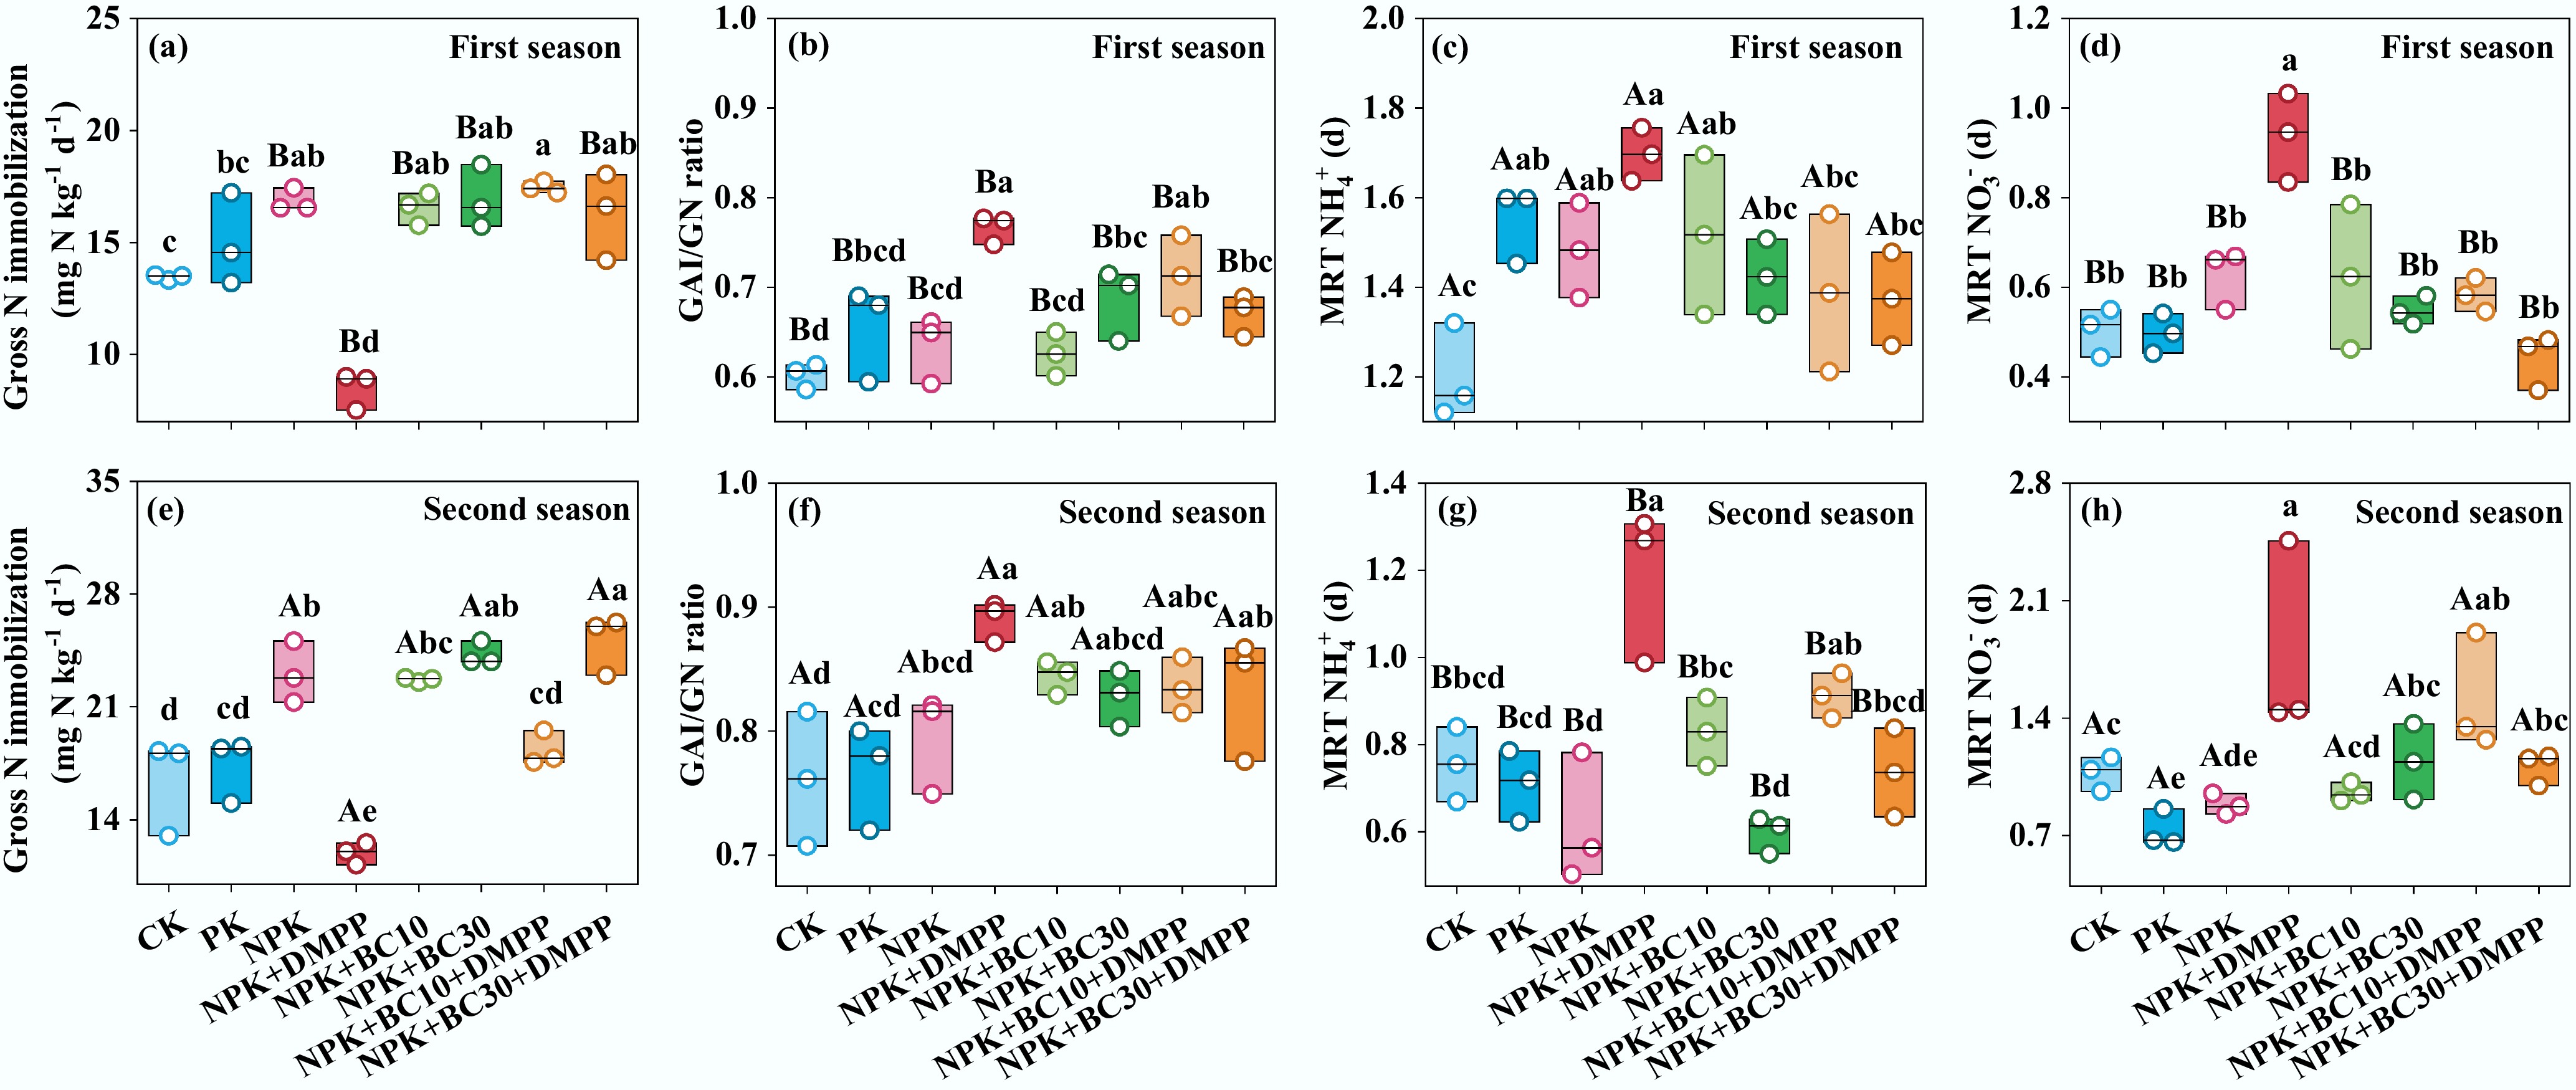
Figure 4.
Changes in (a), (e) gross N immobilization, (b), (f) gross NH4+ immobilization/gross nitrification (GAI/GN) ratio, (c), (g) mean residence time of NH4+ (MRT NH4+), and (d), (h) mean residence time of NO3‒ (MRT NO3‒) after fertilizer application during the first and second seasons. Different lowercase and uppercase letters indicate significant differences between fertilization treatments and growing seasons, respectively. The absence of letters indicates no significant differences. The values represent the average ± standard deviation (n = 3).
-
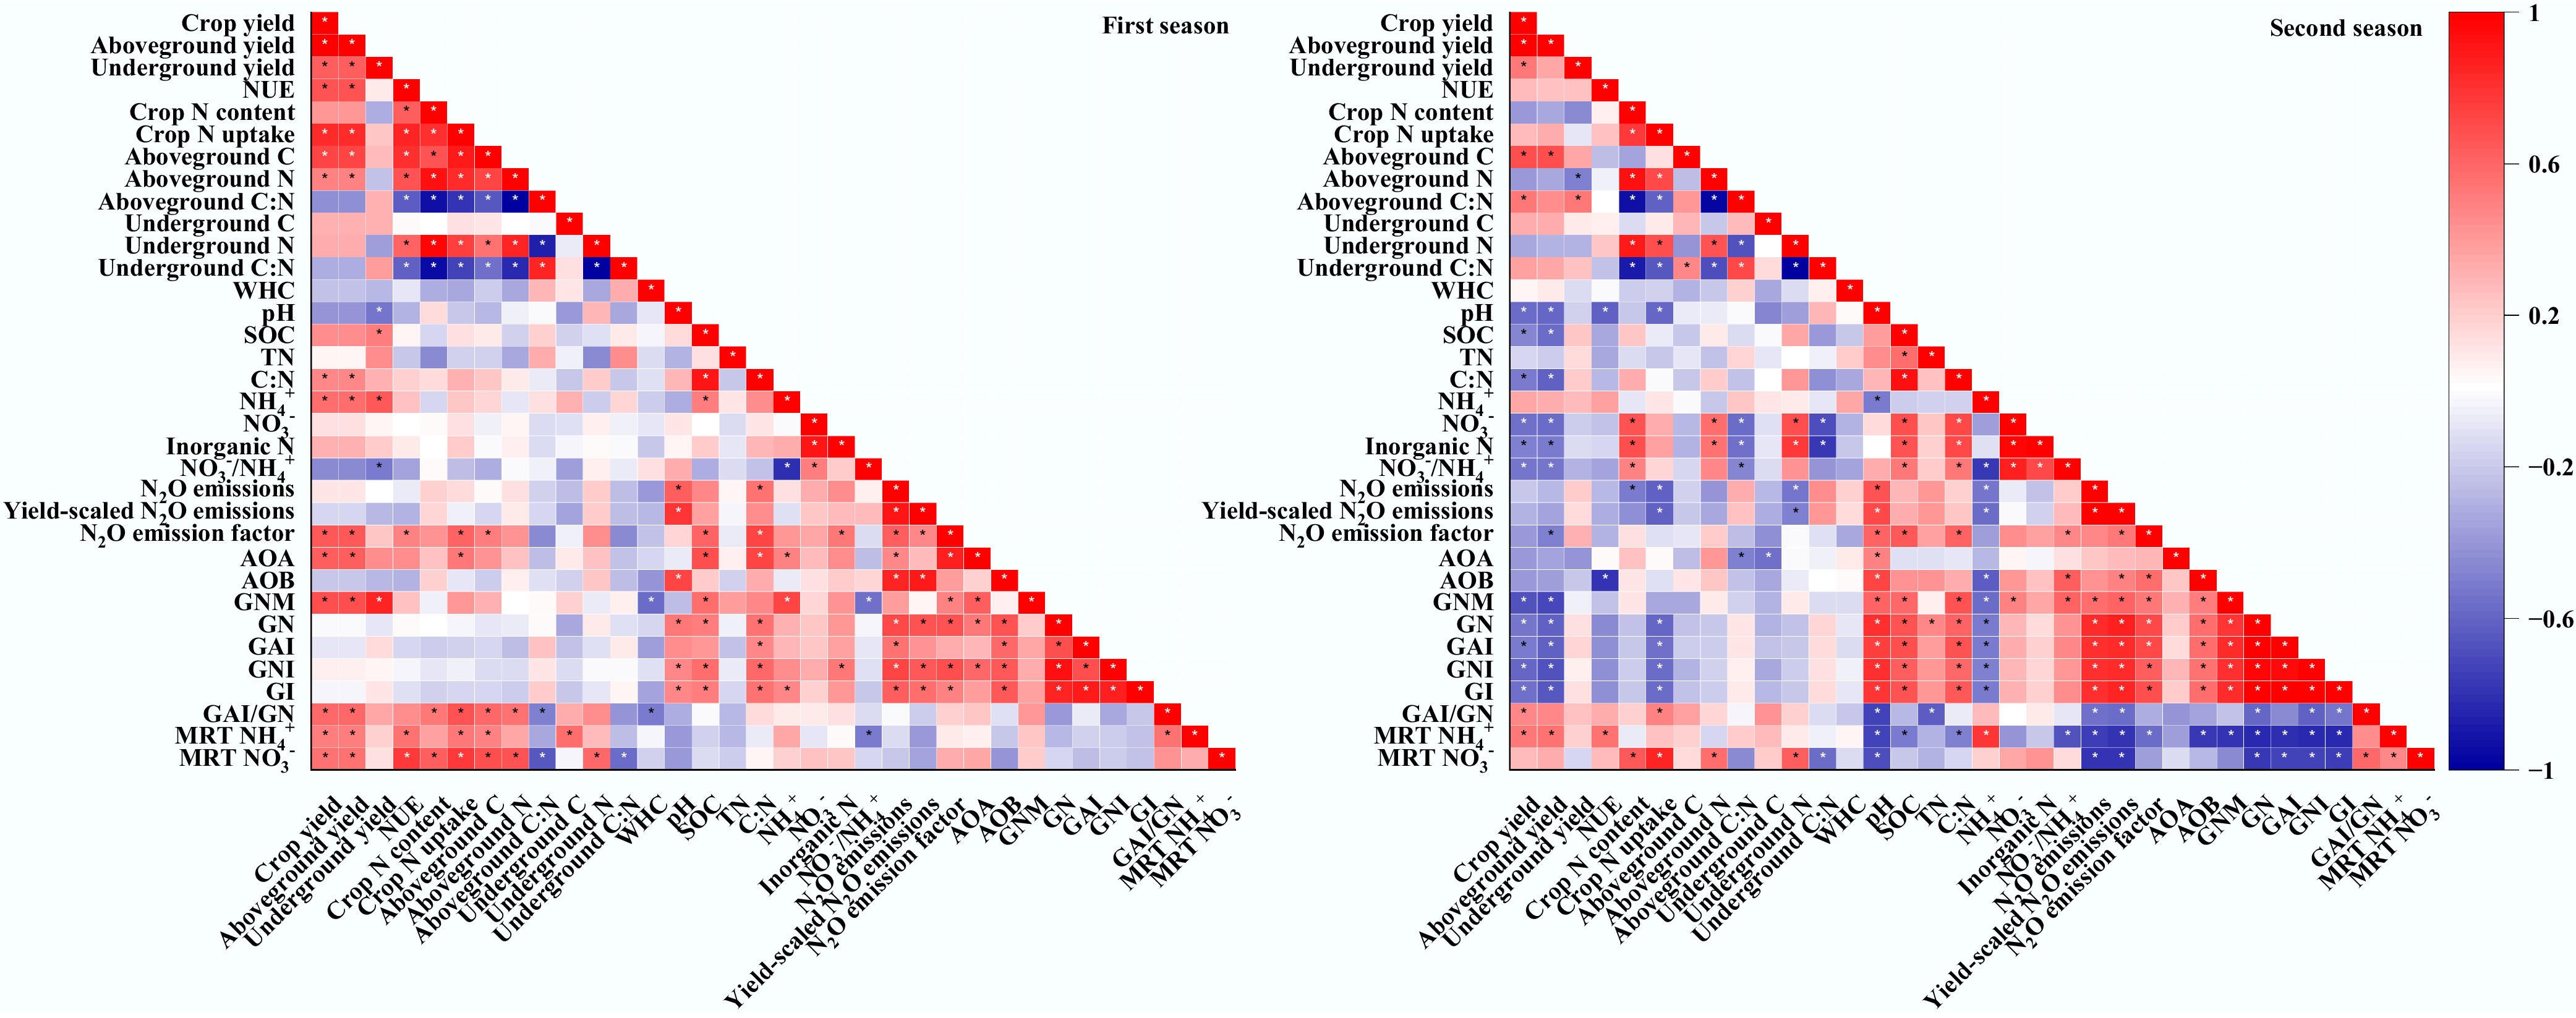
Figure 5.
Relationships between crop yields, crop nutrient contents, soil physicochemical and microbial properties, inorganic N supply and immobilization rates, and soil N2O emissions. WHC, water holding capacity; SOC, soil organic C; TN, total N; GNM, gross N mineralization; GN, gross nitrification; GAI, gross NH4+ immobilization; GNI, gross NO3‒ immobilization; GI, gross immobilization; MRT NH4+, mean residence time of NH4+; MRT NO3‒, mean residence time of NO3‒. * indicates p < 0.05.
-
Paramentera Season CK PK NPK NPK + DMPP NPK + BC10 NPK + BC30 NPK + BC10 + DMPP NPK + BC30 + DMPP WHC (%) First 63.9 ± 0.21a 57.2 ± 5.84b 62.6 ± 4.27Ba 60.3 ± 3.02Bab 60.7 ± 3.97ab 61.7 ± 1.01ab 63.0 ± 1.87a 58.3 ± 1.70ab Second 64.4 ± 0.30 65.1 ± 1.65 65.7 ± 0.27A 64.1 ± 0.12A 65.5 ± 2.58 59.1 ± 7.02 58.7 ± 9.13 55.9 ± 9.76 pH First 8.25 ± 0.14b 8.35 ± 0.05Ab 8.44 ± 0.03Aa 7.95 ± 0.04d 8.04 ± 0.02Ac 8.33 ± 0.09Ab 8.05 ± 0.01Ac 8.25 ± 0.09b Second 8.13 ± 0.03ab 8.15 ± 0.03Bab 8.17 ± 0.04Ba 7.90 ± 0.05d 7.99 ± 0.02Bcd 8.14 ± 0.04Bab 8.01 ± 0.01Bc 8.09 ± 0.02bc Soil organic C (g C kg‒1) First 51.9 ± 2.37d 51.1 ± 0.77d 53.5 ± 0.40c 50.2 ± 3.26d 57.5 ± 0.36b 67.9 ± 0.22Aa 58.7 ± 1.65b 68.2 ± 0.75a Second 52.4 ± 1.22c 50.0 ± 2.58d 51.8 ± 1.89cd 49.3 ± 2.51d 57.9 ± 0.59b 63.8 ± 1.19Ba 56.6 ± 1.60bc 65.2 ± 3.37a Total N
(g N kg‒1)First 2.13 ± 0.02B 2.12 ± 0.04 2.06 ± 0.04 2.10 ± 0.08 2.19 ± 0.08 2.17 ± 0.11 2.10 ± 0.03 2.09 ± 0.01 Second 2.17 ± 0.00Aab 2.16 ± 0.04ab 2.17 ± 0.08ab 2.10 ± 0.03b 2.20 ± 0.02ab 2.25 ± 0.02a 2.13 ± 0.05ab 2.18 ± 0.12ab C/N First 24.4 ± 1.18c 24.1 ± 0.58c 26.0 ± 0.50bc 23.9 ± 2.33c 26.3 ± 1.13bc 31.4 ± 1.56Aa 28.0 ± 1.16b 32.7 ± 0.30Aa Second 24.2 ± 0.59cd 23.1 ± 1.35d 23.9 ± 1.19d 23.4 ± 0.88d 26.3 ± 0.46bc 28.3 ± 0.25Bab 26.6 ± 1.30b 29.9 ± 0.06Ba NH4+
(mg N kg‒1)First 3.87 ± 1.09c 5.07 ± 0.45abc 4.92 ± 0.59abc 5.39 ± 0.22abc 6.82 ± 0.98a 5.87 ± 0.59ab 5.87 ± 1.57abc 4.28 ± 0.67bc Second 4.92 ± 0.37b 4.92 ± 0.14b 4.73 ± 0.48b 6.50 ± 0.64a 5.71 ± 1.00ab 4.82 ± 0.28b 6.01 ± 0.74ab 5.61 ± 0.42ab NO3‒
(mg N kg‒1)First 6.66 ± 1.03B 7.45 ± 1.47B 8.56 ± 2.02B 6.50 ± 0.98B 7.61 ± 2.06B 7.93 ± 0.81B 7.93 ± 0.22B 5.71 ± 1.03B Second 12.4 ± 0.24Ade 11.0 ± 0.85Ae 15.2 ± 1.24Acd 15.0 ± 2.80Acd 15.9 ± 0.97Abcd 20.5 ± 2.91Aa 19.5 ± 2.96Aabc 20.3 ± 1.24Aab Inorganic N (mg N kg‒1) First 10.5 ± 2.09Bab 12.5 ± 1.25Bab 13.5 ± 1.47Bab 11.9 ± 0.78Bab 14.4 ± 3.02Ba 13.8 ± 1.40Ba 13.8 ± 1.35Ba 9.99 ± 1.69Bb Second 17.3 ± 0.14Acd 16.0 ± 0.96Ad 19.9 ± 1.45Abc 21.5 ± 2.19Ab 21.6 ± 0.87Aab 25.3 ± 2.66Aa 25.5 ± 2.34Aa 25.9 ± 1.39Aa NO3‒/NH4+ First 1.80 ± 0.30B 1.49 ± 0.38 1.81 ± 0.58B 1.21 ± 0.22 1.10 ± 0.14B 1.35 ± 0.01B 1.45 ± 0.36B 1.33 ± 0.05B Second 2.54 ± 0.25Abc 2.24 ± 0.12c 3.23 ± 0.33Aabc 2.37 ± 0.71c 2.87 ± 0.56Abc 4.29 ± 0.86Aa 3.36 ± 0.95Aabc 3.63 ± 0.31Aab a WHC, water holding capacity. Different lowercase and uppercase letters indicate significant differences between fertilization treatments and growing seasons, respectively. The absence of letters indicates no significant differences. The values represent the average ± standard deviation (n = 3). Table 1.
Changes in soil physicochemical properties after fertilizer application during the first and second seasons
Figures
(5)
Tables
(1)