-
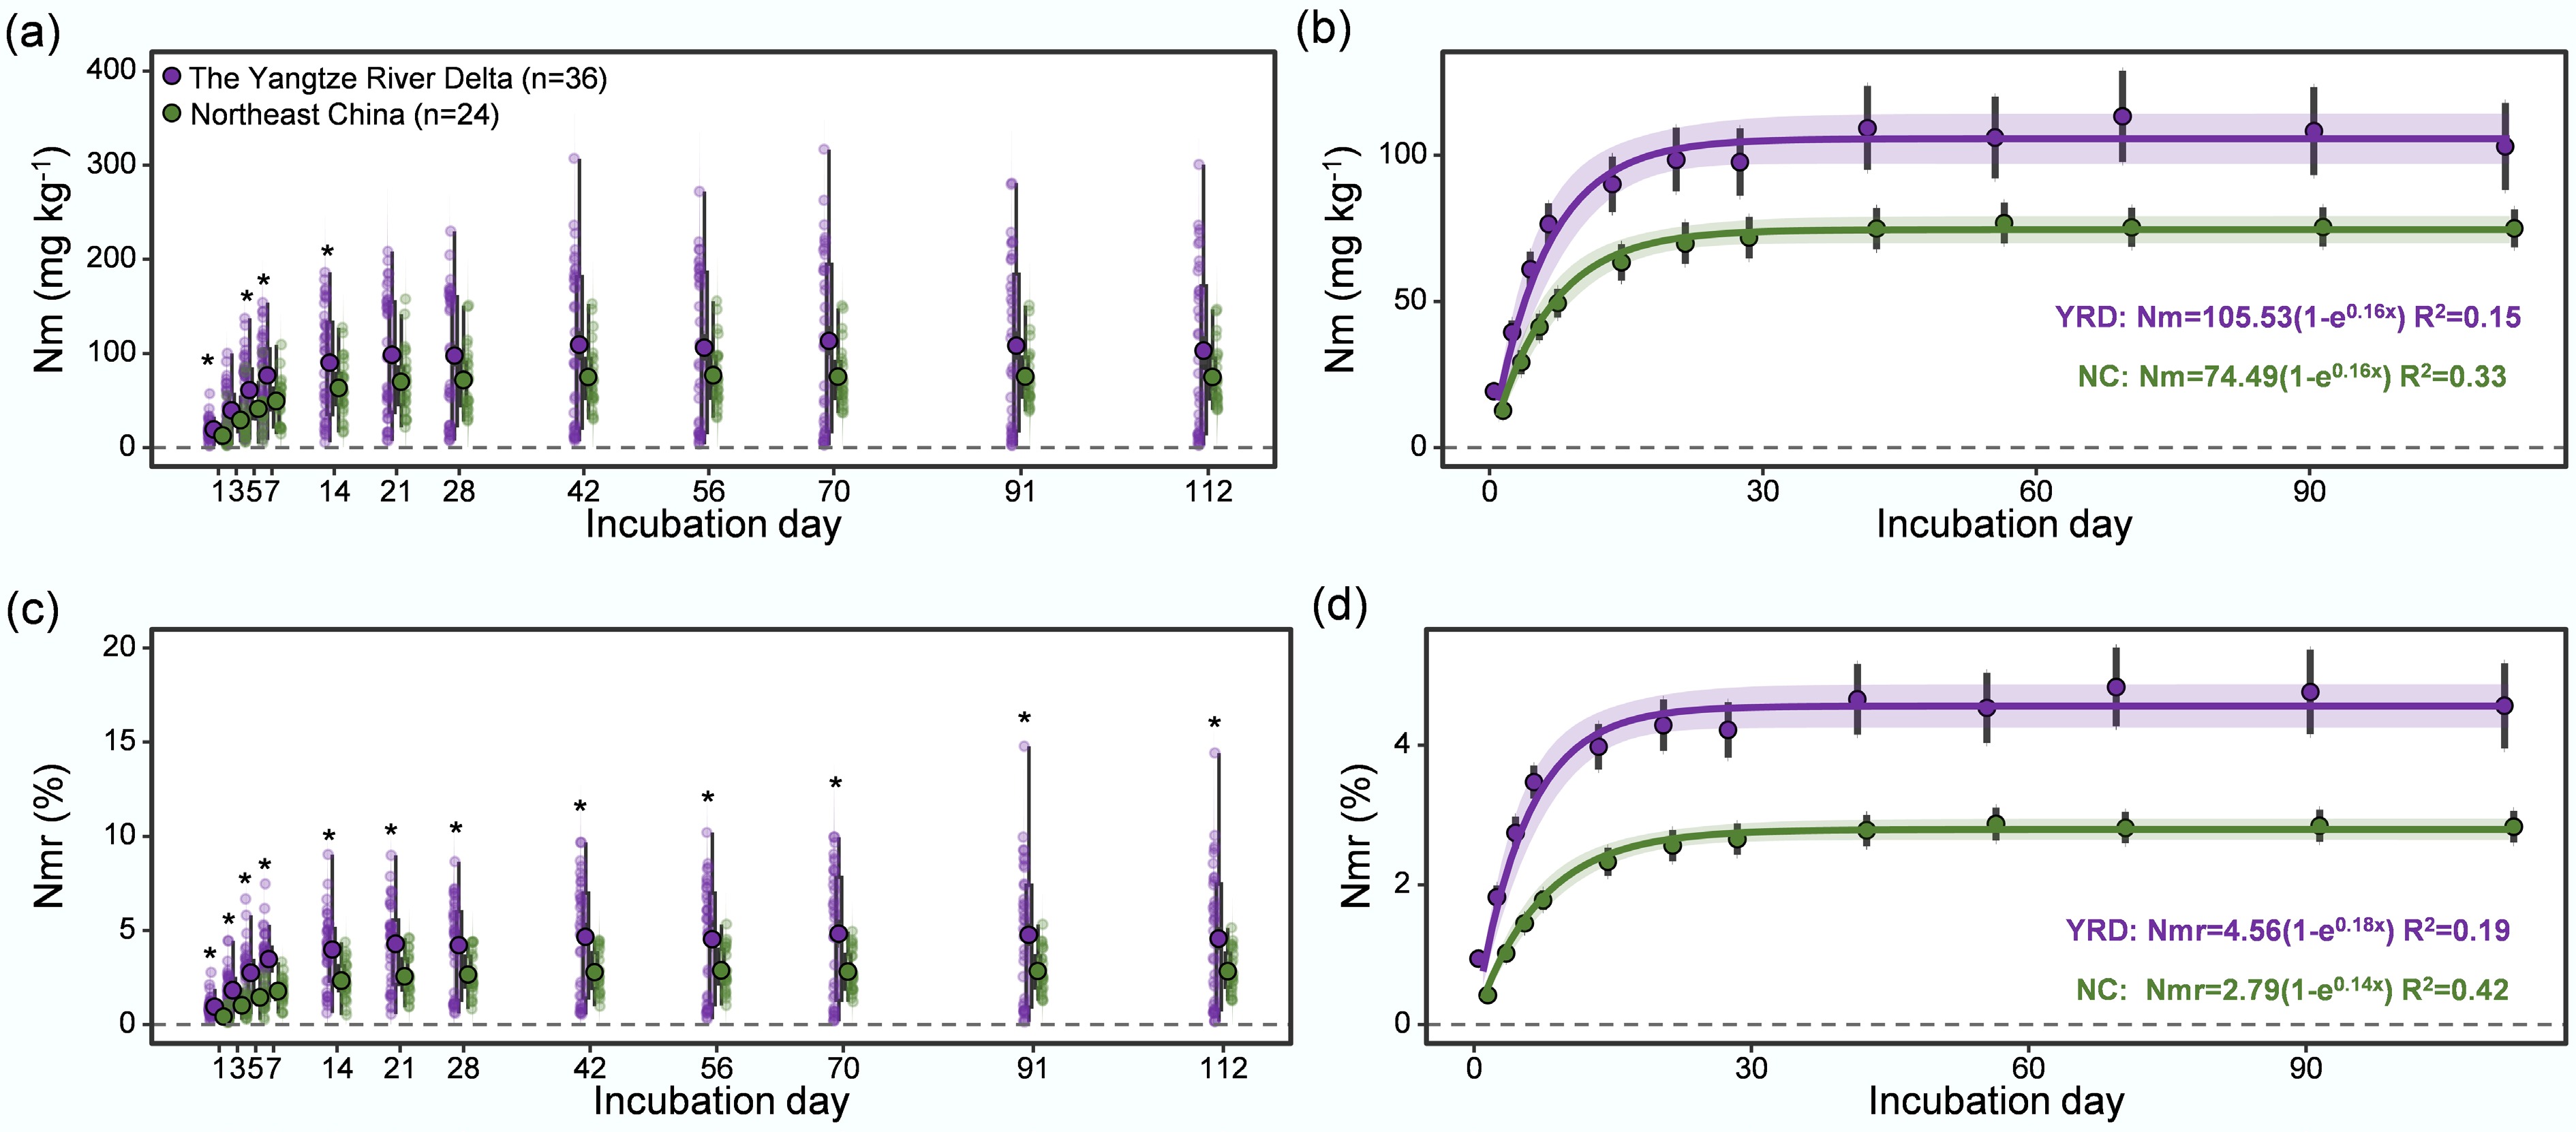
Figure 1.
(a) Nitrogen mineralization (Nm), (c) nitrogen mineralization ratio (Nmr), and One-pool model for average (b) Nm, and (d) Nmr during a 112-d anaerobic incubation at 30 °C under soil samples from the Yangtze River Delta (YRD), and Northeast China (NC). Nm represents the amount of cumulative mineralized NH4+-N. Nmr represents the ratio of the amount of cumulative mineralized NH4+-N to the total soil nitrogen content (TON). The purple and green solid circles represent the means for 36 and 24 samples in the YRD and NC, respectively. N, sample size. * Significant difference between two regions (p < 0.05).
-
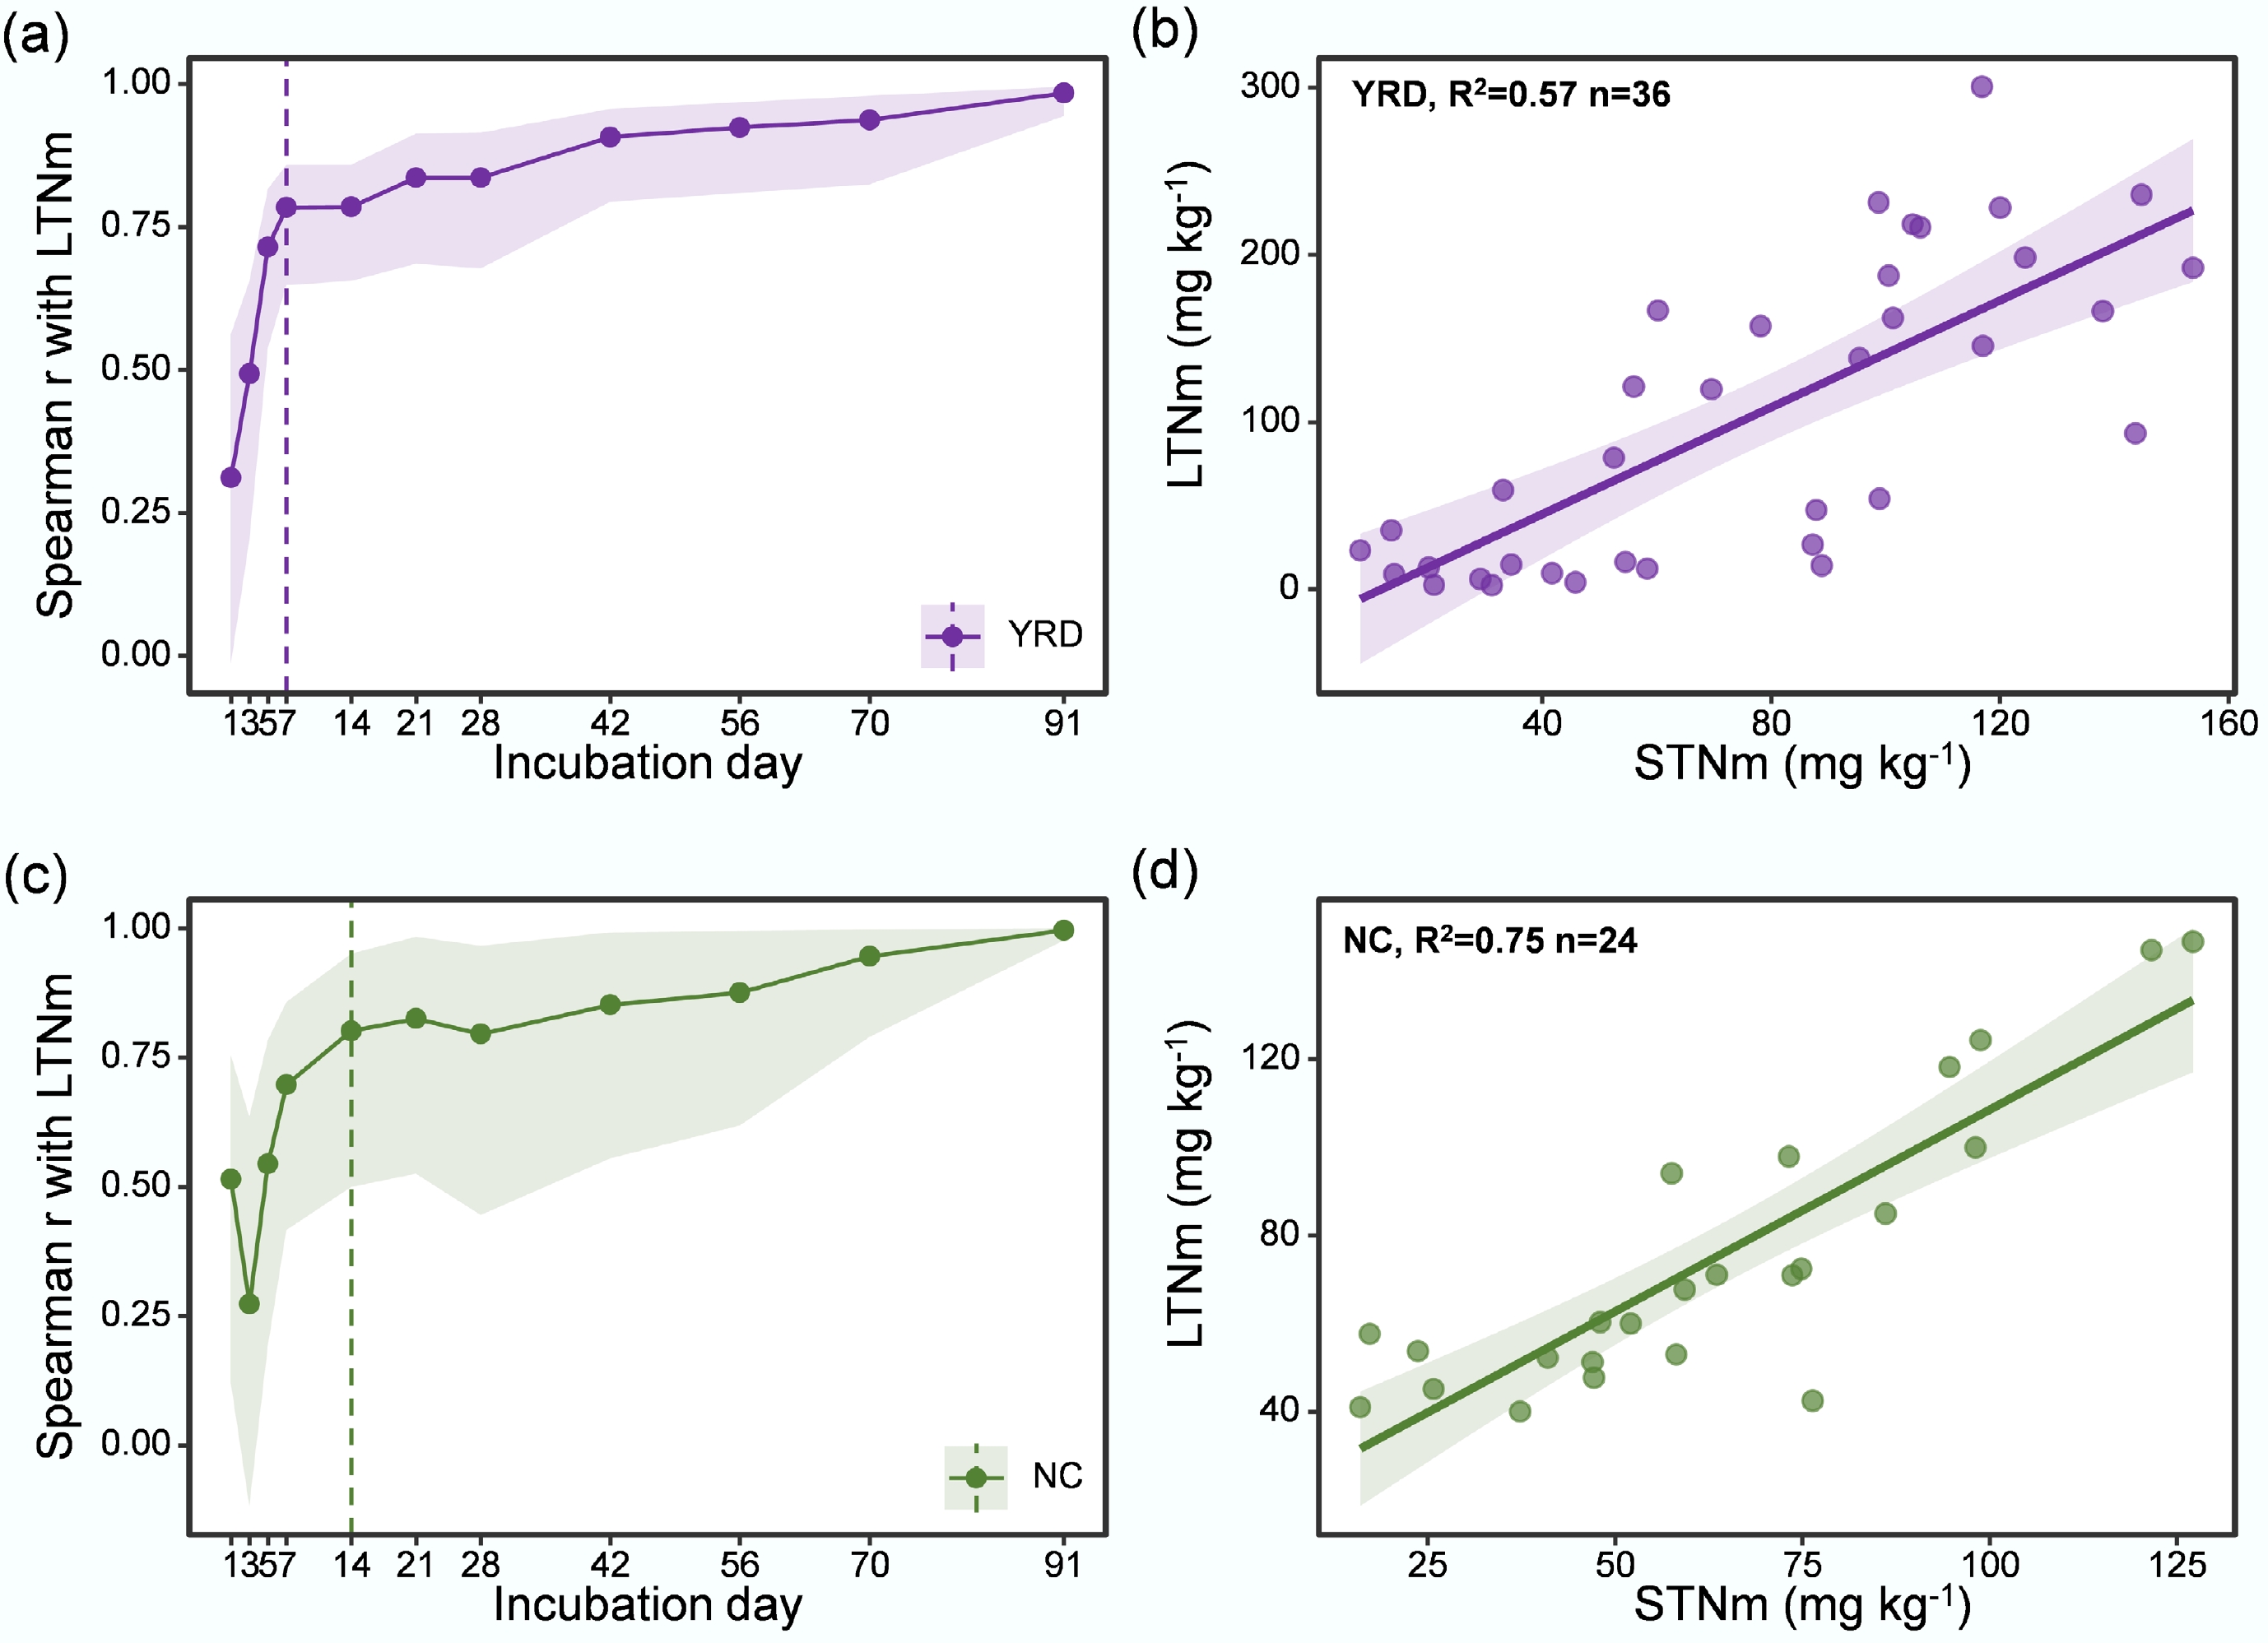
Figure 2.
Relationship of short-term Nm (STNm) with LTNm in the (a), (b) YRD, and (c), (d) NC, respectively. Abbreviations were as in Fig. 1. Shadows represent a 95% confidence interval. Dashed vertical lines denote thresholds for Spearman r to determine the shortest incubation day to represent LTNm. For YRD and NC, the best STNm incubation days were 7 and 14, respectively.
-
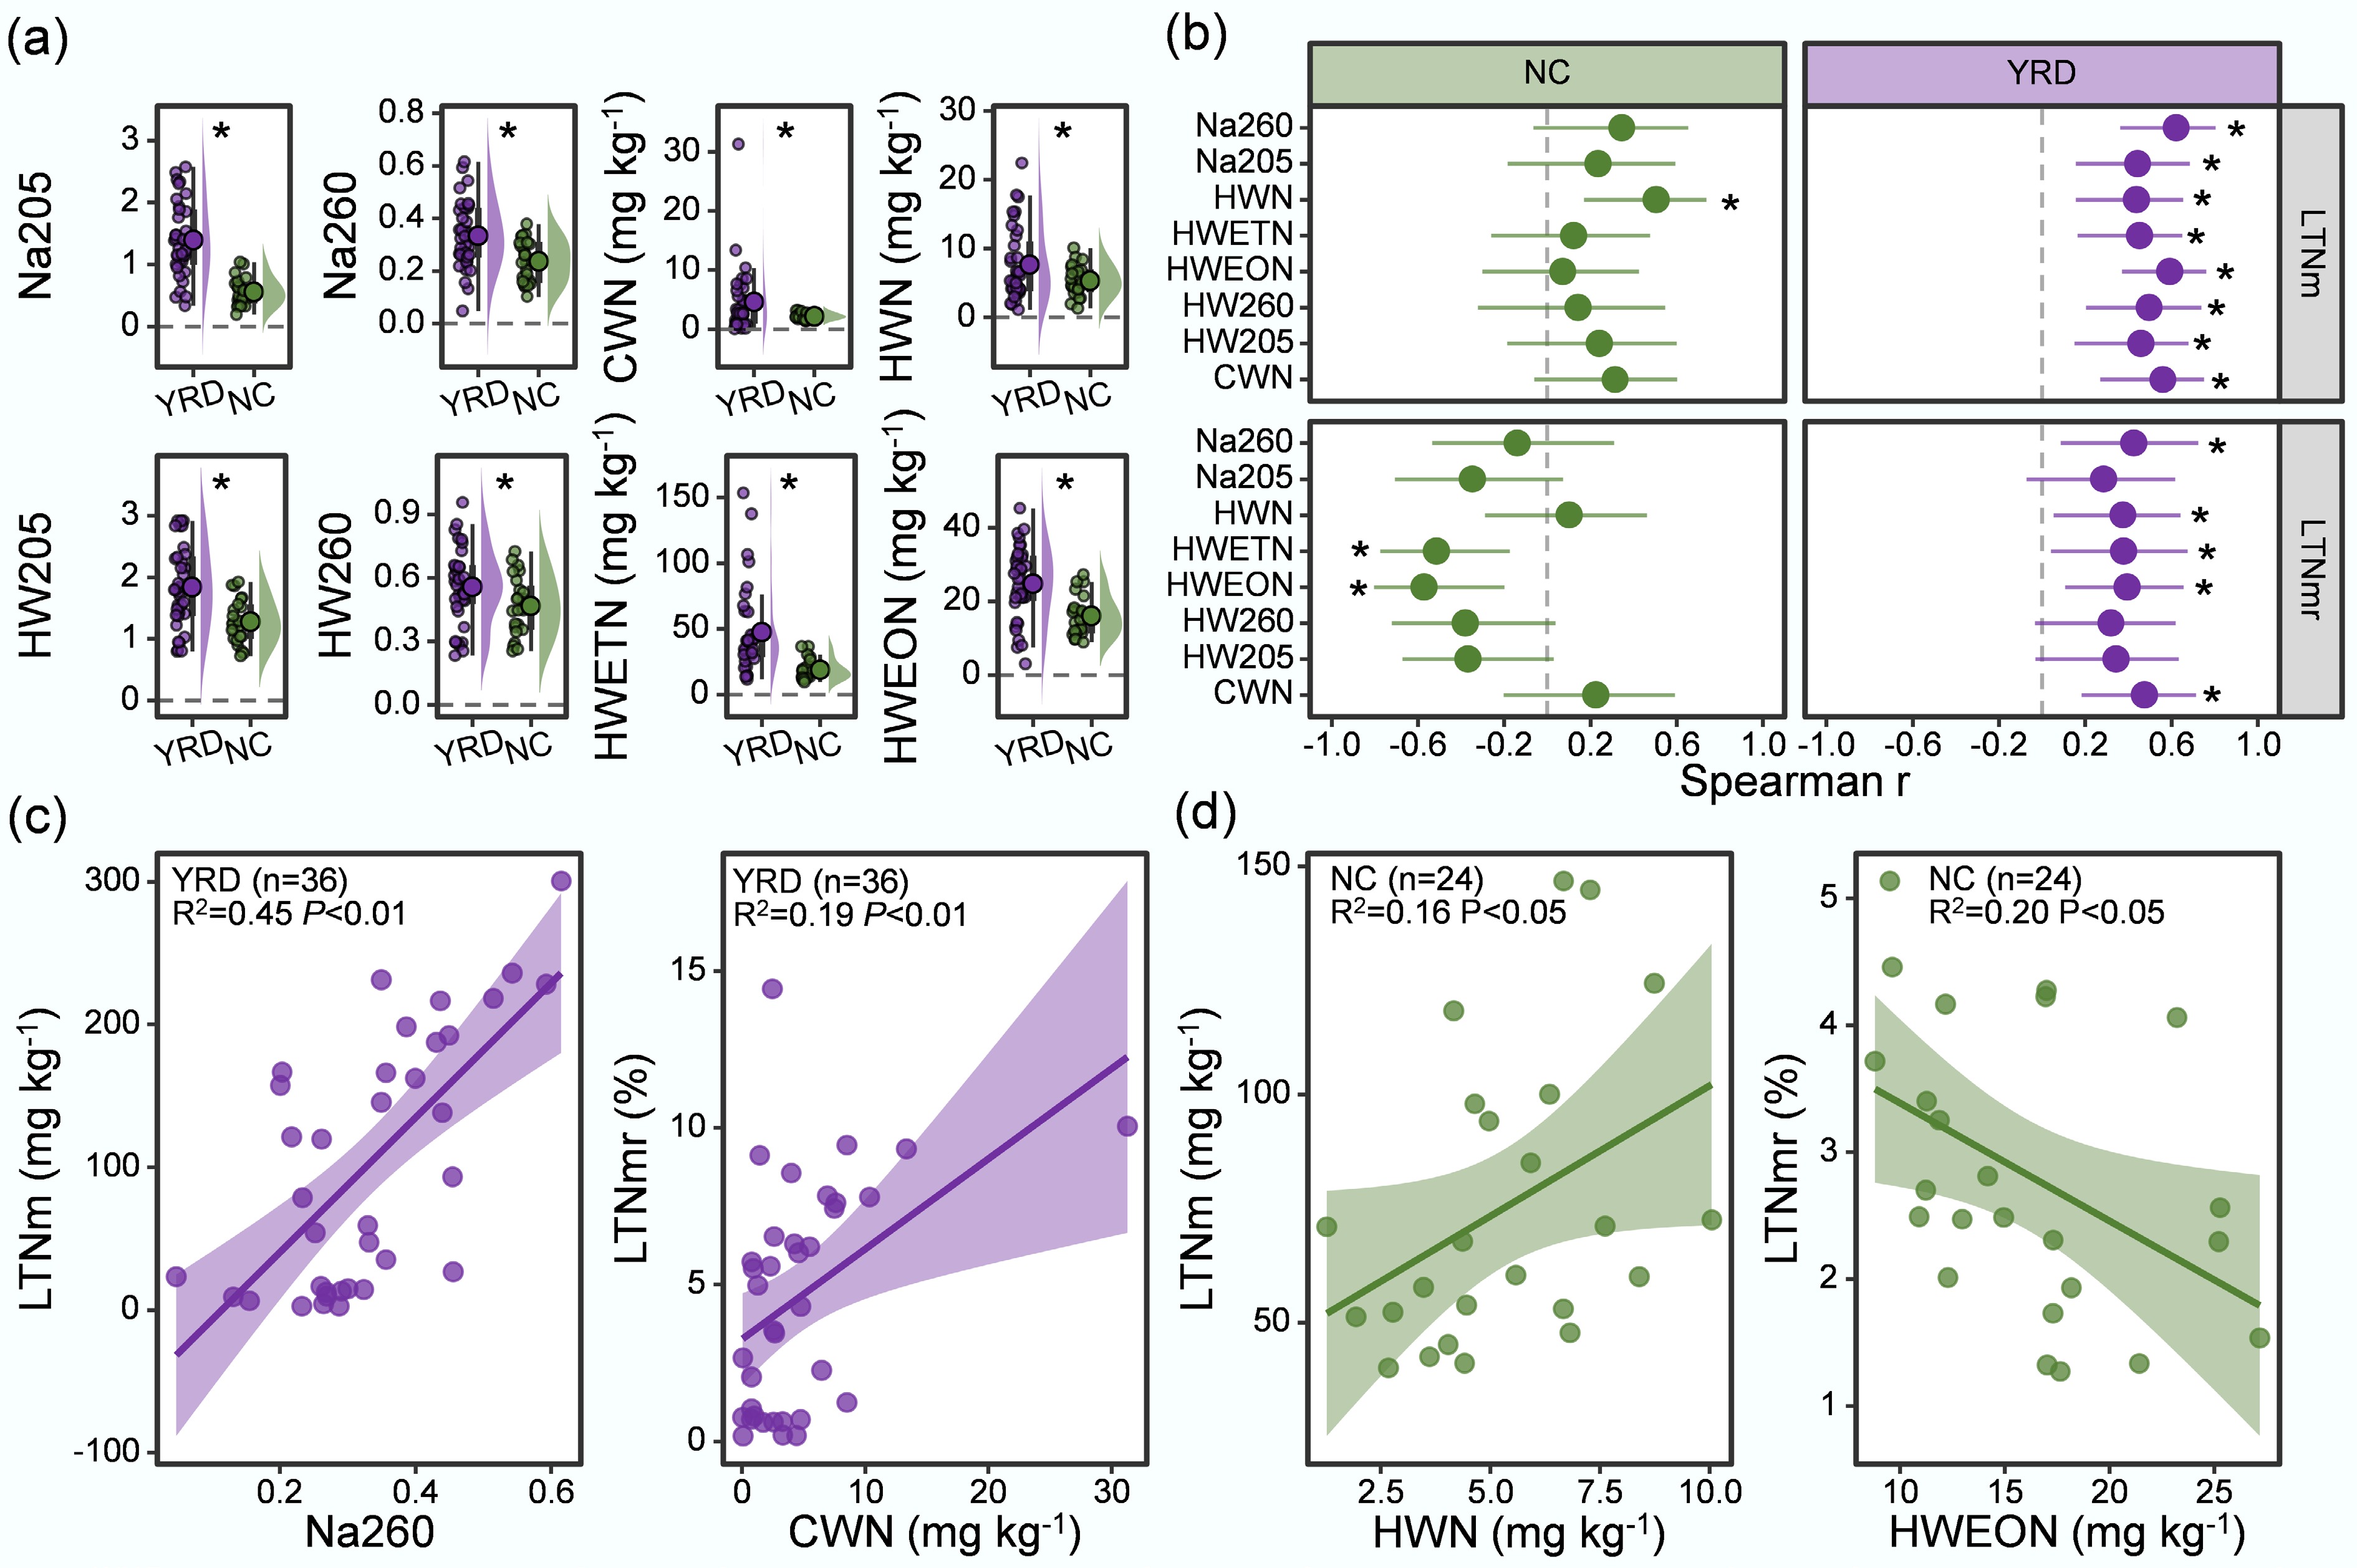
Figure 3.
(a) The rapid extraction results from paddy soils in the two rice-growing regions studied. (b) The Spearman correlation coefficients obtained using rapid extractions with long-term Nm (LTNm) and long-term Nm ratio (LTNmr) in the YRD and NC. (c) The linear relationships between Na260 with LTNm and between CWN with LTNmr in the YRD. (d) The linear relationship between HWN with LTNm and between HWEON with LTNmr in NC. Abbreviations were as in Fig. 1. Na205, Na260, HW205, and HW260 represent the ultraviolet absorbance values obtained using the 0.01 mol L−1 NaHCO3 and hot water extractions at 205 and 260 nm, respectively. CWN and HWN represent the NH4+-N content obtained from cold- and hot-water extractions, respectively.
-

Figure 4.
(a) The Spearman correlation coefficients obtained using the soil physicochemical properties with long-term Nm (LTNm) and long-term Nm ratio (LTNmr) in the YRD and NC. (b) The linear relationship between pH with LTNm and LTNmr in the two regions. Shaded areas denote 95% confidence intervals. Abbreviations are as in Fig. 1. TN, total soil nitrogen content. TOC, total organic carbon content. C/N, TOC to TN ratio. CEC, cation exchange capacity.
-
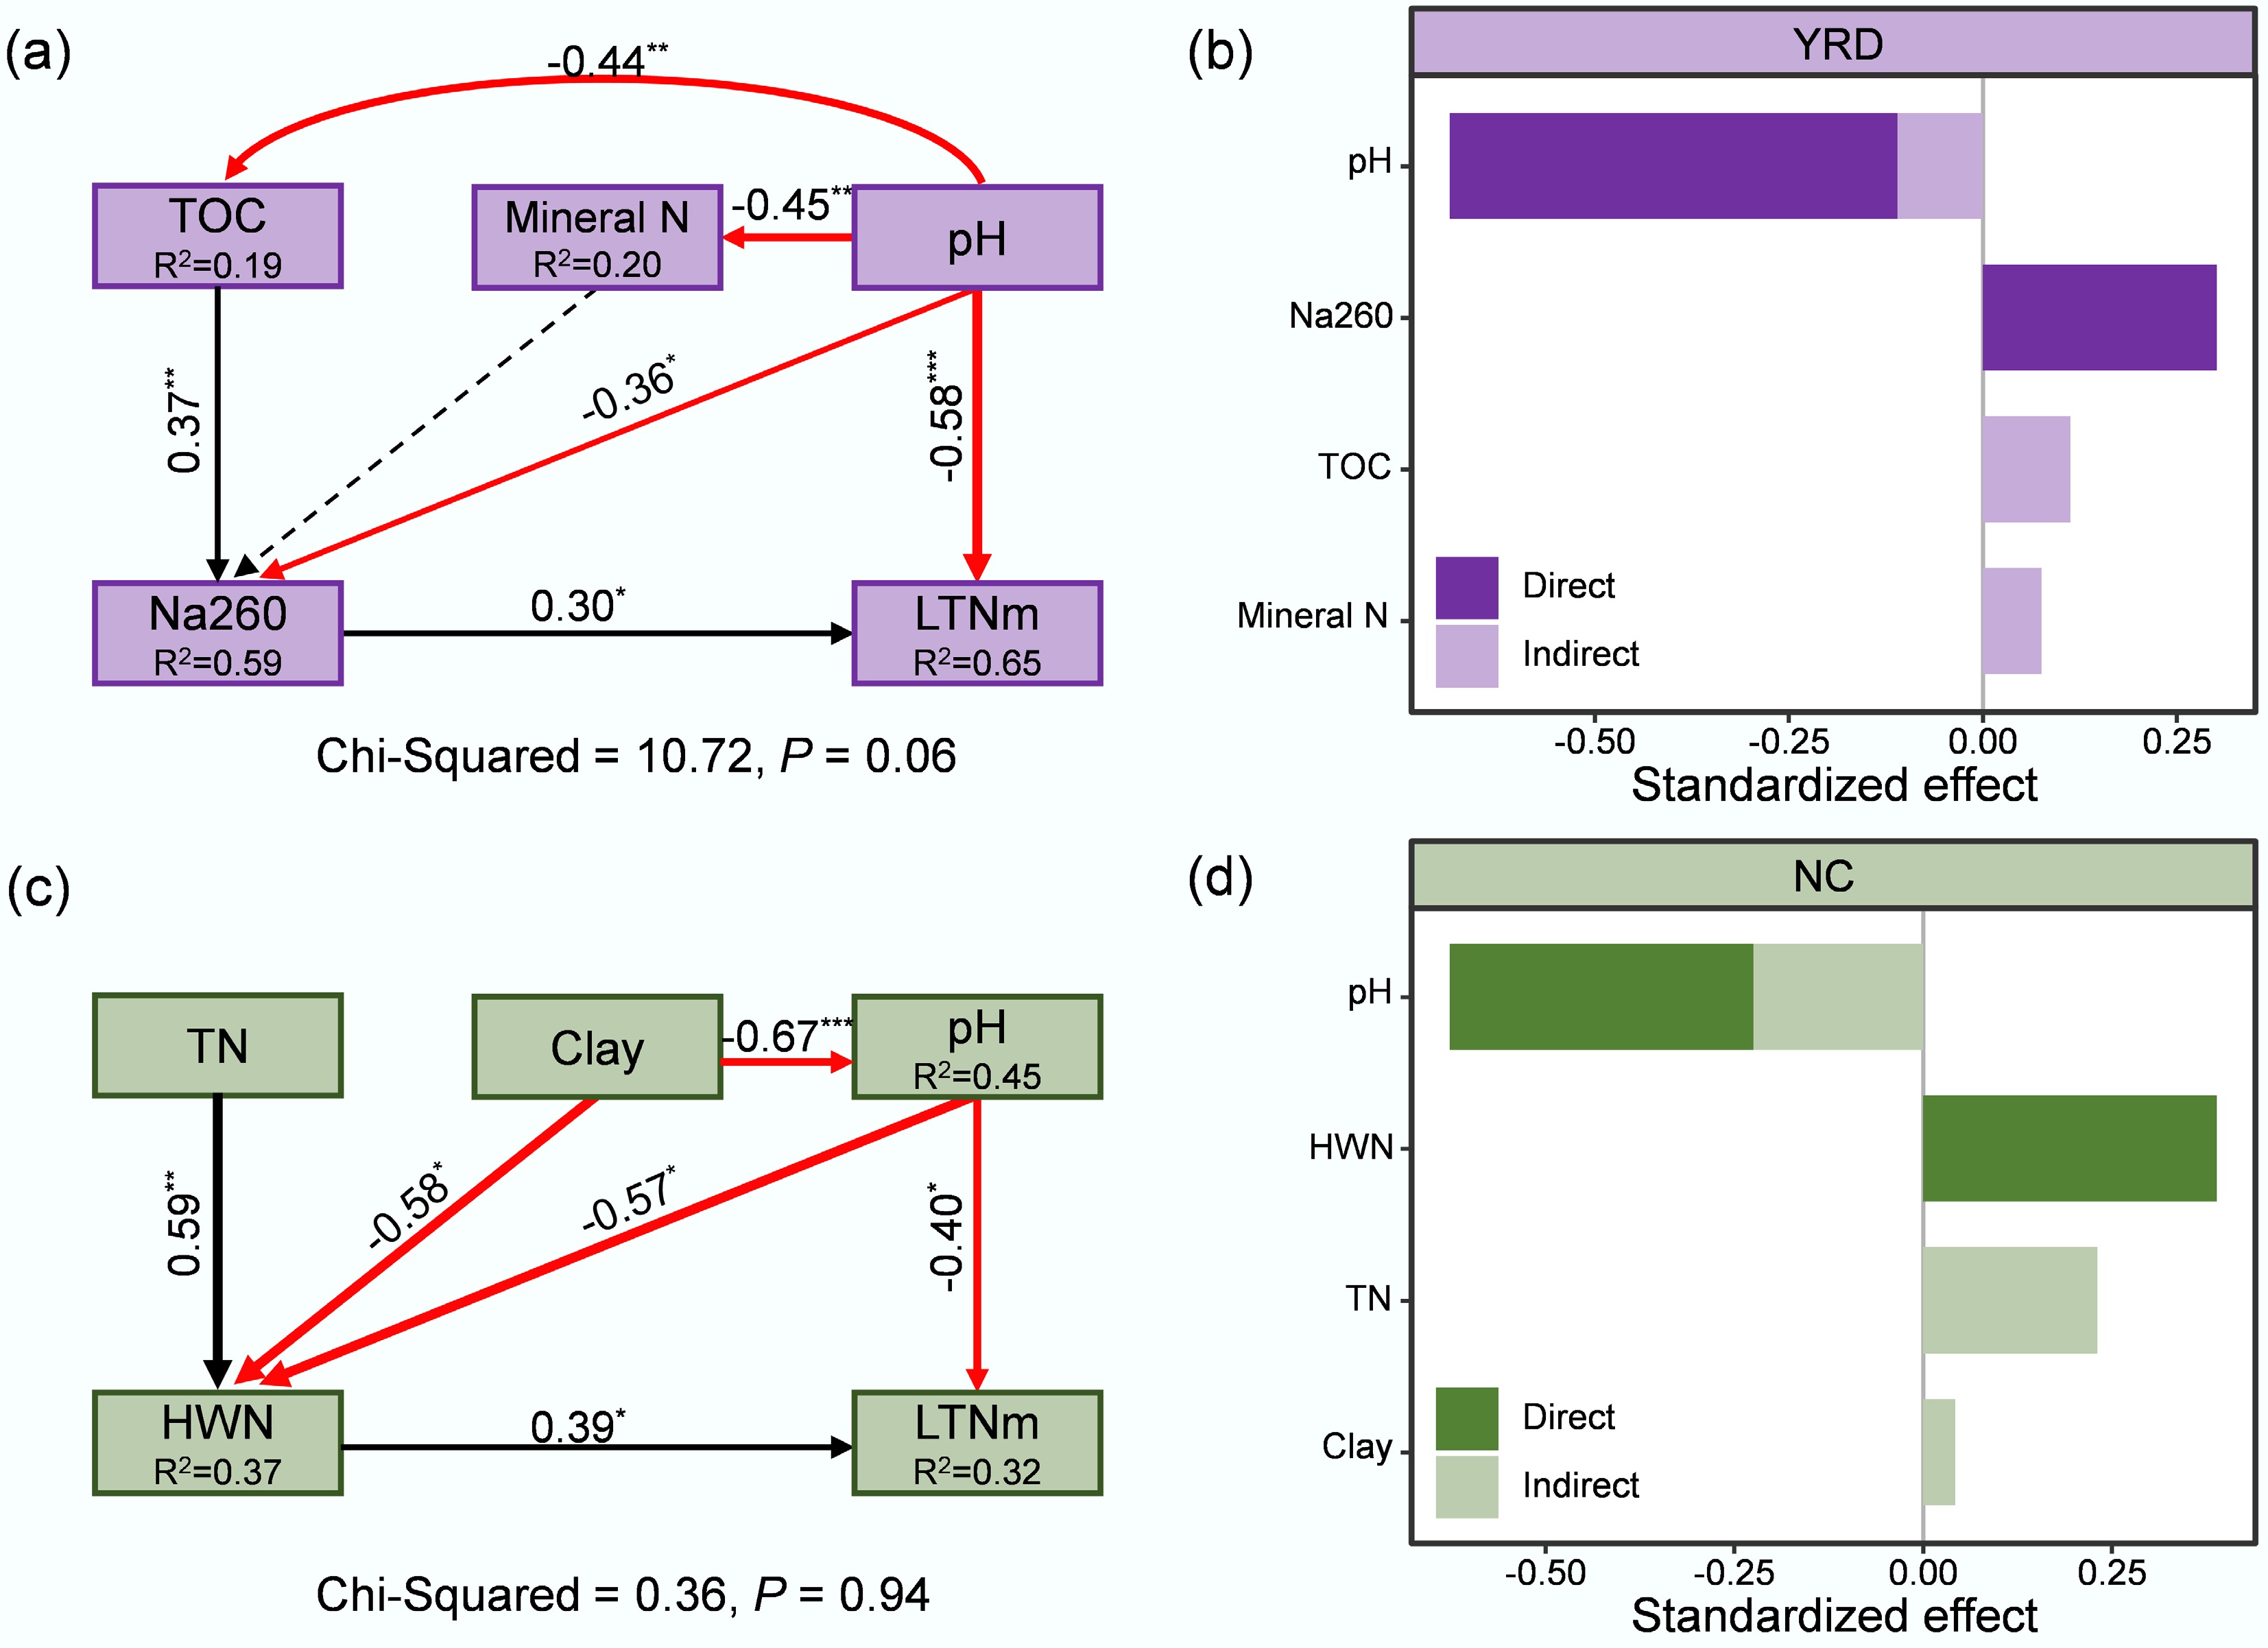
Figure 5.
(a), (c) The structure equation modeling analysis showing the effects of soil physicochemical properties and rapid extraction indices on LTNm in the typical paddy soils of the YRD and NC. (b), (d) Standardized direct and indirect effects of key factors on LTNm in the two regions. The Chi-square (χ2) test evaluates the overall goodness of fit between the proposed model and the observed data. Abbreviations are consistent with those in Fig. 1. ** p < 0.01; *** p < 0.001.
-
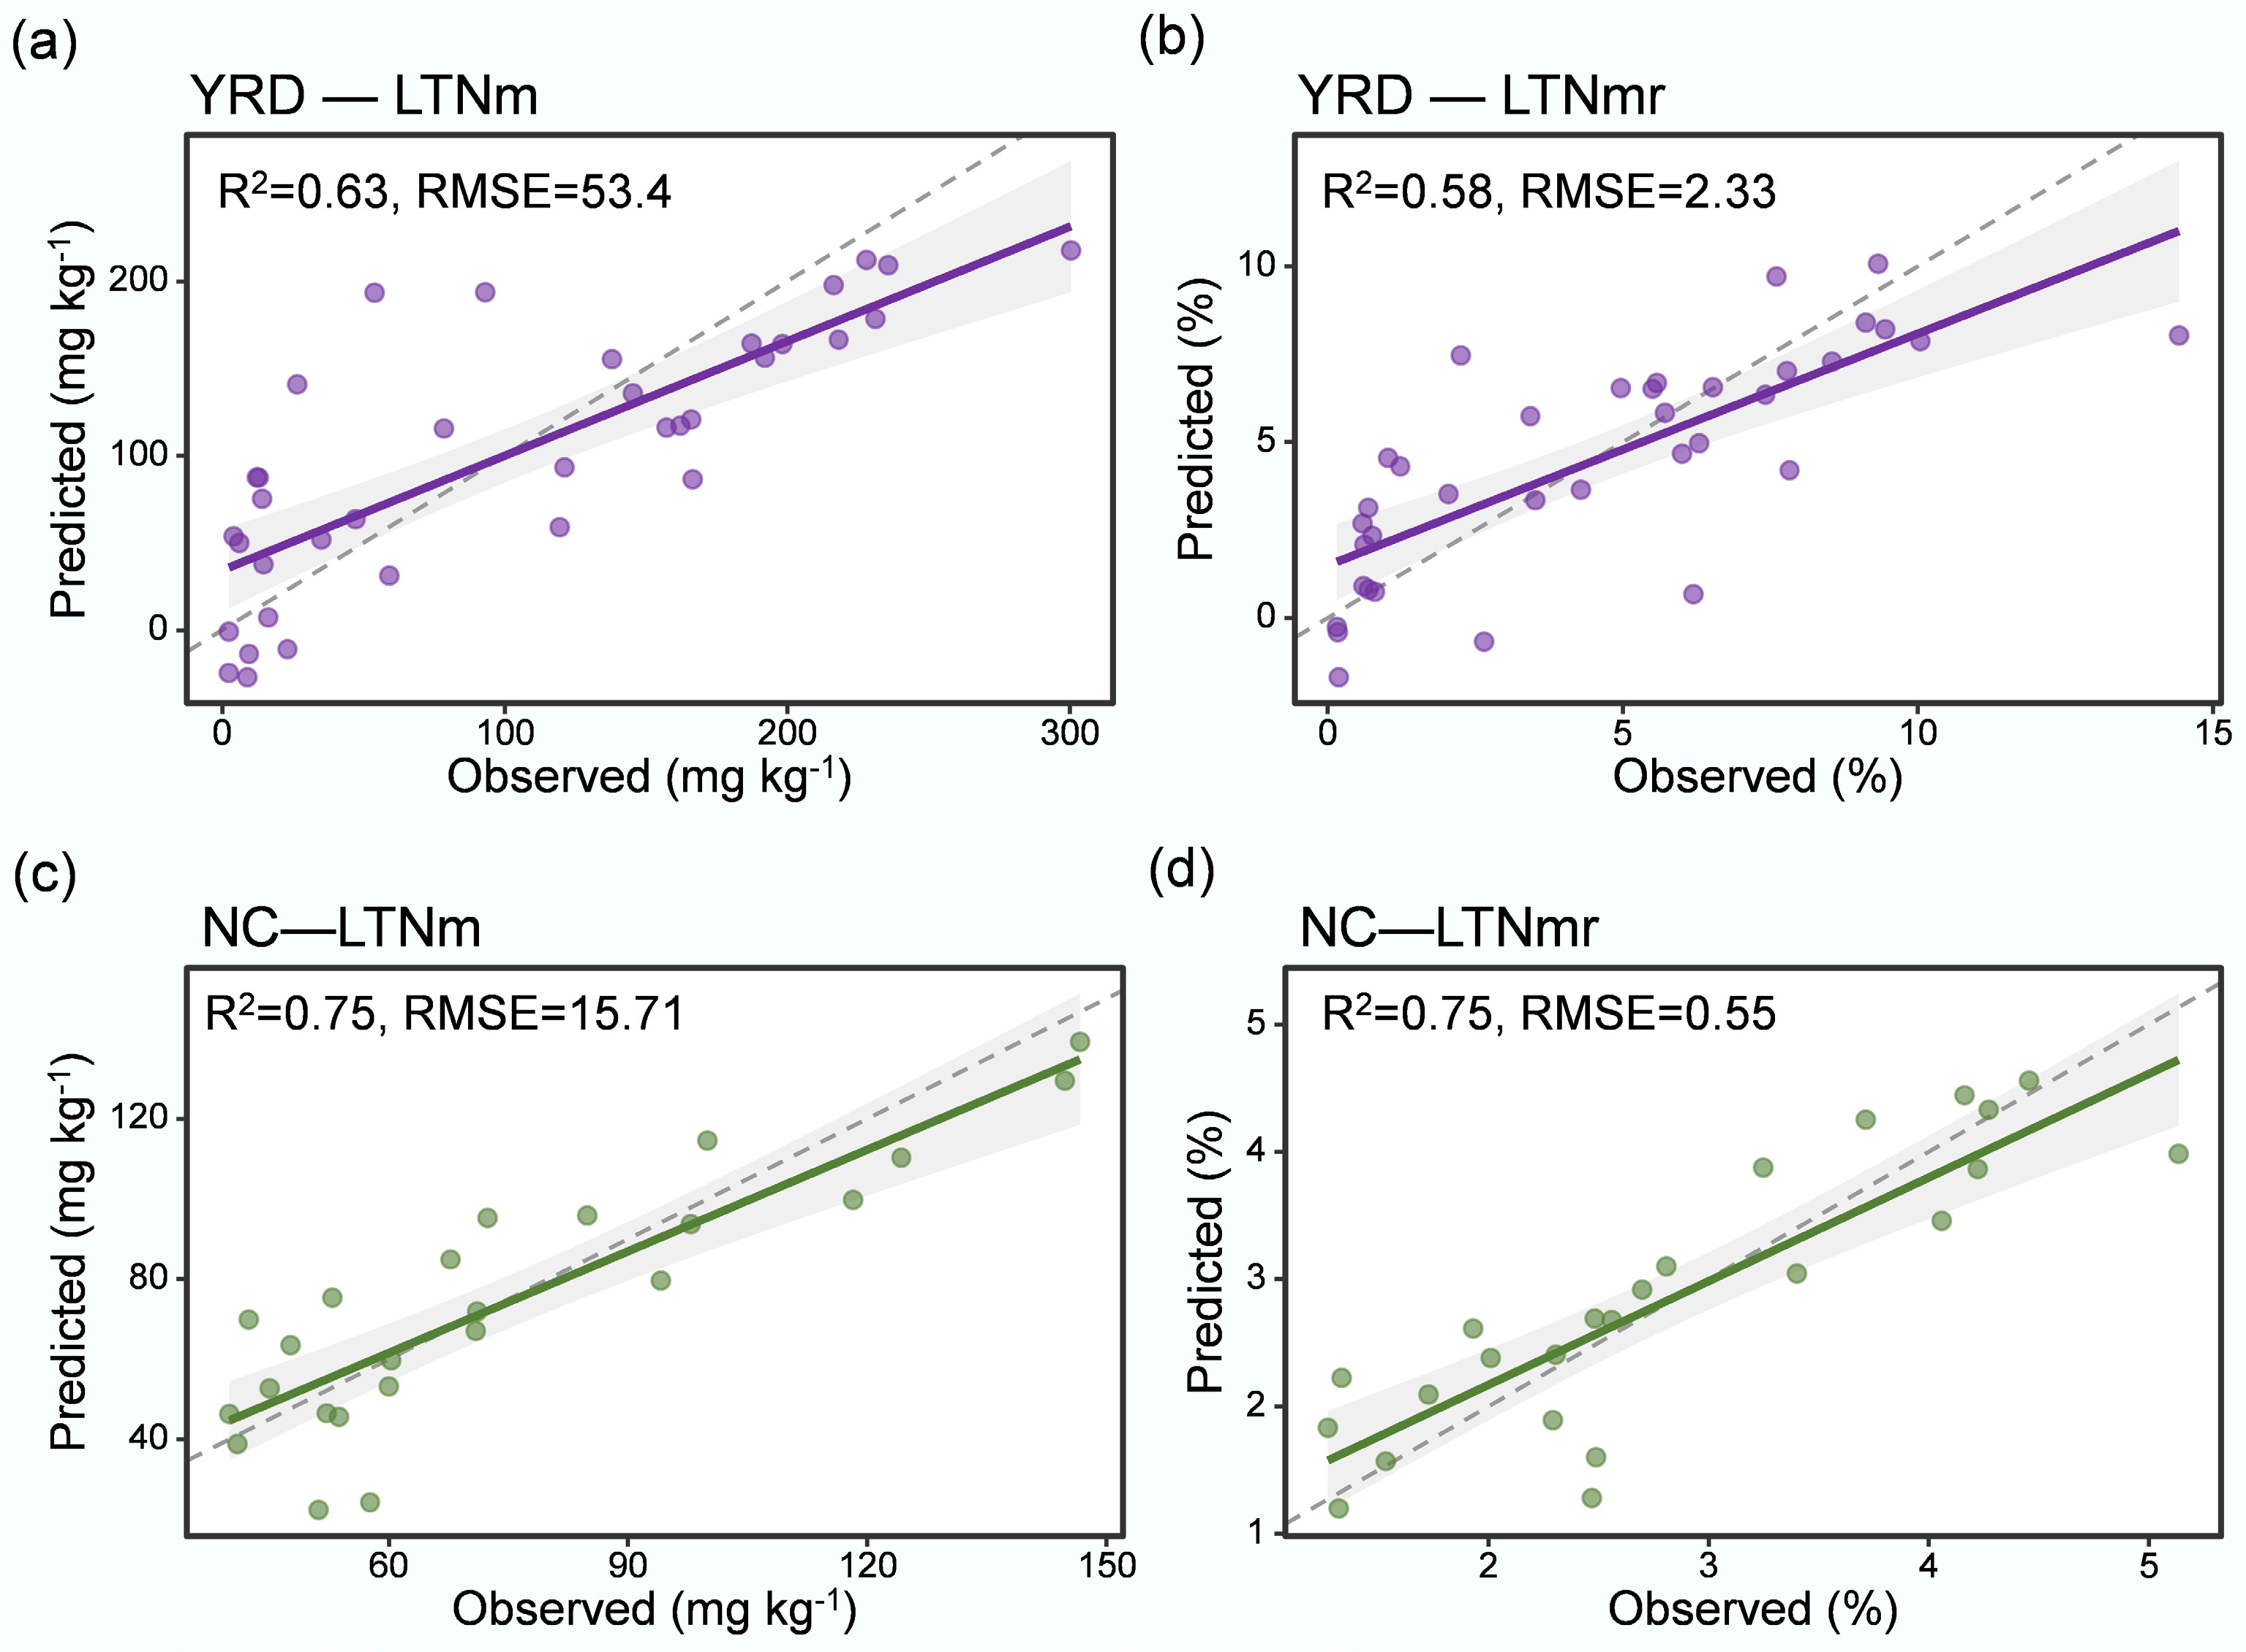
Figure 6.
(a), (c) Predicted long-term Nm (LTNm), and (b), (d) long-term Nmr (LTNmr) for typical paddy soils in the YRD and NC, derived from stepwise multiple regression models incorporating the factors listed in Table 1. Abbreviations are consistent with those in Fig. 1. Shaded areas denote 95% confidence intervals. RMSE, root mean square error.
-
Regions Dependent variable Independent variable p value R2 Regression equation YRD (n = 36) LTNm TN, pH < 0.001 0.68 LTNm = 305.37 + 44.16 × TN − 45.99 × pH LTNmr C/N, STNmr, pH, Sand, HW260 < 0.001 0.88 LTNmr = 3.59 + 1.67 × STNmr − 0.28 × Sand − 5.69 × HW260 NC (n = 24) LTNm pH, Clay, STNm, CEC < 0.001 0.83 LTNm = 192.92 + 0.89 × STNm − 25 × pH − 2.29 × Clay + 1.78 × CEC LTNmr pH, Clay, HWN, Mineral N, CWN, STNmr < 0.001 0.84 LTNmr = 10.19 + 0.89 × STNmr − 1.02 × pH − 0.08 × Clay − 0.10 × HWN + 0.13 × Mineral N − 0.36 × CWN LTNm and LTNmr represent the long-term nitrogen mineralization and long-term nitrogen mineralization ratio, STNm and STNmr represent the short-term nitrogen mineralization at 7 and 14 d in the YRD and NC, and short-term nitrogen mineralization ratio at 21 and 14 d in the YRD and NC, respectively. Table 1.
The stepwise regression equation obtained using the soil physicochemical properties and rapid extractions to predict the LTNm and LTNmr in the YRD and NC
Figures
(6)
Tables
(1)