-
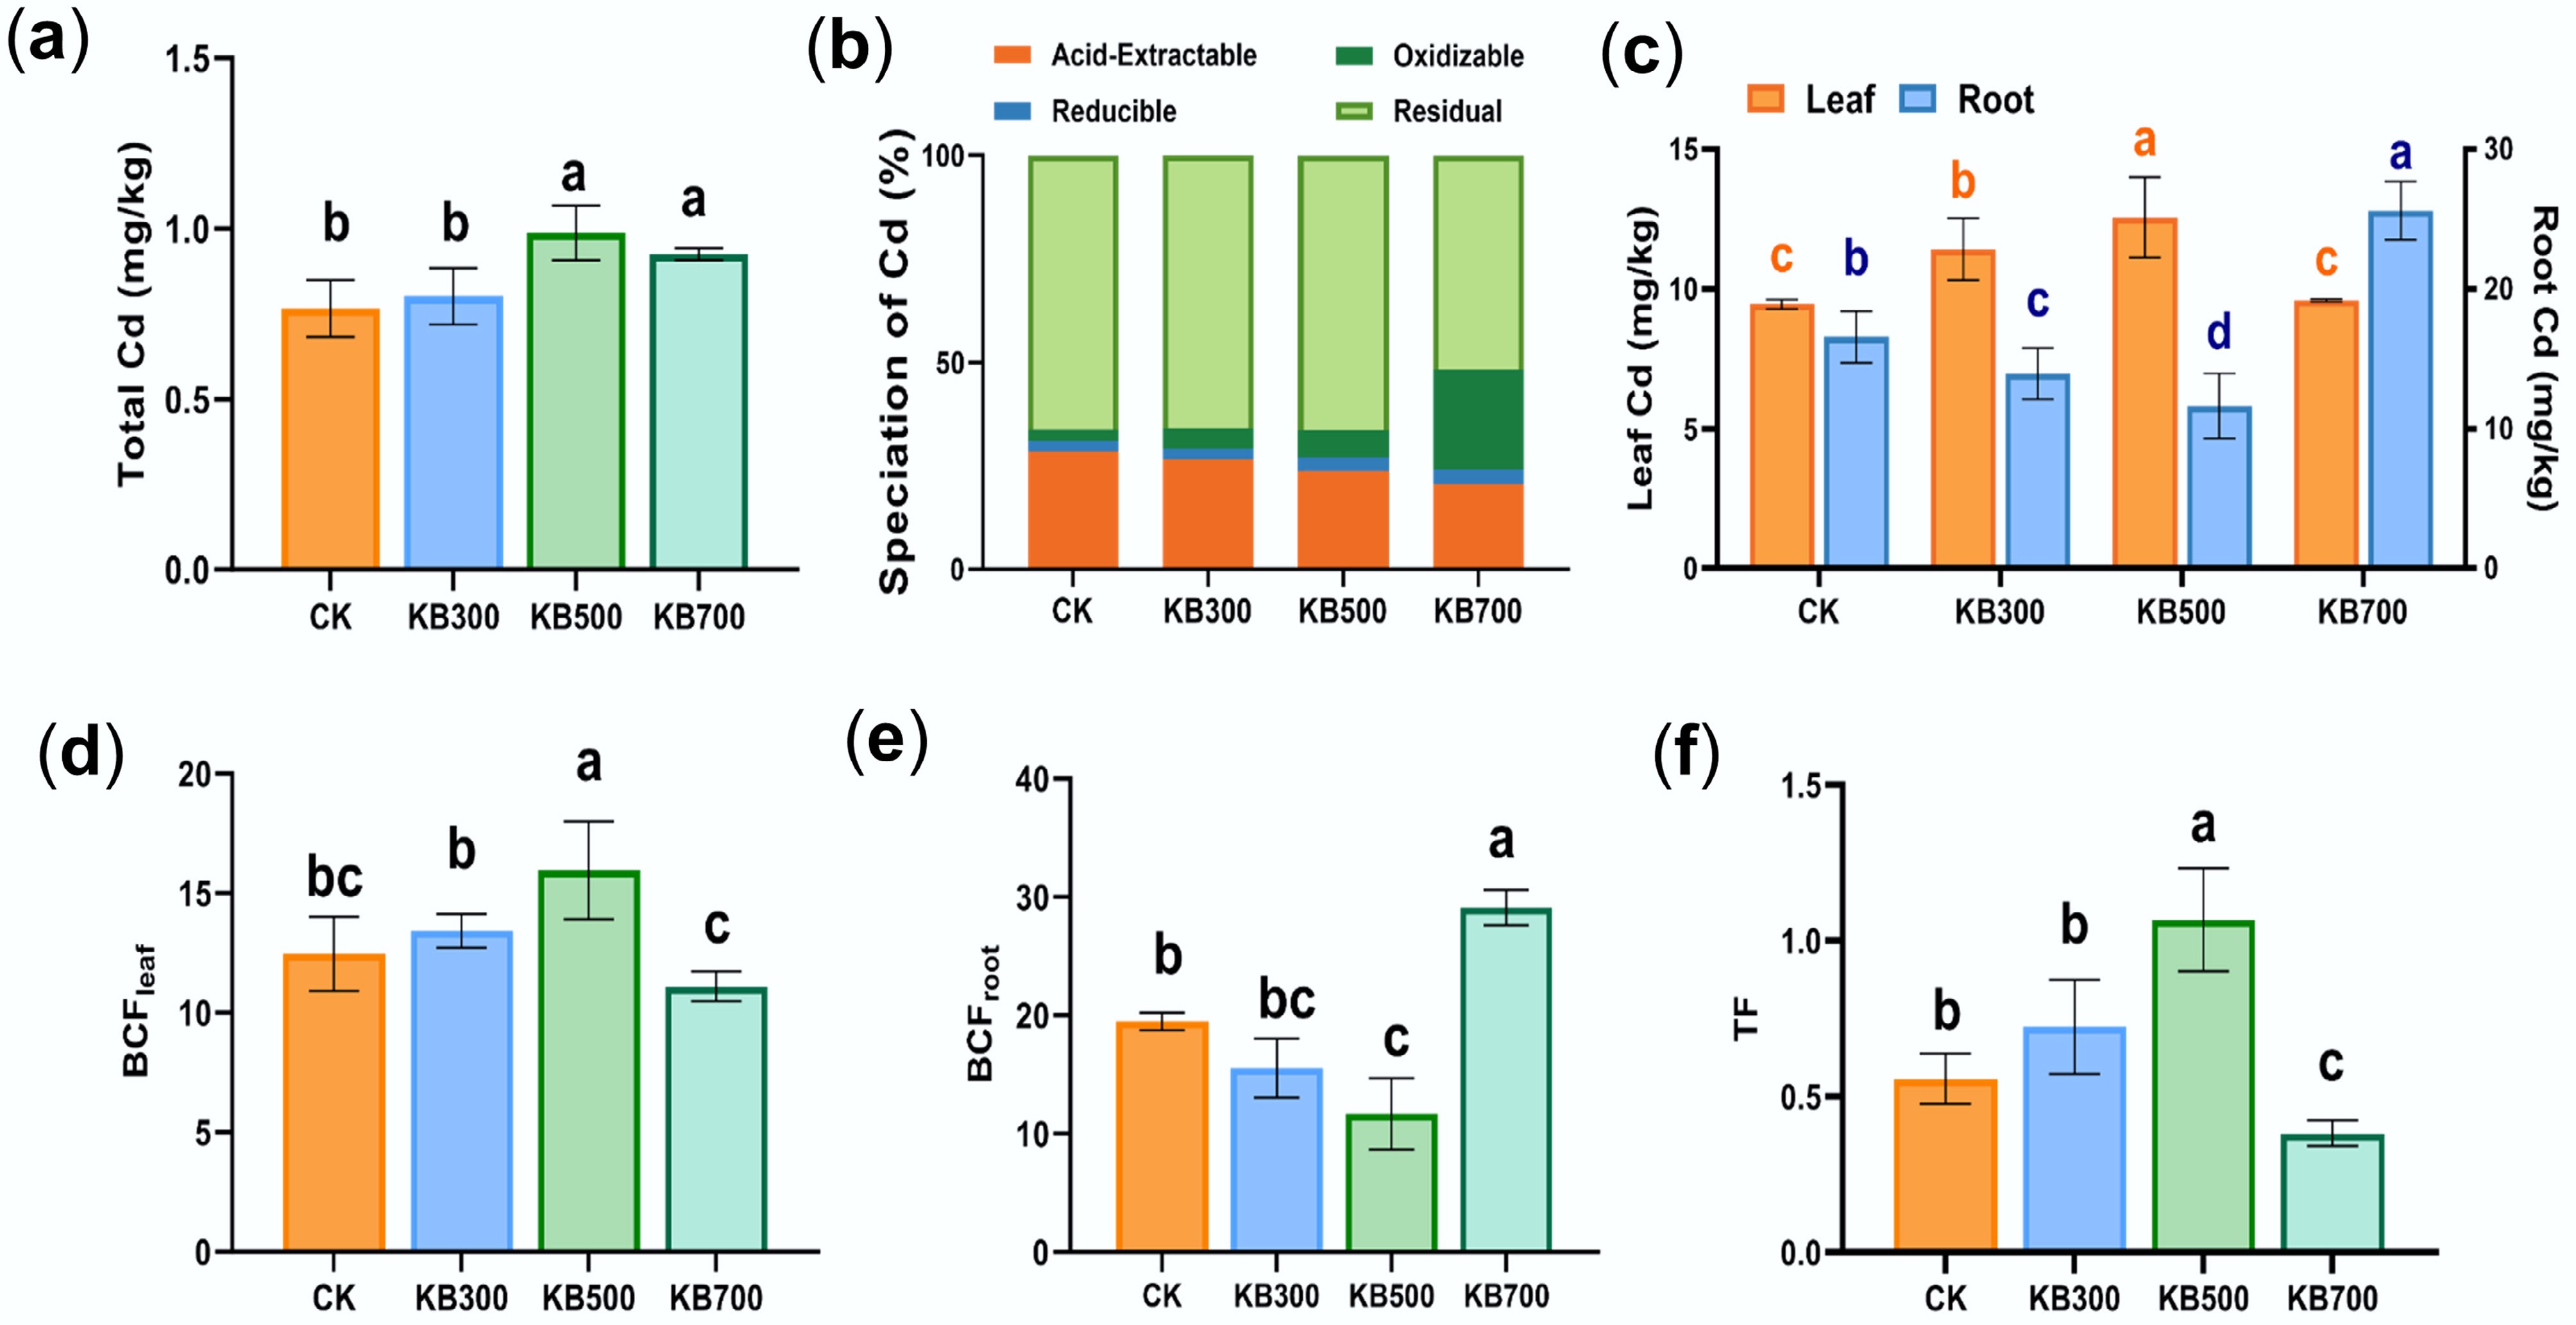
Figure 1.
Cd concentration, chemical speciation, and bioconcentration factor (BCF) in soil under biochar treatments. (a) Total Cd concentration in soils under different treatments. (b) The fraction distribution of Cd under each treatment. (c) The concentration of Cd in plant roots and leaves. (d) The bioconcentration factor of Cd in plant leaves. (e) The bioconcentration factor of Cd in plant roots. (f) The translocation factor of Cd from roots to leaves. (CK represents the control group; KB indicates treatments with biochar prepared at different pyrolysis temperatures).
-
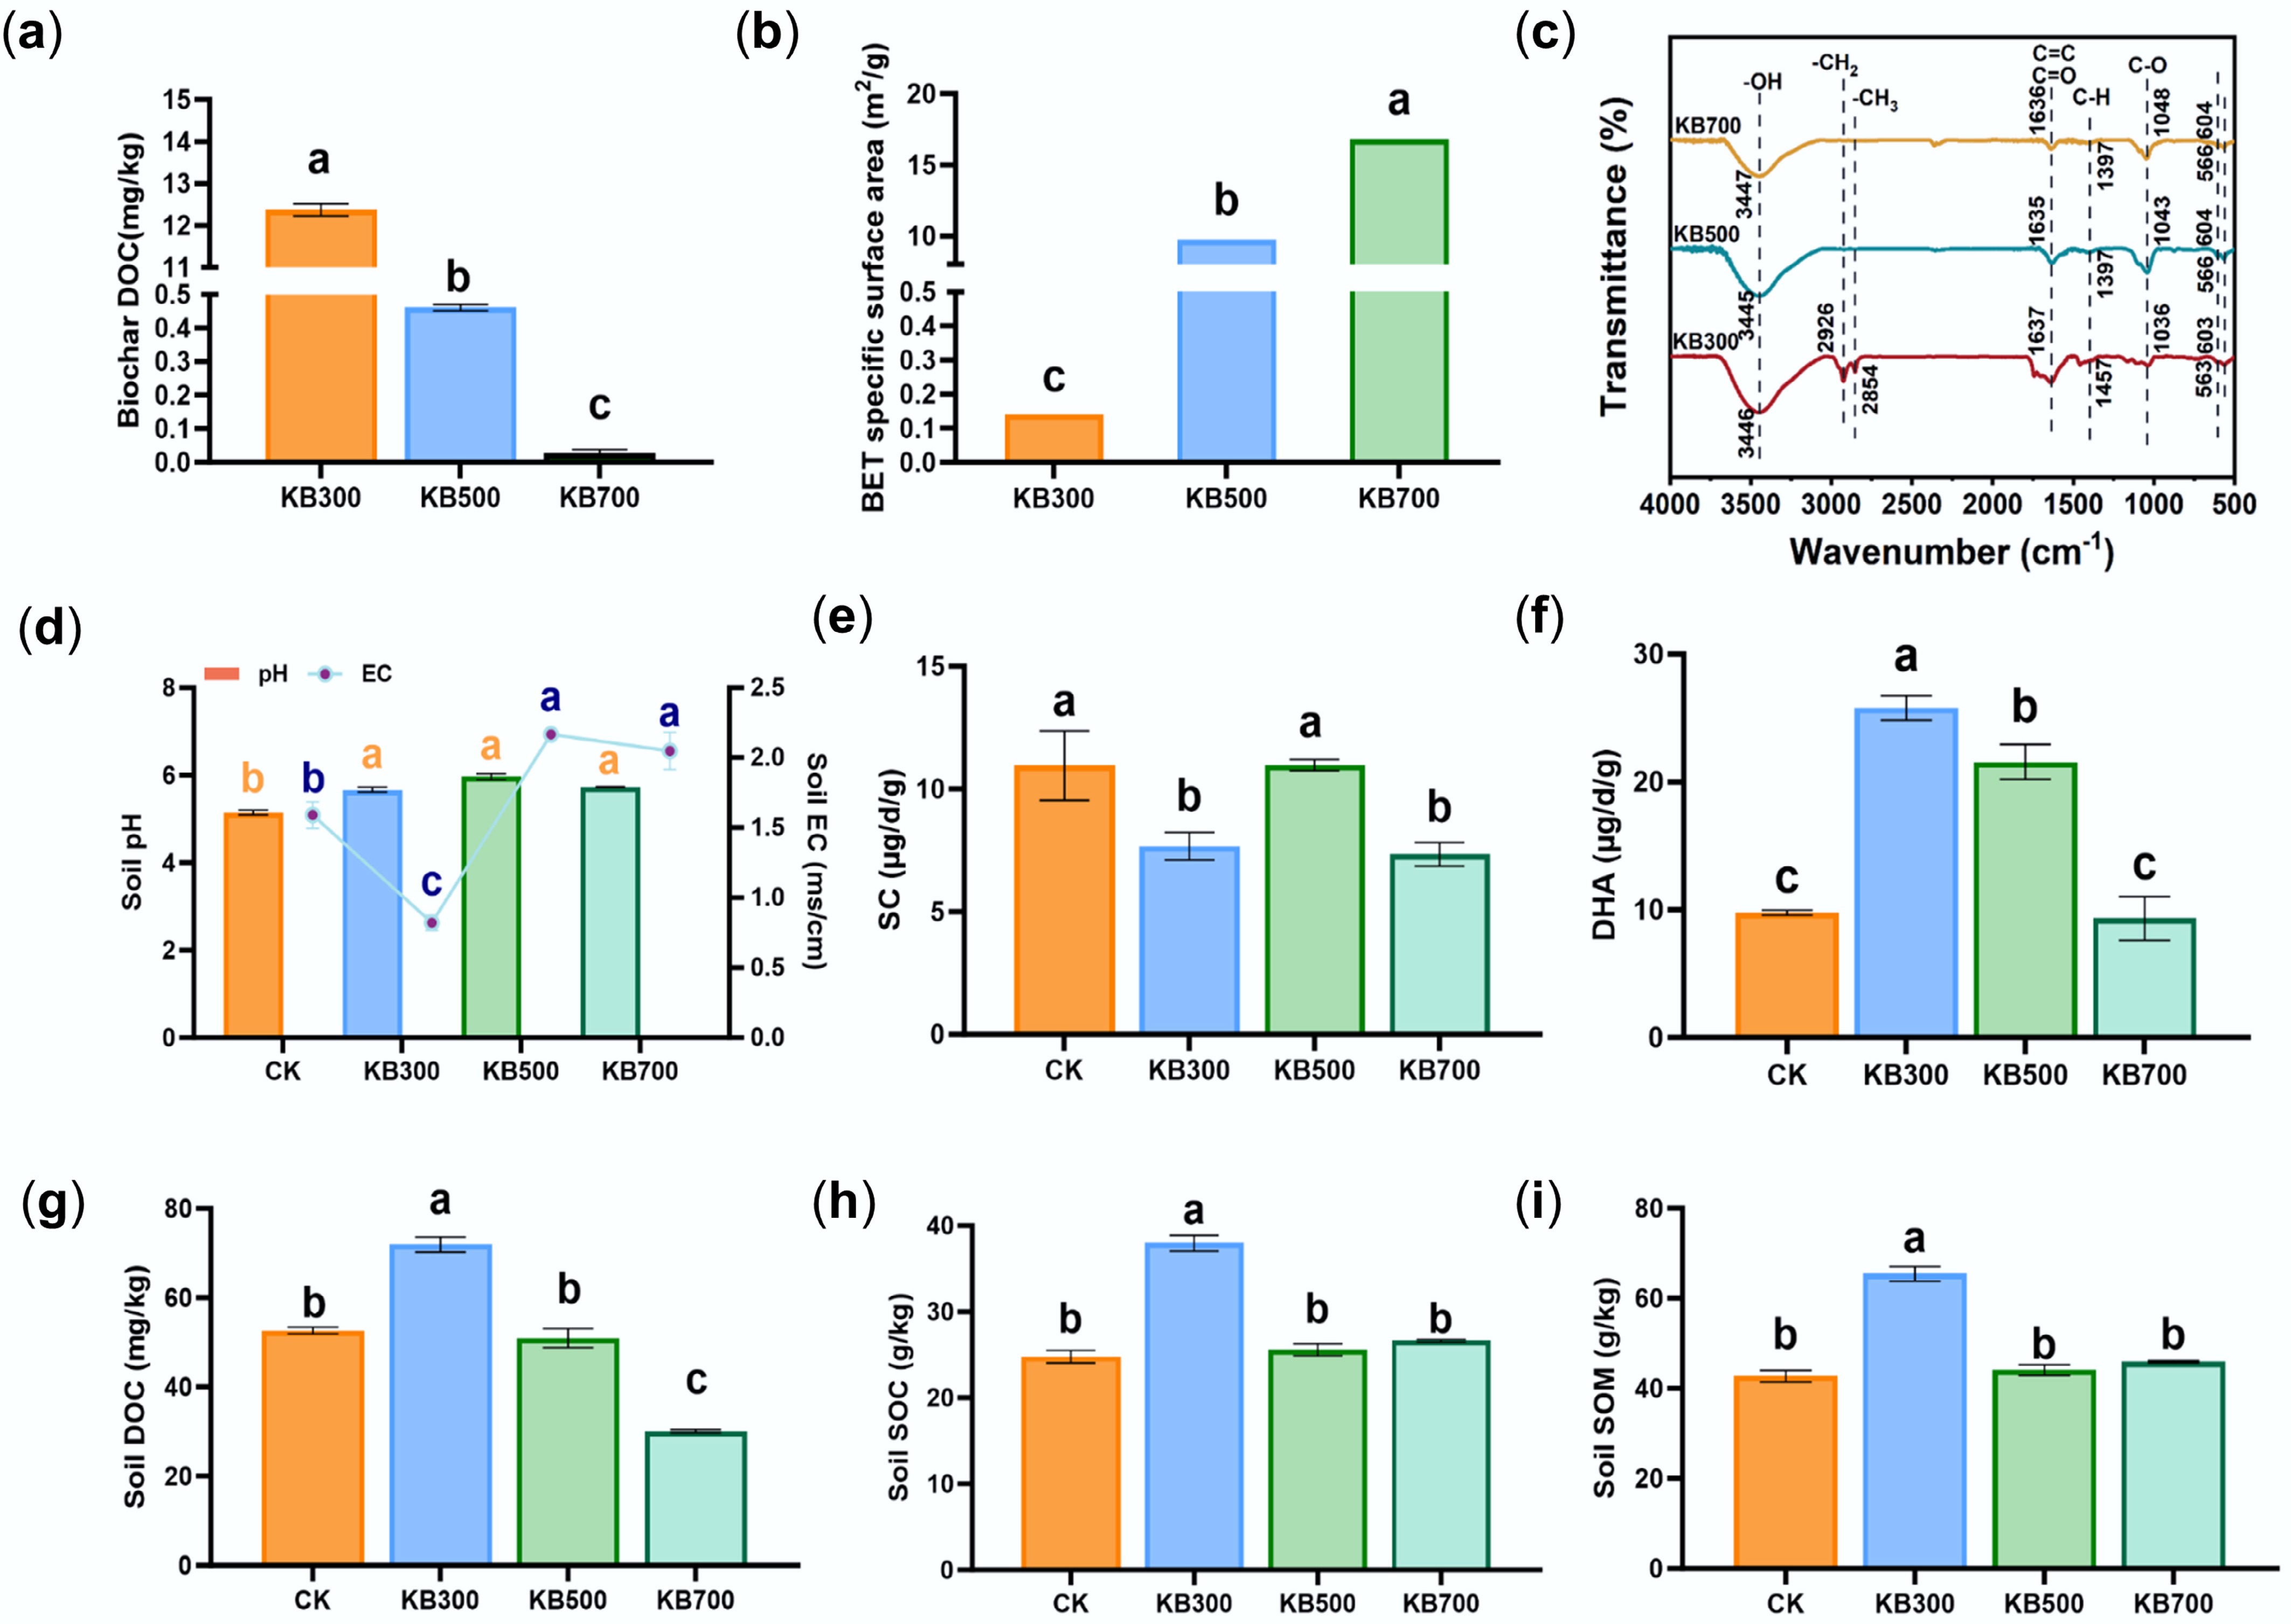
Figure 2.
Physicochemical properties of biochars prepared at different pyrolysis temperatures and their effects on soil properties and enzyme activities. (a) DOC content of biochar pyrolyzed at 300, 500, and 700 °C. (b) BET of biochar at different pyrolysis temperatures. (c) FTIR spectra of biochar prepared at different temperatures. (d) Soil pH and EC under different treatments. (e) Soil sucrase (SC) activity under different treatments. (f) DHA activity under different treatments. (g) Soil DOC content. (h) SOC content under different treatments. (i) SOM content under different treatments.
-
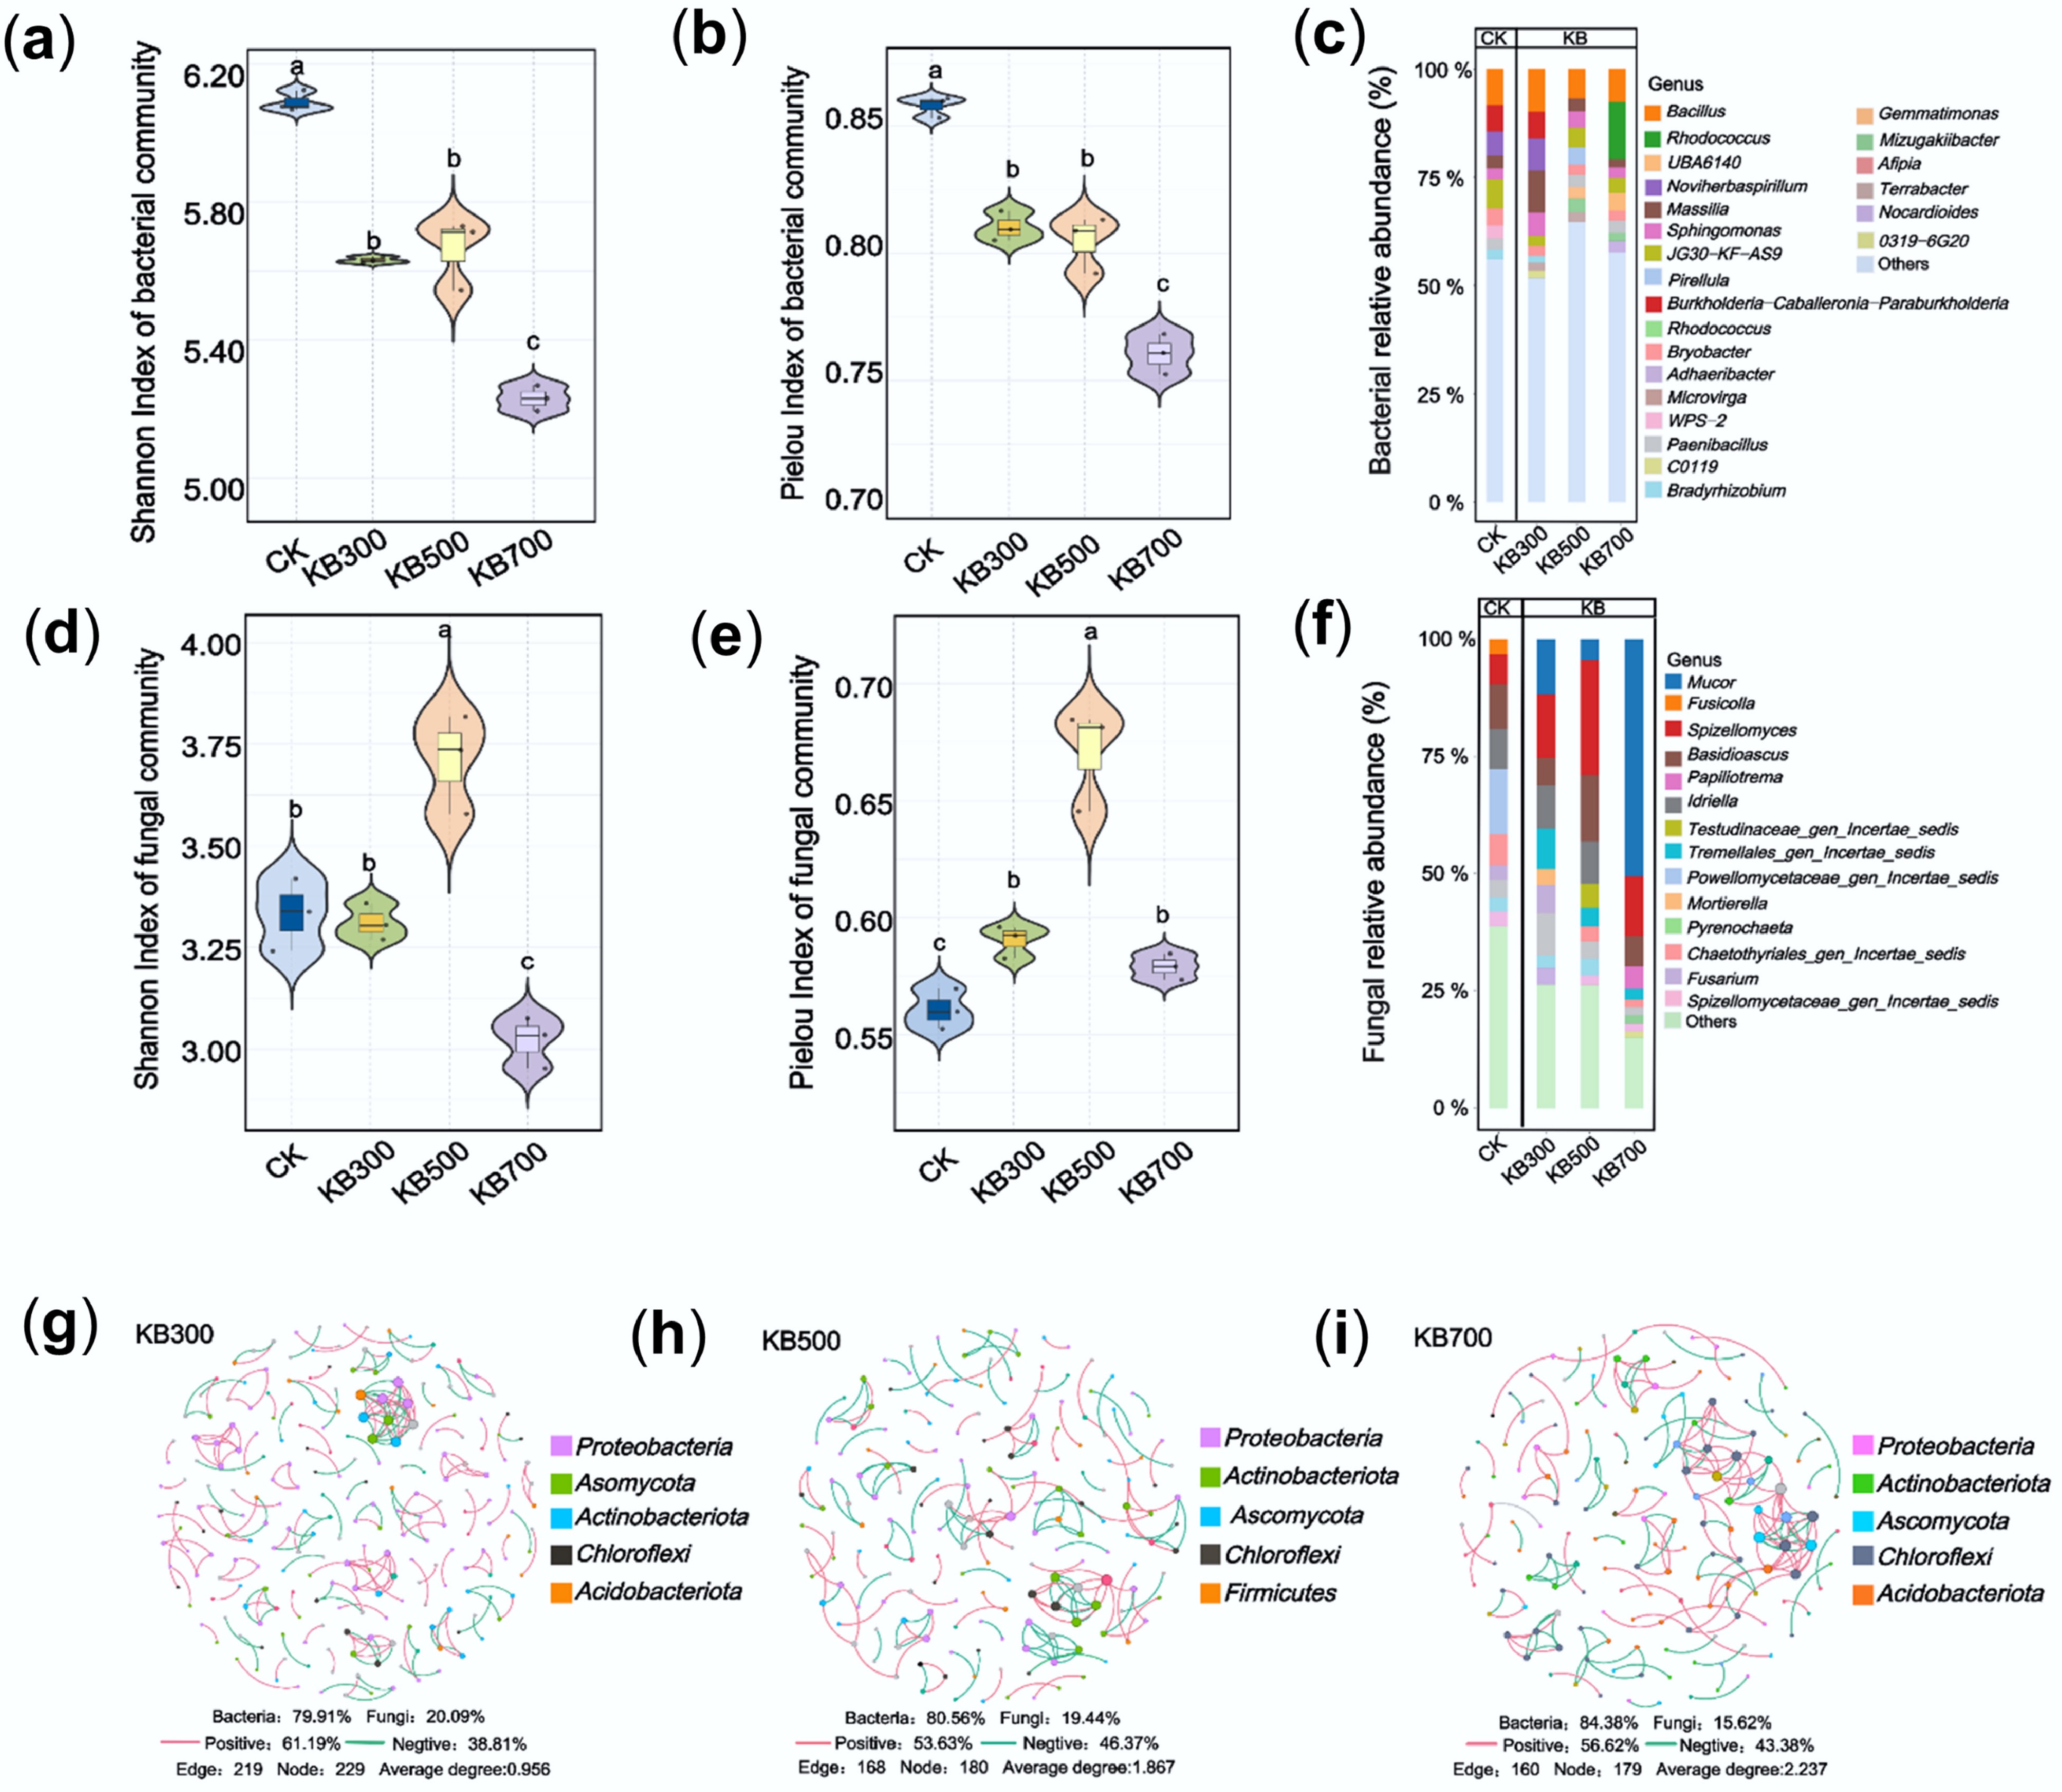
Figure 3.
Soil microbial community structure and diversity under treatments of biochar prepared at different pyrolysis temperatures. (a) Bacterial Shannon diversity index. (b) Bacterial Pielou evenness index. (c) Relative abundance of bacterial genera. (d) Fungal Shannon diversity index. (e) Fungal Pielou evenness index. (f) Relative abundance of fungal genera. (g)–(i) Microbial co-occurrence network diagrams in soils treated with biochar pyrolyzed at 300, 500, and 700 °C, respectively.
-
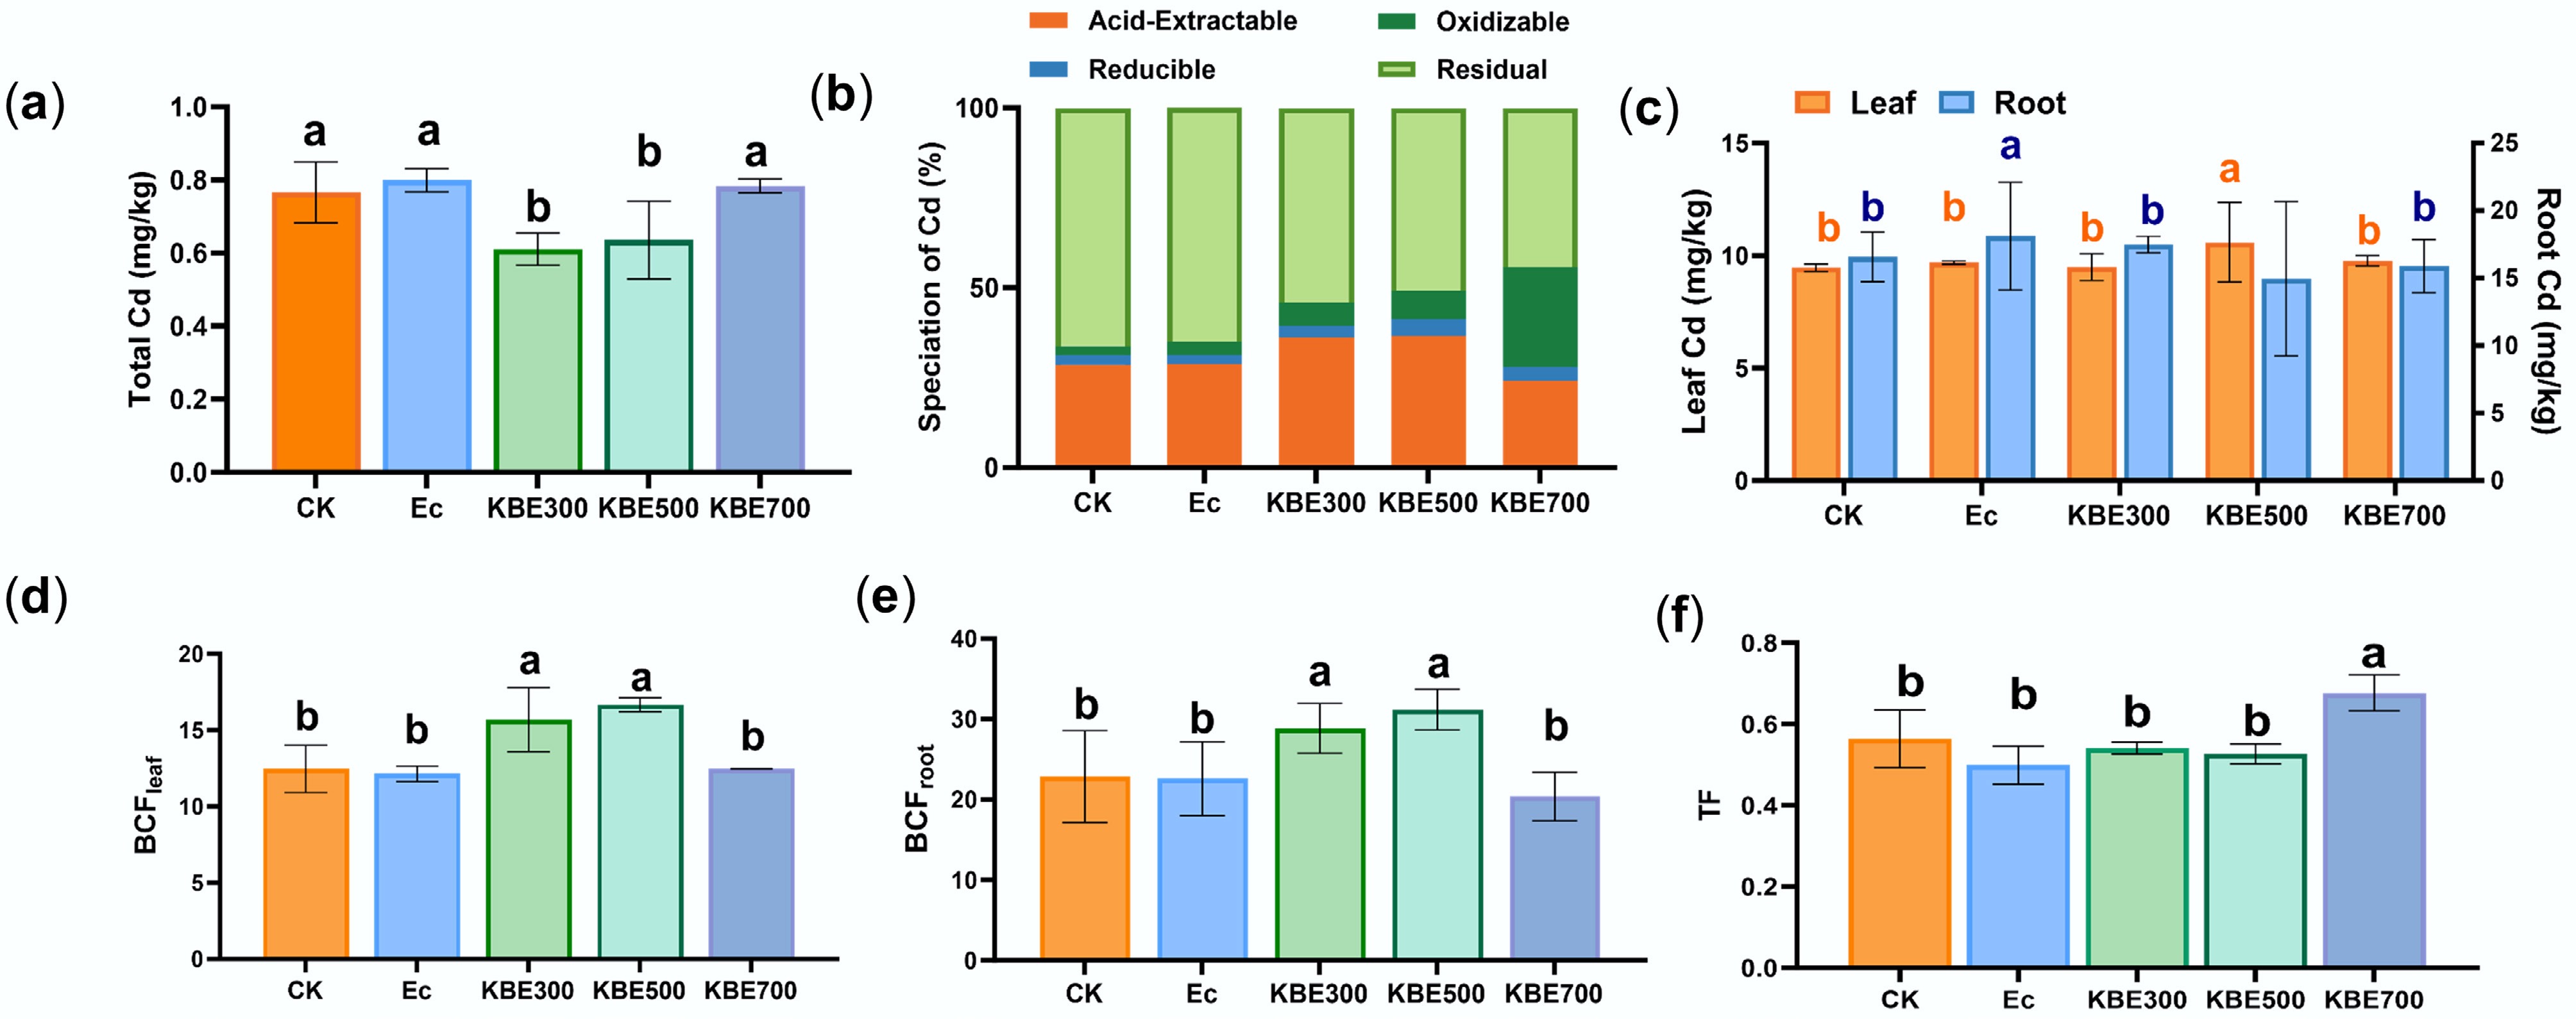
Figure 4.
Concentration, chemical speciation, and bioconcentration factor (BCF) of Cd under E. coli treatments. (a) Total Cd concentration in soils under different treatments. (b) The fraction distribution of Cd under different treatments. (c) The concentration of Cd in plant roots and leaves. (d) Cd bioconcentration factor in plant leaves. (e) The bioconcentration factor of Cd in plant roots. (f) The translocation factor of Cd from roots to shoots, where Ec denotes the groups treated only with E. coli, and KBE denotes the groups treated with a combination of food waste biochar and E. coli.
-
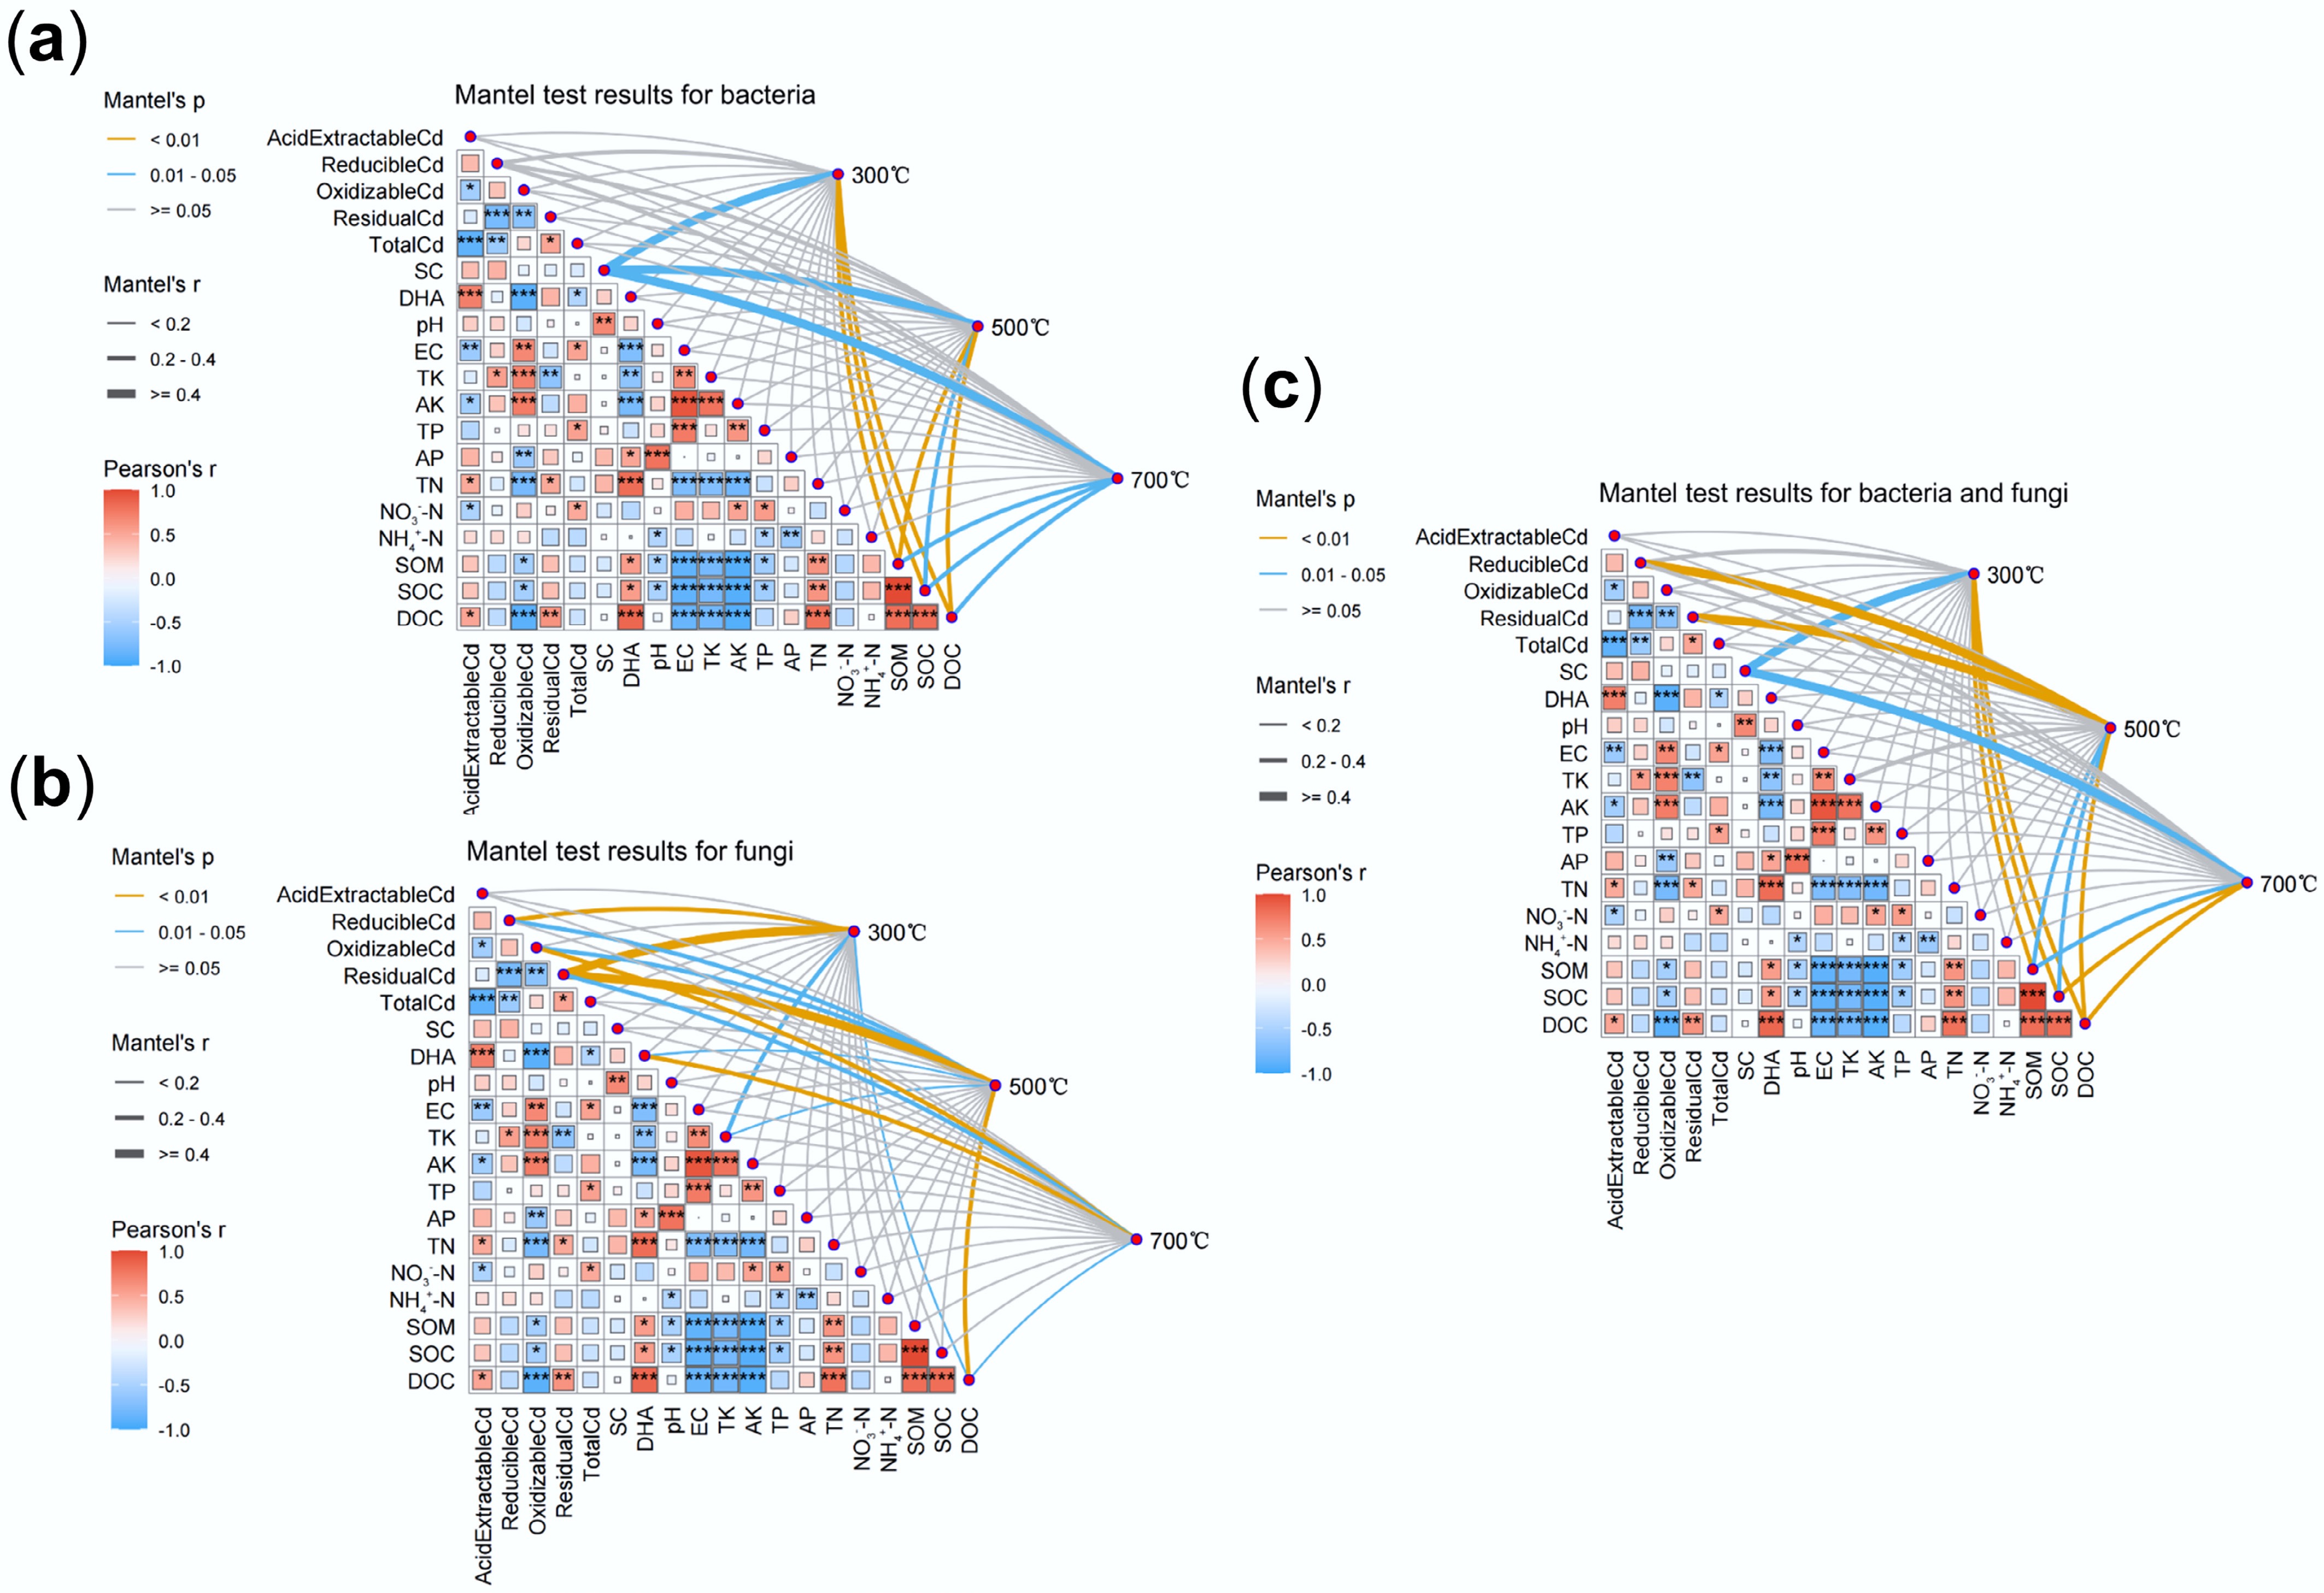
Figure 5.
Mantel test analysis of microbial communities in soils with treatments of biochars prepared at different pyrolysis temperatures. (a) Bacterial communities. (b) Fungal communities. (c) Overall test for bacterial and fungal communities.
-

Figure 6.
Comprehensive evaluation of the effects of biochar and E. coli on soil microbial functions, fertility, and Cd bioavailability.
Figures
(6)
Tables
(0)