-
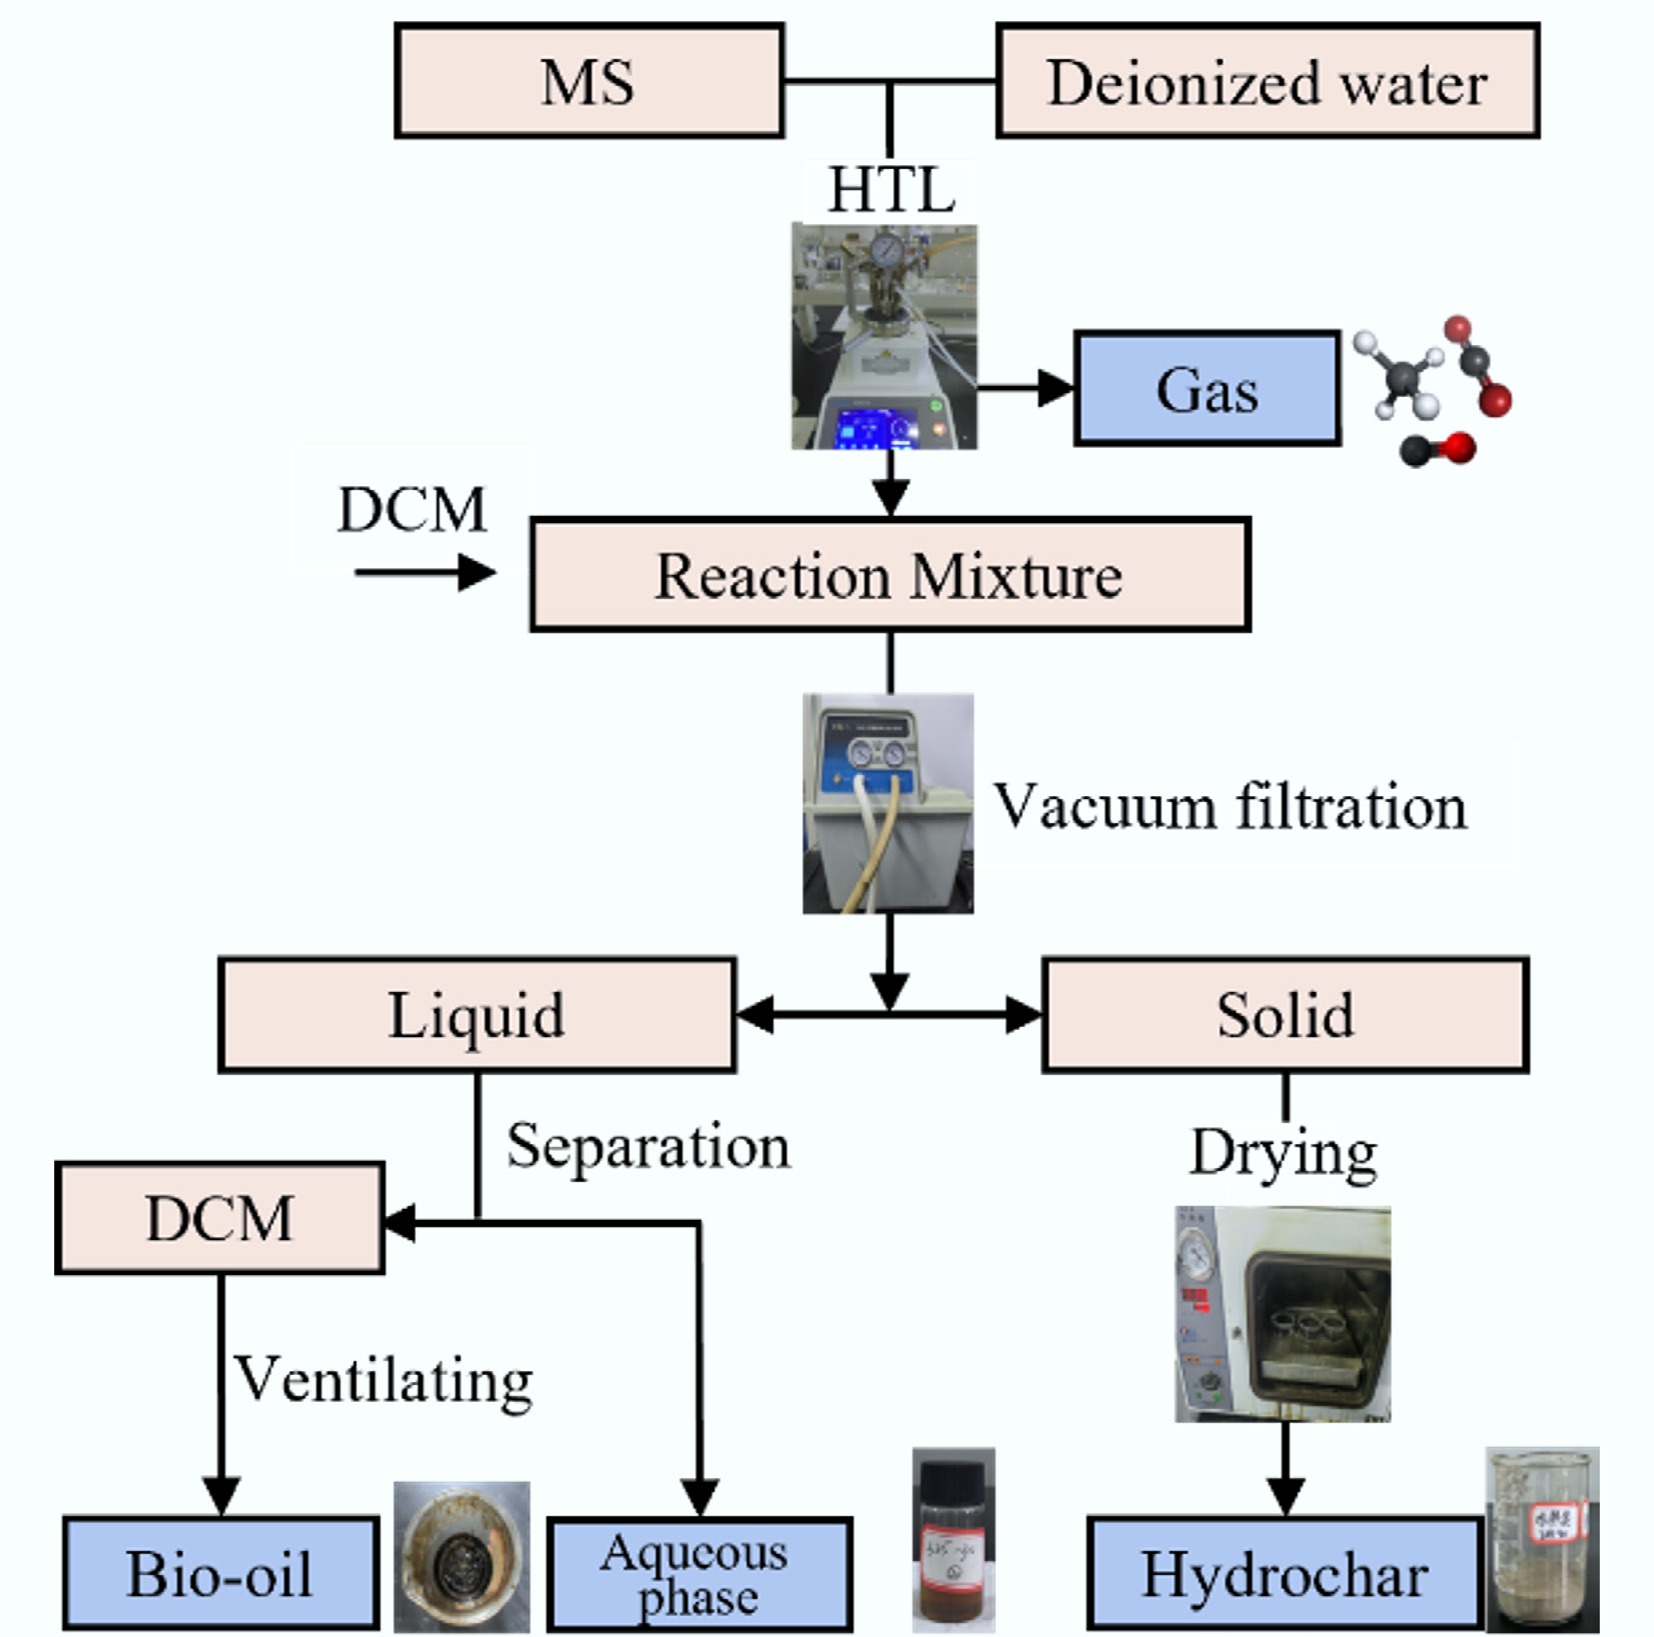
Figure 1.
Product separation procedure of HTL process.
-
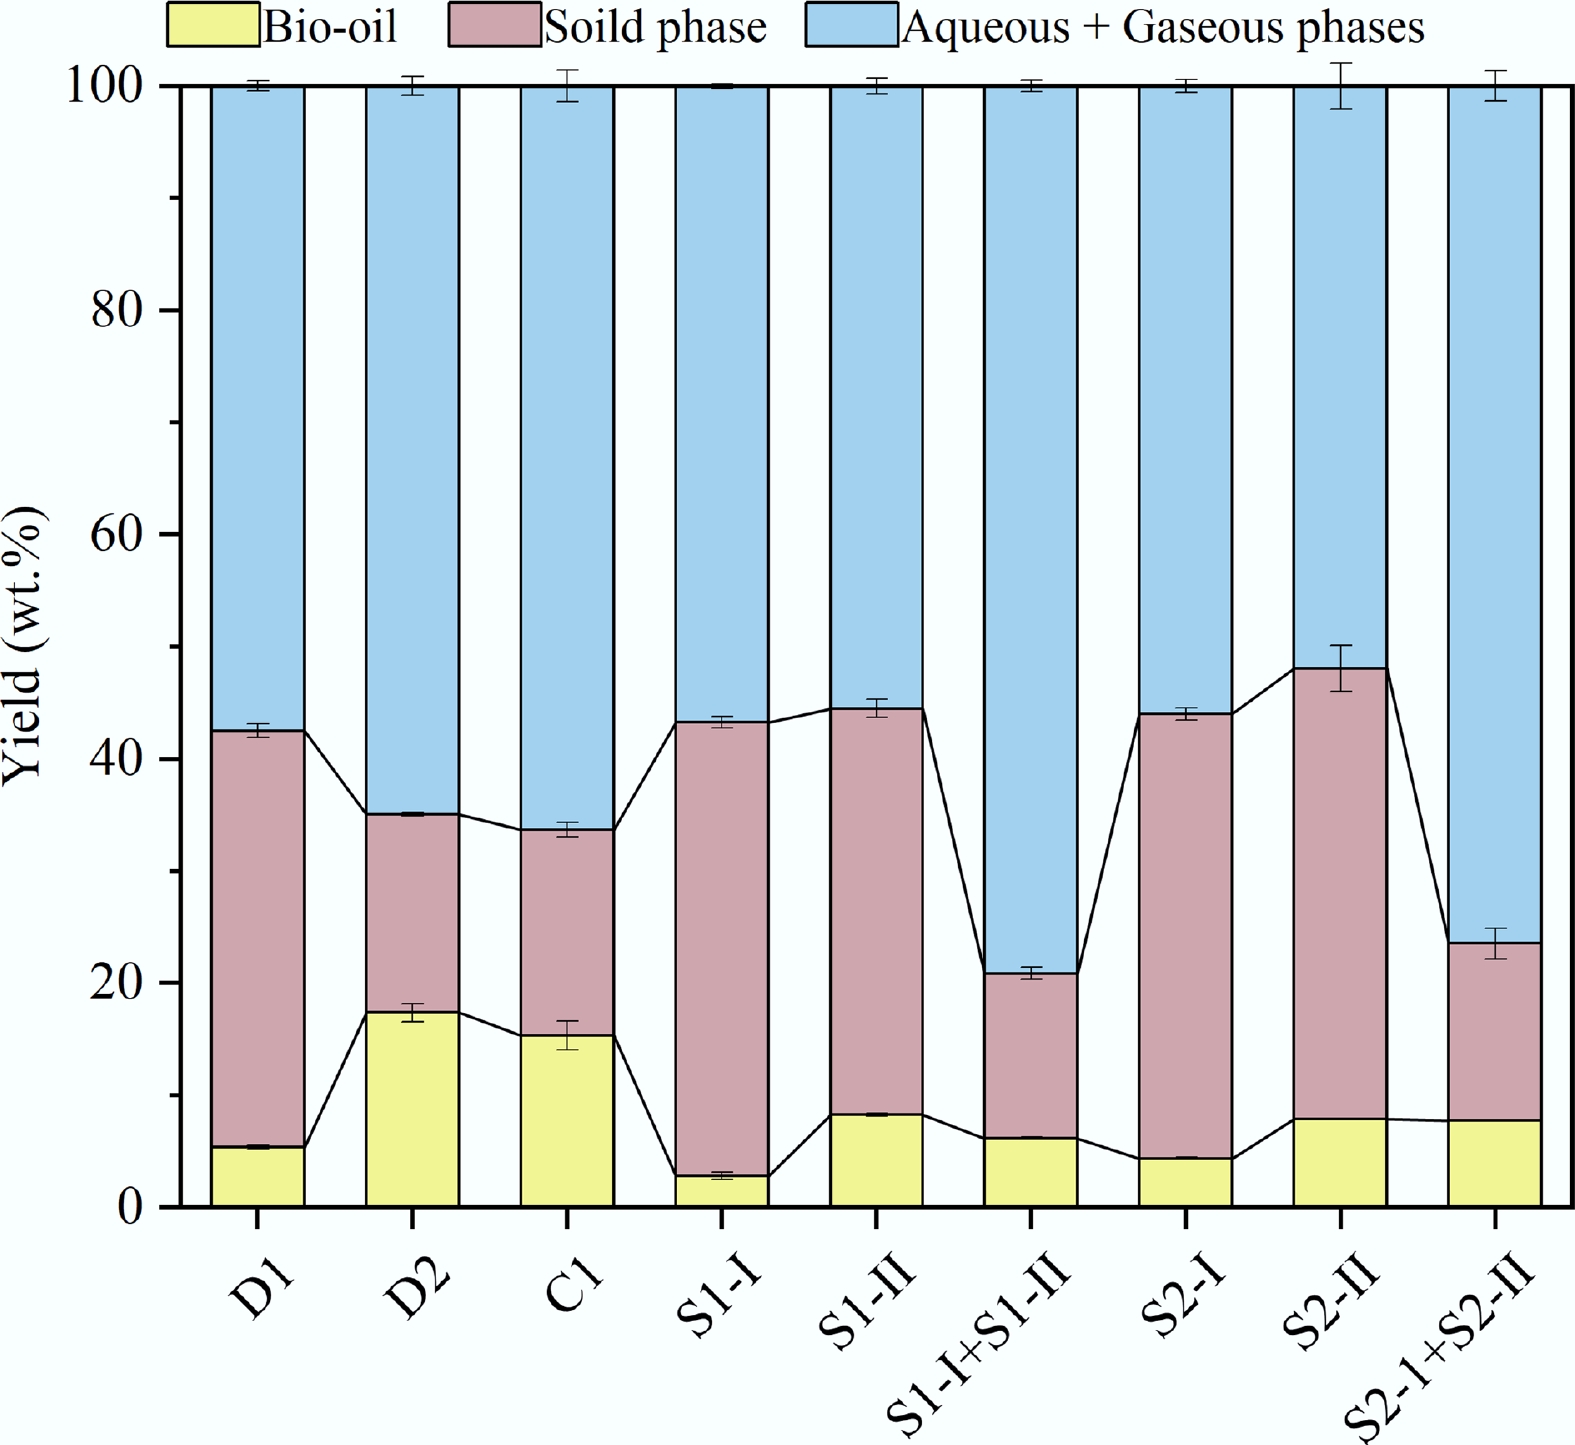
Figure 2.
Product distributions under different HTL processes.
-
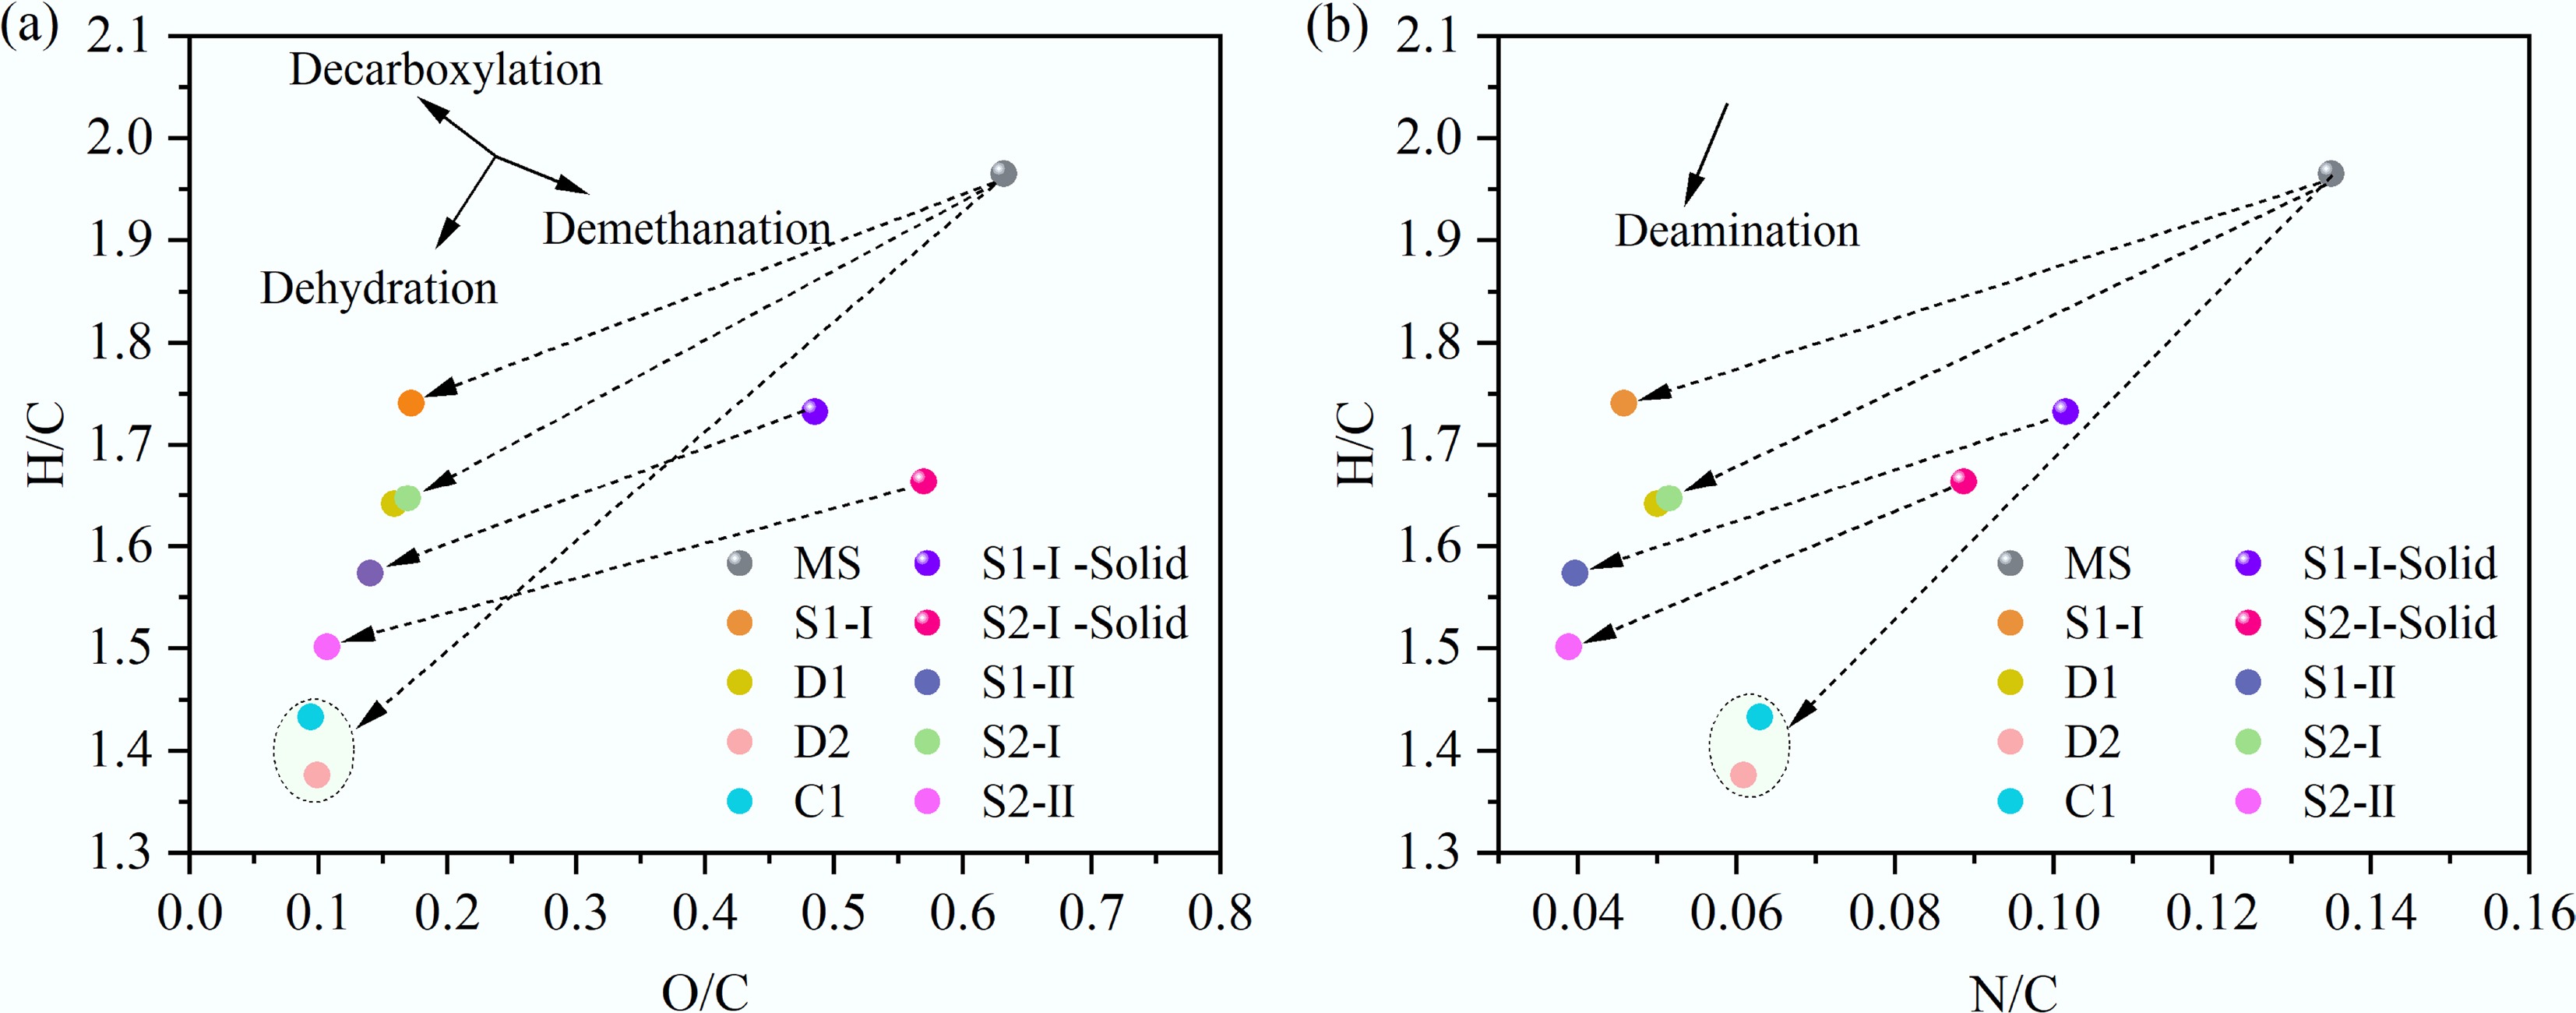
Figure 3.
Van Krevelen diagrams for (a) MS and (b) bio-oil.
-
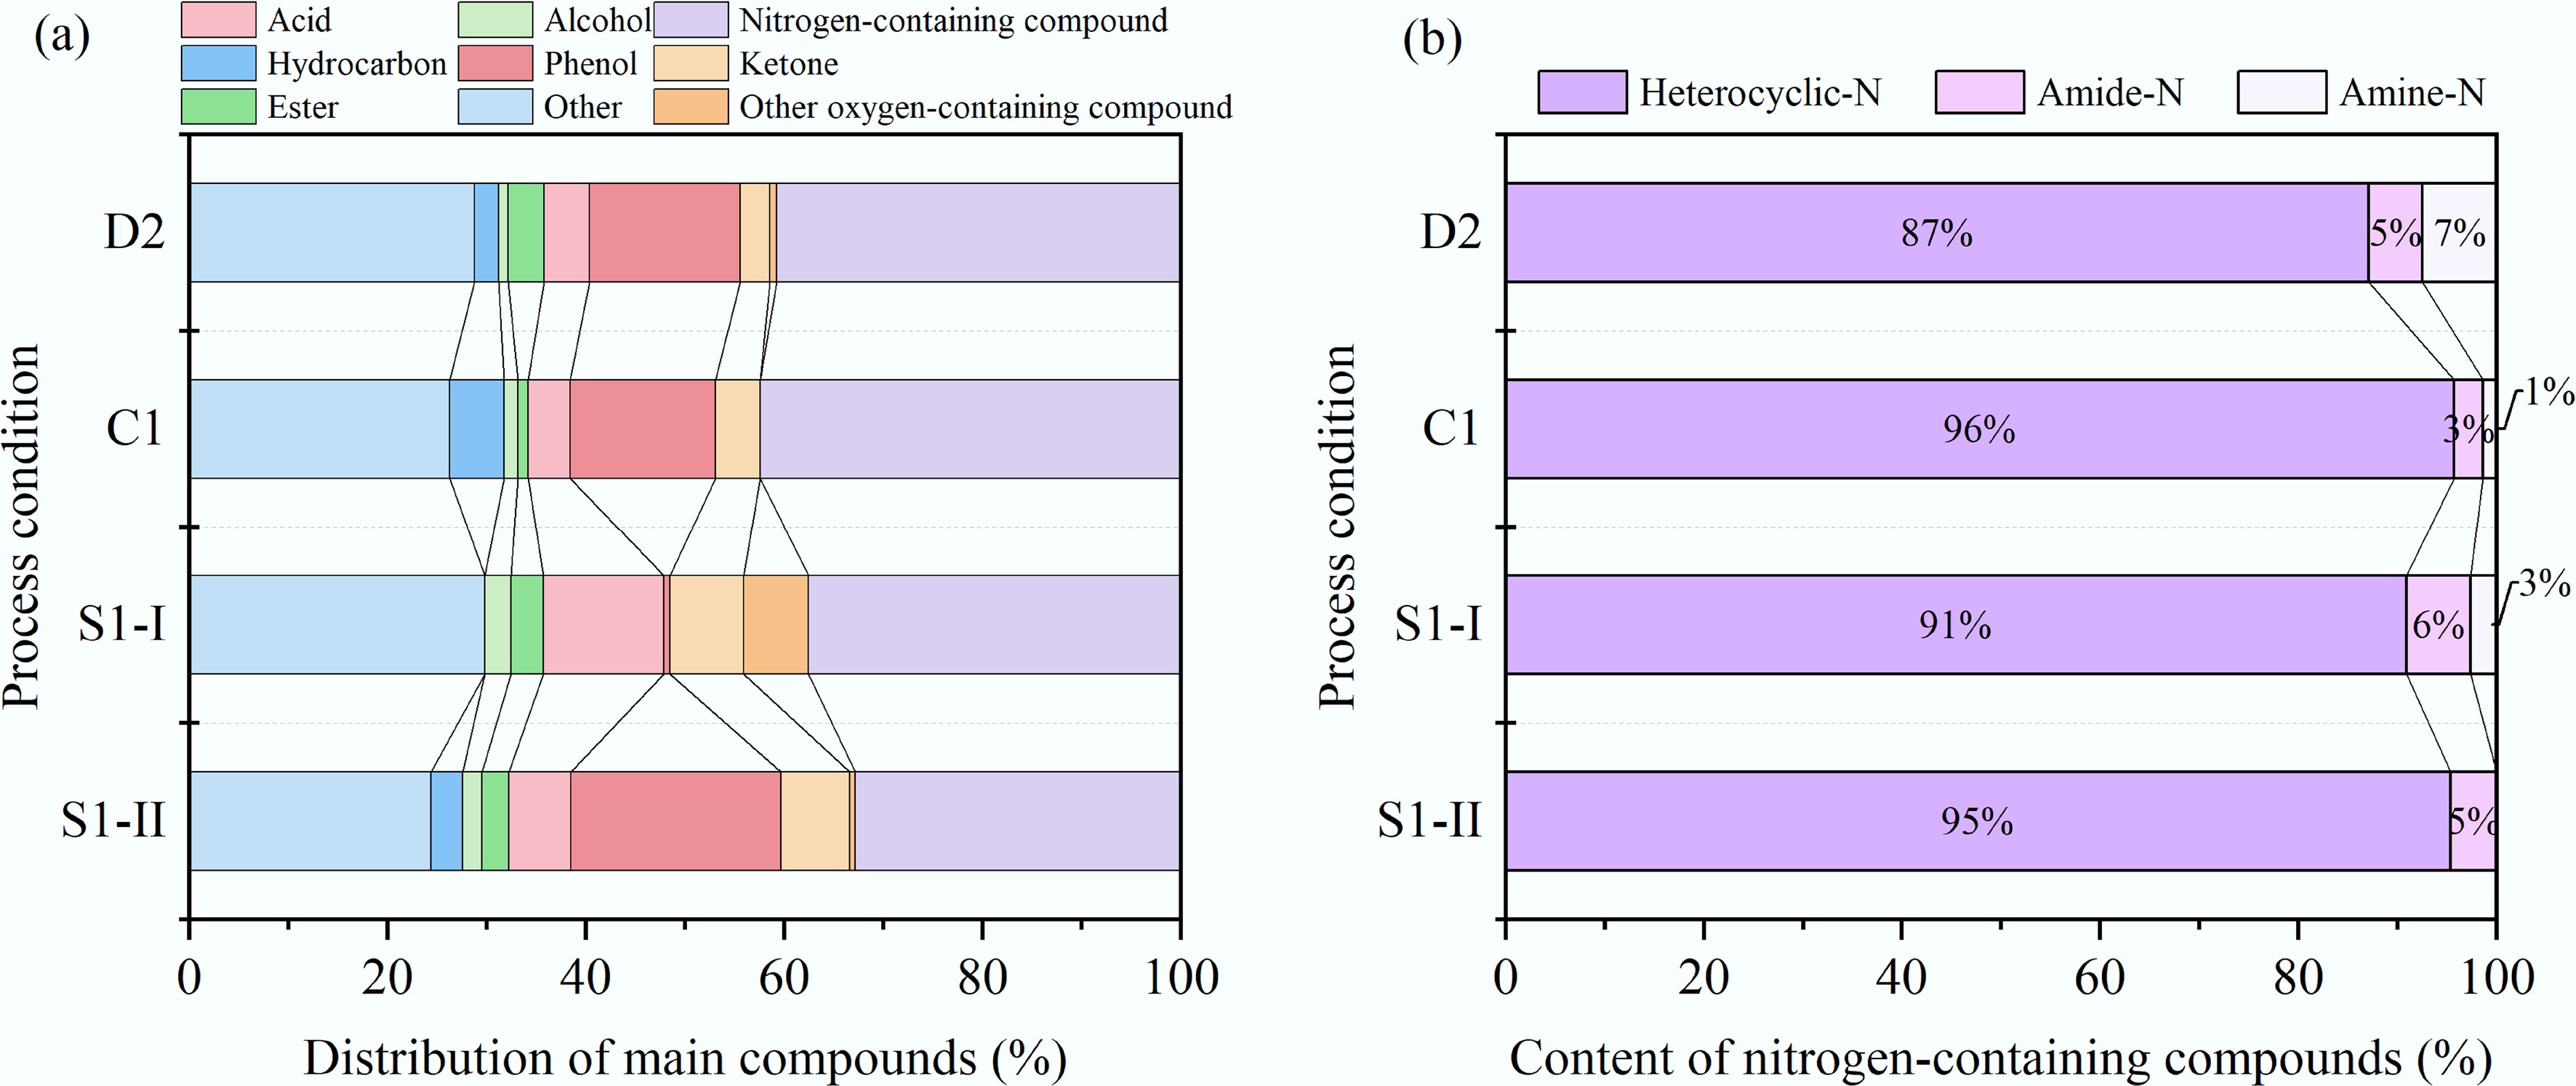
Figure 4.
Compounds contained in bio-oil obtained by different HTL processes. (a) Distribution of main compounds. (b) Content of nitrogen-containing compounds.
-
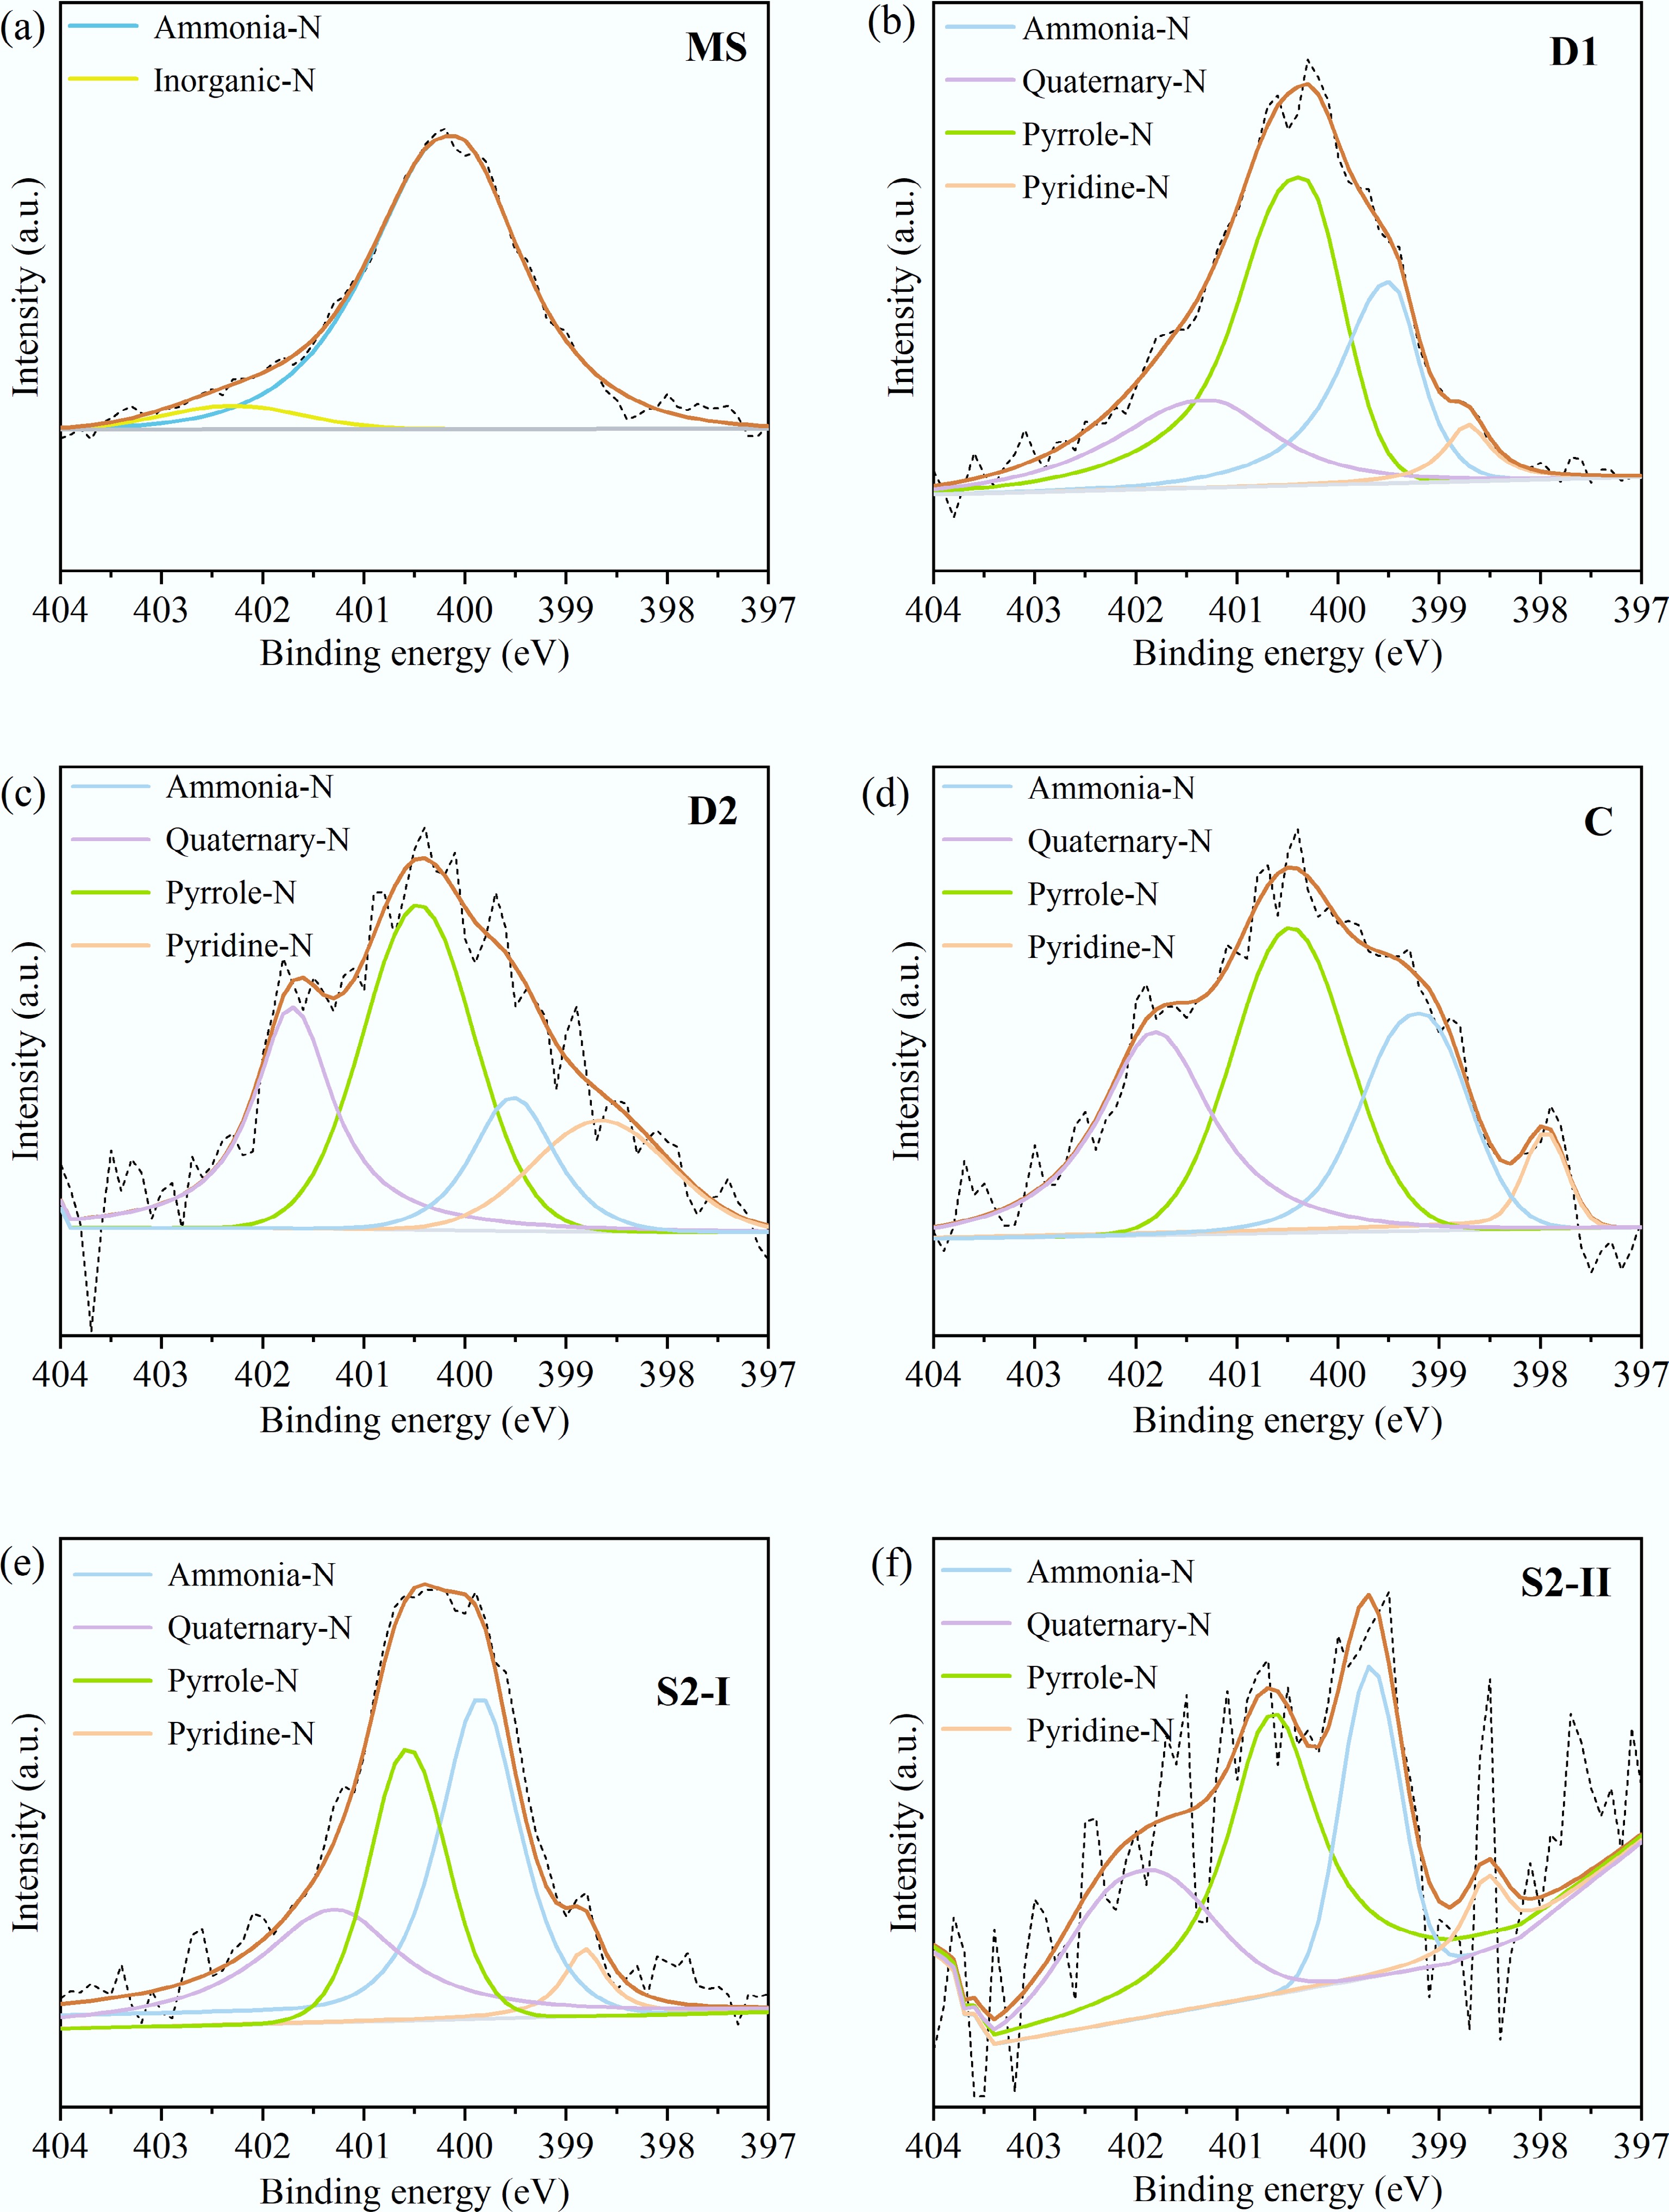
Figure 5.
XPS spectra of N1s in the solid product from (a) MS, (b) D1, (c) D2, (d) C, (e) S2-I, and (f) S2-II.
-
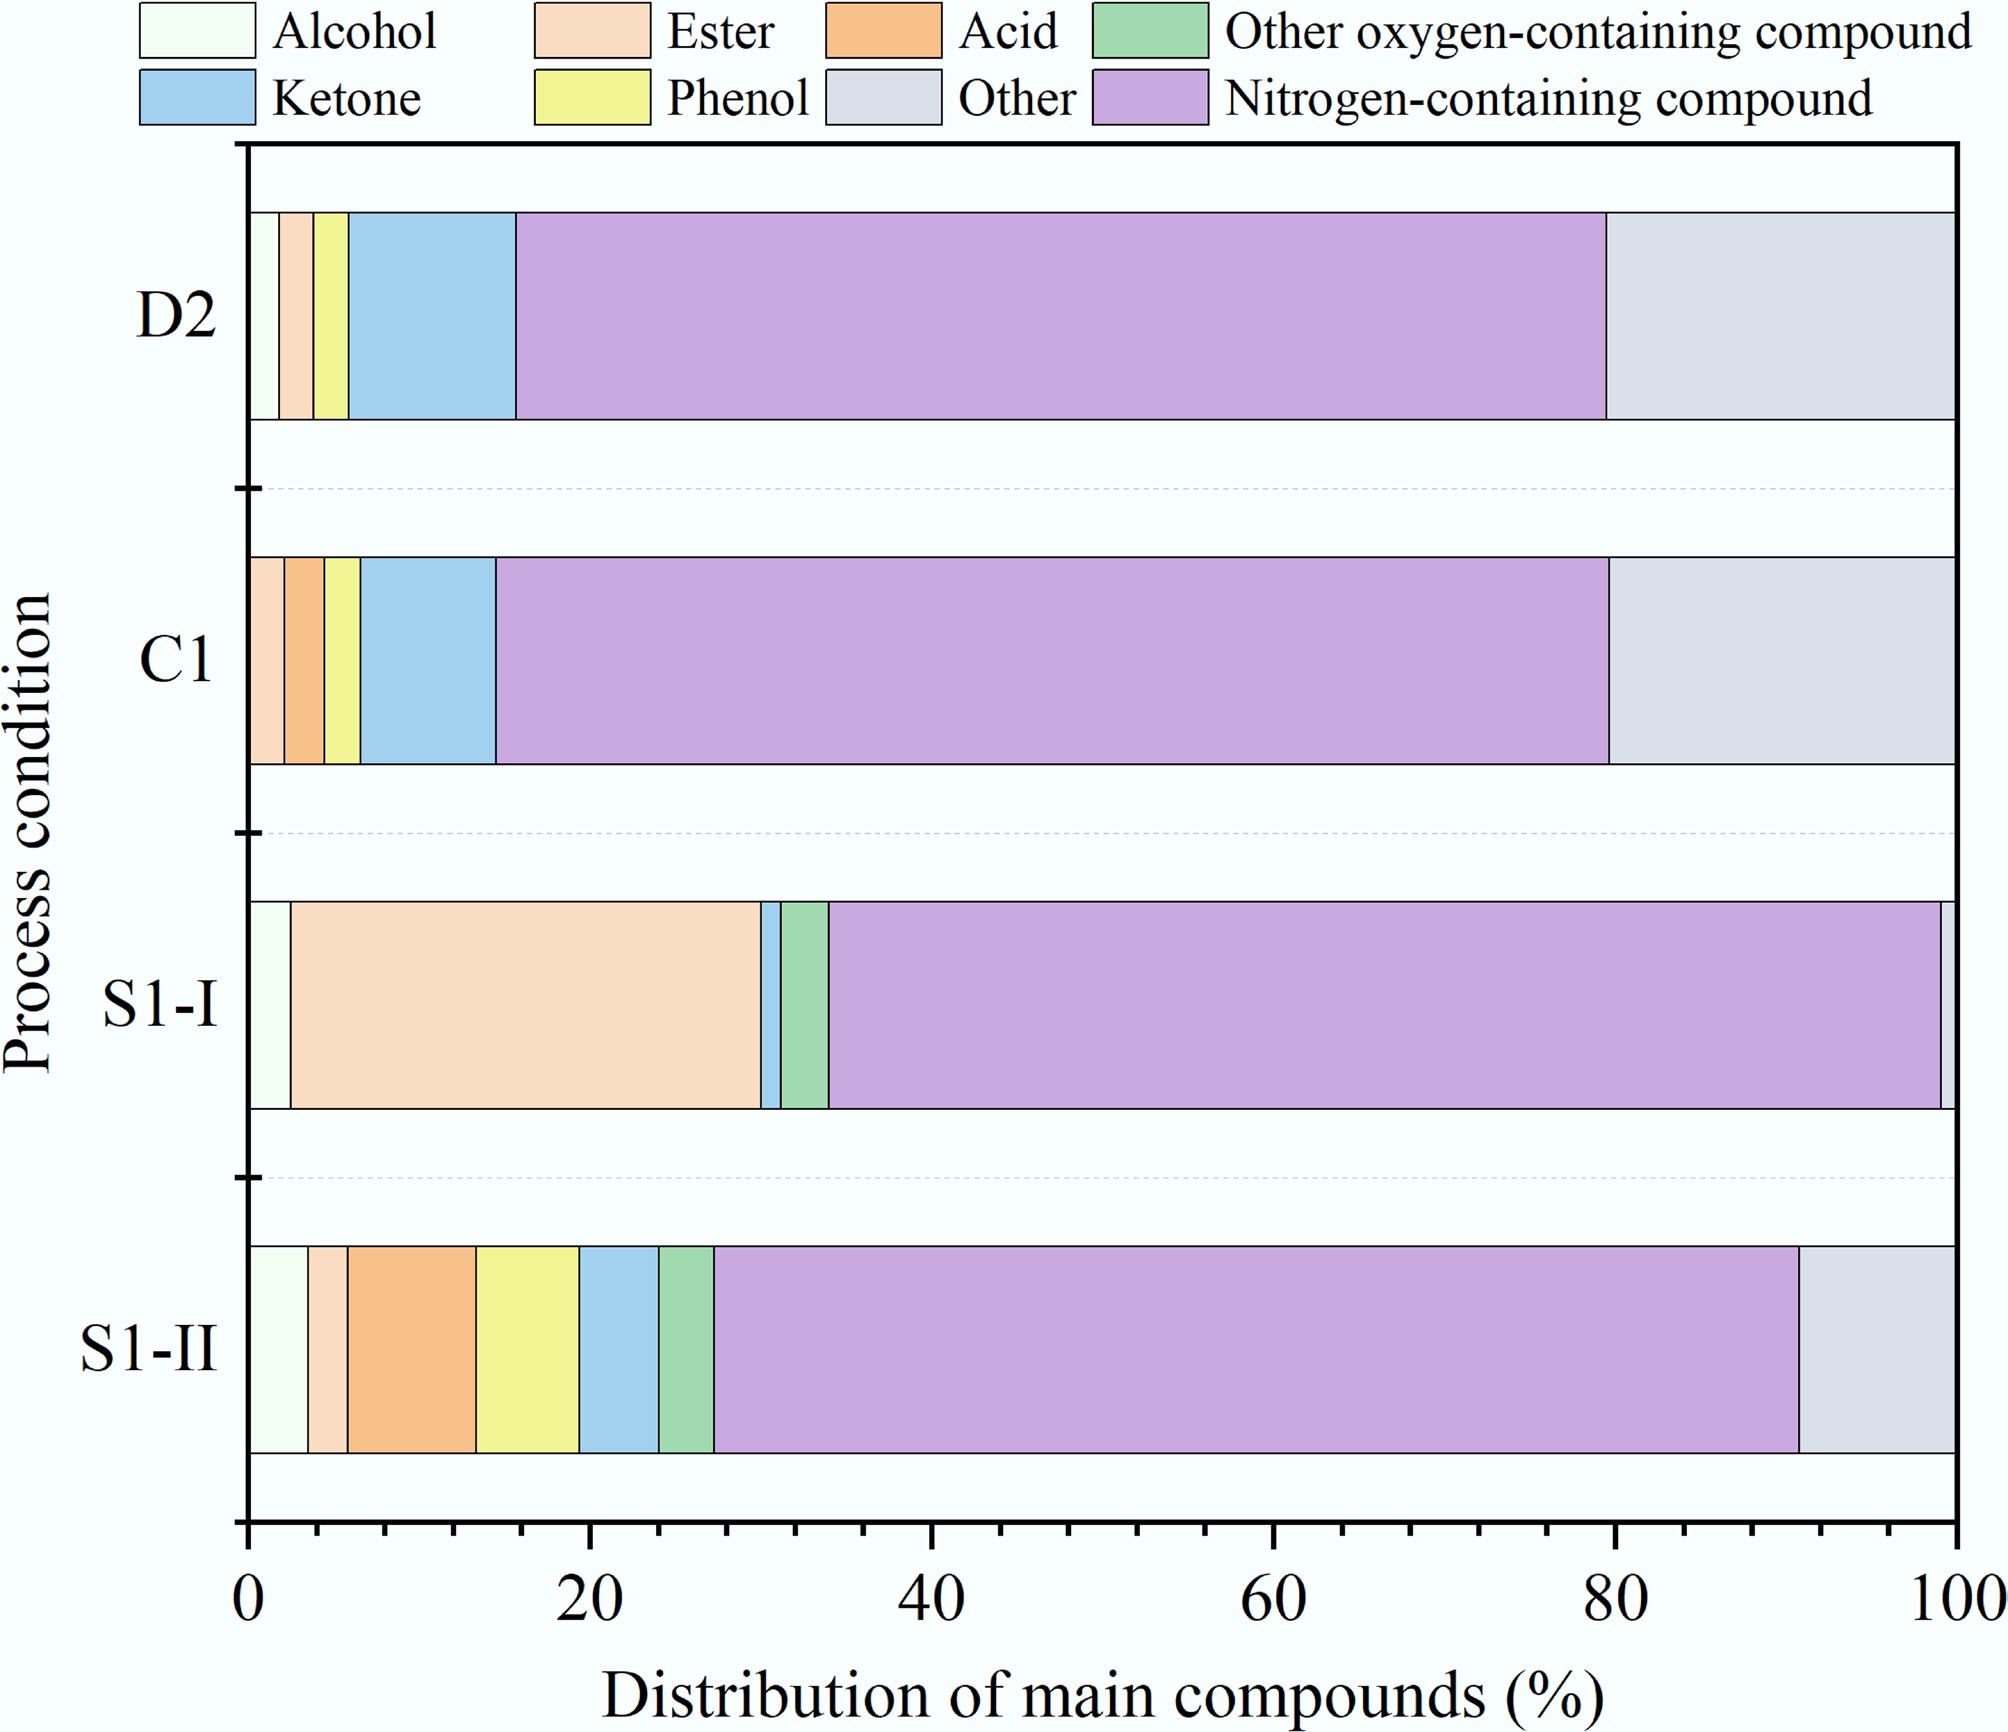
Figure 6.
Distribution of main compounds in aqueous phase products from different HTL processes.
-
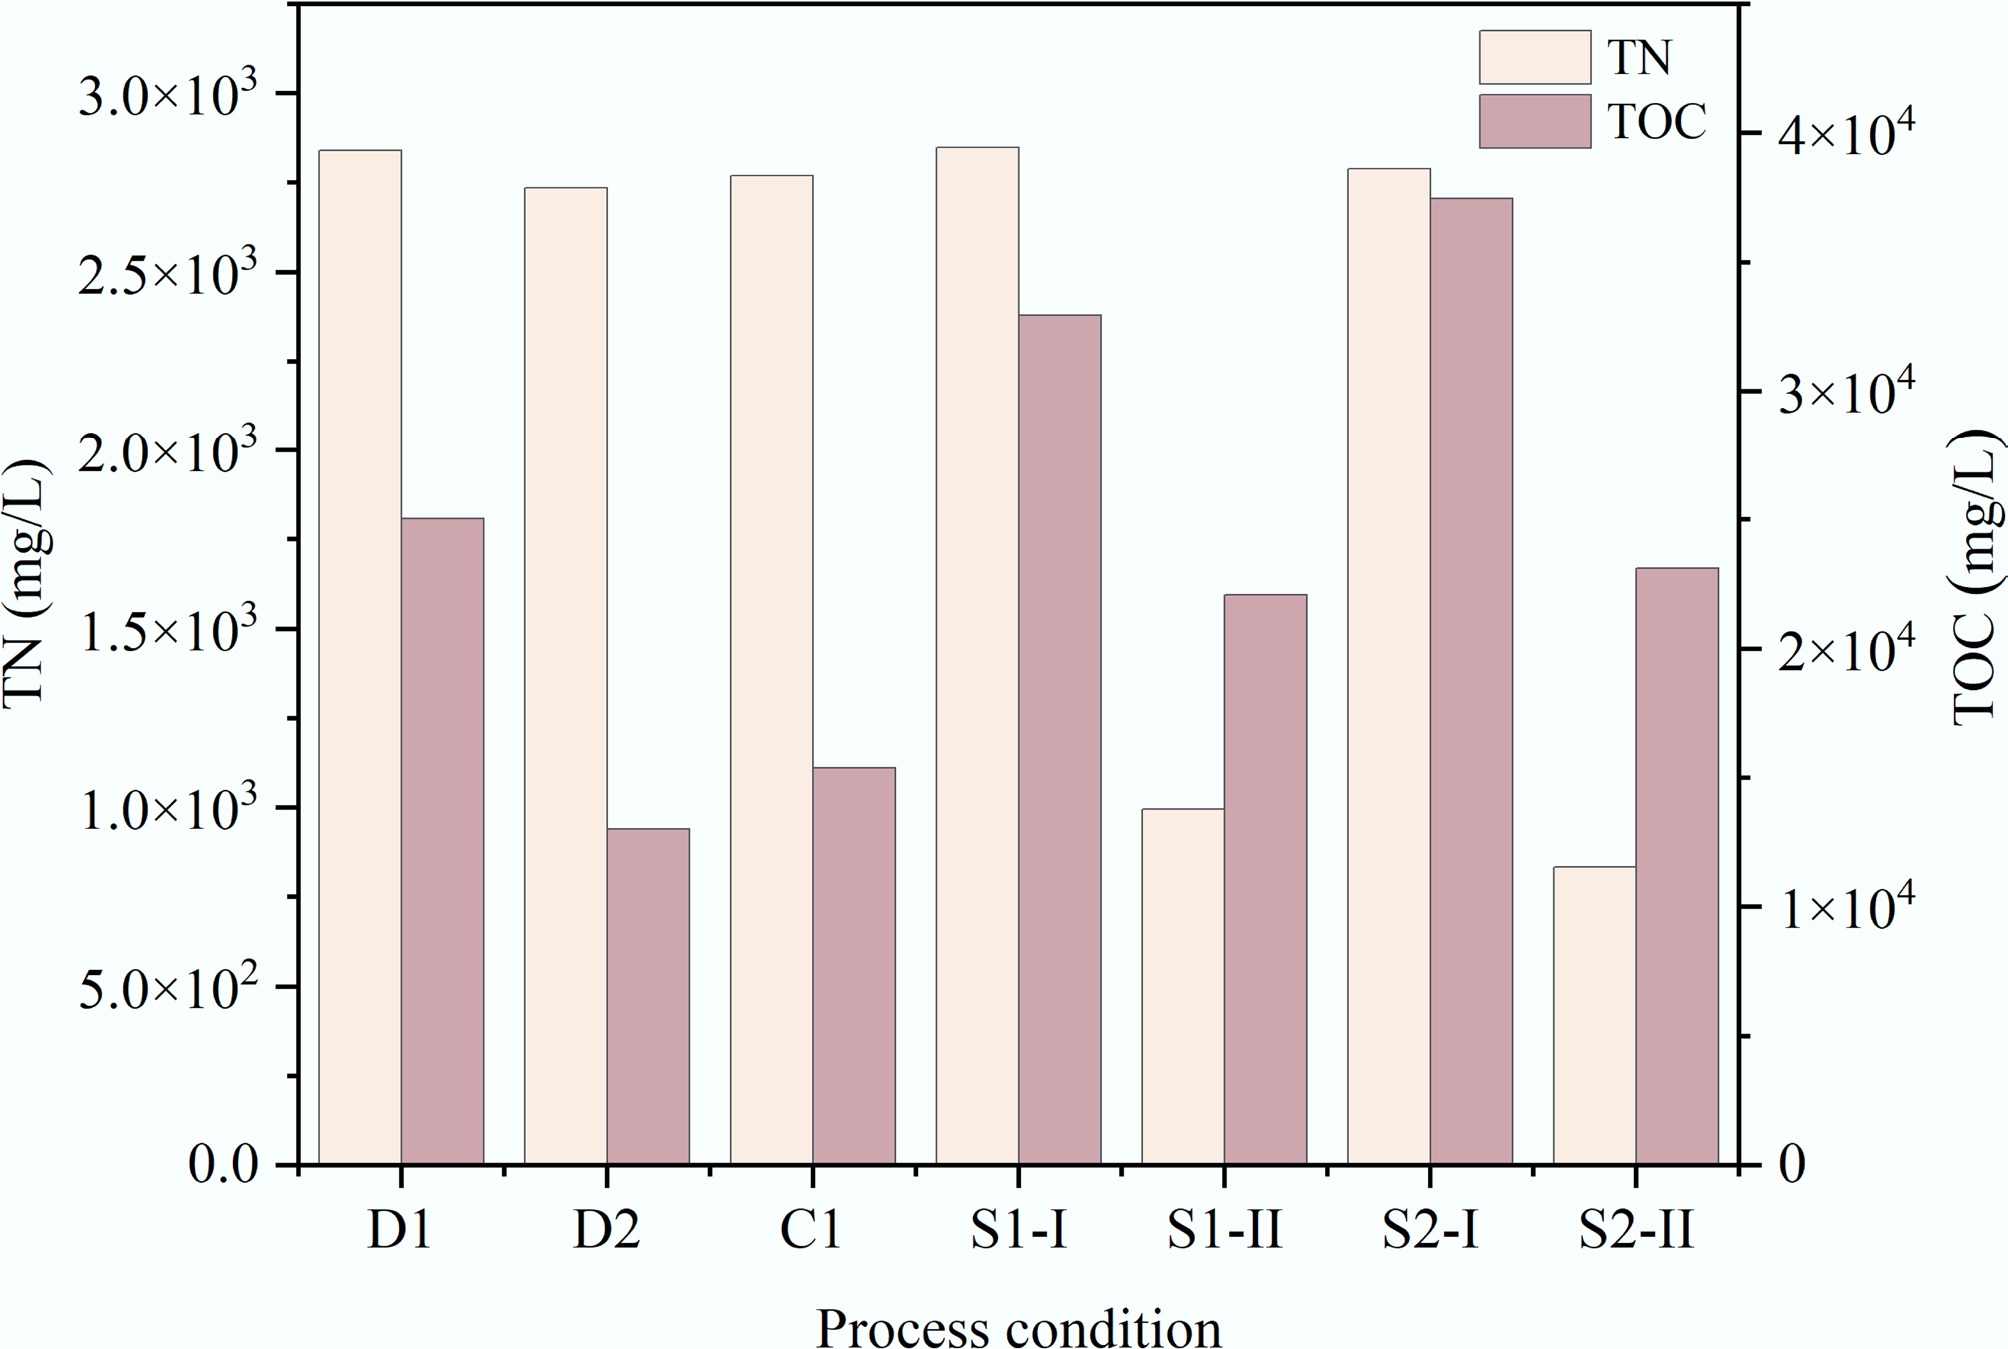
Figure 7.
TN and TOC concentrations of aqueous phase products from different HTL processes.
-
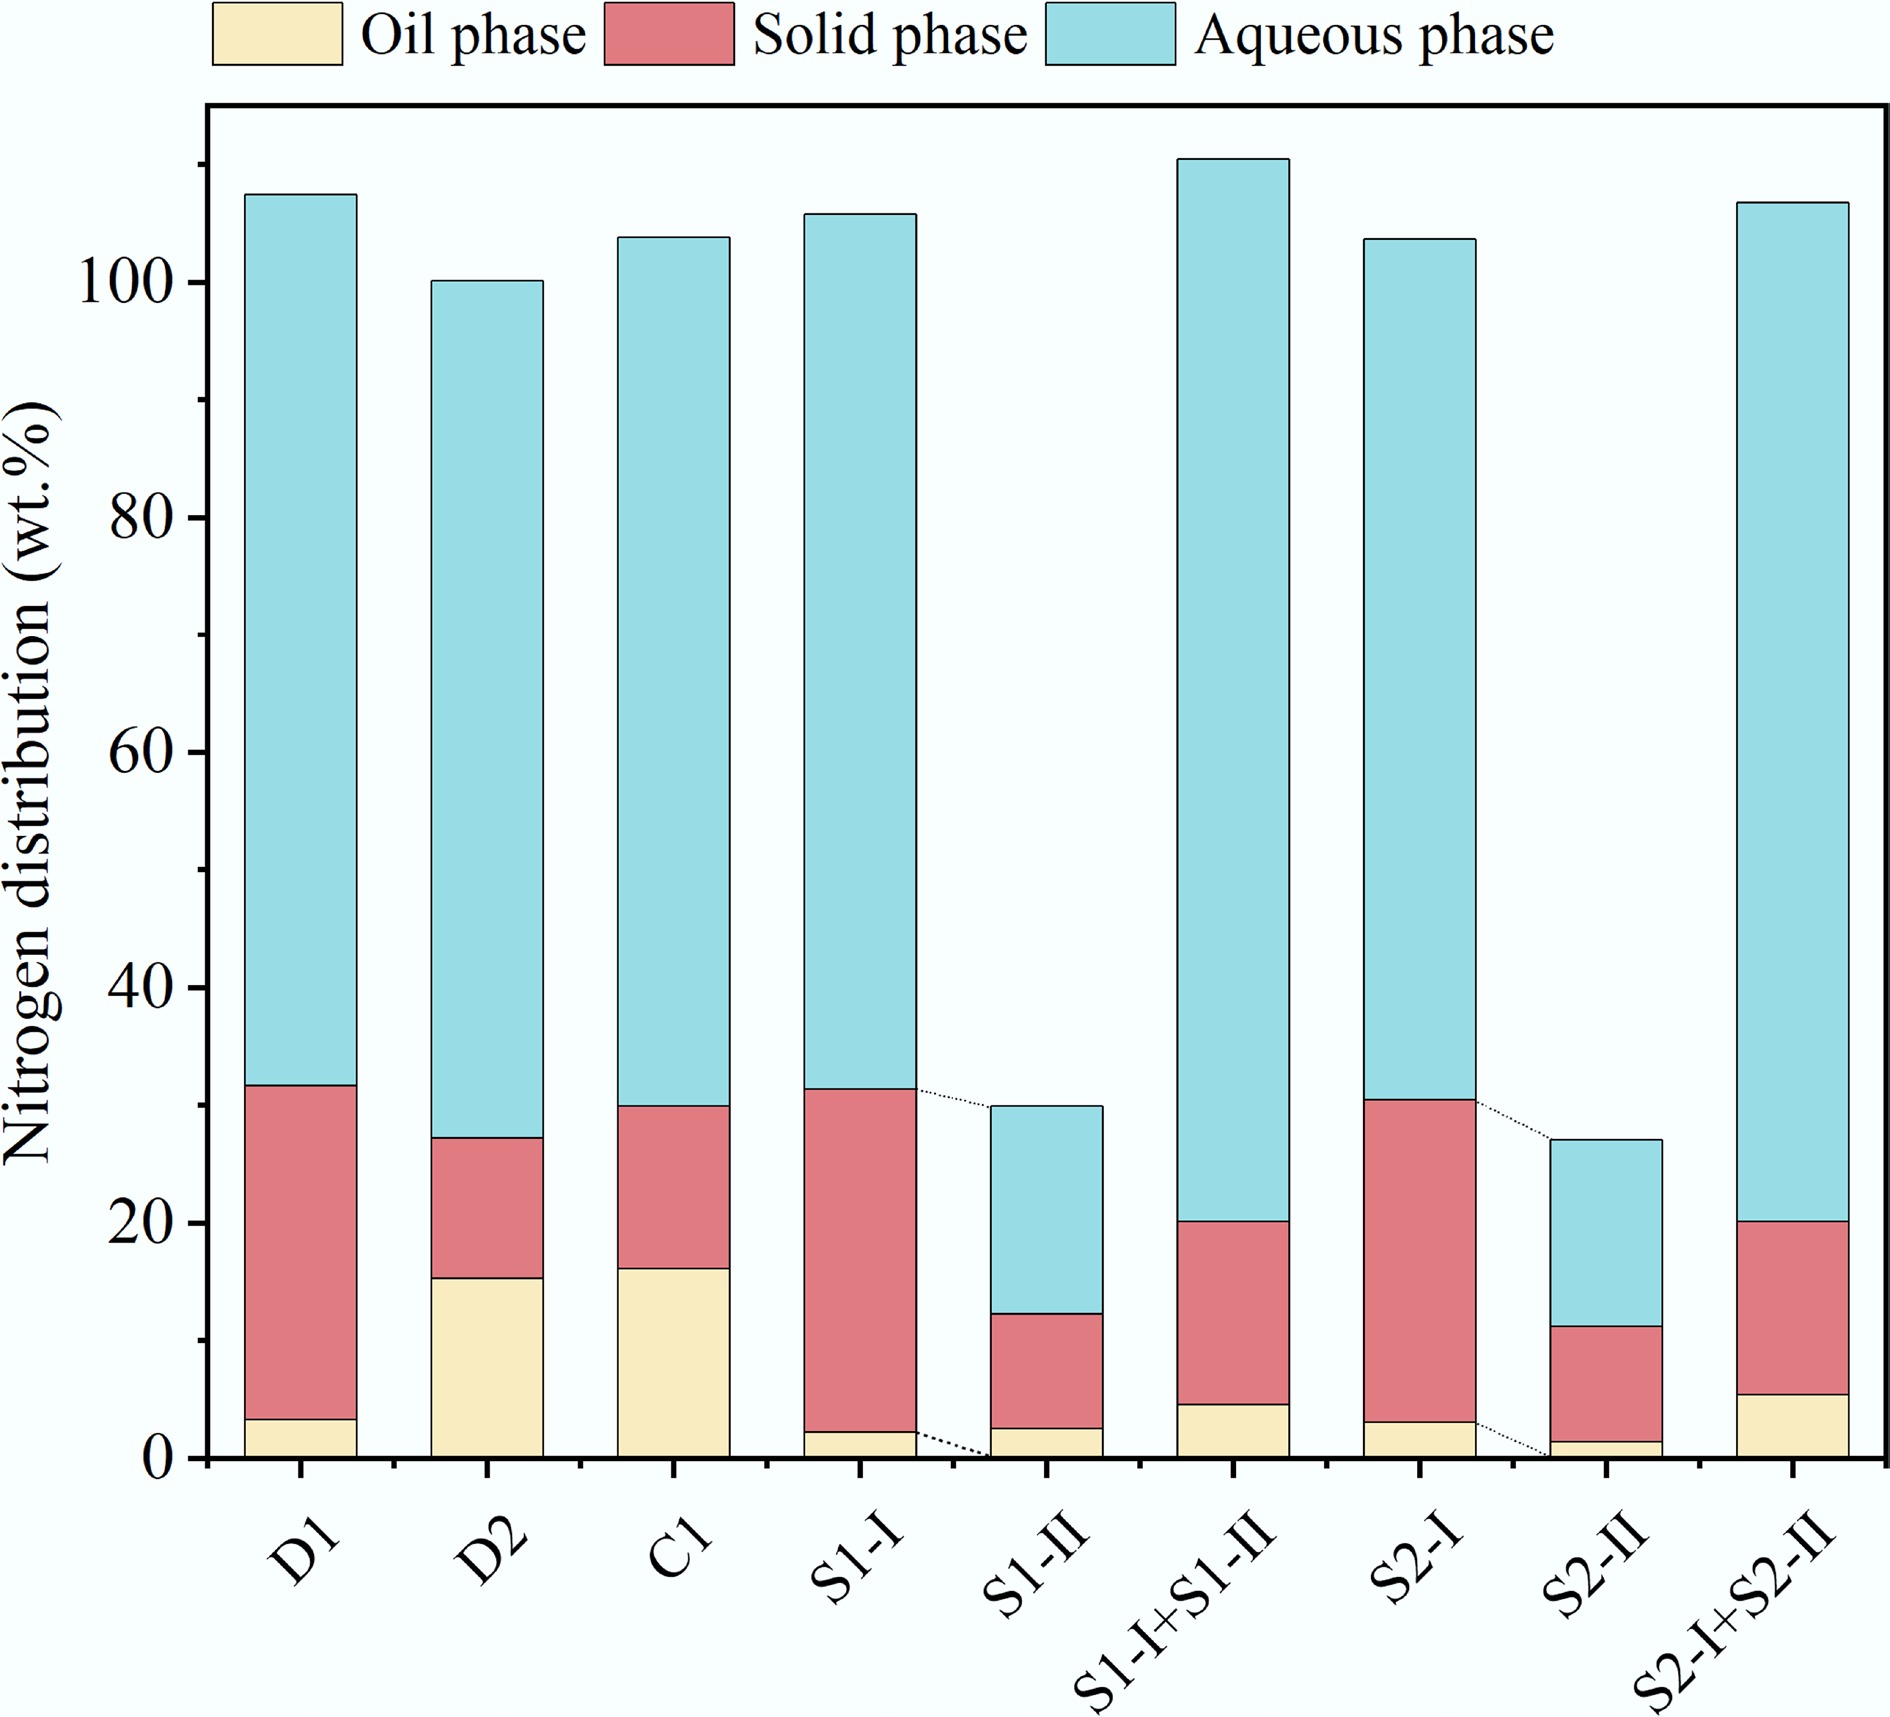
Figure 8.
Nitrogen distribution of HTL products.
-
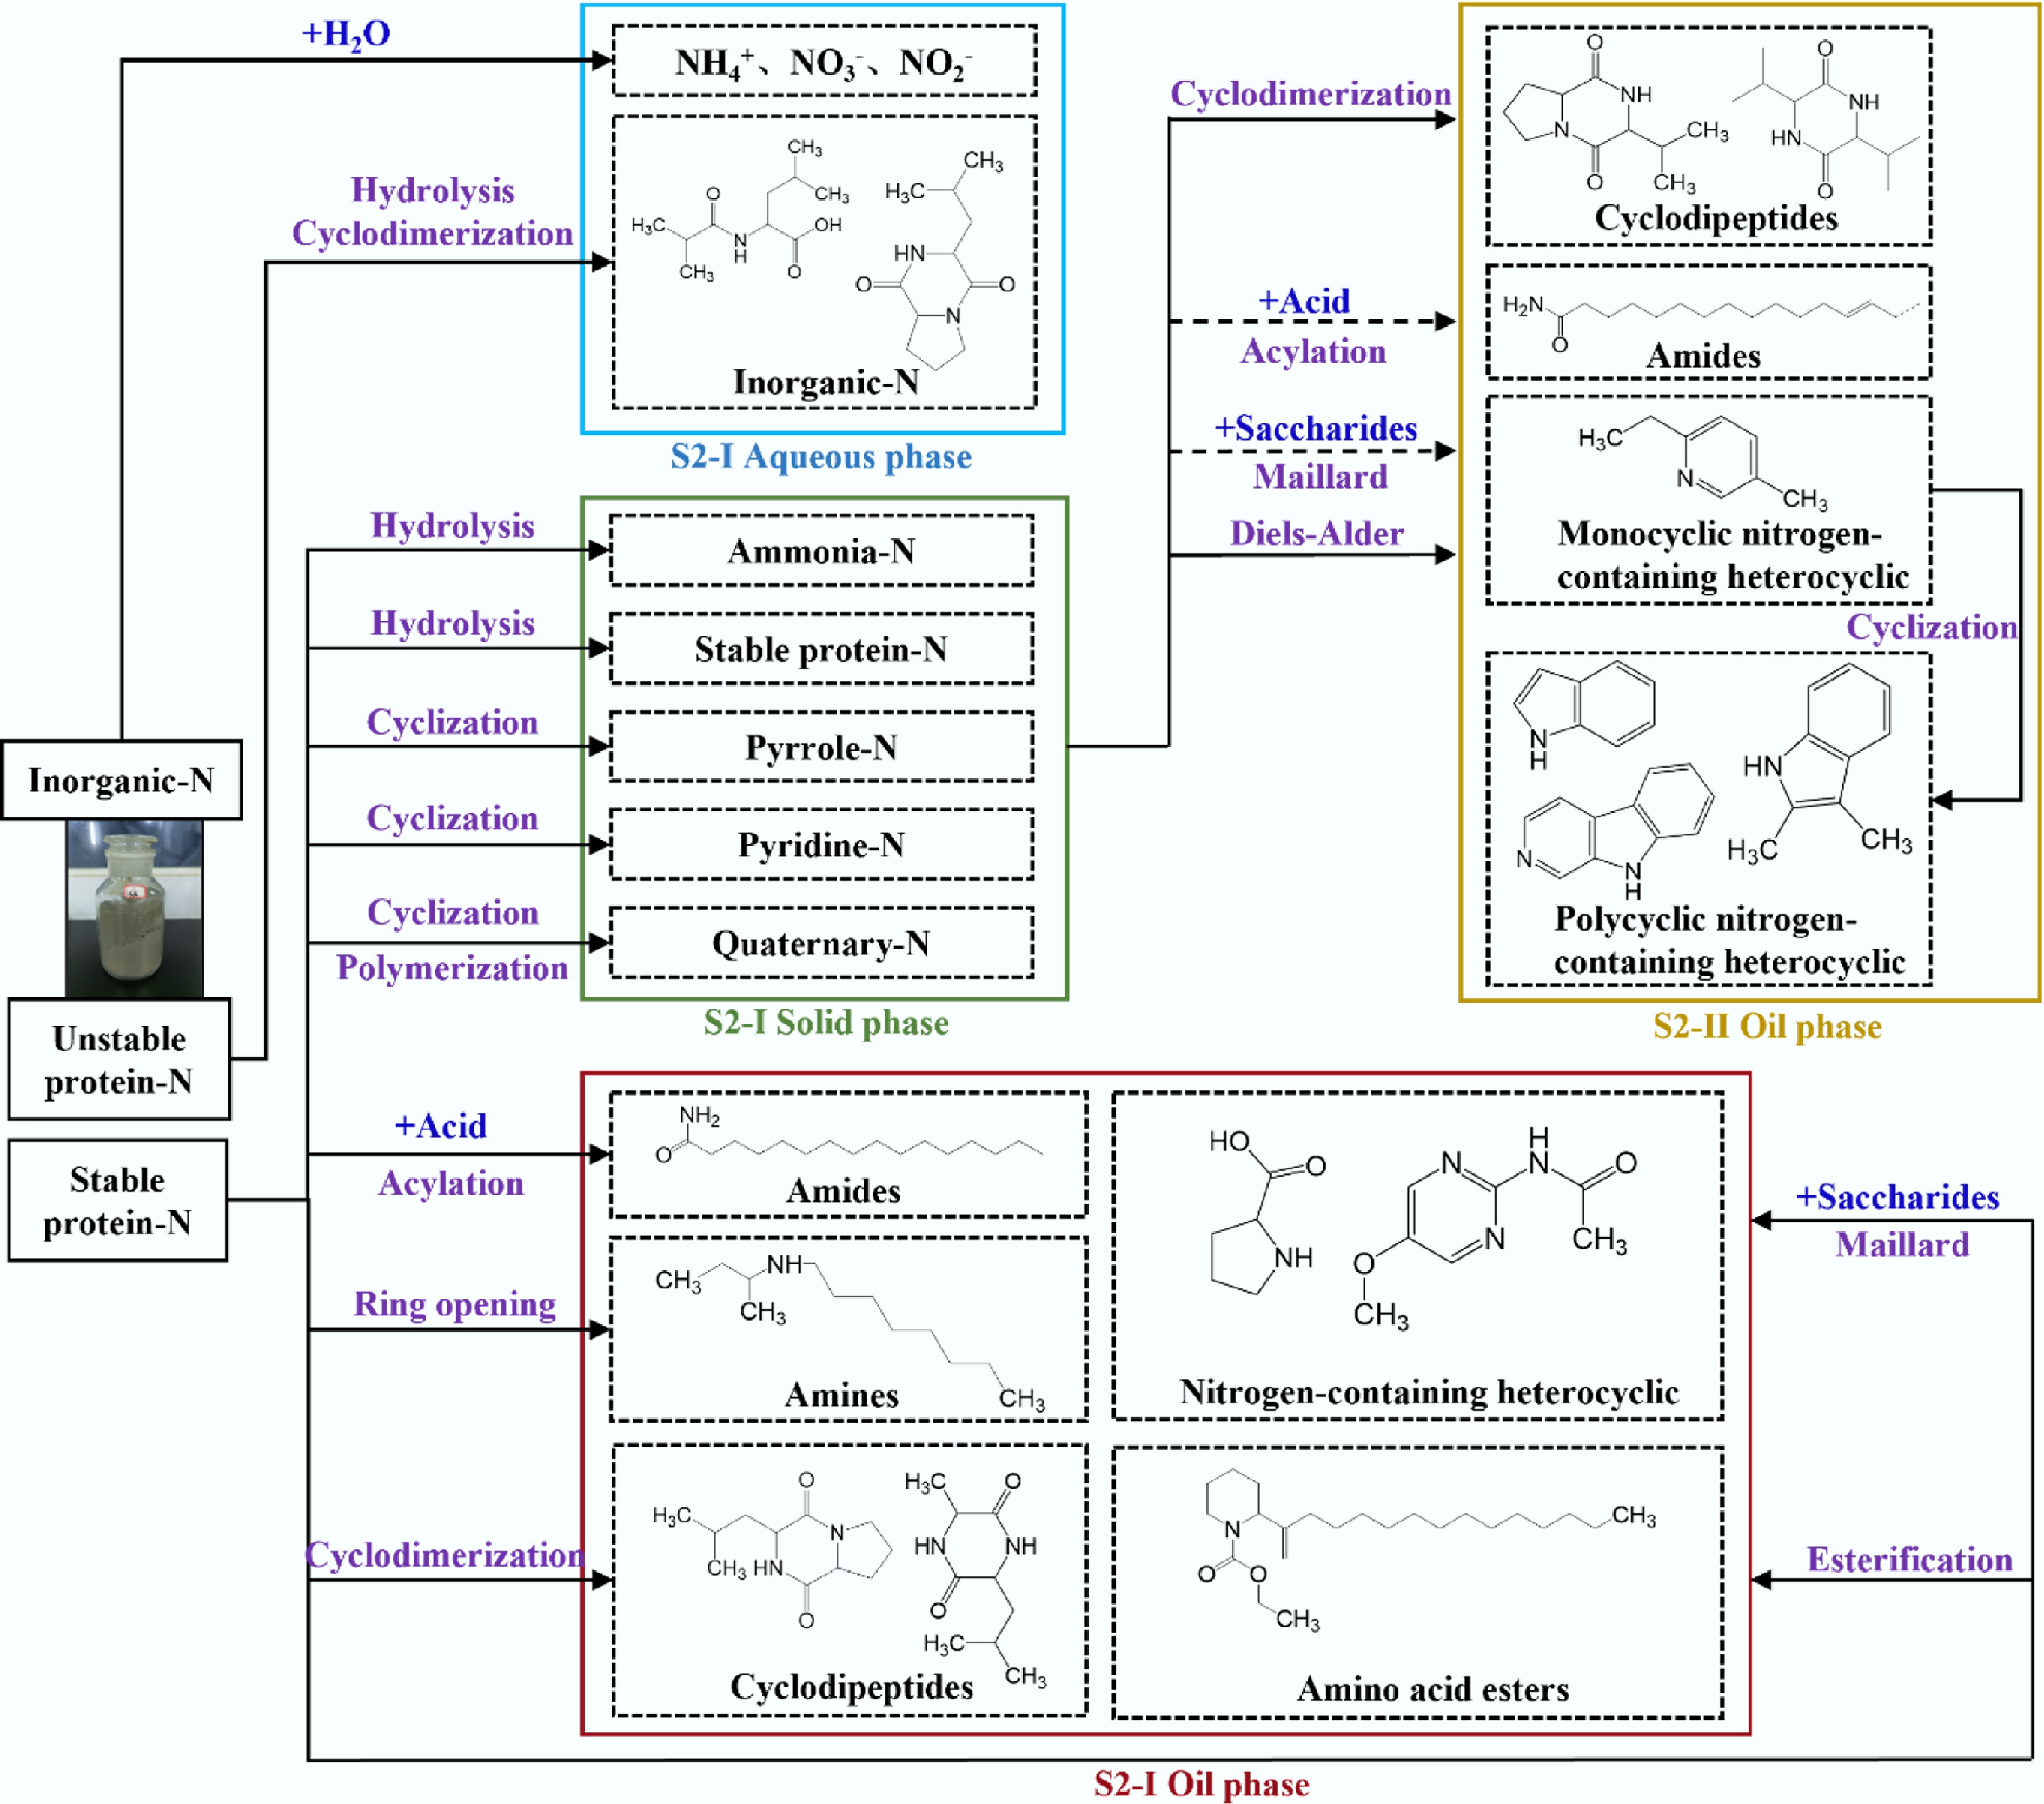
Figure 9.
Nitrogen migration and evolution pathways of ST-HTL (black arrows indicate the reaction pathway of the first stage, yellow arrows indicate the reaction pathway of the second stage, and dashed lines indicate the weakening of the reaction).
-
Feedstock MS Elemental analysisa (wt.%) C 45.84 H 7.51 N 7.22 S 0.81 Ob 38.62 Proximate analysis (wt.%) Ash 51.79 VM 45.10 FCc 3.11 Moisture (wt.%) 82.70 Higher heating value (MJ/kg) 19.40 a Dry ash-free basis; b O% = 100% − C% − H% − N% − S%; c FC% = 100% − Ash% − VM%. Table 1.
Basic properties of MS
-
HTL process Label Temperature
(°C)Pressure
(MPa)Residence
time (min)D-HTL D1 200 12 50 D2 325 12 50 CT-HTL C 200/325 12 20/30 ST-HTL S1 200(I)/325(II) 12 10(I)/40(II) S2 200(I)/325(II) 12 20(I)/30(II) Table 2.
The experimental parameters for HTL of MS used in this work
-
HTL process Elemental composition (wt.%) Atomic ratio Higher heating
value (MJ/kg)Energy recovery
rate (%)C H N S Oa H/C O/C N/C D1 70.24 9.61 4.10 1.17 14.88 1.642 0.159 0.050 34.92 9.68 D2 74.99 8.60 5.33 1.19 9.89 1.376 0.099 0.061 35.98 32.20 C1 74.93 8.95 5.50 1.26 9.36 1.433 0.094 0.063 36.56 28.90 S1-I 69.48 10.08 3.71 0.78 15.95 1.741 0.172 0.046 35.11 5.10 S1-II 72.60 9.52 3.36 0.98 13.54 1.574 0.140 0.040 35.81 15.27 S2-I 69.58 9.55 4.18 0.99 15.70 1.647 0.169 0.052 34.45 7.80 S2-II 75.51 9.45 3.42 0.88 10.74 1.502 0.107 0.039 37.18 15.15 a Calculated by difference method: O% = 100% – C% – H% – N% – S%. Table 3.
Elemental compositions, atomic ratios, higher heating values and energy recovery rates of bio-oil obtained via different HTL processes
-
HTL process Elemental composition (wt.%) Atomic ratio Proximate analysis (wt.%) C H N S Oa H/C O/C N/C Ash VM FCb D1 15.27 2.08 1.72 0.21 7.90 1.6346 0.3880 0.0965 72.82 26.19 0.99 D2 10.6 1.91 0.95 0.23 1.53 2.1623 0.1083 0.0768 84.78 14.63 0.59 C 9.94 1.14 0.9 0.28 3.02 1.3763 0.2279 0.0776 84.72 14.80 0.48 S1-I 15.03 2.17 1.78 0.23 9.72 1.7325 0.4850 0.1015 71.07 28.28 0.65 S1-II 7.88 1.05 0.71 0.08 3.94 1.5990 0.3750 0.0772 86.34 13.34 0.32 S2-I 13.92 1.93 1.44 0.28 10.58 1.6638 0.5700 0.0887 71.85 28.05 0.10 S2-II 8.47 1.16 0.65 0.23 3.74 1.6434 0.3312 0.0658 85.75 14.20 0.05 a O% = 100% – C% – H% – N% – S% – Ash%; b FC% = 100% – Ash% – VM%. Table 4.
Elemental compositions, atomic ratios and proximate analysis results of solid products from different HTL processes
-
N species MS D1 D2 C S2-I S2-II Inorganic-N 6.3% − − − − − Ammonia-N 93.7% 25.2% 13.6% 25.7% 41.1% 23.6% Quaternary-N − 21.0% 27.1% 30.1% 26.0% 26.4% Pyrrole-N − 48.8% 41.8% 38.0% 27.6% 44.3% Pyridine-N − 5.0% 17.5% 6.2% 5.2% 5.7% Table 5.
Relative contents of nitrogen-containing functional groups in ms and solid products under different conditions
Figures
(9)
Tables
(5)