-
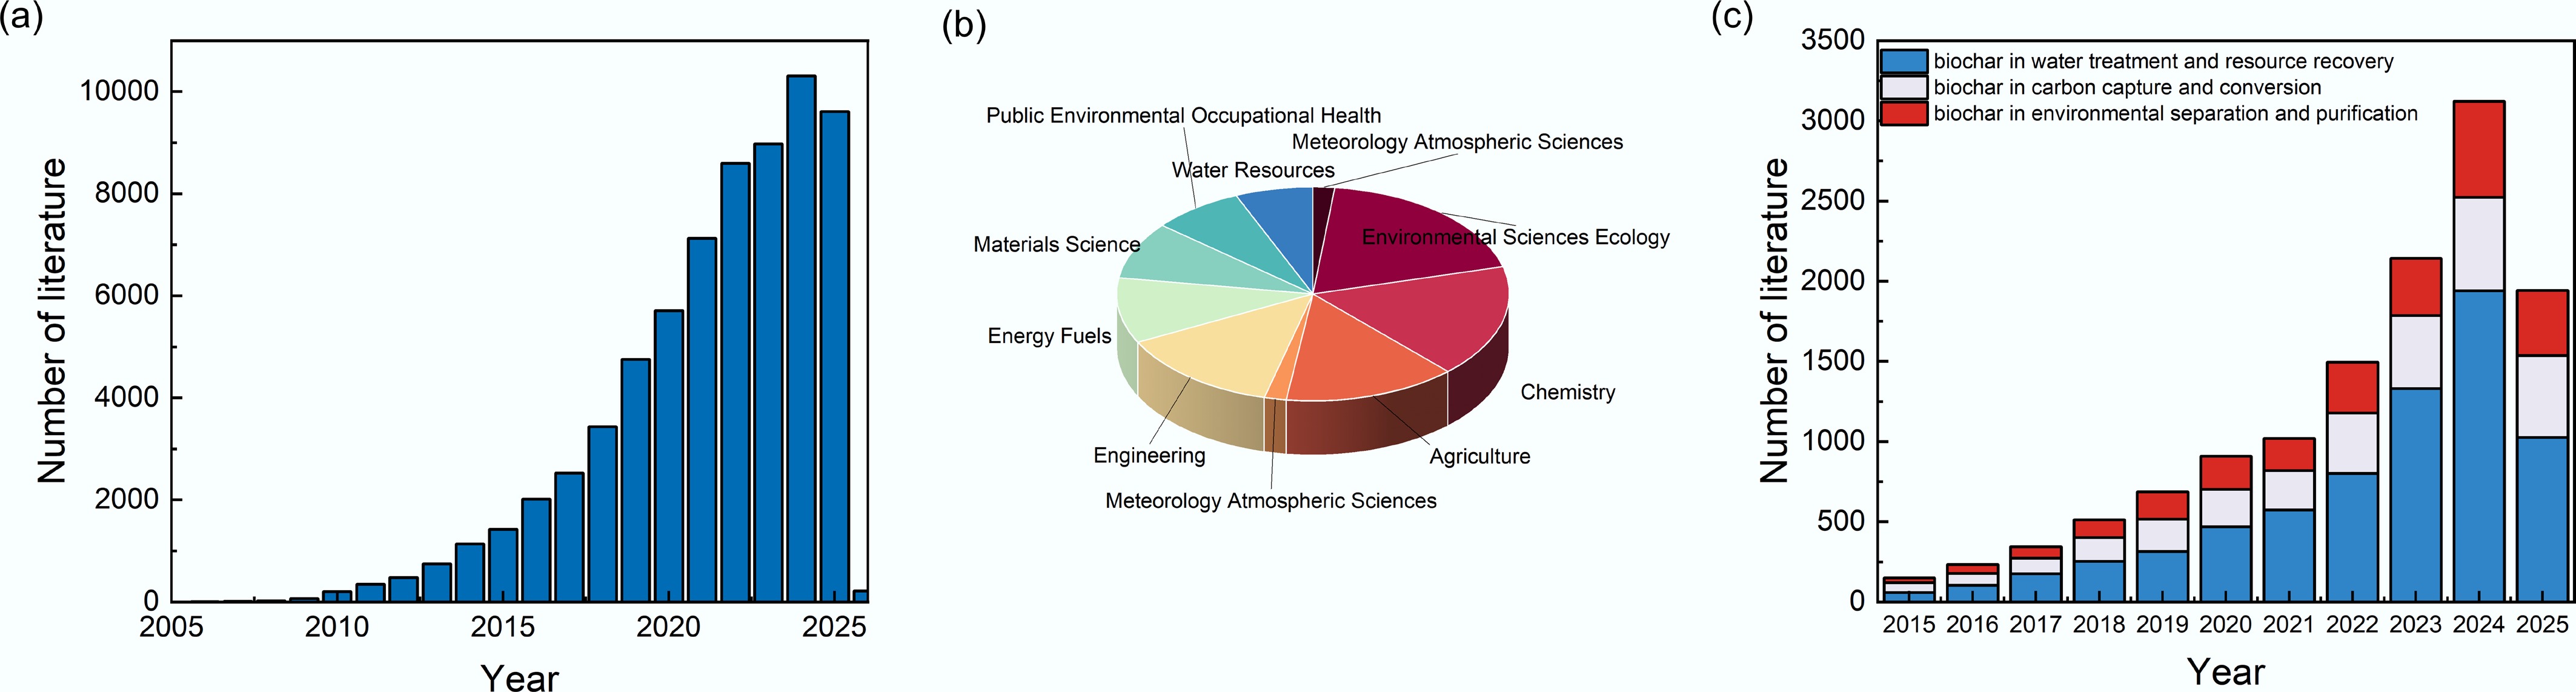
Figure 1.
A statistical analysis of the literature on biochar. (a) Number of research studies on biochar. (b) The main research fields of biochar-related studies published in the past decade. (c) Number of studies on the application of biochar in water treatment, carbon capture, and environmental separation from 2015 to 2025 (data obtained from the Web of Science).
-
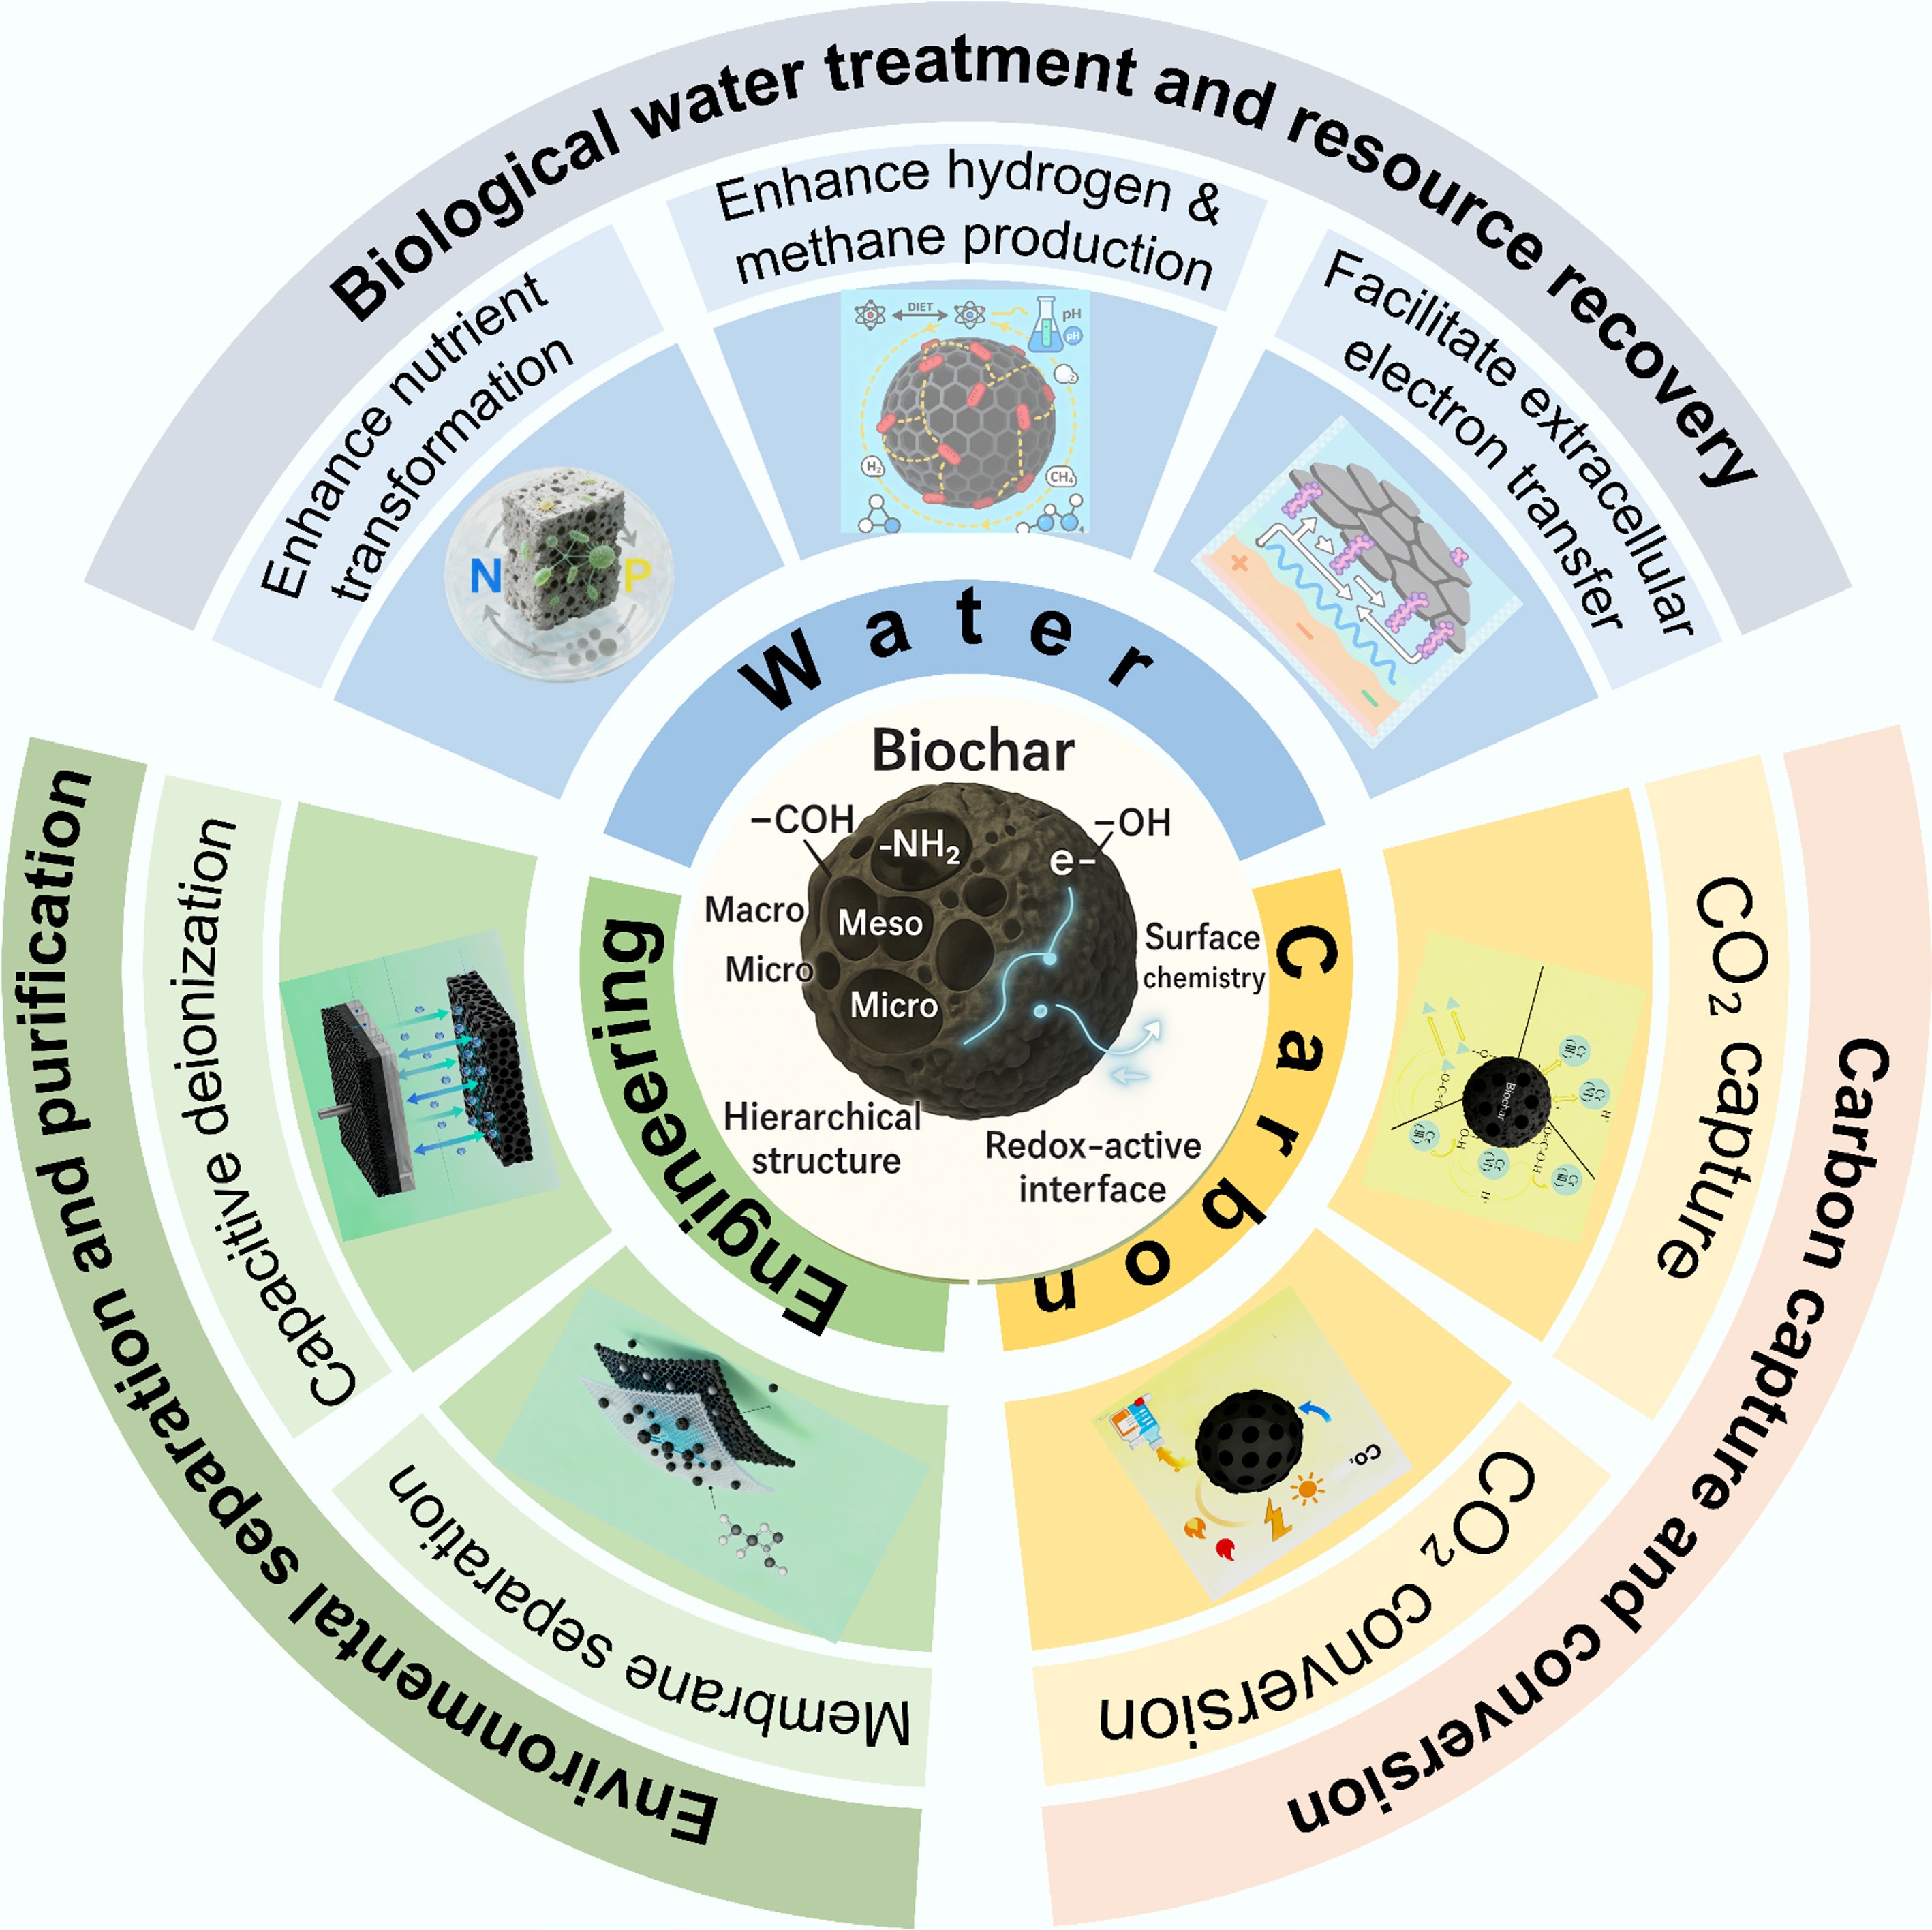
Figure 2.
Applications of biochar in emerging fields beyond soil remediation.
-
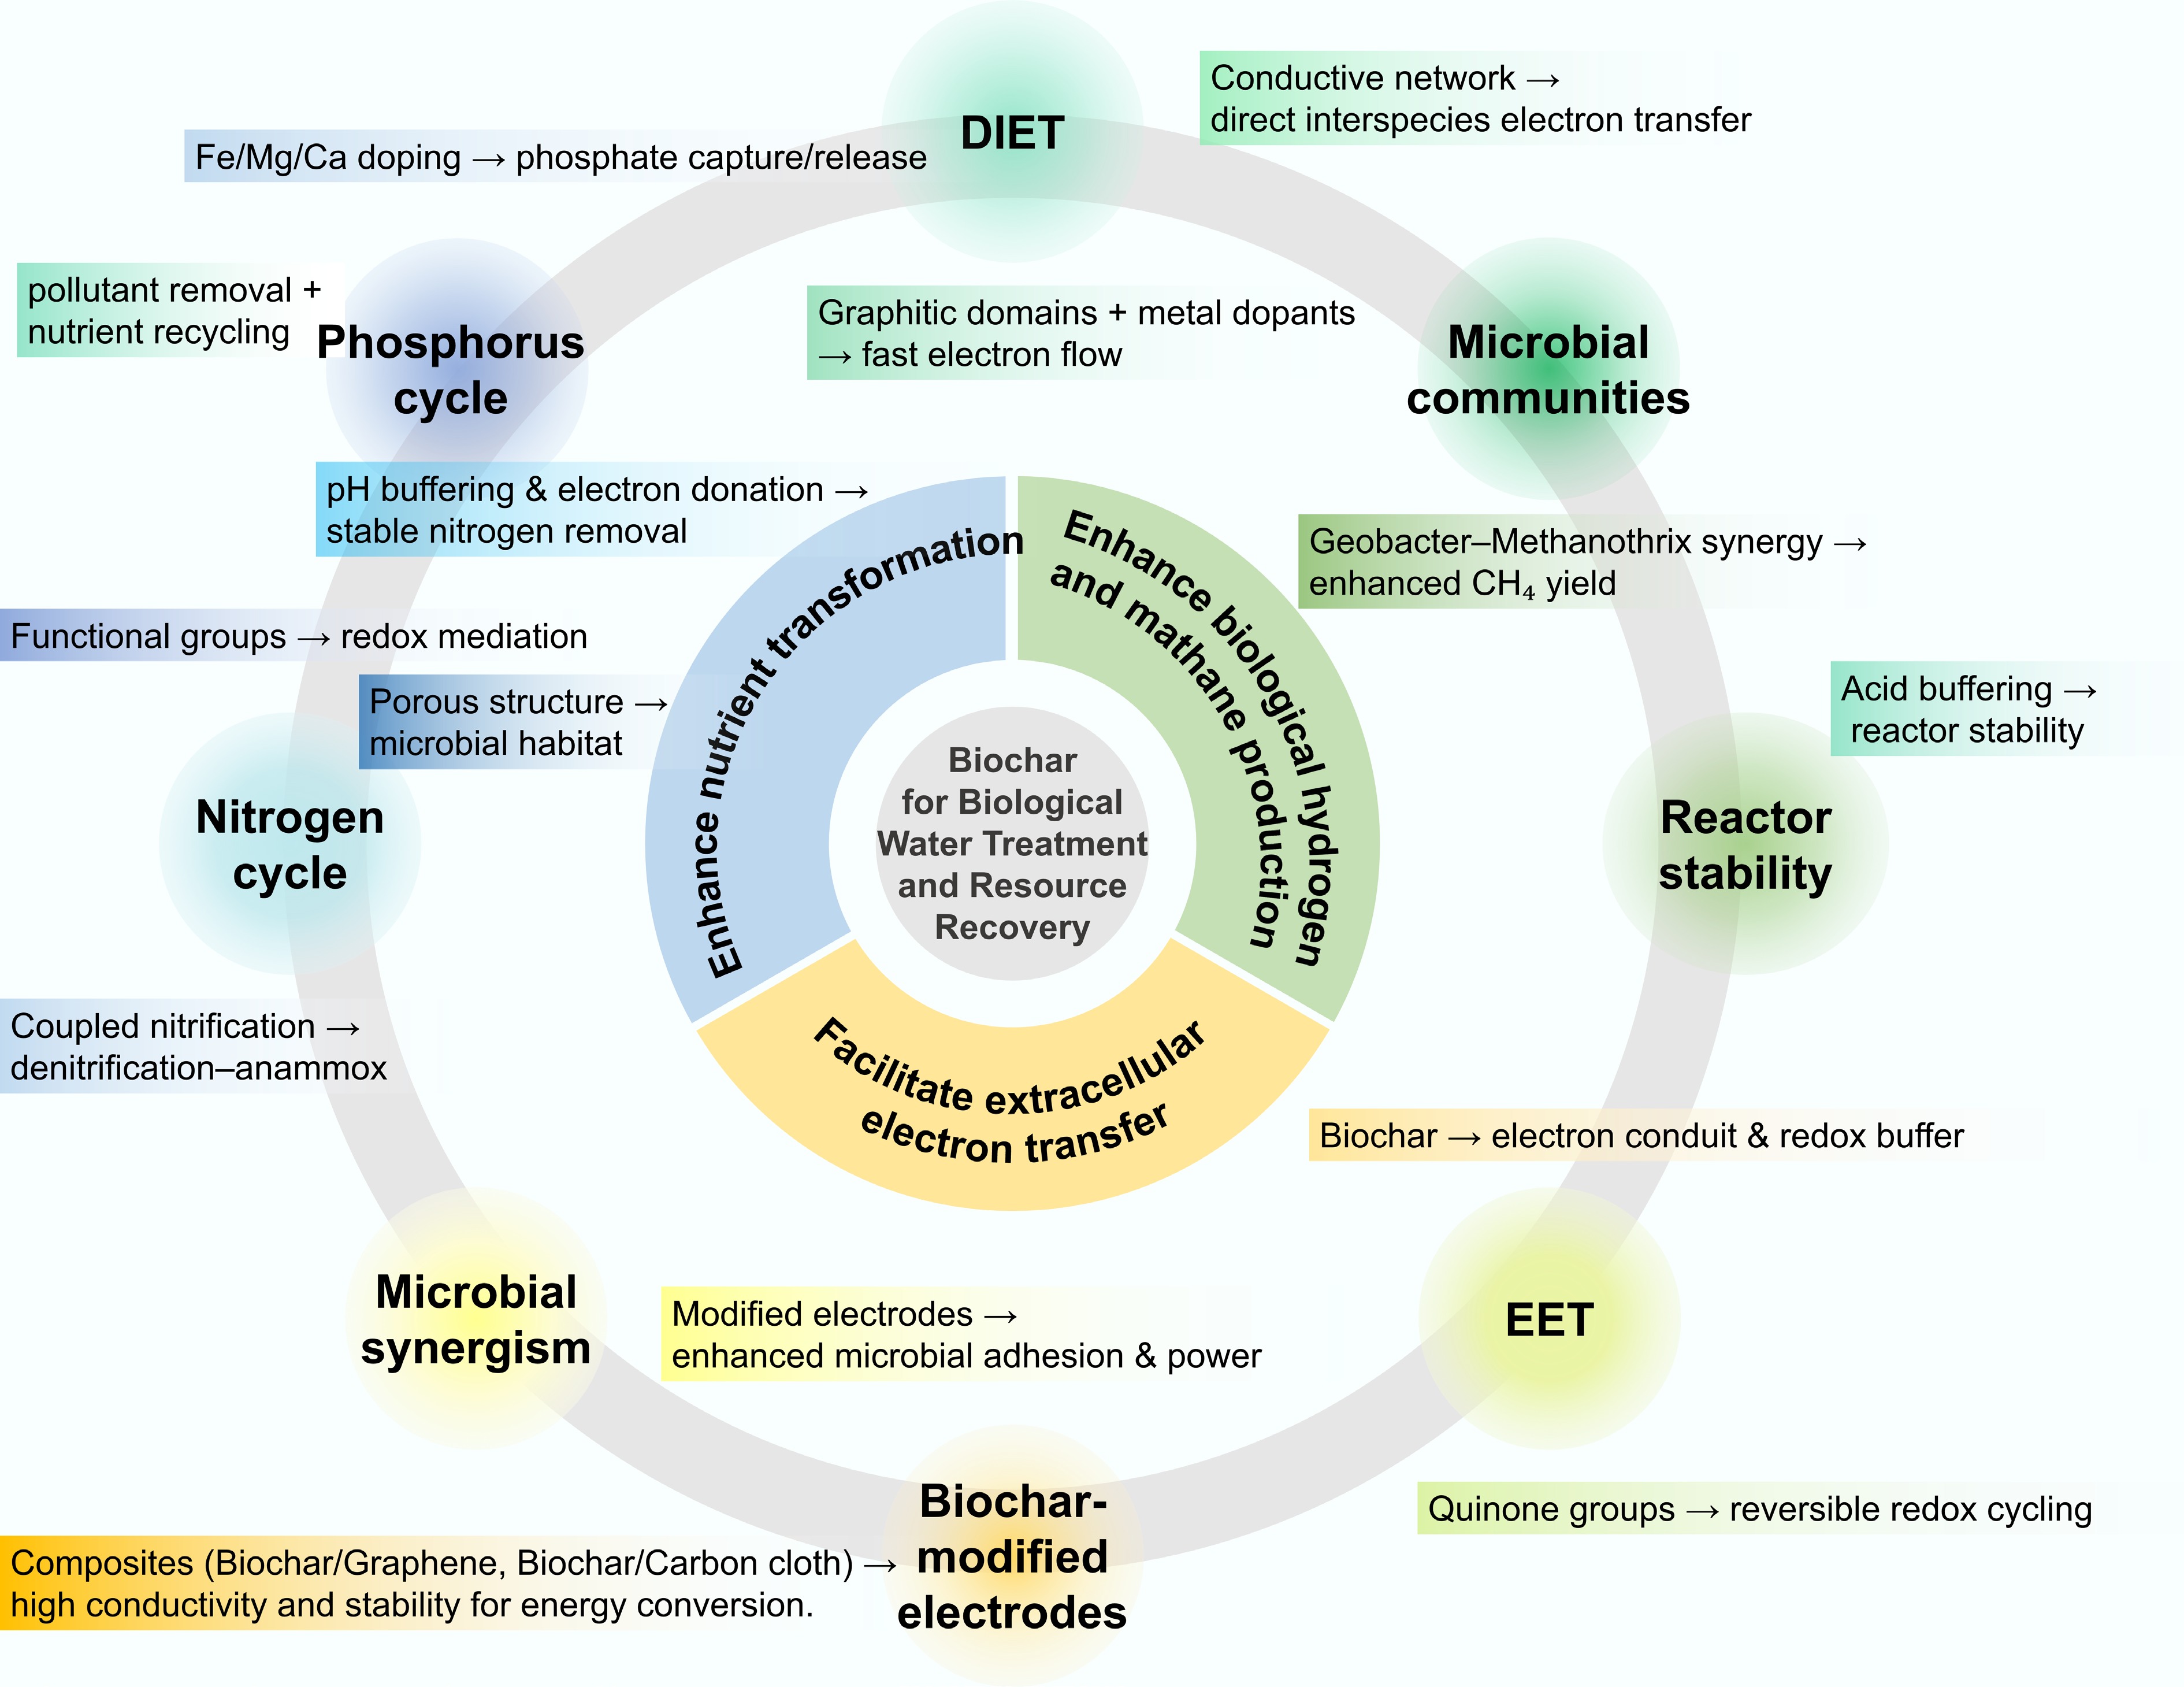
Figure 3.
Applications of biochar for biological water treatment and resource recovery.
-
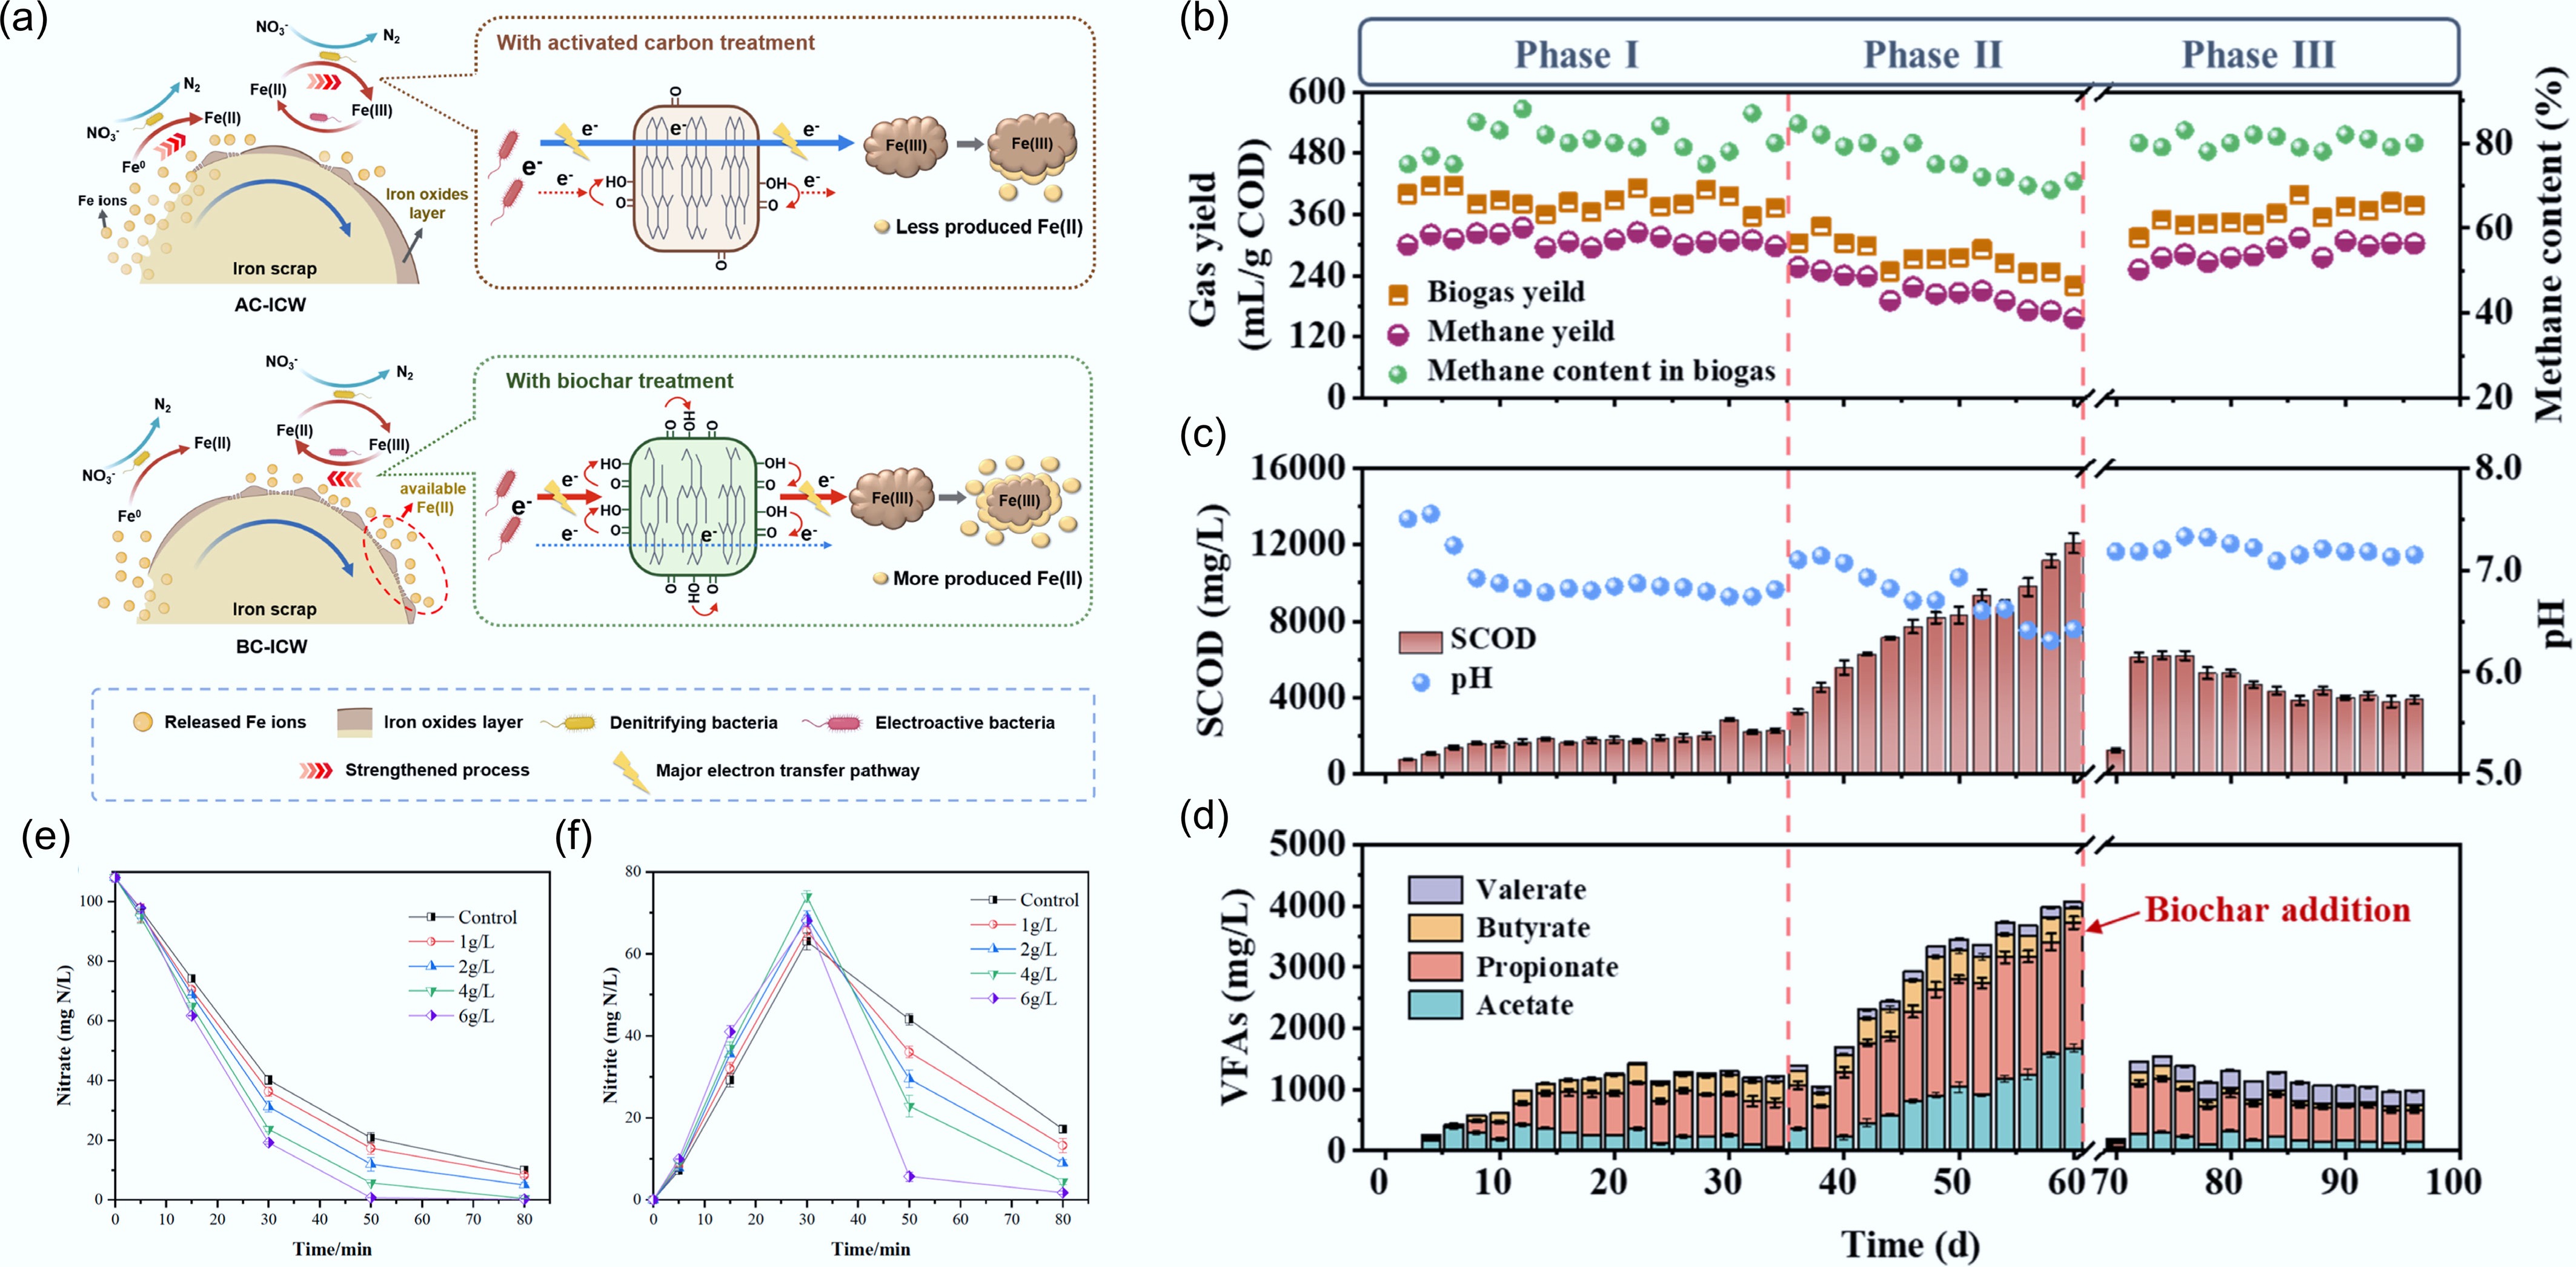
Figure 4.
Role of biochar in facilitating nitrification–denitrification. (a) Proposed mechanism of biomass-derived carbon materials facilitating electron transfer in iron-based constructed wetlands[24]. Performance of an anaerobic digestion system using discarded cefradine medicine residues in terms of (b) biogas/biomethane production, (c) COD and pH value, and (d) VFAs concentrations in effluent during operation, showing that biochar enhanced methane production from DCMR under high OLR and achieved a stable AD process[29]. Effects of different biochar dosages on (e) NO3–N concentration and (f) NO2–N accumulation[22].
-
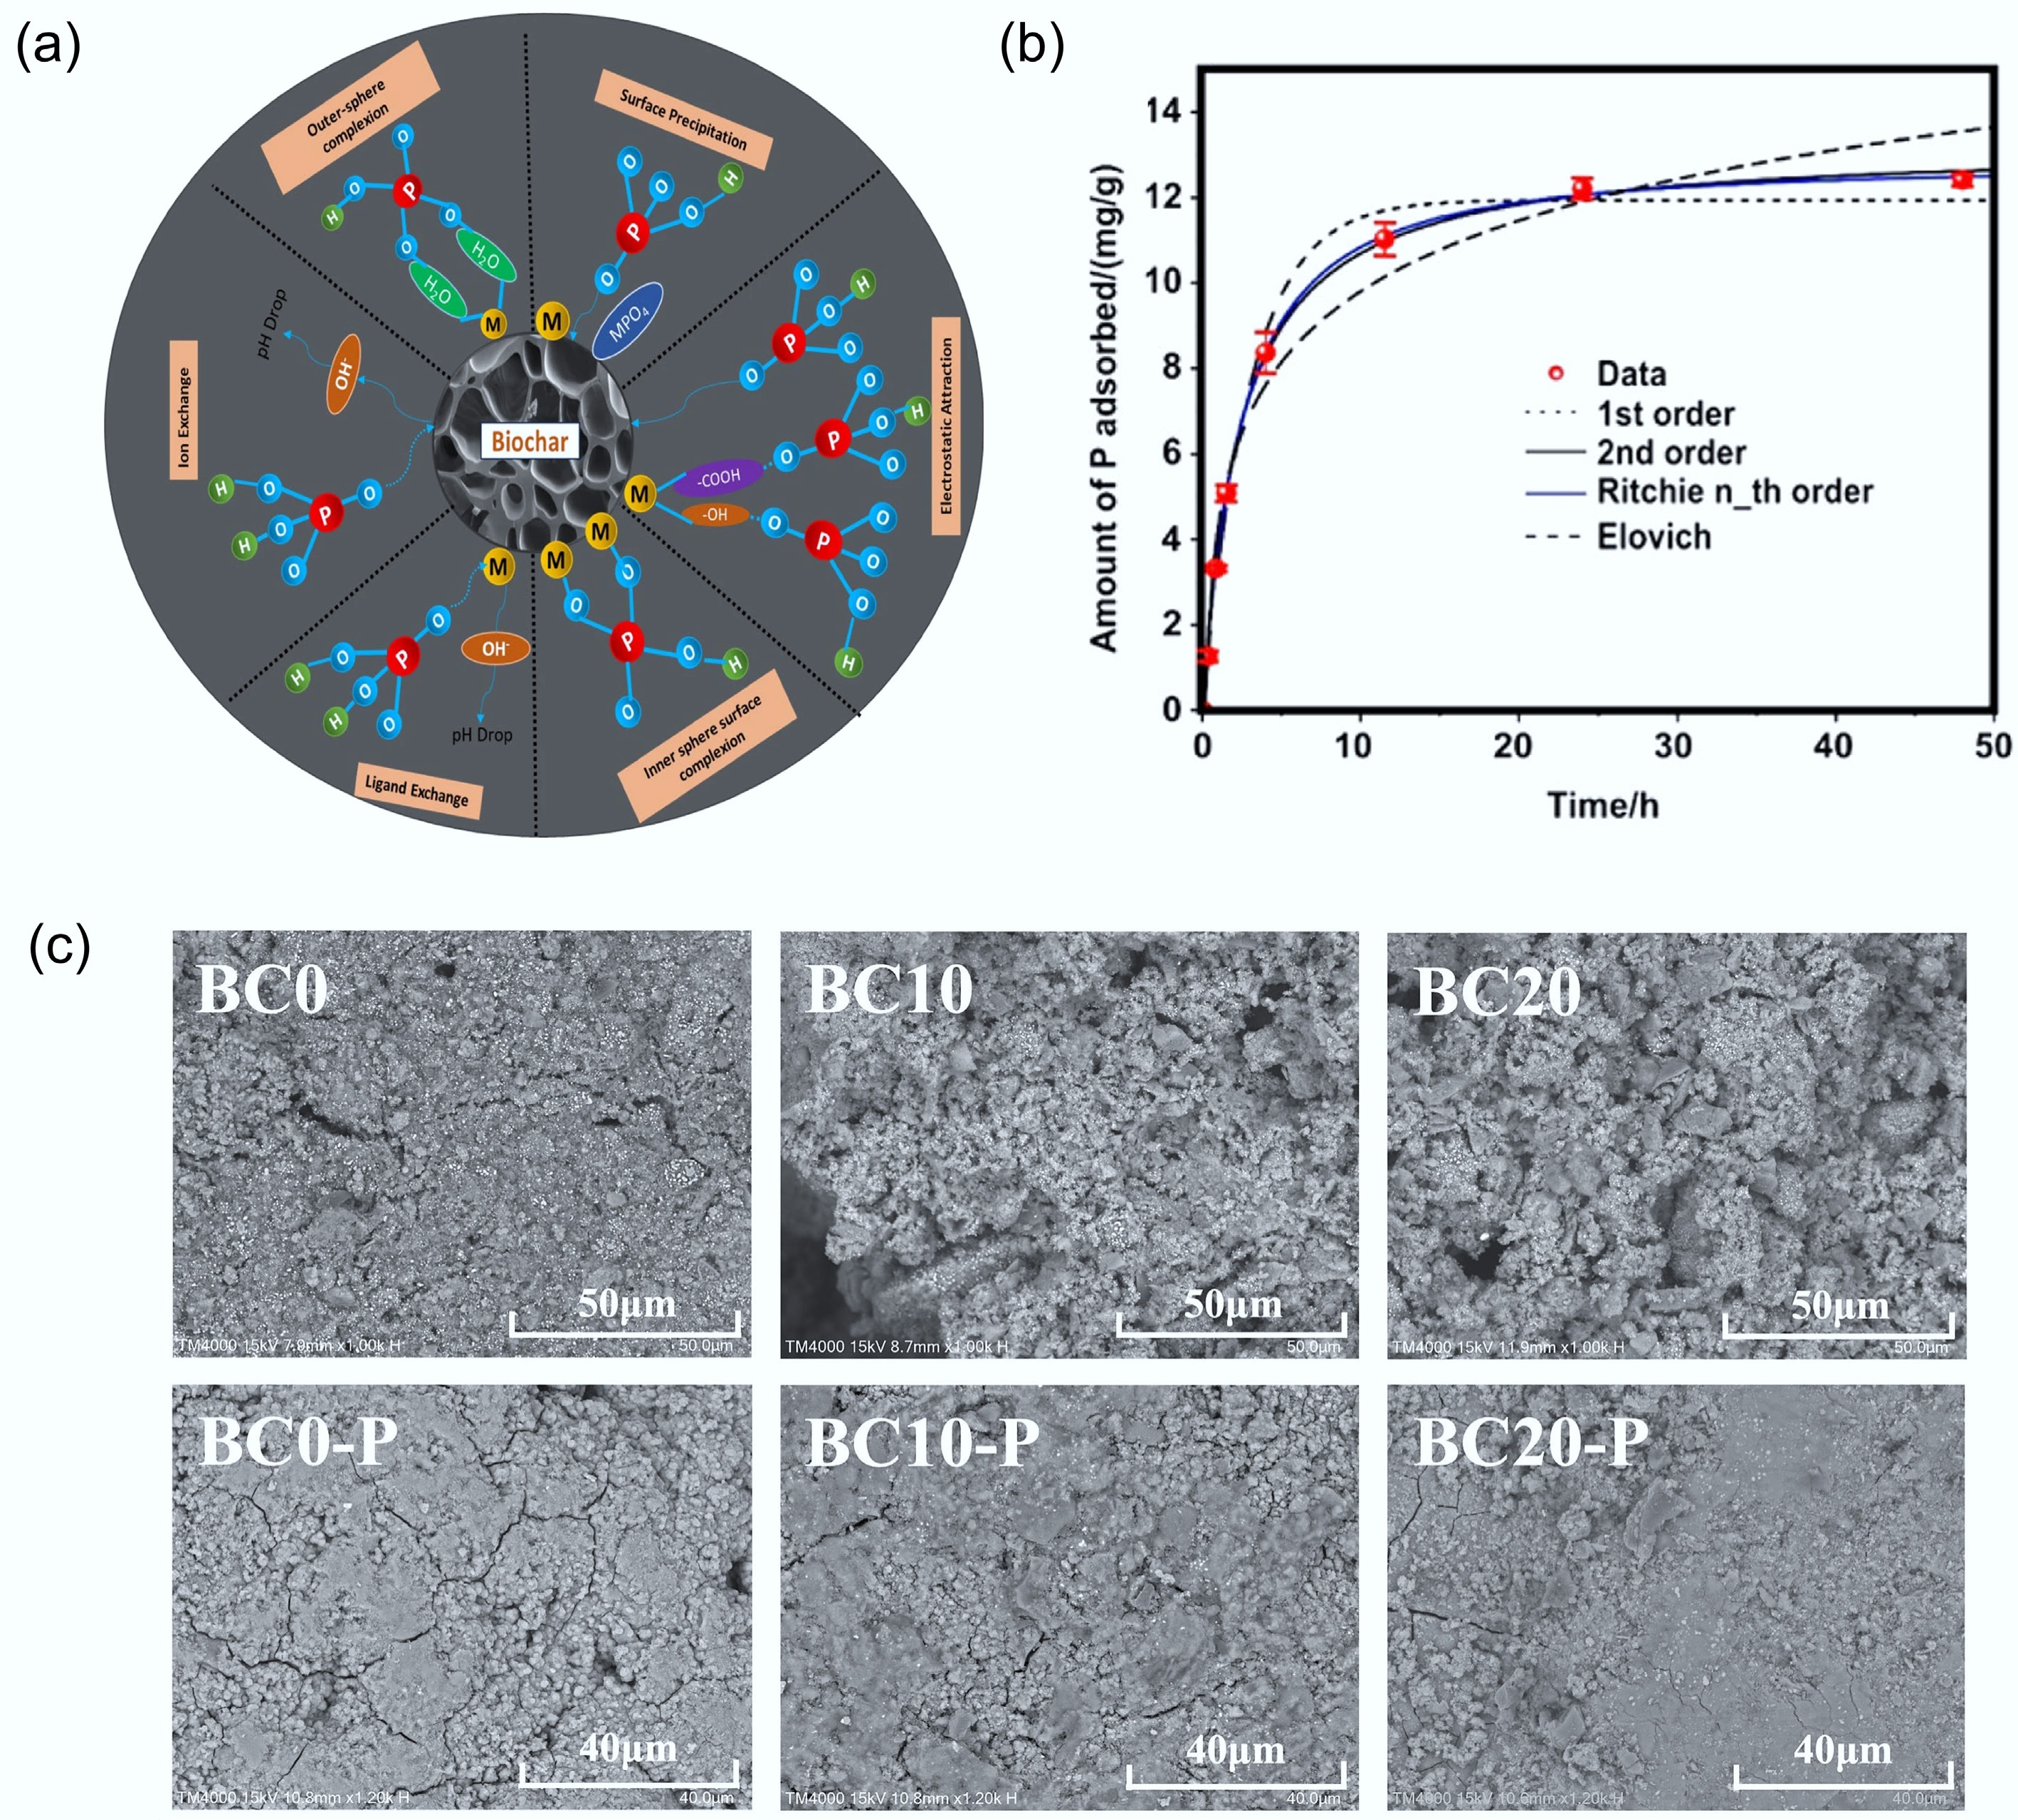
Figure 5.
Role of biochar in phosphorus recovery processes. (a) Mechanism involved in adsorption of P on biochar surface (where P = Phosphorus, O = oxygen, M = metals, H = Hydrogen, C = carbon)[37]. (b) Adsorption kinetic data and modeling for phosphate on the engineered biochar, where symbols are experimental data, and lines are model results[38]. (c) SEM images of BCs before and after P adsorption[39].
-
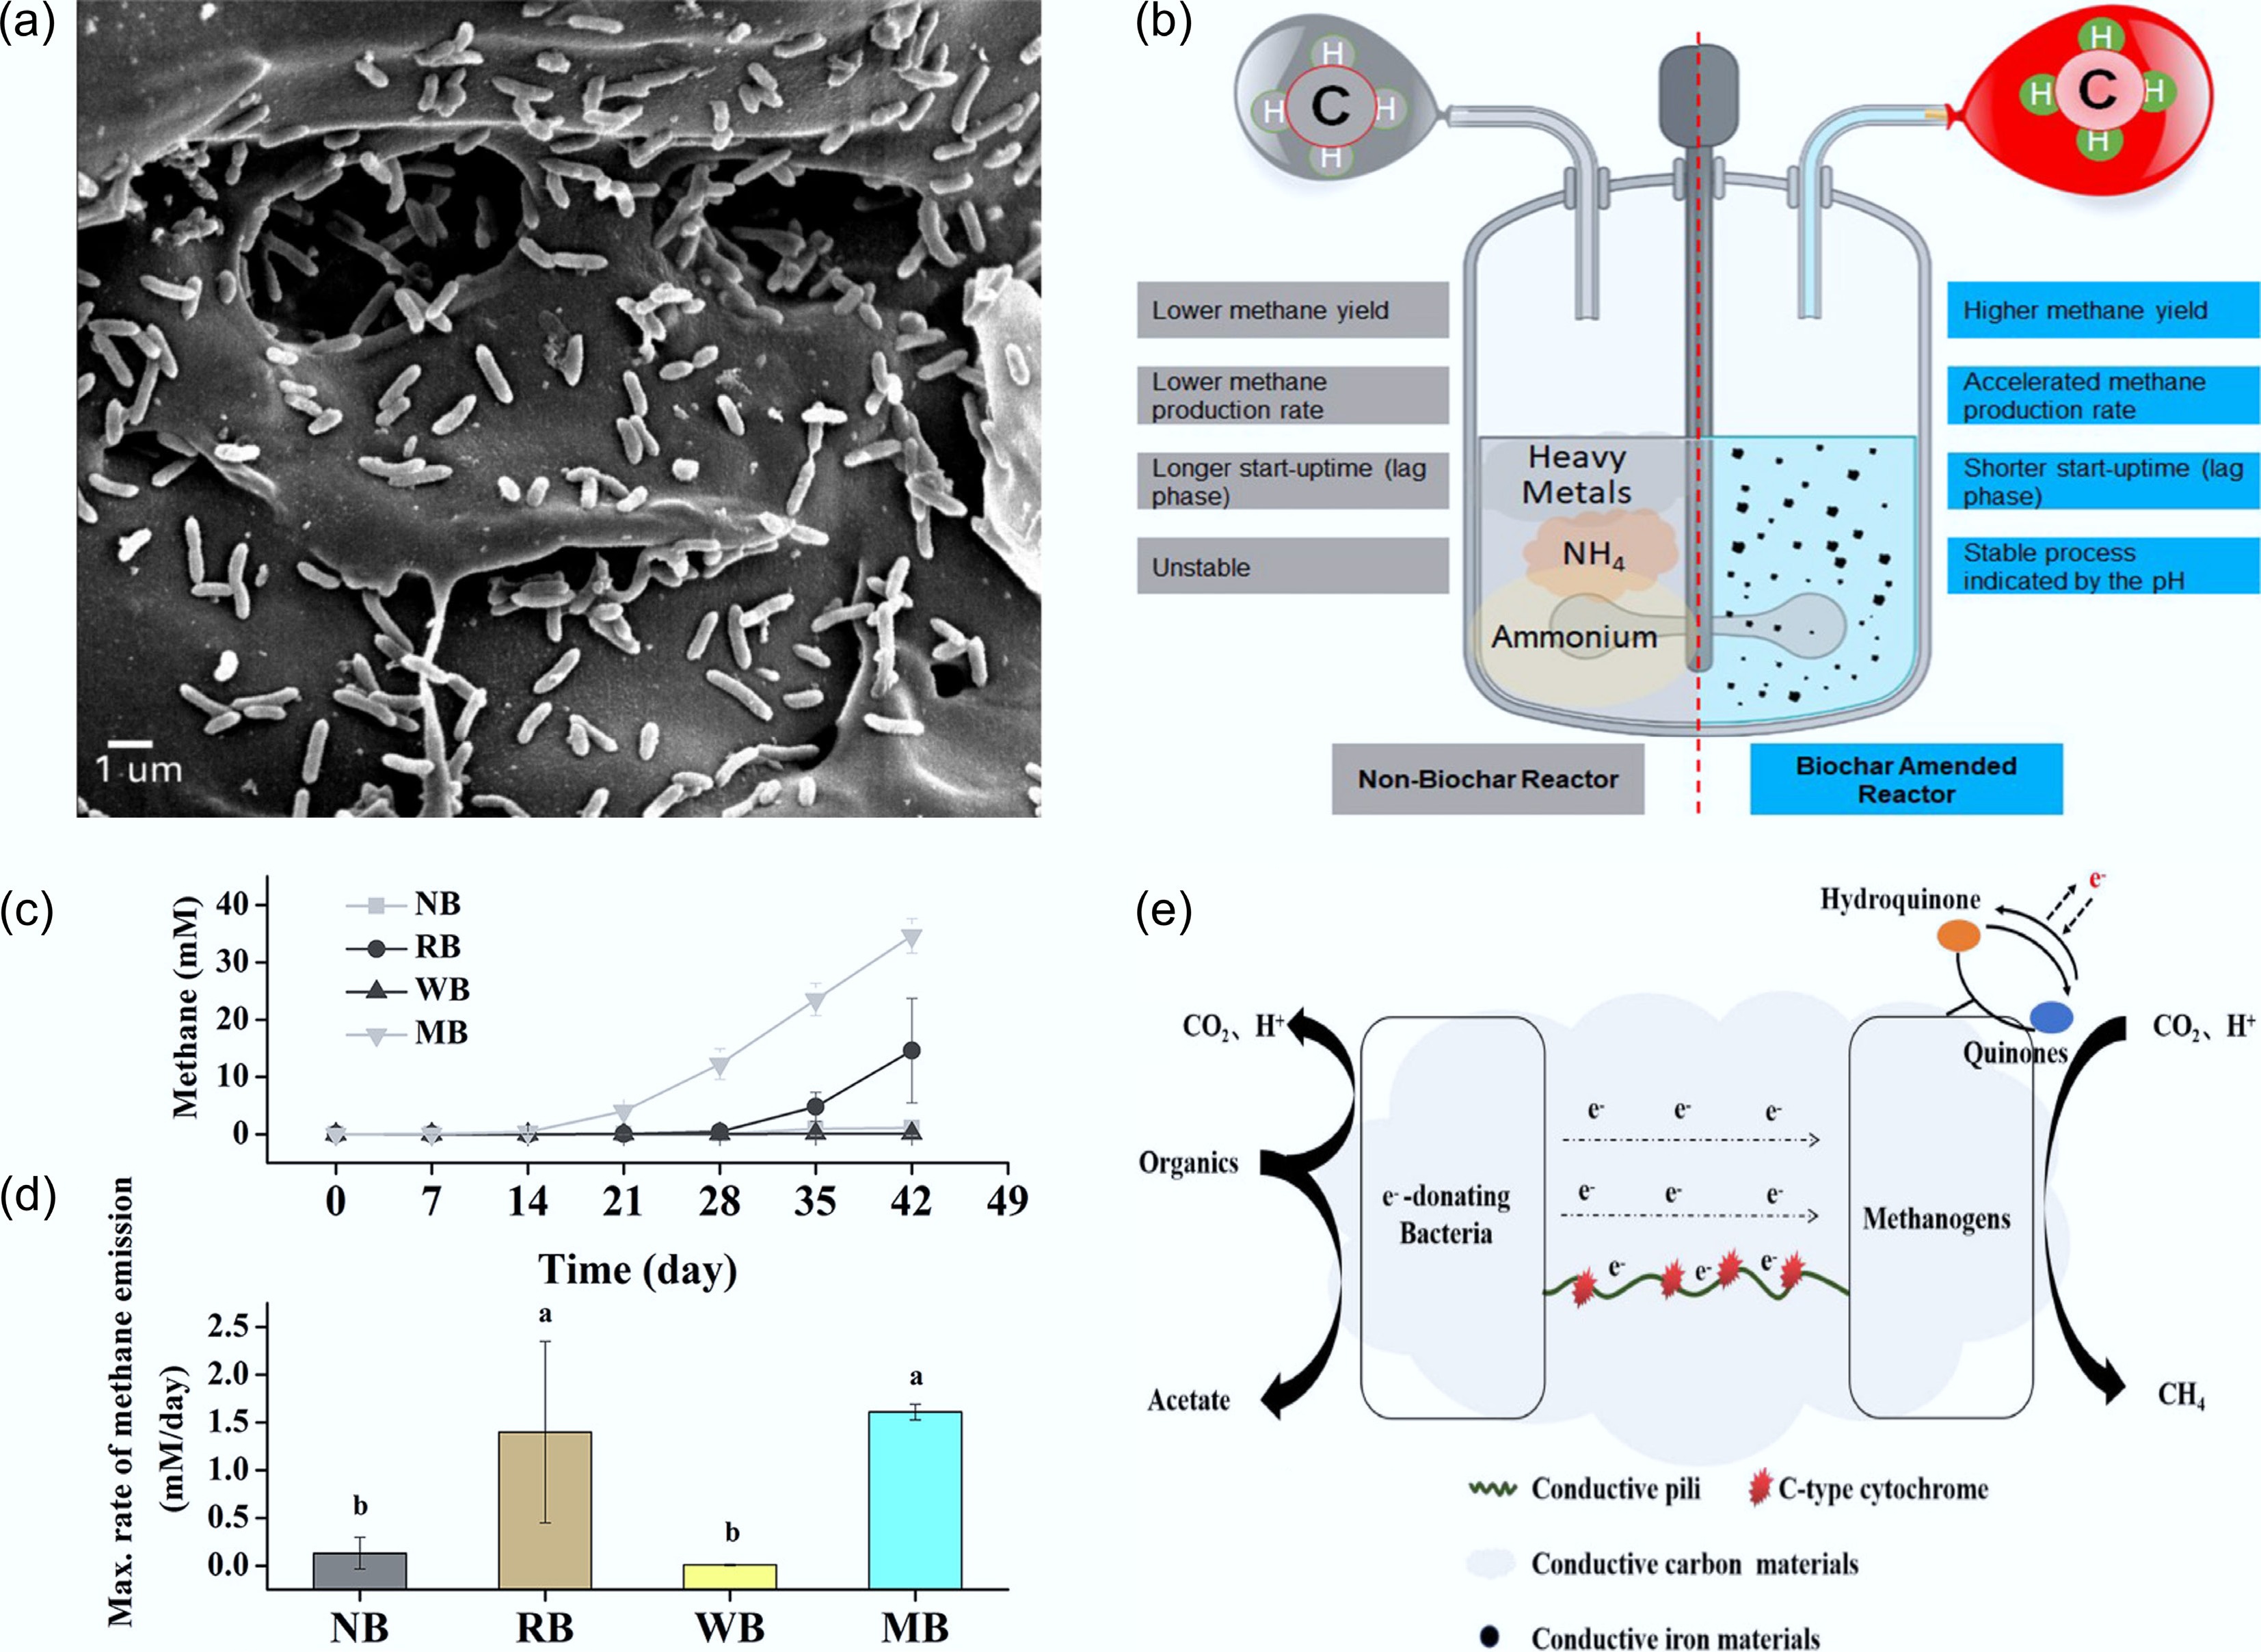
Figure 6.
Biochar-promoted methane production via DIET. (a) Scanning electron micrograph of the biochar tested (BEC) with a syntrophic co-culture of G. metallireducens and G. sulfurreducens[11]. (b) Comparison of anaerobic digester following DIET metabolic pathway against anaerobic reactor following non-DIET pathway[44]. Effects of biochar on methanogenic activities of paddy soil microbial communities, showing (c) time-courses of methane concentrations in the enrichment cultures with ethanol as a substrate in the absence or presence of biochar, and (d) the maximum methanogenic rates estimated from curves in (c). Methane concentrations are expressed as mM by assuming that methane was present in the aqueous phase. Different letters above the bar represent a significant (p < 0.05) difference in the maximum methanogenic rates among different treatments. Data are presented as the means of three independent experiments, and error bars represent standard deviations[50]. (e) Electron transfer mechanisms conductive carbon material mediating DIET[46].
-
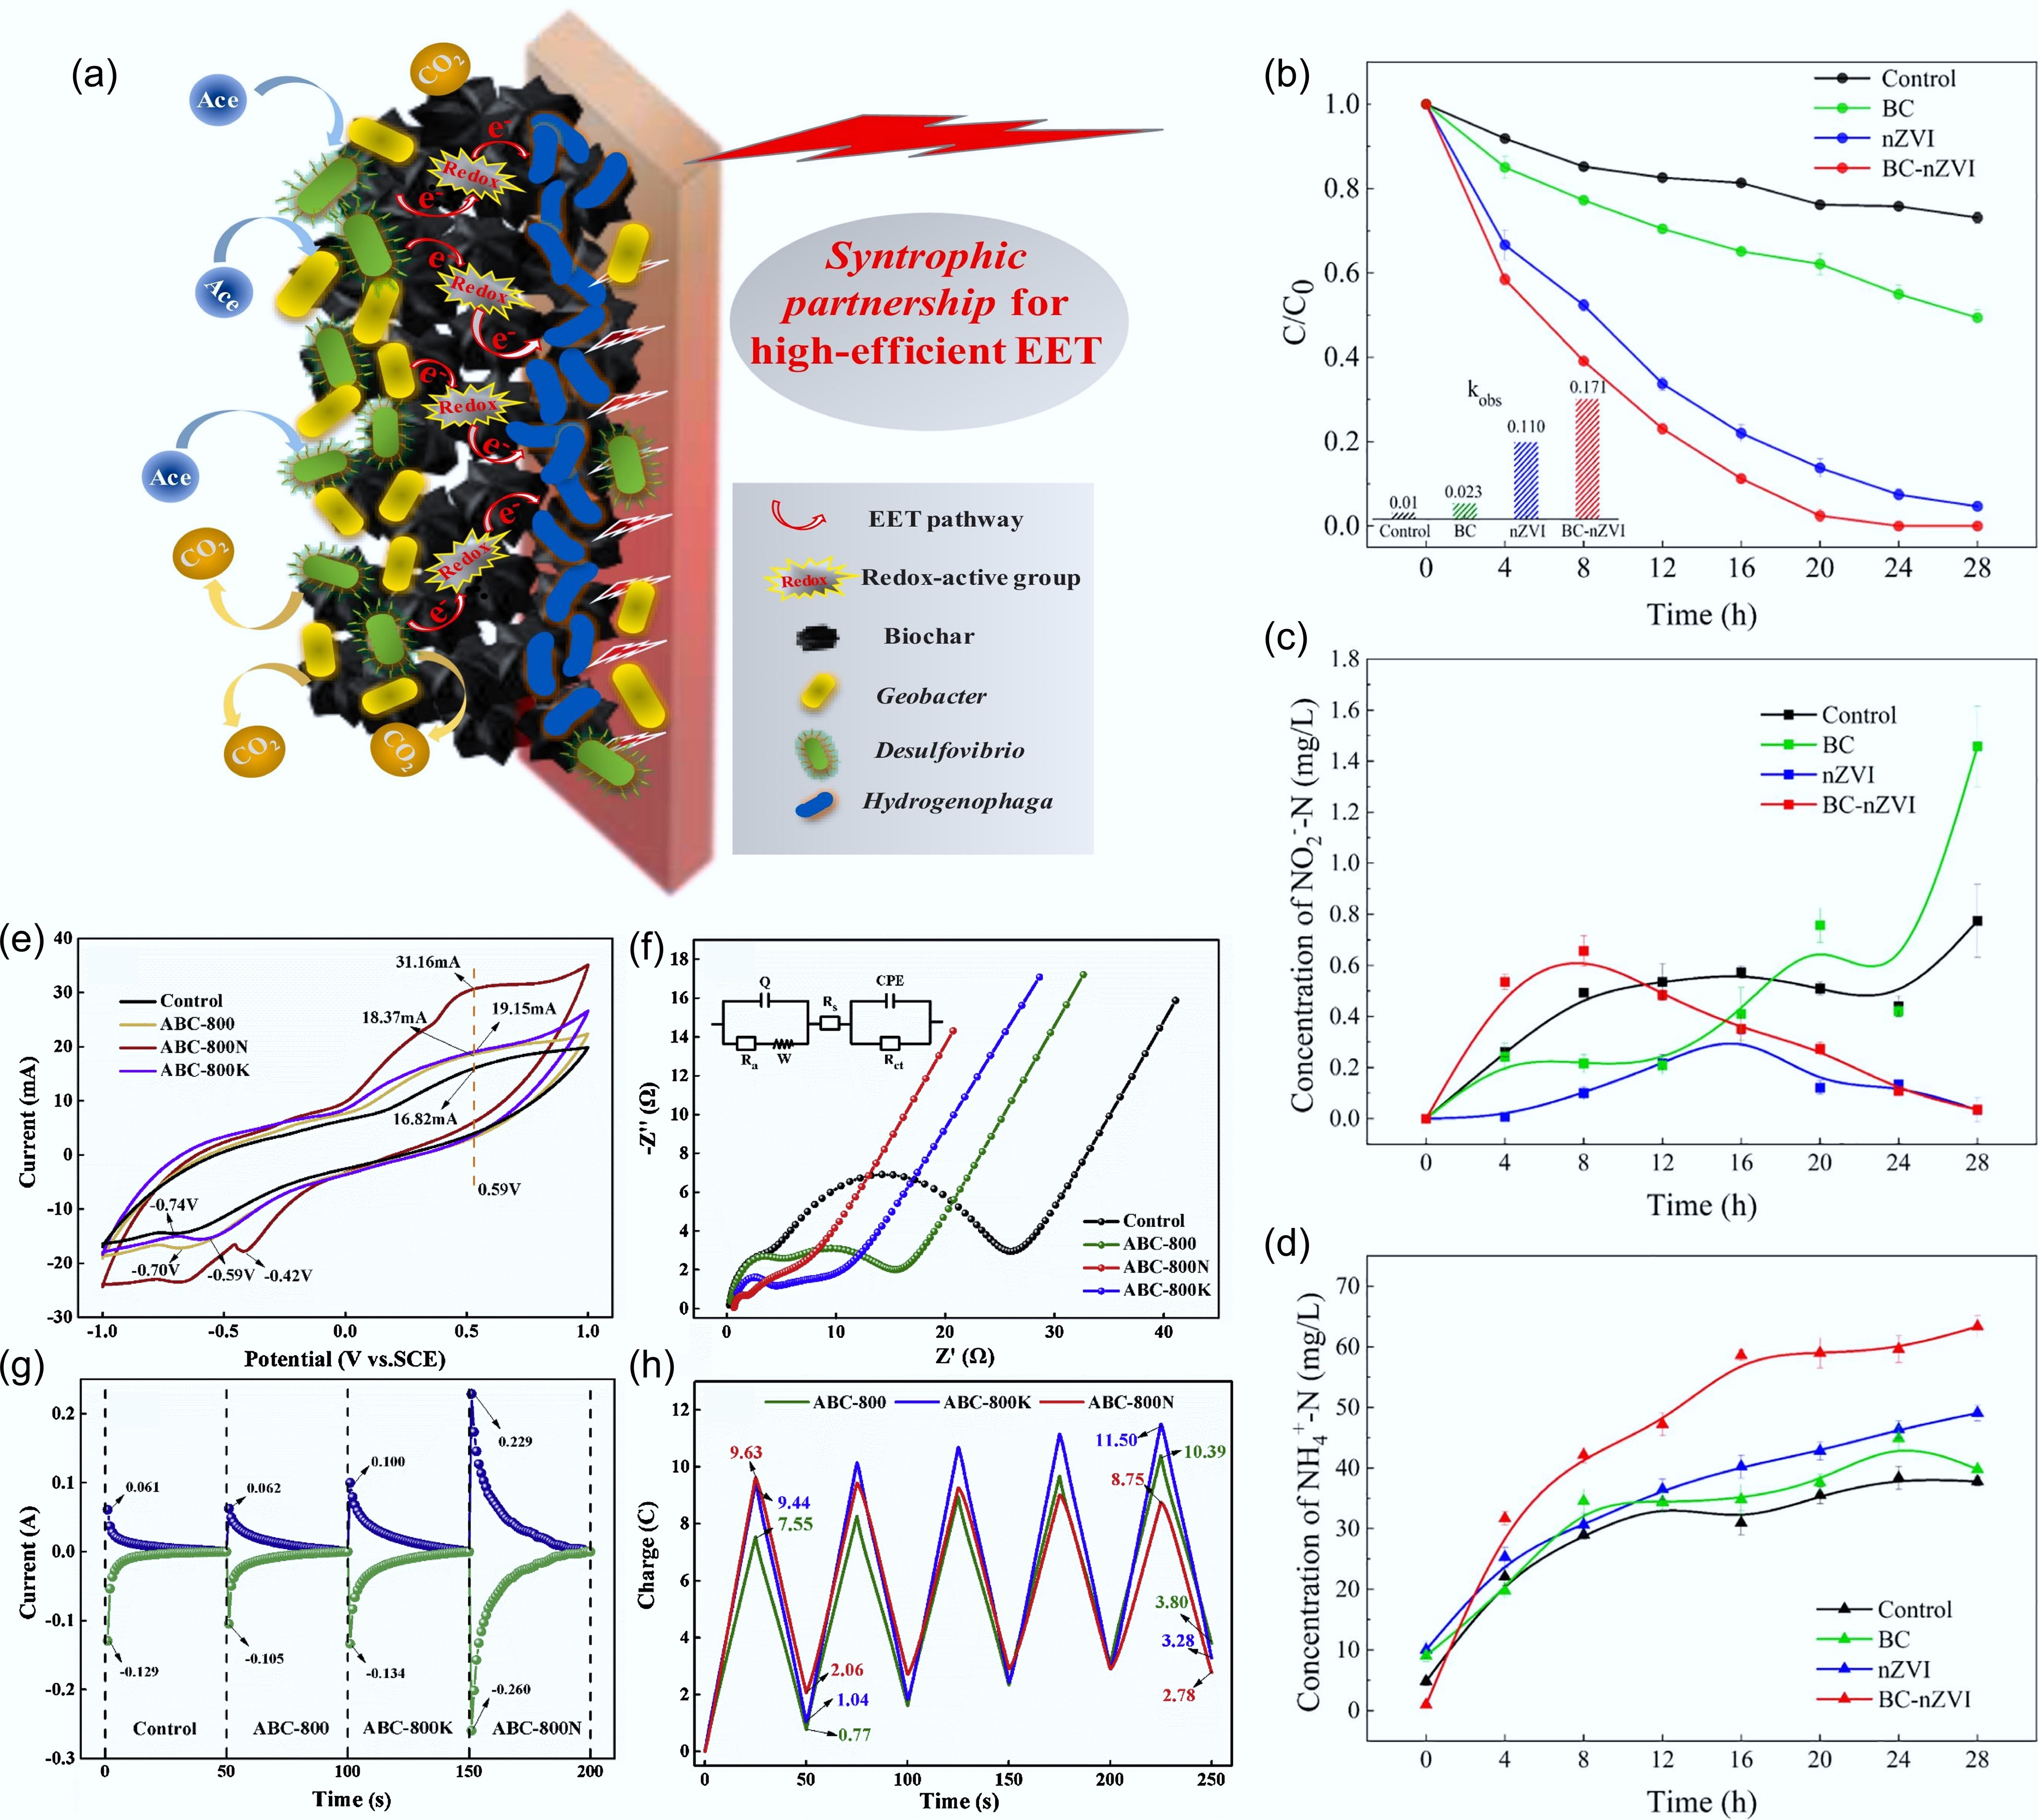
Figure 7.
Biochar facilitates microbial extracellular electron transfer in BES. (a) Proposed mechanism of redox-active biochar boosting EET in anode chamber of BES[66]. Changes in (b) nitrate, (c) nitrite, and (d) ammonia concentration for the control, activated biochar (BC), nano zero-valent iron (nZVI), and biochar-supported nano zero-valent iron (BC-nZVI) groups[67]. (e) CV curves, (f) EIS curves, (g) reductive and oxidative current responses by chronoamperometry, and (h) changes in the amounts of electrons during five successive cycles of charge and discharge of biochar made from Taihu blue algae with four different pretreatments[68].
-
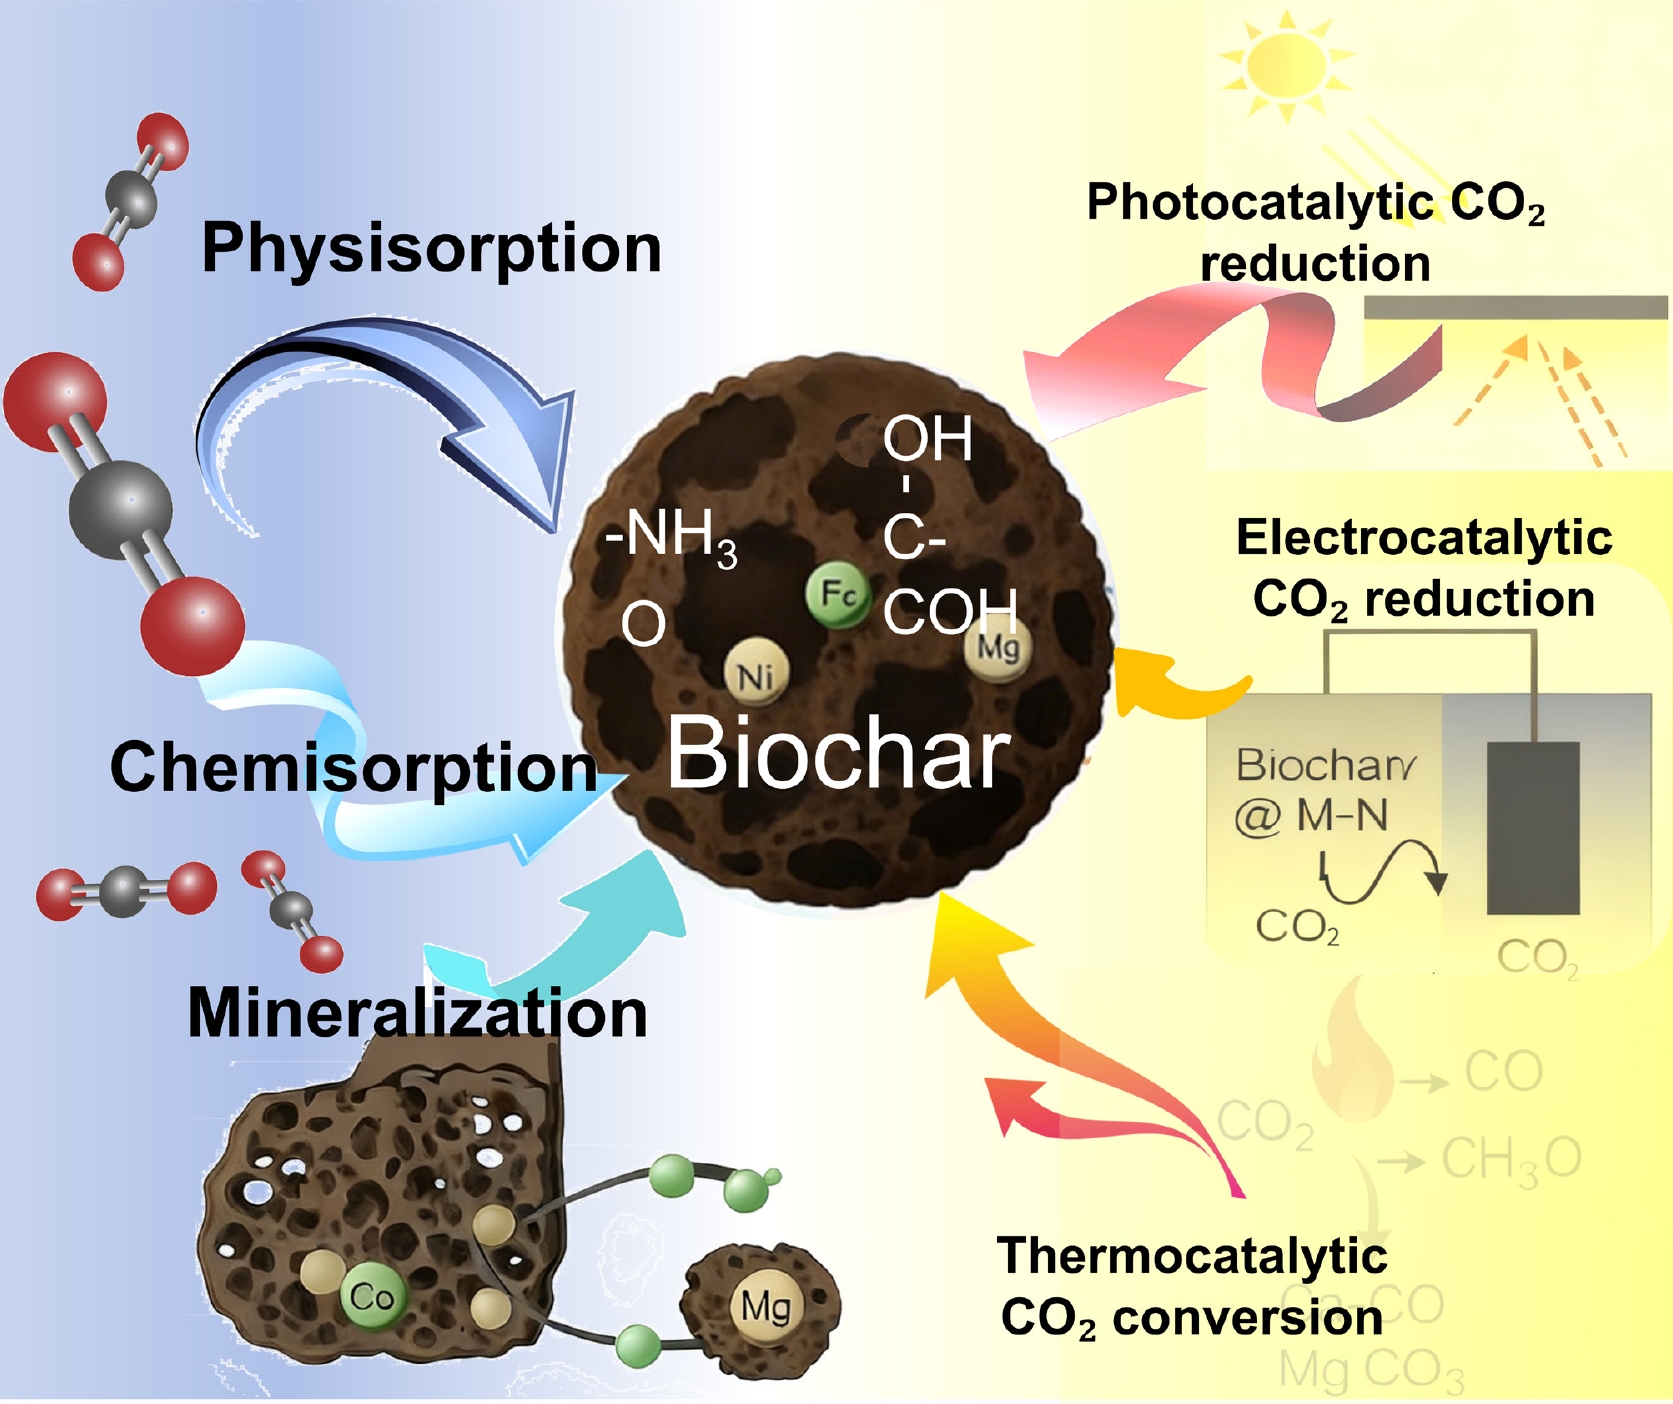
Figure 8.
Biochar mediating CO2 capture and conversion network.
-
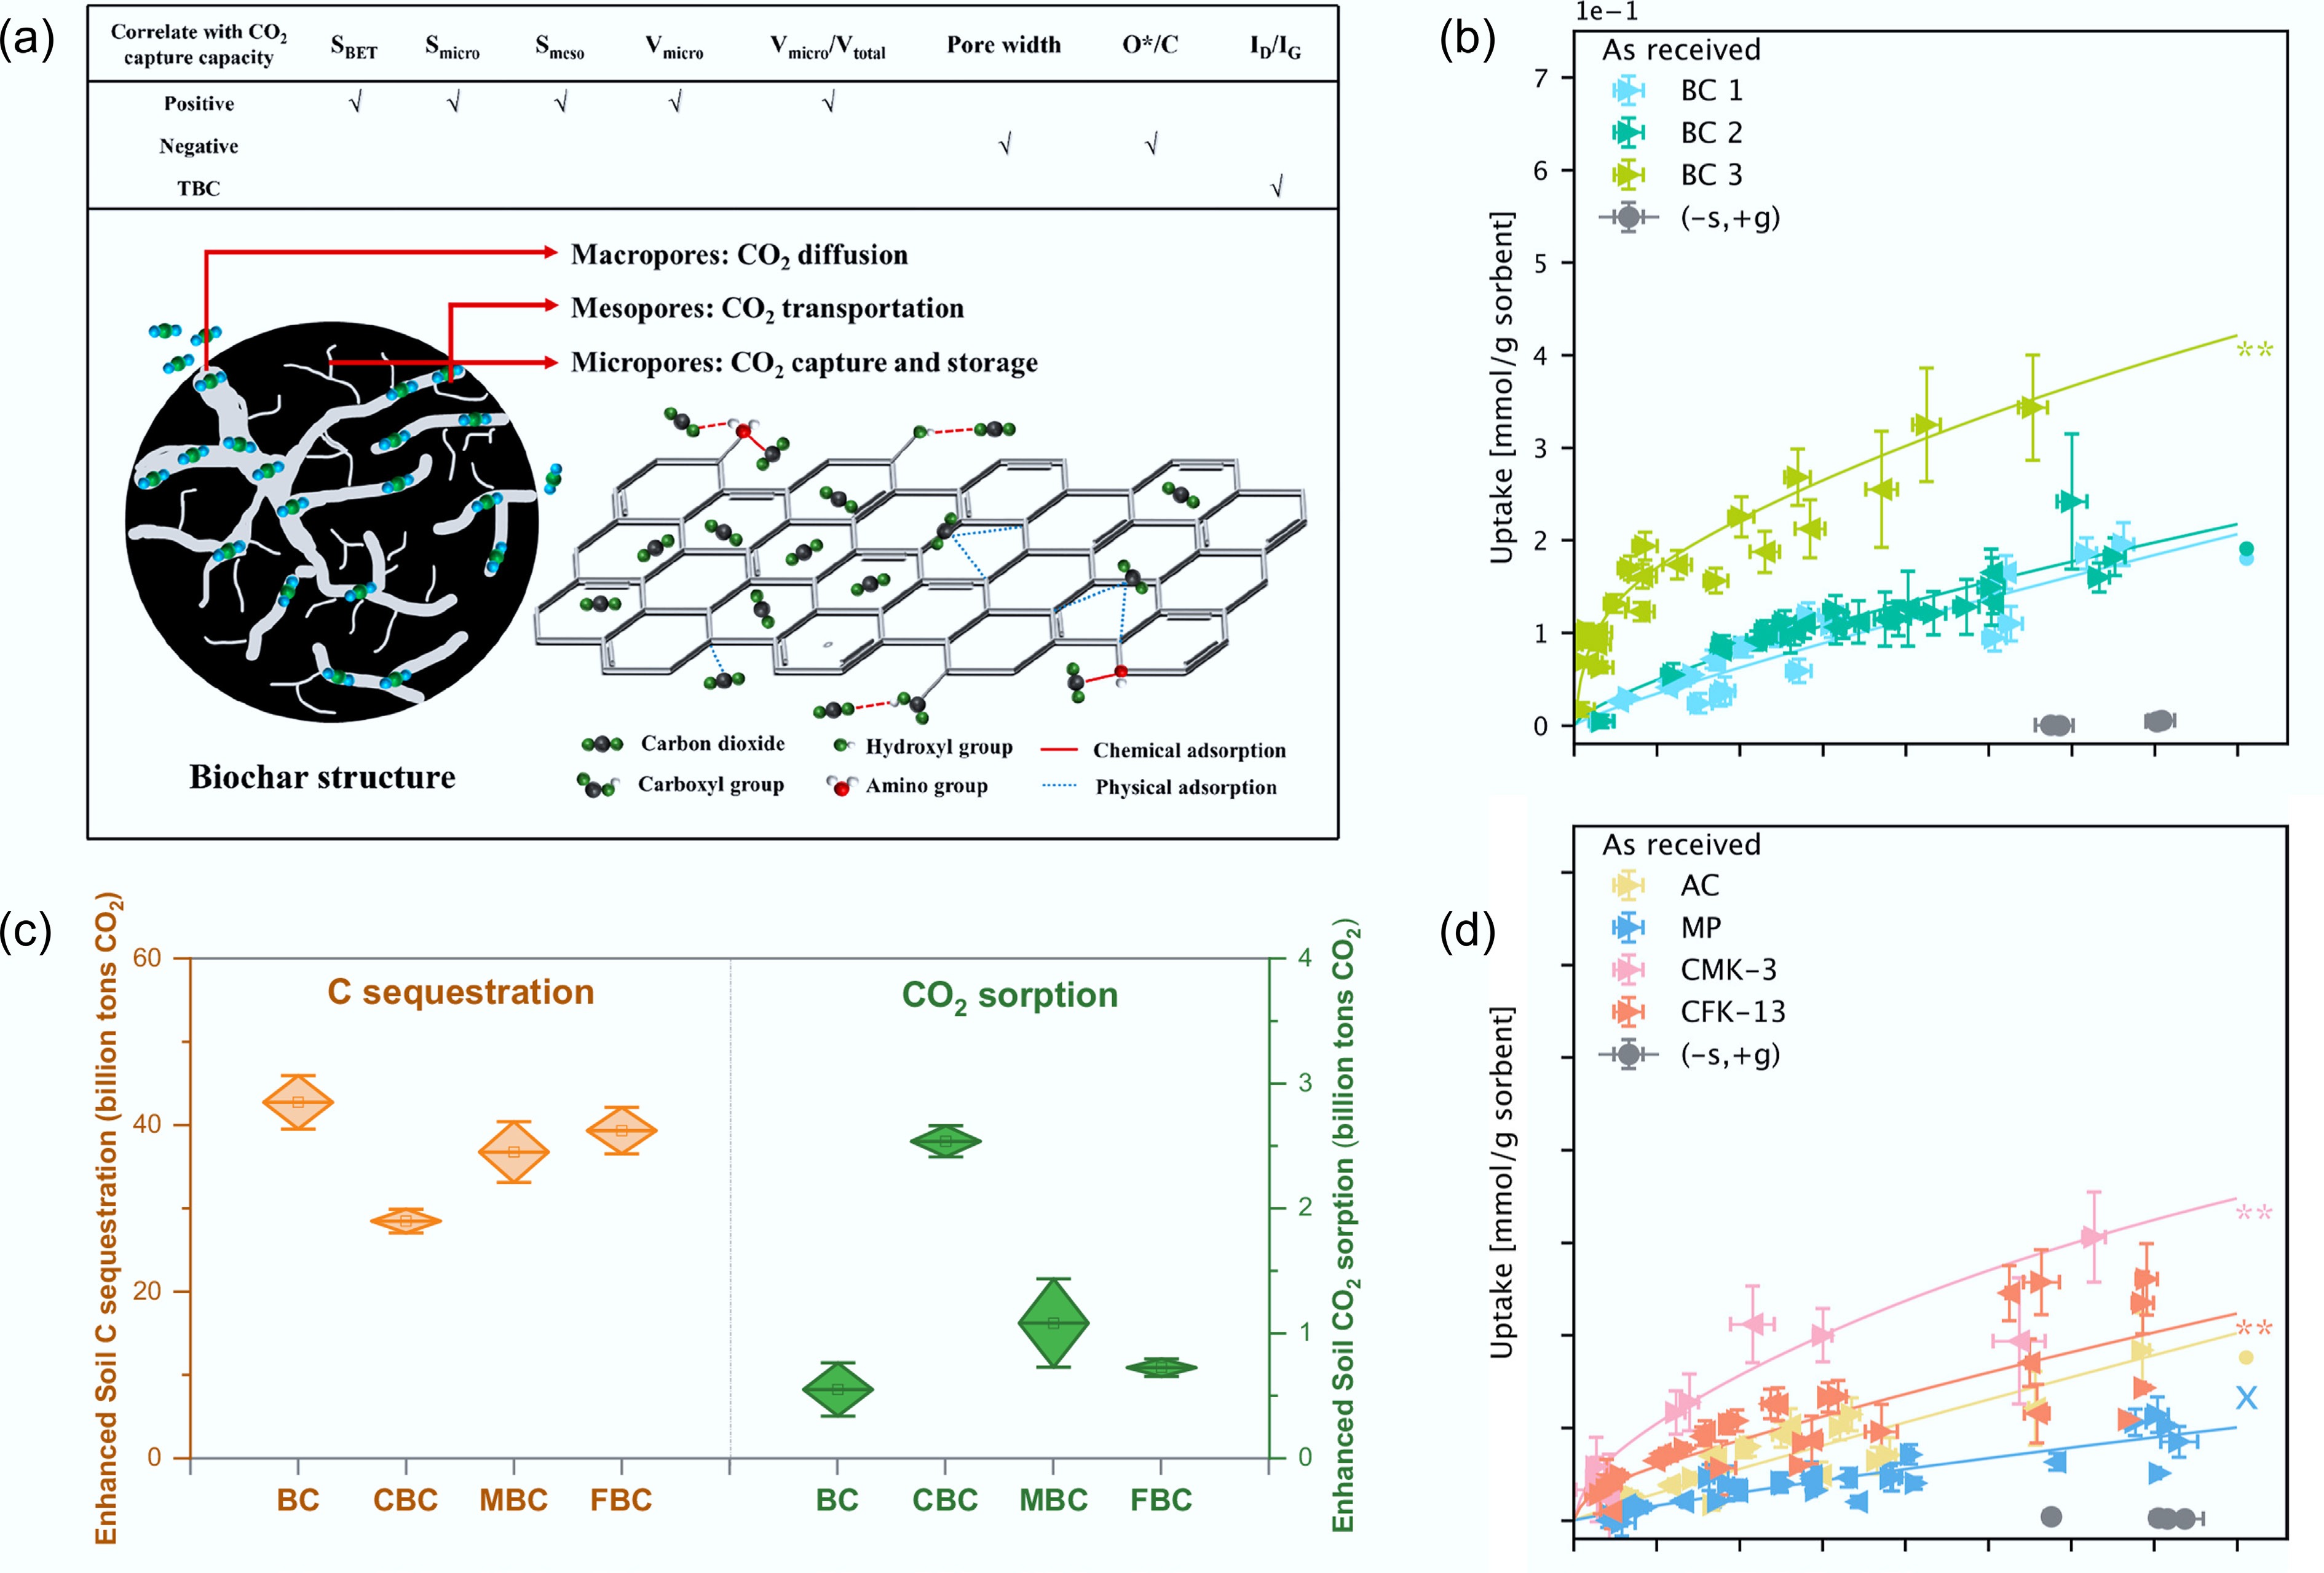
Figure 9.
Performance of biochar in CO2 capture. (a) Potential mechanism of CO2 physisorption by a porous biochar material[74]. (b) Adsorption (forward arrows), and (d) desorption (reverse arrows) of CO2 in balanced air on BC1, BC2, BC3, MP, AC, CFK-13, and CMK-3 as received[75]. (c) Carbon sequestration and enhanced CO2 sorption potential of biochar in cultivated soil across China[14].
-
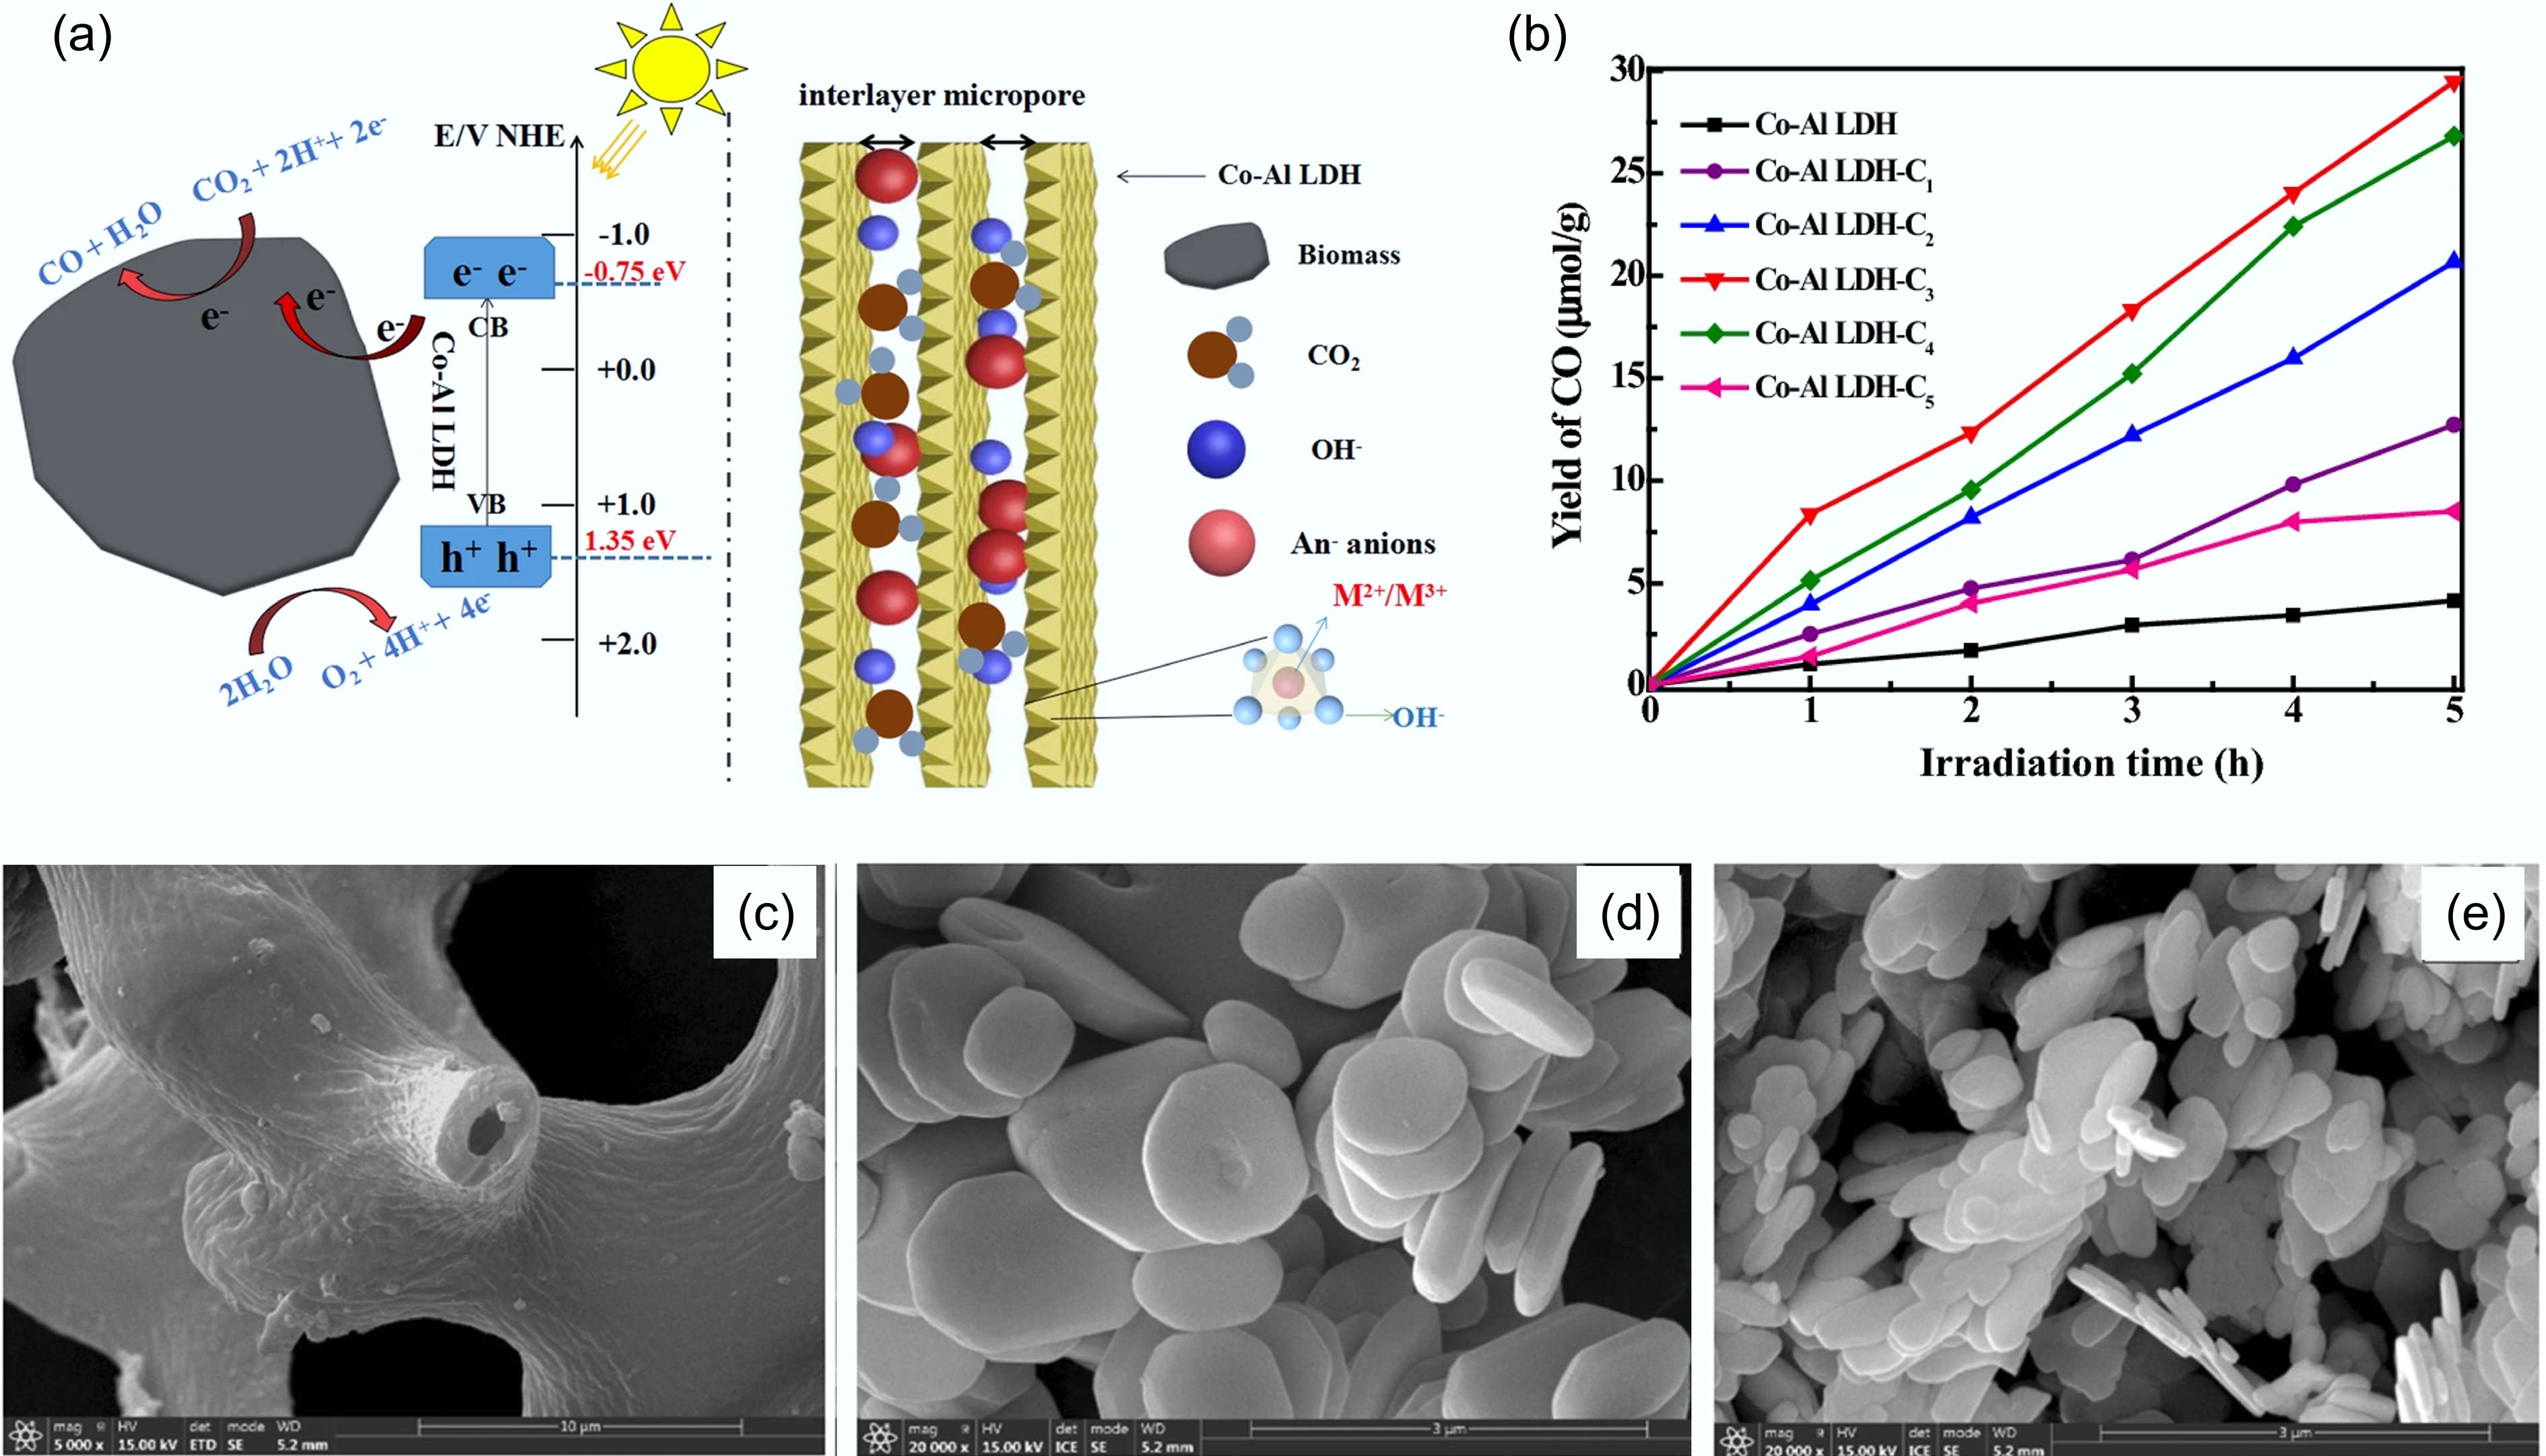
Figure 10.
Performance of biochar in CO2 photocatalysis conversion. (a) Schematic illustration of the mechanism for photocatalytic reduction of CO2 by biochar-modified Co–Al LDH and charge carrier transfer under UV-light irradiation. (b) Yields of a CO for photocatalytic conversion of CO2 over Co–Al LDH, Co–Al LDH–C1, Co–Al LDH–C2, Co–Al LDH–C3, Co–Al LDH–C4, and Co–Al LDH–C5 (referred to biochar derived from withered cherry blossoms) after 5 h under UV-light irradiation[102]. SEM images of (c) rush biochar, (d) BiOCl, and (e) a 0.5% sample. Compared with the reference BiOCl, the 0.5% sample has a thinner lamellar thickness and smaller particle size, which solidly proves that BC affects the growth of BiOCl crystals[103].
-
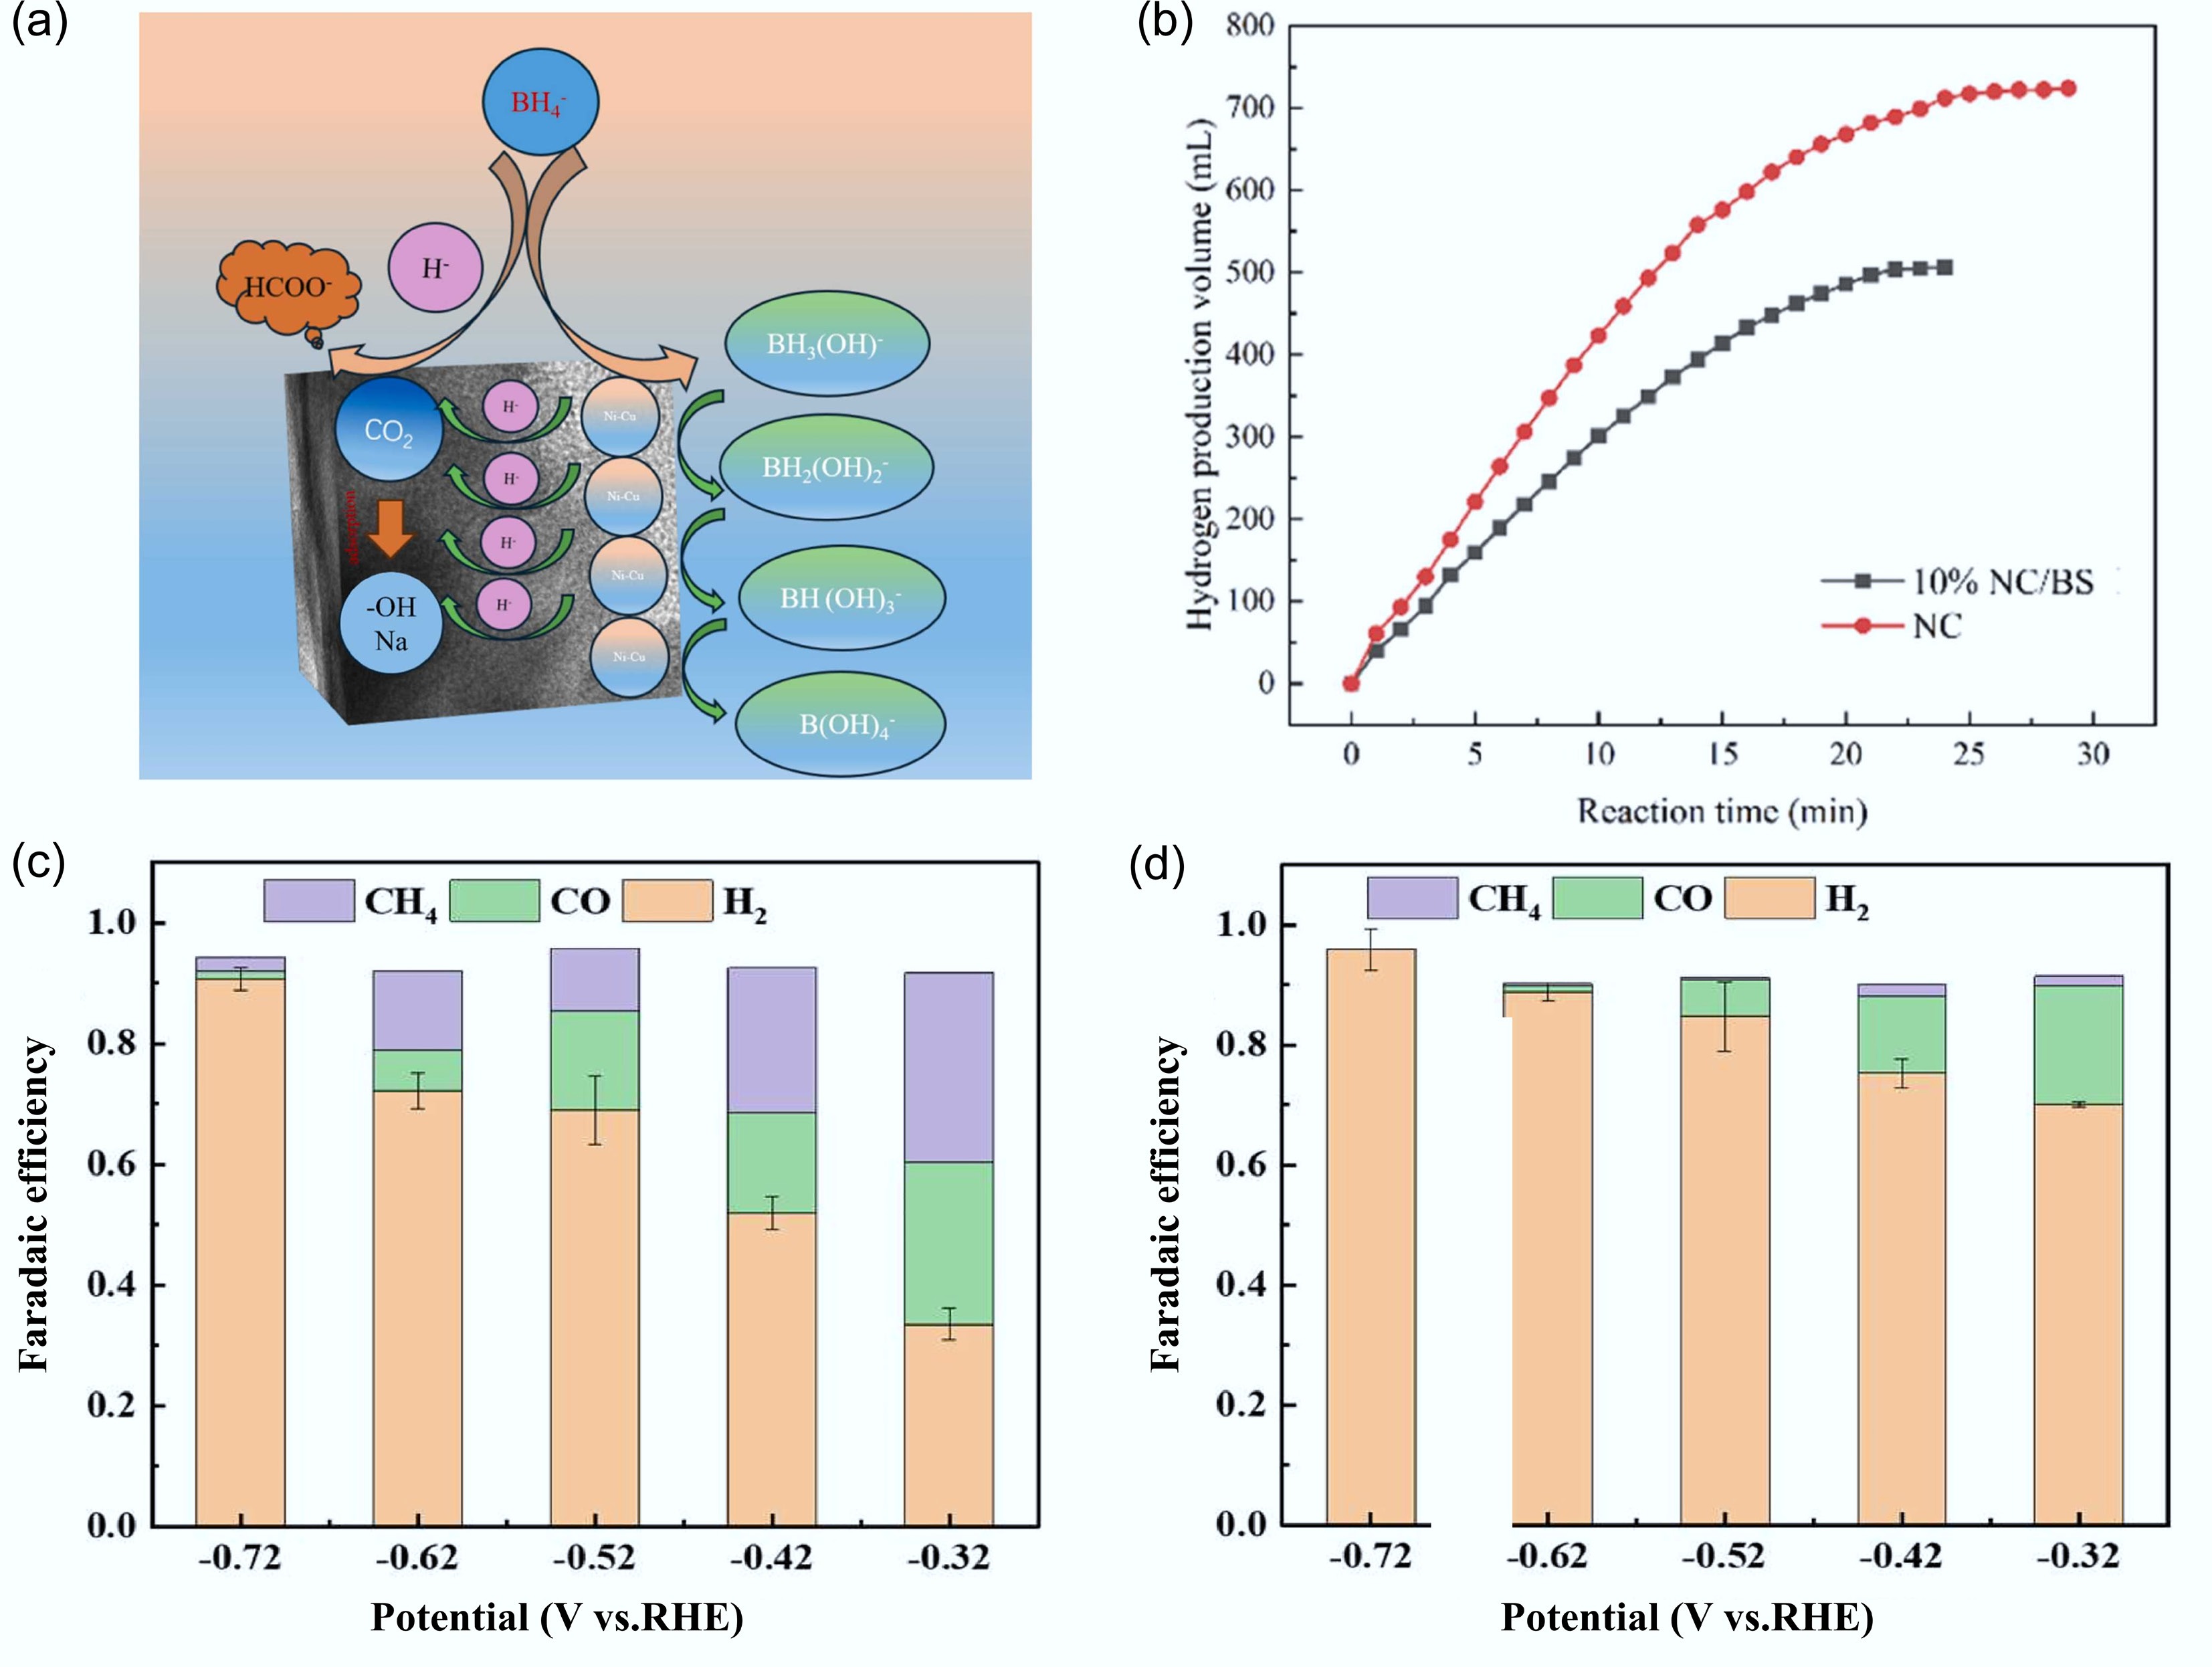
Figure 11.
Performance of biochar in CO2 electrocatalysis conversion. (a) Conceptual diagram of CO2 reduction with NaBH4 catalyzed by 10% NC/BS (sodium hydroxide-modified biochar-supported nickel-copper bimetallic alloy). (b) Catalytic performance of 10% NC/BS for CO2 reduction: hydrogen production volume vs reaction time[105]. Products distribution of CO2 RR using (c) Cu/C-BN, and (d) Cu/C materials[106].
-
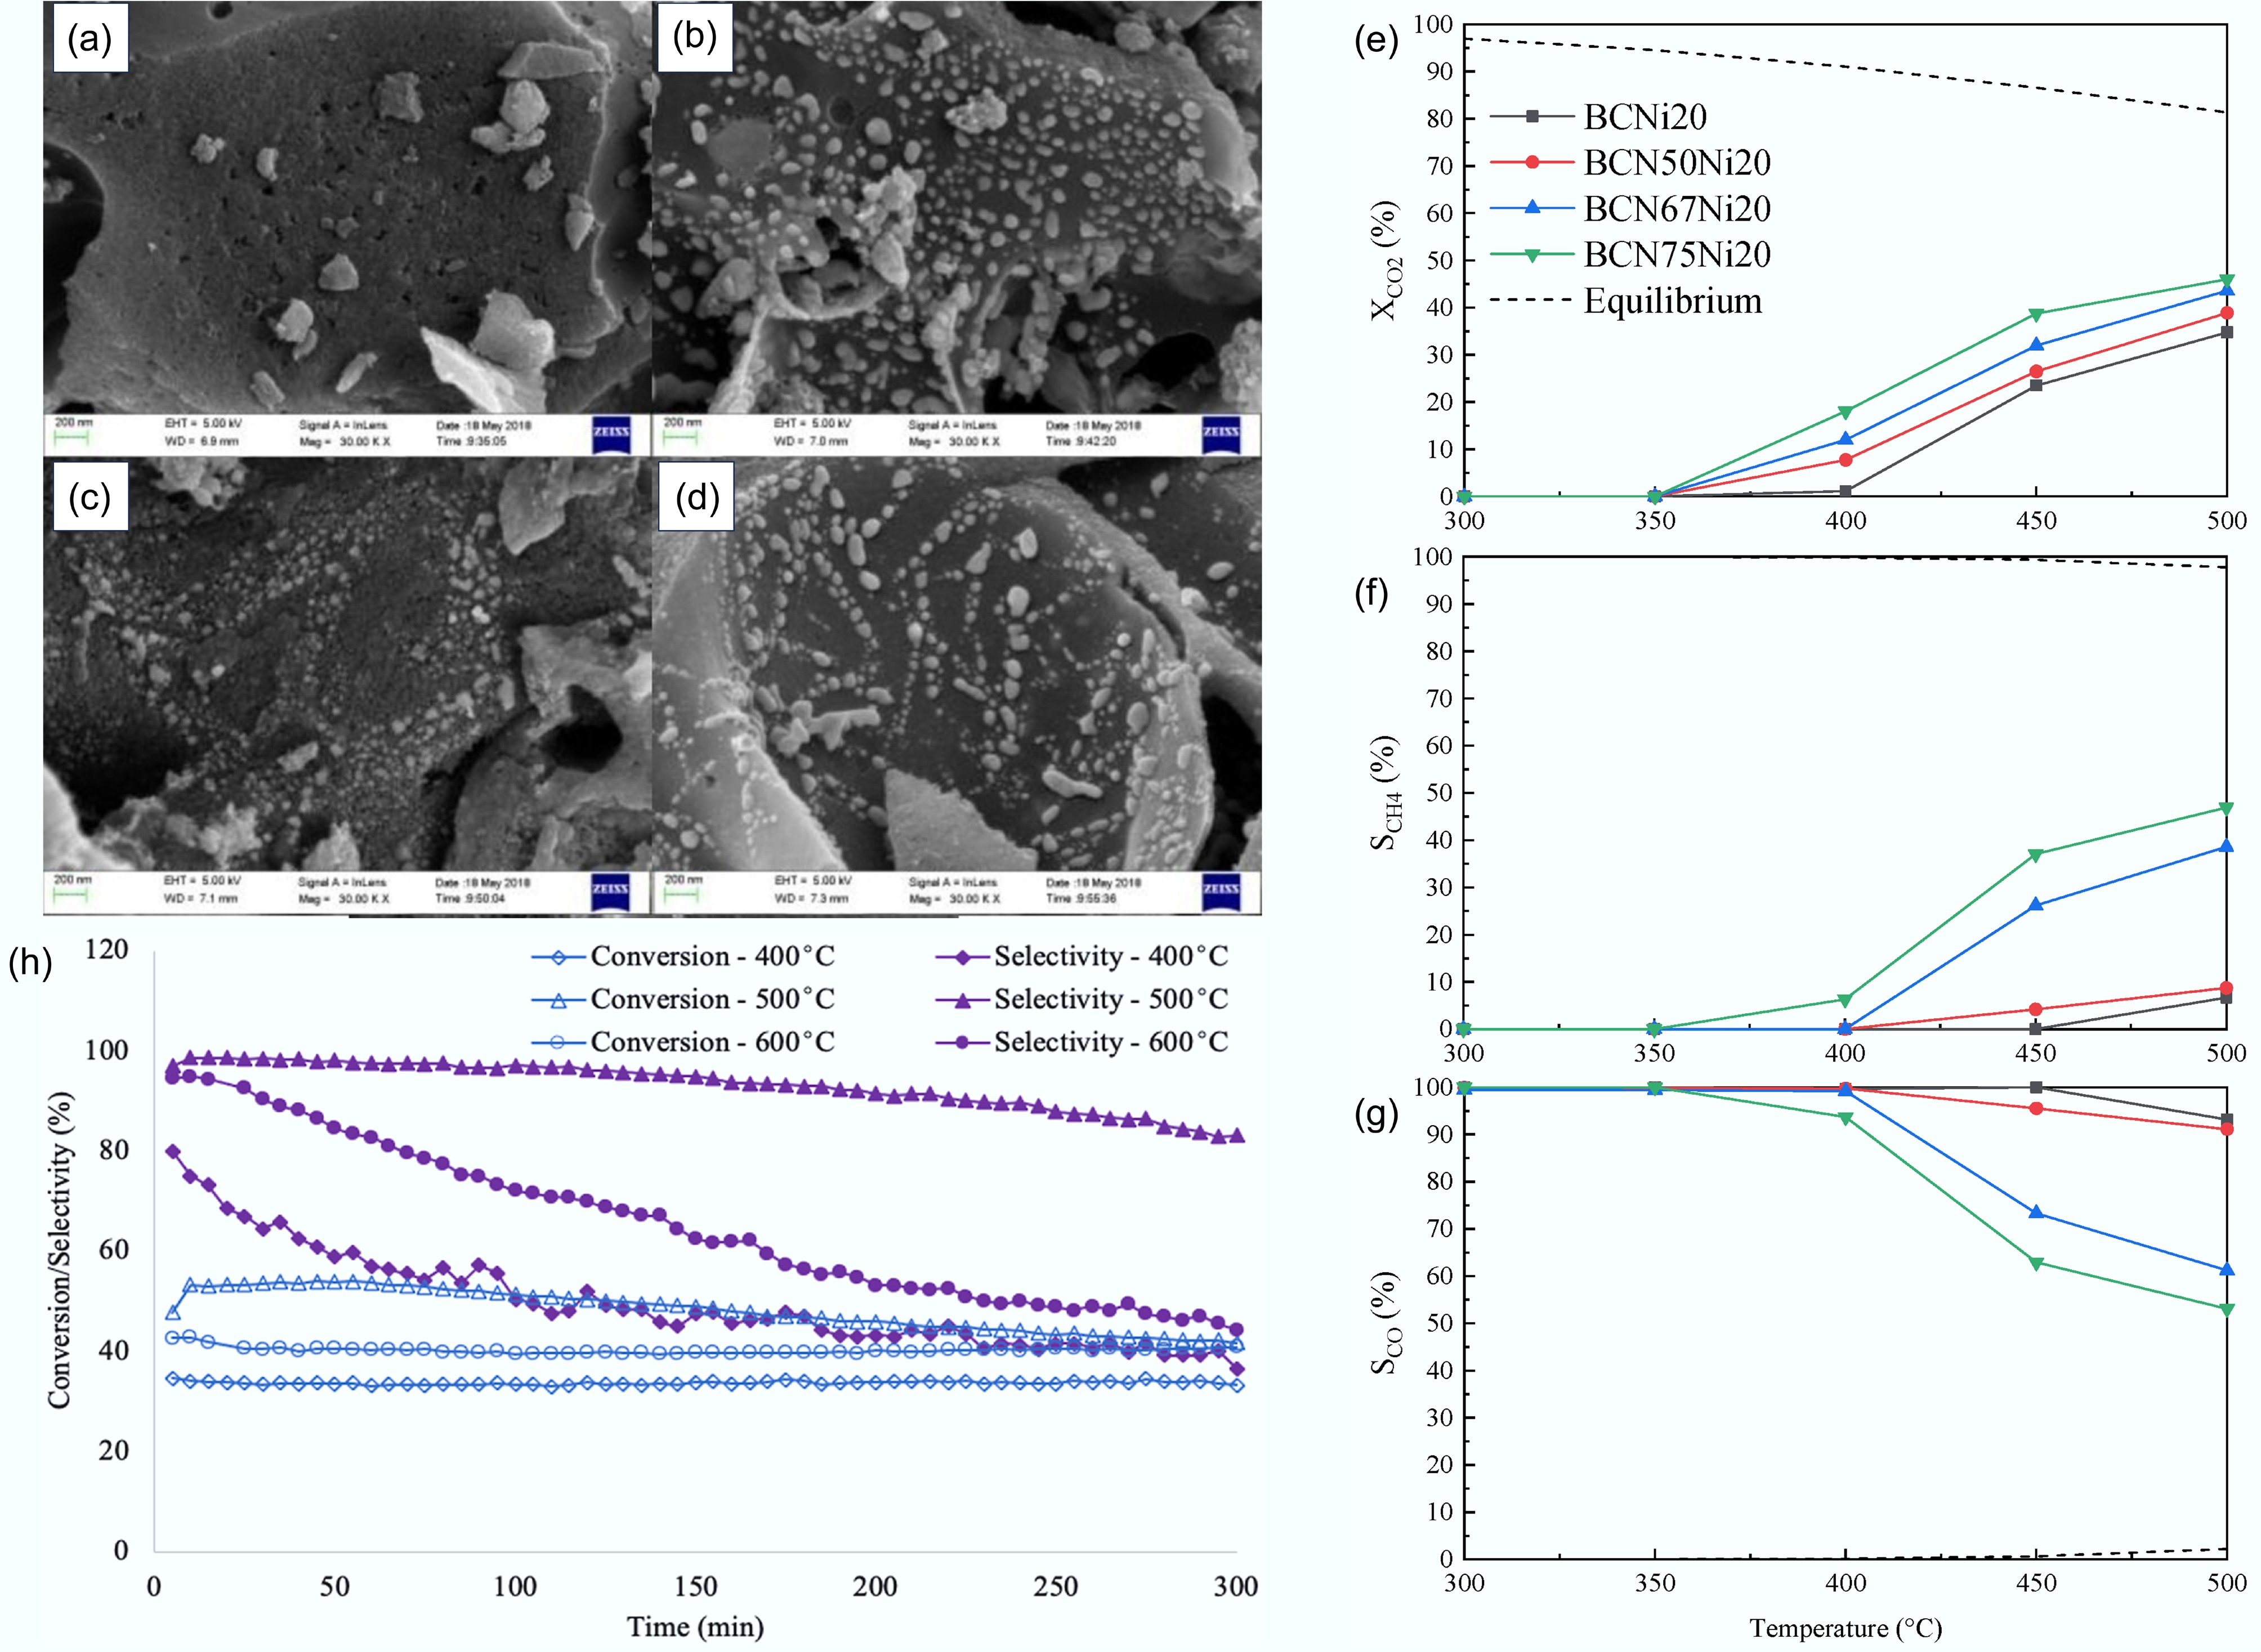
Figure 12.
Performance of biochar in CO2 thermocatalysis conversion: SEM micrographs of biochar materials before and after the reaction. (a) Coconut shell carbon CSC, (b) fresh Ni/CSC, (c) fresh Ni-Mg 0.26/CSC, and (d) used Ni/CSC[109]. (e)–(g) for the Ni-based catalysts produced with wheat-straw-derived activated biochar doped with CeO2, the CO2 methanation experiment was conducted under 30 NLgh conditions, and the (e) CO2 conversion rate, (f) methane selectivity, and (g) carbon monoxide selectivity were compared. (h) Biochar-based catalyst performance for CO2 methanation at 400, 500, and 600 °C. Ni loading: 7 wt%; reaction conditions: 37.5 mL/g/min, H2 : CO2 ratio 4:1. Values accurate to ± 6.2% for CO2 conversion and ± 4.8% for CH4 selectivity[76].
-
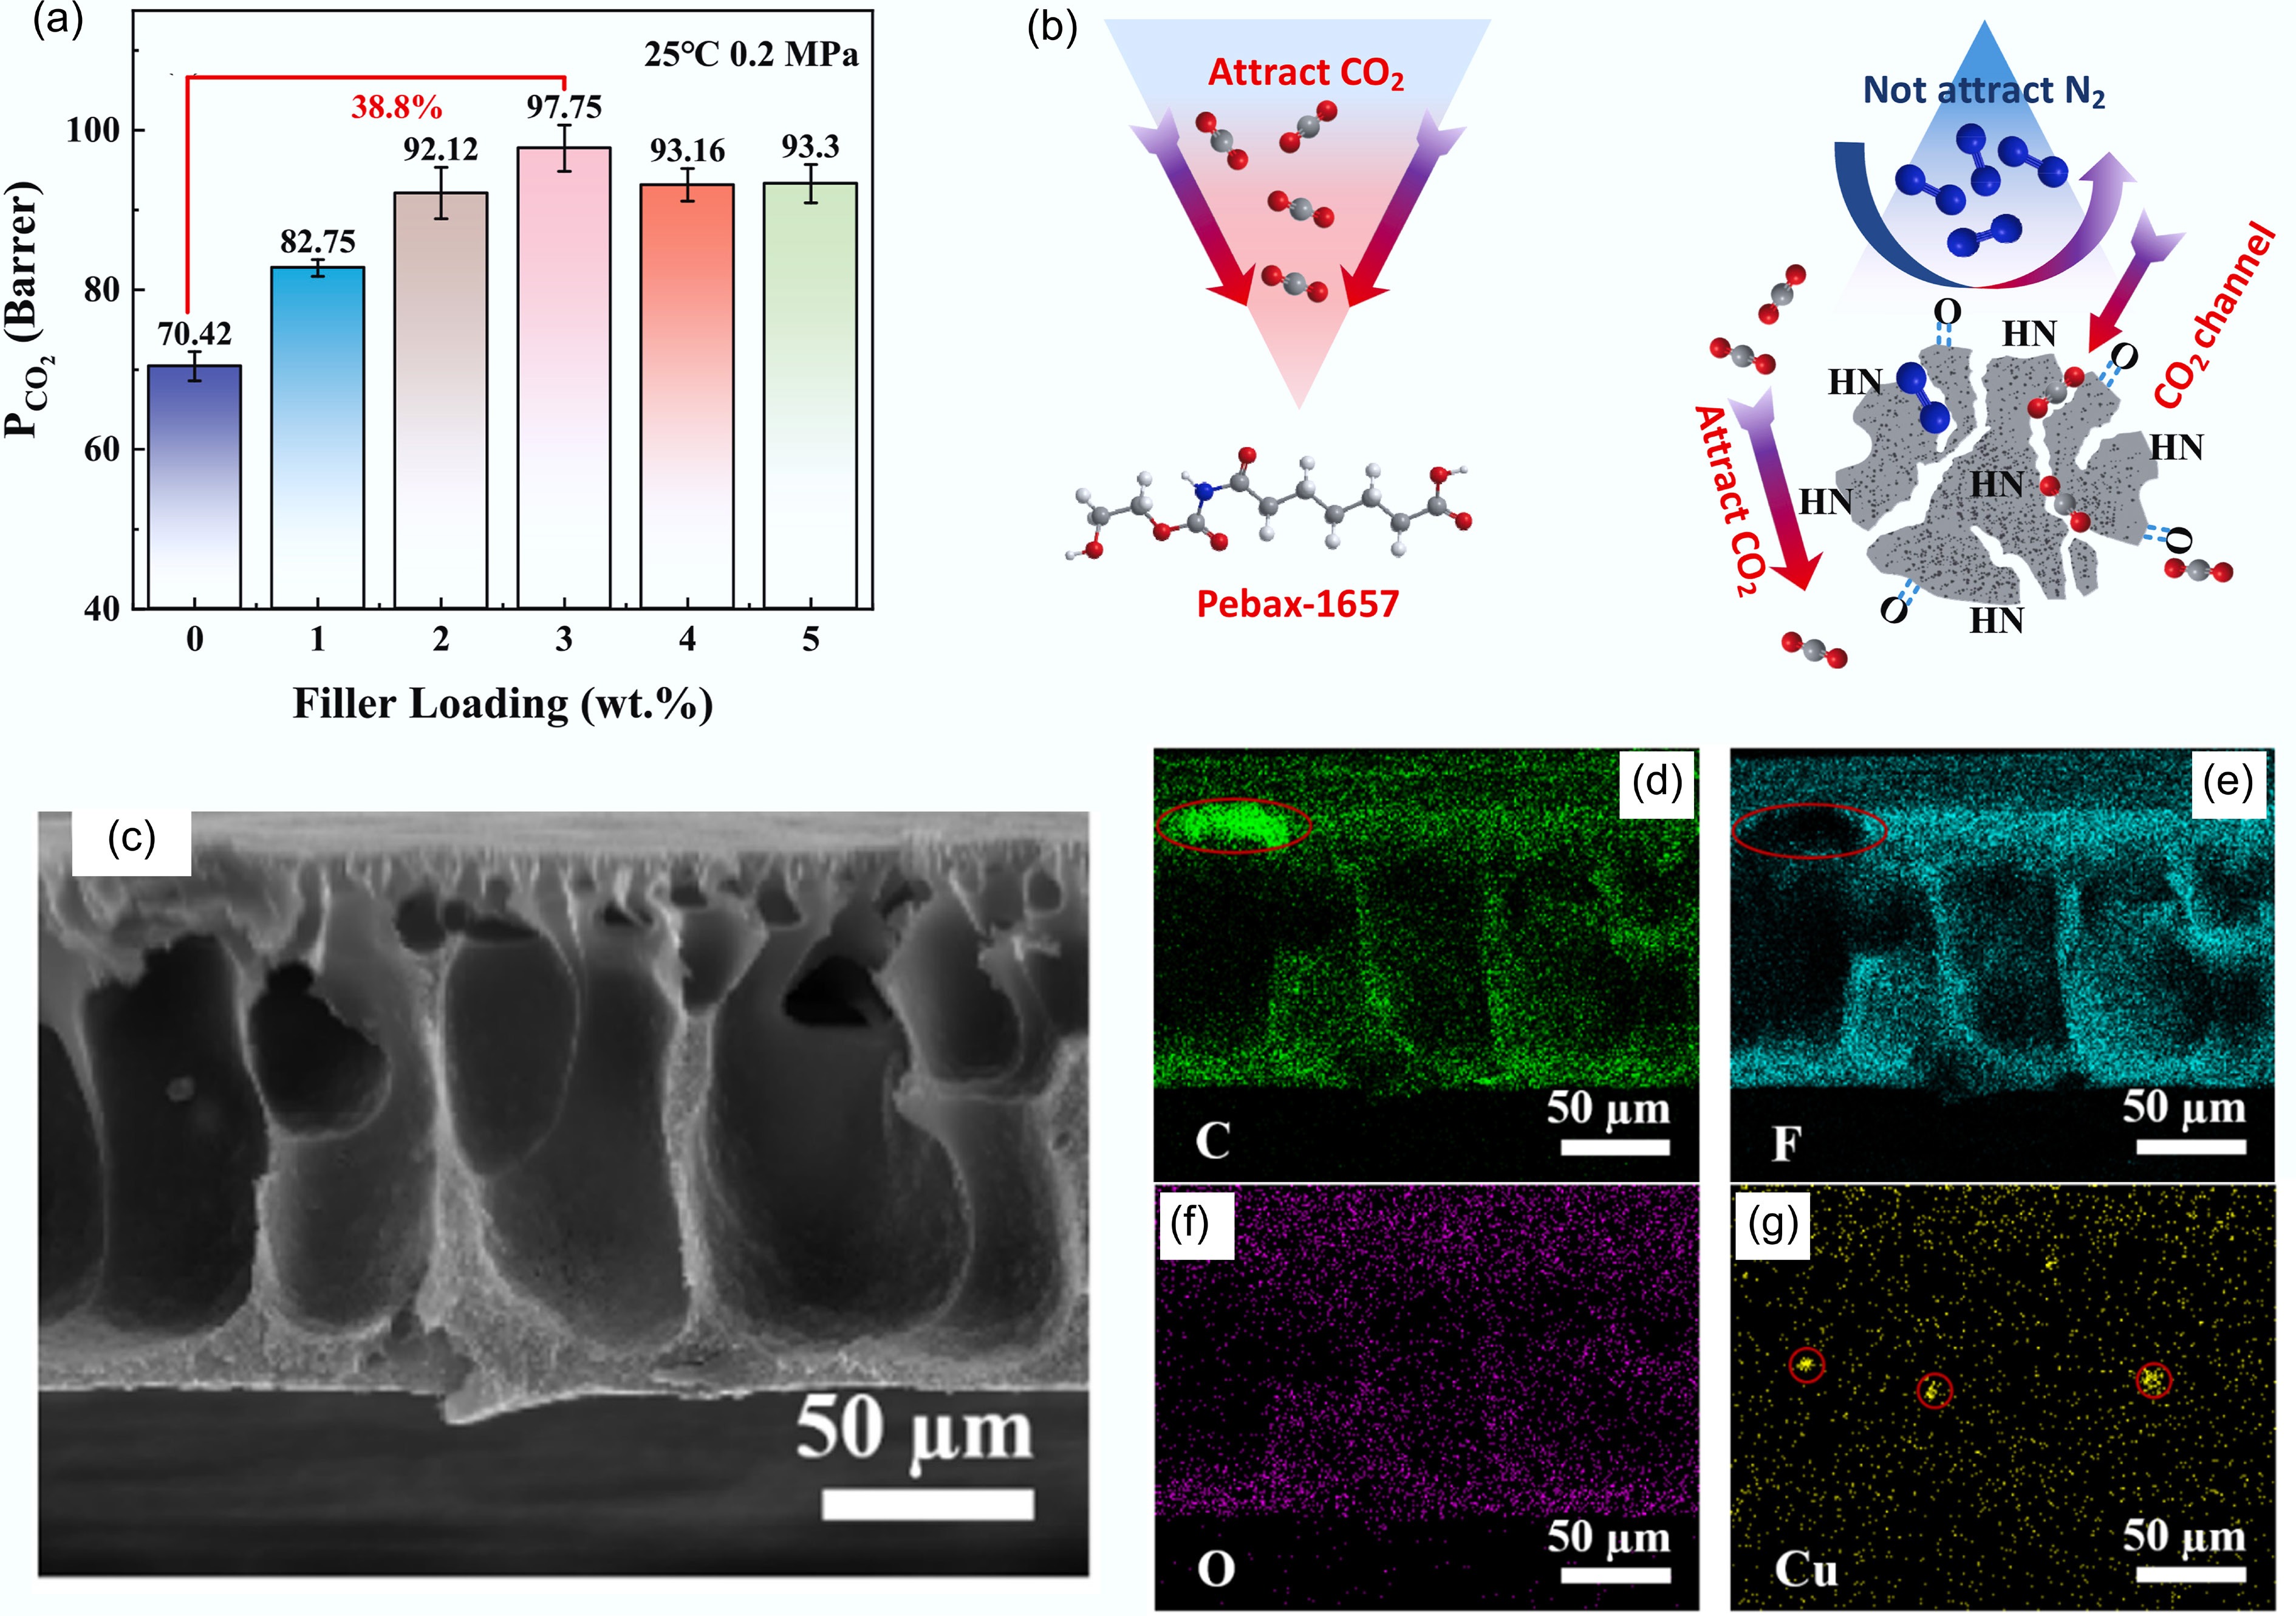
Figure 13.
The role of biochar in membrane modification. Gas separation performance of mixed matrix membranes fabricated from hydrogen peroxide-modified ball-milled biochar. (a) CO2 permeability. (b) Schematic diagram of MMMs separation mechanism[124]. (c)–(g) EDAX mapping images of PVDF-1 membrane in the cross-section direction, and the complementary regions in the mapping images of C and F elements are associated with the introduced biochar particle[125].
-
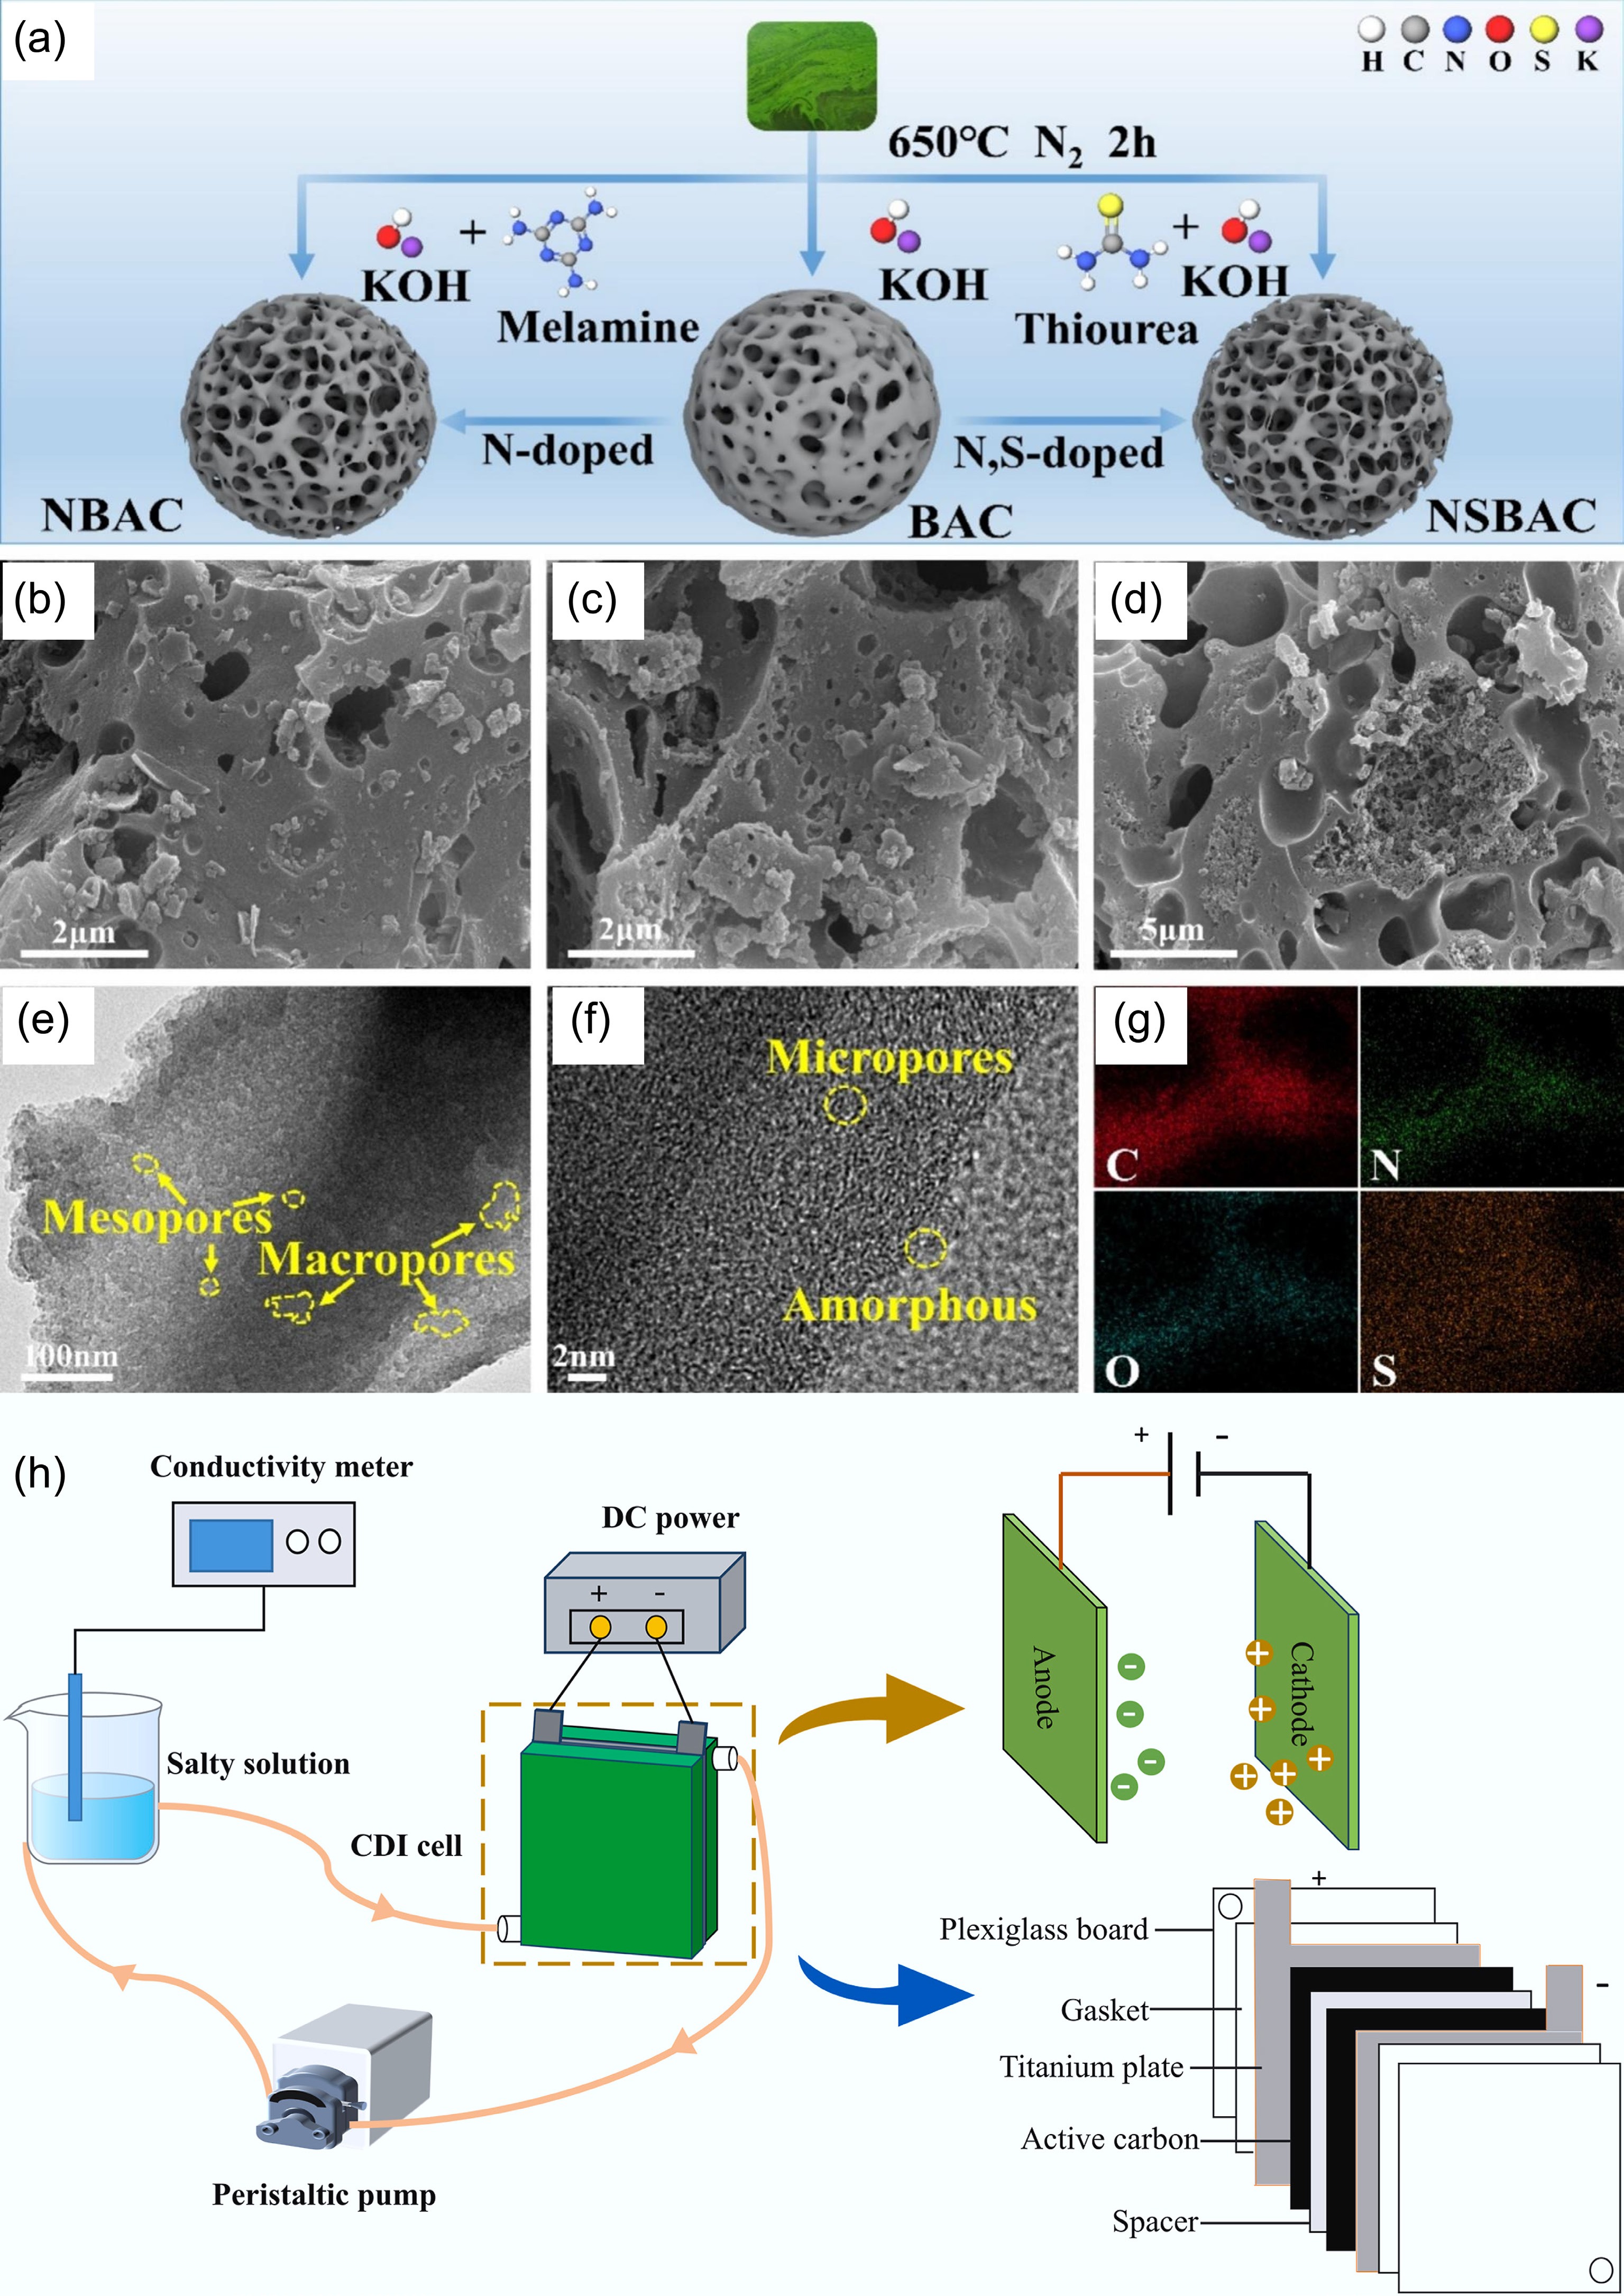
Figure 14.
The role of biochar in capacitive deionization. (a) Preparation process of BAC, NBAC, and nitrogen and sulfur co-doped blue algae-derived activated carbon (NSBAC), SEM images of (b) NBAC, (c) BAC, (d) NSBAC, (e) TEM, and (f) HRTEM images of the NSBAC, (g) EDS mappings of NSBAC[131]. (h) Electrosorption process flow diagram[132].
-
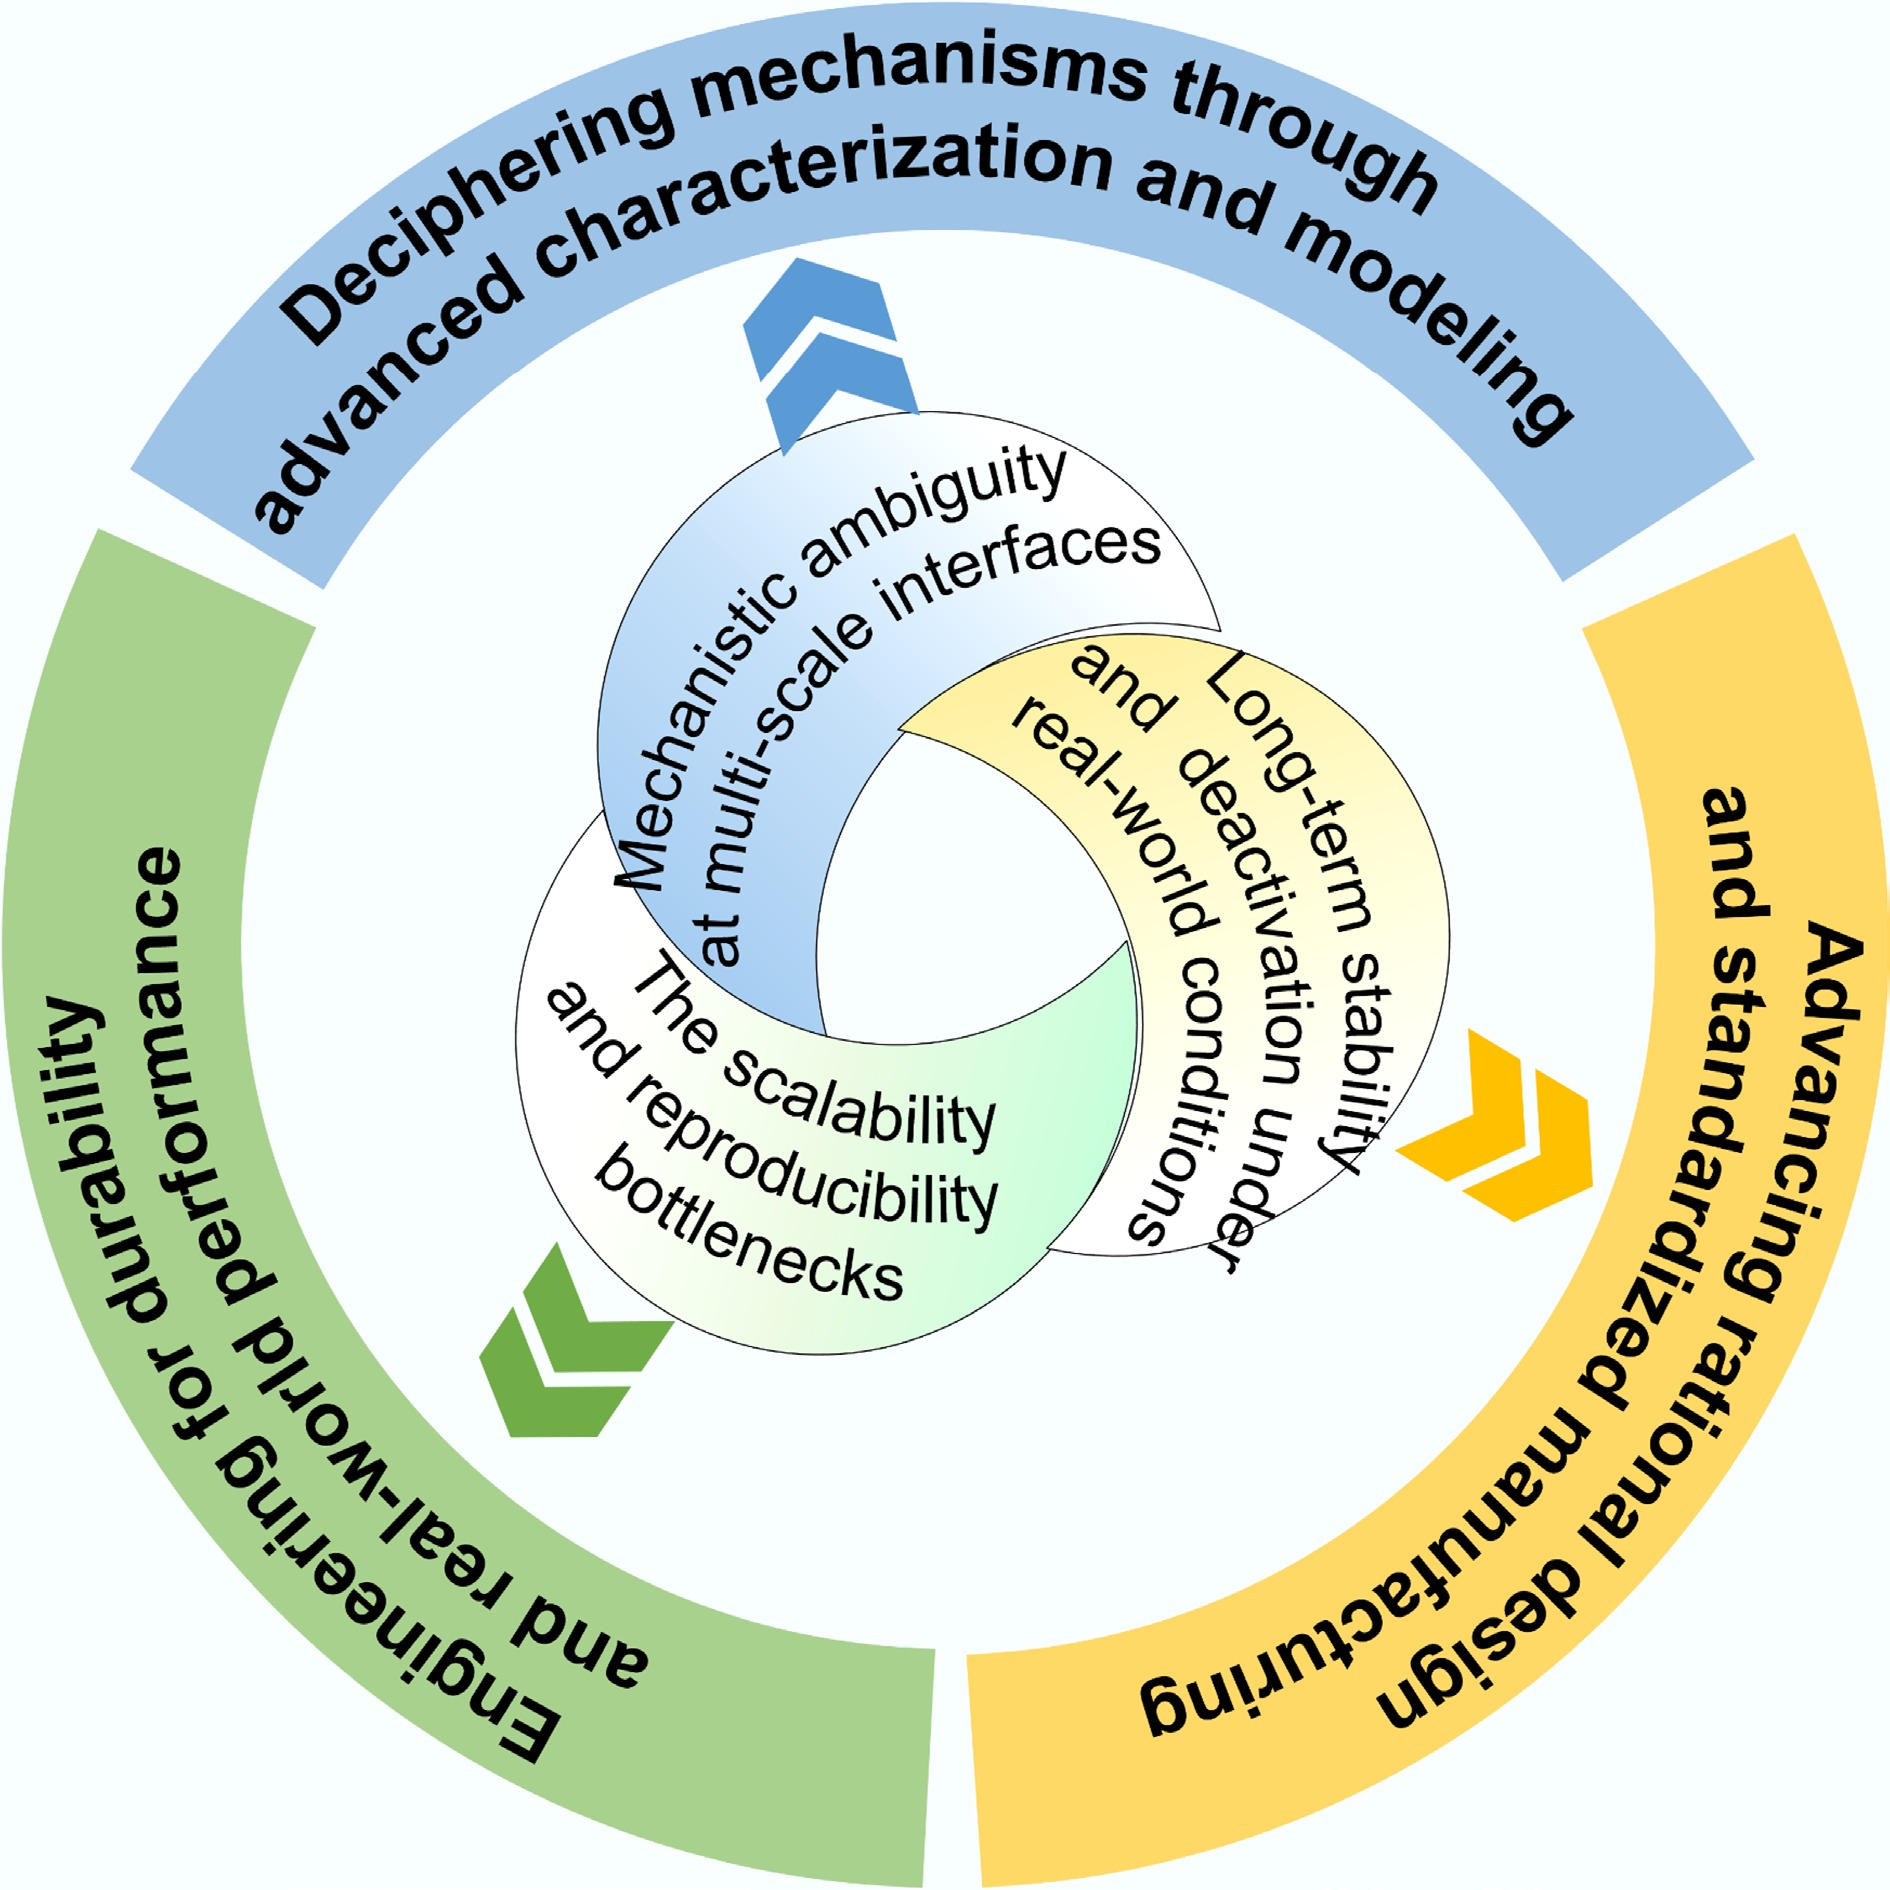
Figure 15.
Outlooks: challenges and solutions on the path from laboratory promise to widespread technological deployment.
-
Biochar precursor Modifier Pyrolysis temperature Adsorption mechanism Adsorption
performanceRef. Bamboo charcoal ZnCl2, H3PO4, or KOH 823 K Porous structure–controlled physisorption 2.35 mmol/g (298 K) [74] Celery None 923 K Porous structure–controlled physisorption
and chemical adsorption4.2 mmol/g (298 K) [85] Walnut shells FeCl3·6H2O, and Mg(NO3)2·6H2O + TEPA 873 K Porous structure–controlled physisorption
and chemical adsorption3.31 mmol/g (273 K) [78] Wheat straw KOH + Na2CO3, MgCl2·6H2O and NaOH 973 K Porous structure–controlled physisorption
and chemical adsorption6.65 mmol/g (273 K) [86] Albizia procera leaves NaHCO3 973 K Porous structure–controlled physisorption
and chemical adsorption2.54 mmol/g (273 K) [87] Pine saw dust None 823 K Porous structure–controlled physisorption 1.67 mmol/g (298 K) [88] Bagasse and hickory
chipsNH4OH 873 K Porous structure–controlled physisorption
and chemical adsorption1.18 mmol/g (298 K) [89] Cotton stalk NH3·H2O 1,073 K Mainly chemical adsorption 2.25 mmol/g (293 K) [90] Vine shoot KOH 873 K Porous structure–controlled physisorption 2.44 mmol/g (273 K) [91] Coffee ground MgO 873 K Porous structure–controlled physisorption
and chemical adsorption1.57 mmol/g (298 K) [92] Black locust KOH + ammonia solution 923 K Porous structure–controlled physisorption
and chemical adsorption5.05 mmol/g (298 K) [93] Celtuce leaves KOH 873 K Porous structure–controlled physisorption 5.05 mmol/g (273 K) [94] Coconut shells Nitrogen-doped + KOH 773 K Porous structure–controlled physisorption
and chemical adsorption4.8 mmol/g (298 K) [95] Jujun grass KOH 973 K Porous structure–controlled physisorption 5.0 mmol/g (298 K) [96] Pine nut shell KOH 773 k Porous structure–controlled physisorption 7.7 mmol/g (273 K) [97] Table 1.
Performance and optimal conditions of biochar for adsorbing carbon dioxide
-
Biochar procursor Modifier Pyrolysis temperature Application field Performance Ref Coffee grounds None 1,023 K As electrode materials for MCDI for the selective removal and recovery of lithium ions (Li) from synthetic wastewater The highest lithium recovery of 46.9 mg/g [133] Palm leaflets NaOH 973 K As AC electrodes in CDI system for removing and degrading the salt ions
and methylene blue (MB) organic dye molecules.The maximum salt adsorption capacity achieved 5.38 mg/g for 100 ppm of NaCl solution and 85% of degradation was achieved within
130 min of process duration.[134] Peanut shells KOH 873 K As electrodes in CDI system for seawater desalination The salt adsorption capacity achieved
22.40 mg/g (at 1.2 V and 500 mg/L NaCl), exhibiting an average salt adsorption rate
of 14.93 mg/g/min[135] Coffee grounds KOH 1,023 K As activated-WCG electrodes for capacitive deionization The electrosorption capacity reached 12.50 and 16.50 mg /g in NaCl solution at cell voltages of 1.2 and 1.4 V [136] Coffee grounds KOH 1,023 K As electrode materials for membrane capacitive deionization The specific capacitance reached 108 F/g at a scan rate of 10 mV/s within a potential window of −0.6 to 0.4 V [137] Shrimp shell None 1073 K As membrane capacitive deionization electrodes for electrochemical desalination The desalination capacity reached 10.8 mg/g [138] Cyanobacteria-nitrogen-fixing algae Thiourea and KOH 923 K As capacitive deionization electrodes for the removal of heavy metal ions such as lead (Pb2+) from aqueous solutions The specific capacitance of 270.69 F/g at a current density of 0.5 A/g and in the CDI system Pb2+ adsorption capacity reached 30.42 mg/g (1.2 V, 100 mg/L) [131] Rice straw K2FeO4 1,073 K As electrodes in CDI system for desalination The salt adsorption capacity reached 15.44 mg/g in a 500 mg/L NaCl solution at 1.2 V voltage [139] Longan shells Phosphoric acid + melamine 873 K As electrodes in CDI system for removing the prevalence of norfloxacin (NOR) The maximum adsorption capacity reached
14.9 mg/g[140] Chestnut inner
shellDicyandiamide + KOH + H2SO4 873 K As electrodes in CDI system for removing Zn2+ ions from industrial wastewater The adsorption of Zn2+ reached 706.4 μmol/g at 1.0 V and the selectivity factor reached 14.9 against Na [138] Black locust biochar MgO 673 K As flow electrodes for the removal of NH4+ from water through FCDI The capacitance reached 238 F/g and attained an average removal rate of 17.3 mg/m2/min [141] Ginkgo biloba leaves Baking soda 1,073 K As (M)CDI dechlorination electrode The dechlorination capacity reached 14.35CDI and 20.60MCDI mg/g at an applied voltage of 1.2 V [142] Food waste biogas residue Tobacco stalk + KOH 1,073 K As electrodes in CDI system for
removing Cu2+The removal capacity of ABTC800 electrode can be up to 171.26 mg/g at 3 h in 50 mg/L Cu2+ solution at a voltage of 0.8 V [143] Hermetia illucens pupae casings KOH 773 K As electrodes in CDI system for removing Cd2+ from water The cadmium removal efficiency was 91 % and electro-sorption capacity was 10.9 mg/g [144] Casuarina leaves A novel organic potassium salt PIPES-K2 773 k As electrodes in asymmetric CDI in the treatment of electroplating wastewater The adsorption capacity reached 36.86 mg/g [145] Table 2.
Performance and optimal conditions of biochar for capacitive deionization
Figures
(15)
Tables
(2)