-
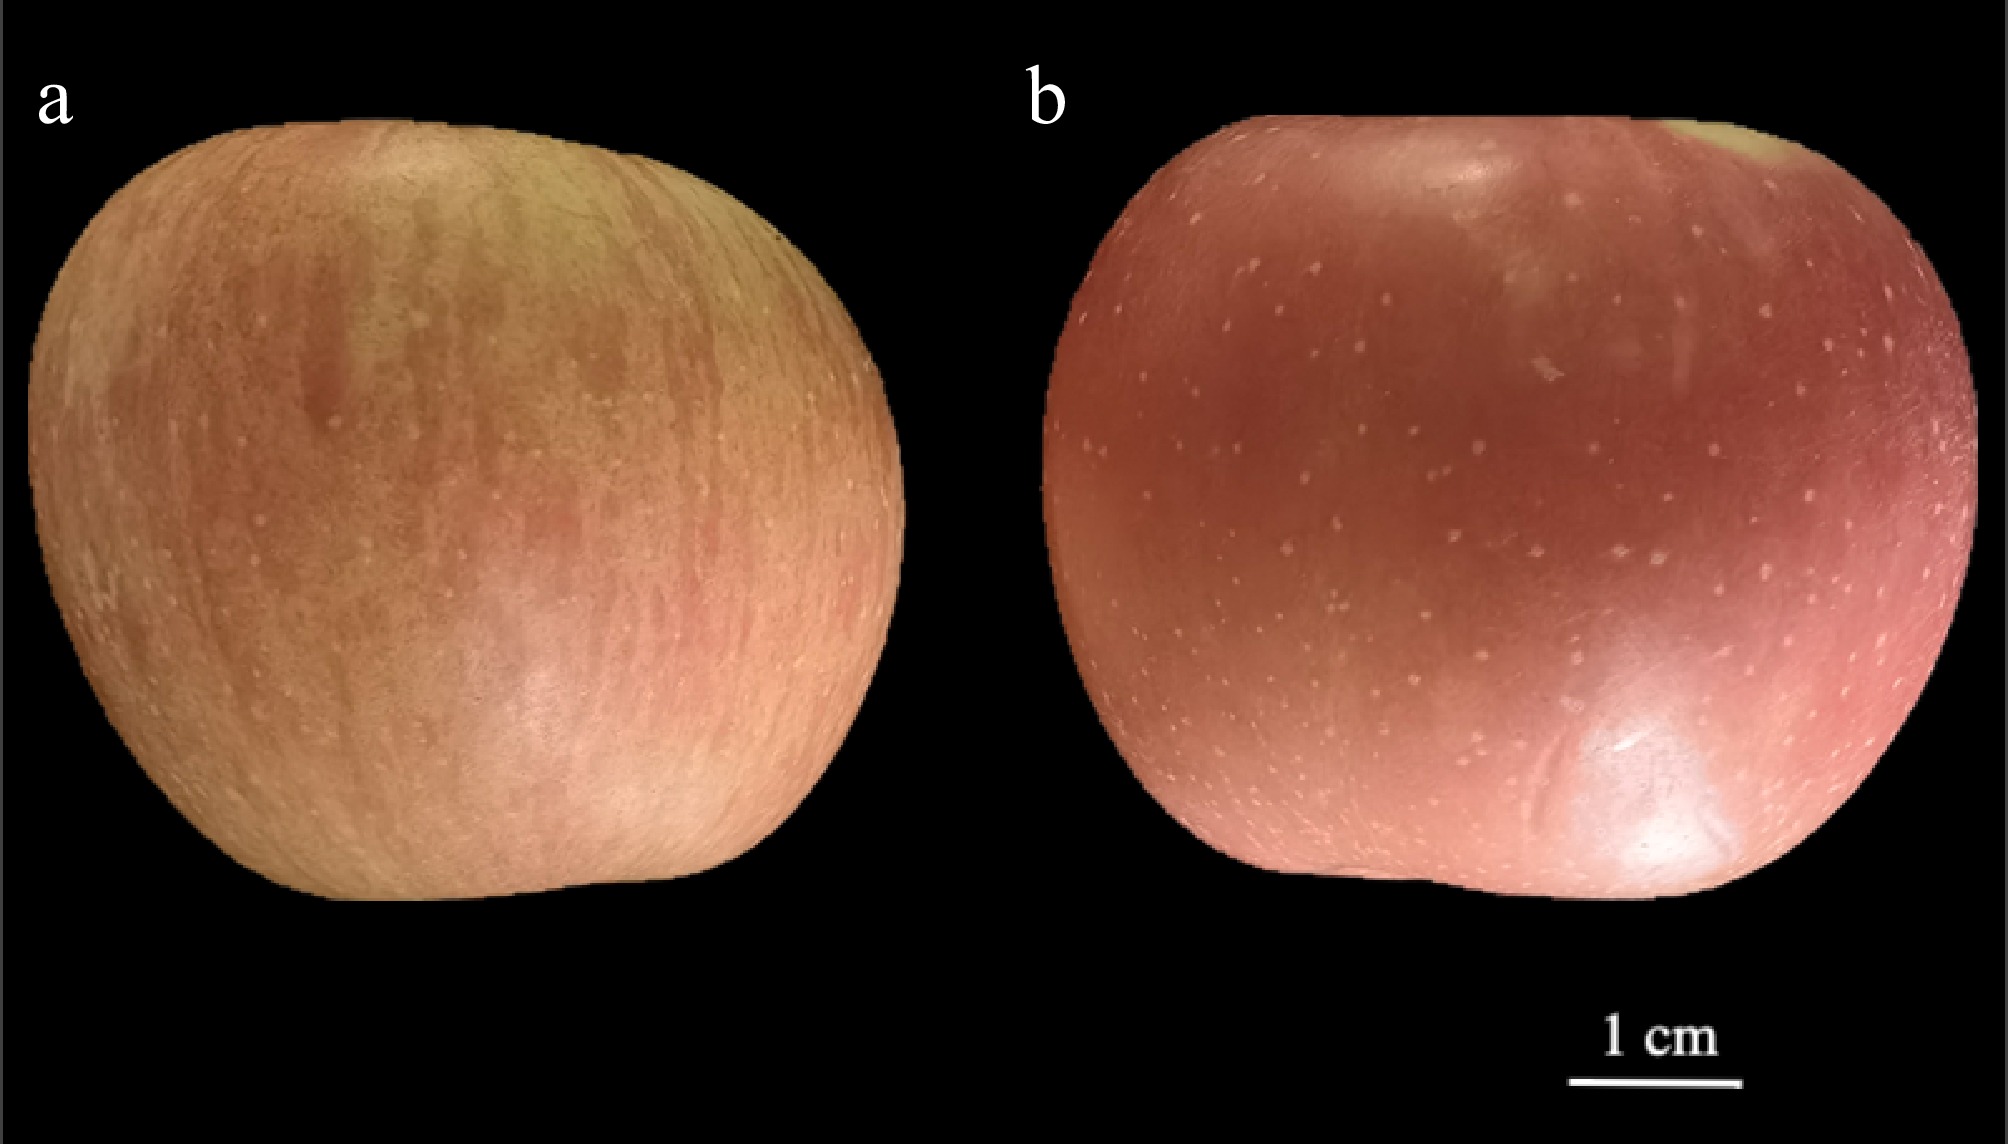
Figure 1.
Peel morphology of (a) mutant, and (b) cultivar-type apples. Scale bar = 1 cm.
-
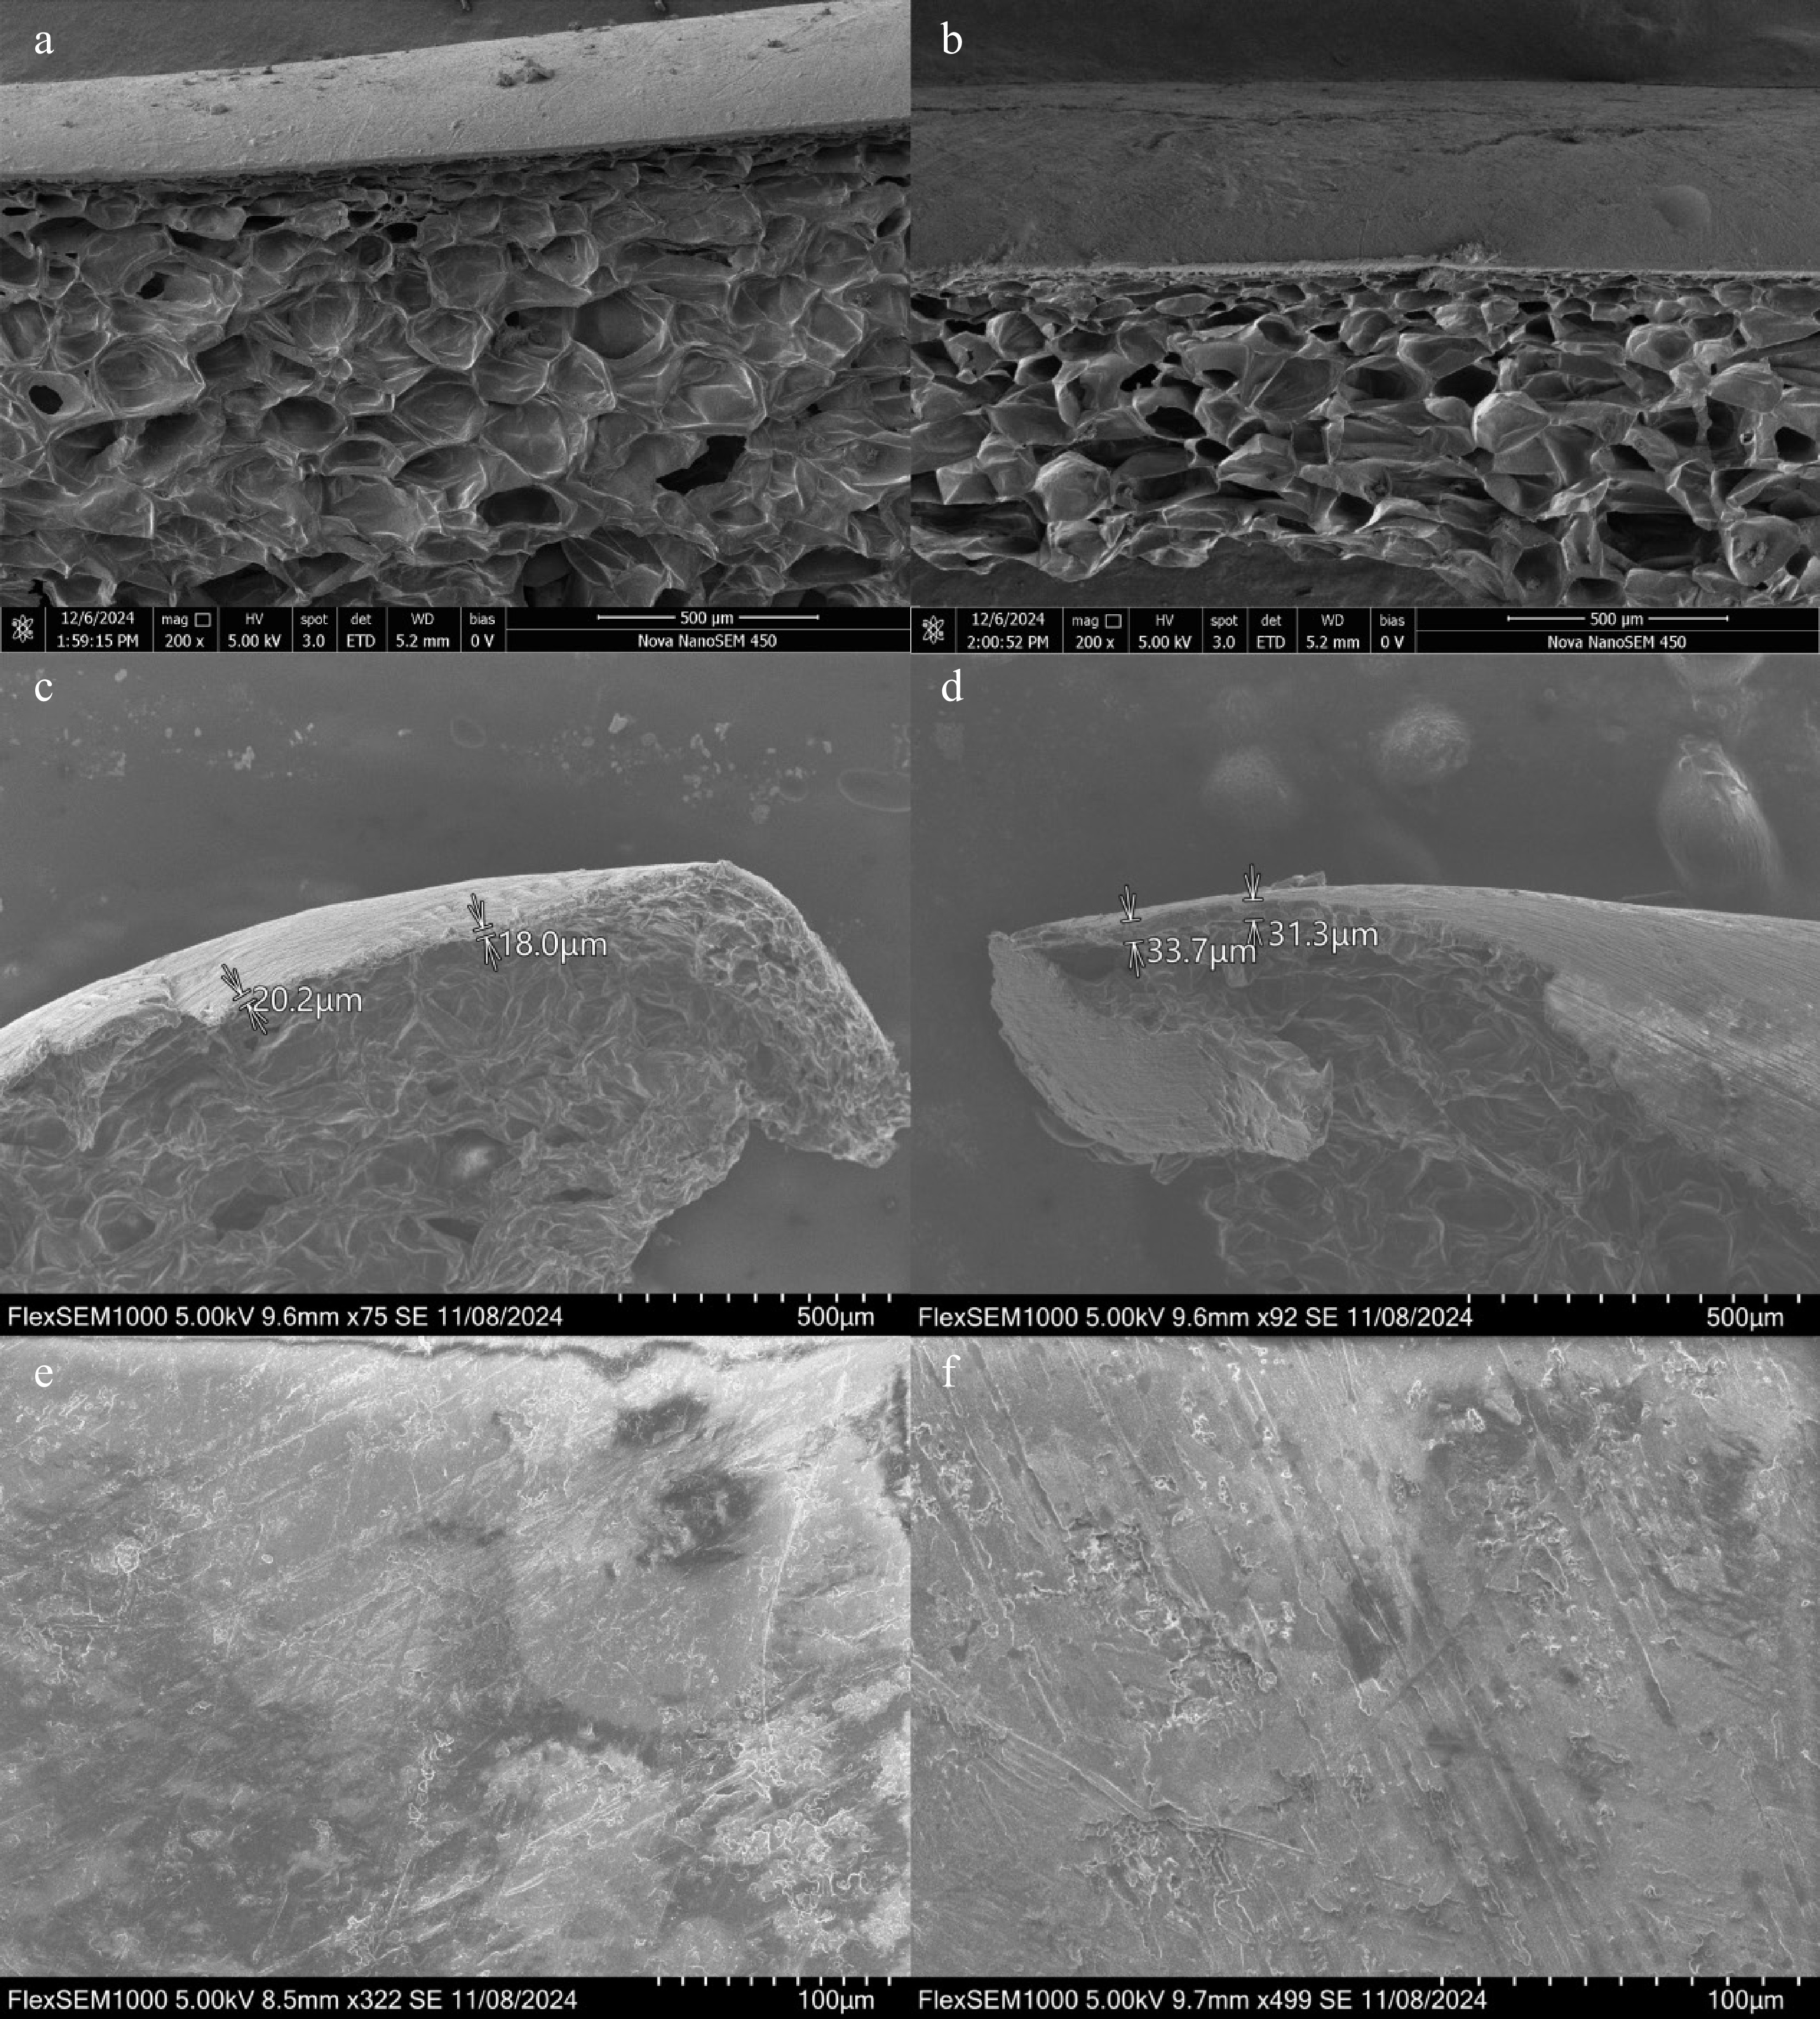
Figure 2.
Scanning electron microscopy (SEM) analysis of peel microstructure in mutant and cultivar apples. (a), (c), (e) SEM images of the mutant apple peel, showing both cross-sectional and surface structures at varying magnifications. The mutant type exhibits a thinner epidermal layer with a relatively smooth cuticle and less densely packed cell layers. (b), (d), (f) SEM images of the cultivar apple peel, revealing a thicker epidermal region with more compact cell layers and a more complex cuticular surface. The cultivar peel shows more prominent ridges and cuticle folds compared to the mutant type. Scale bars are indicated in each panel.
-
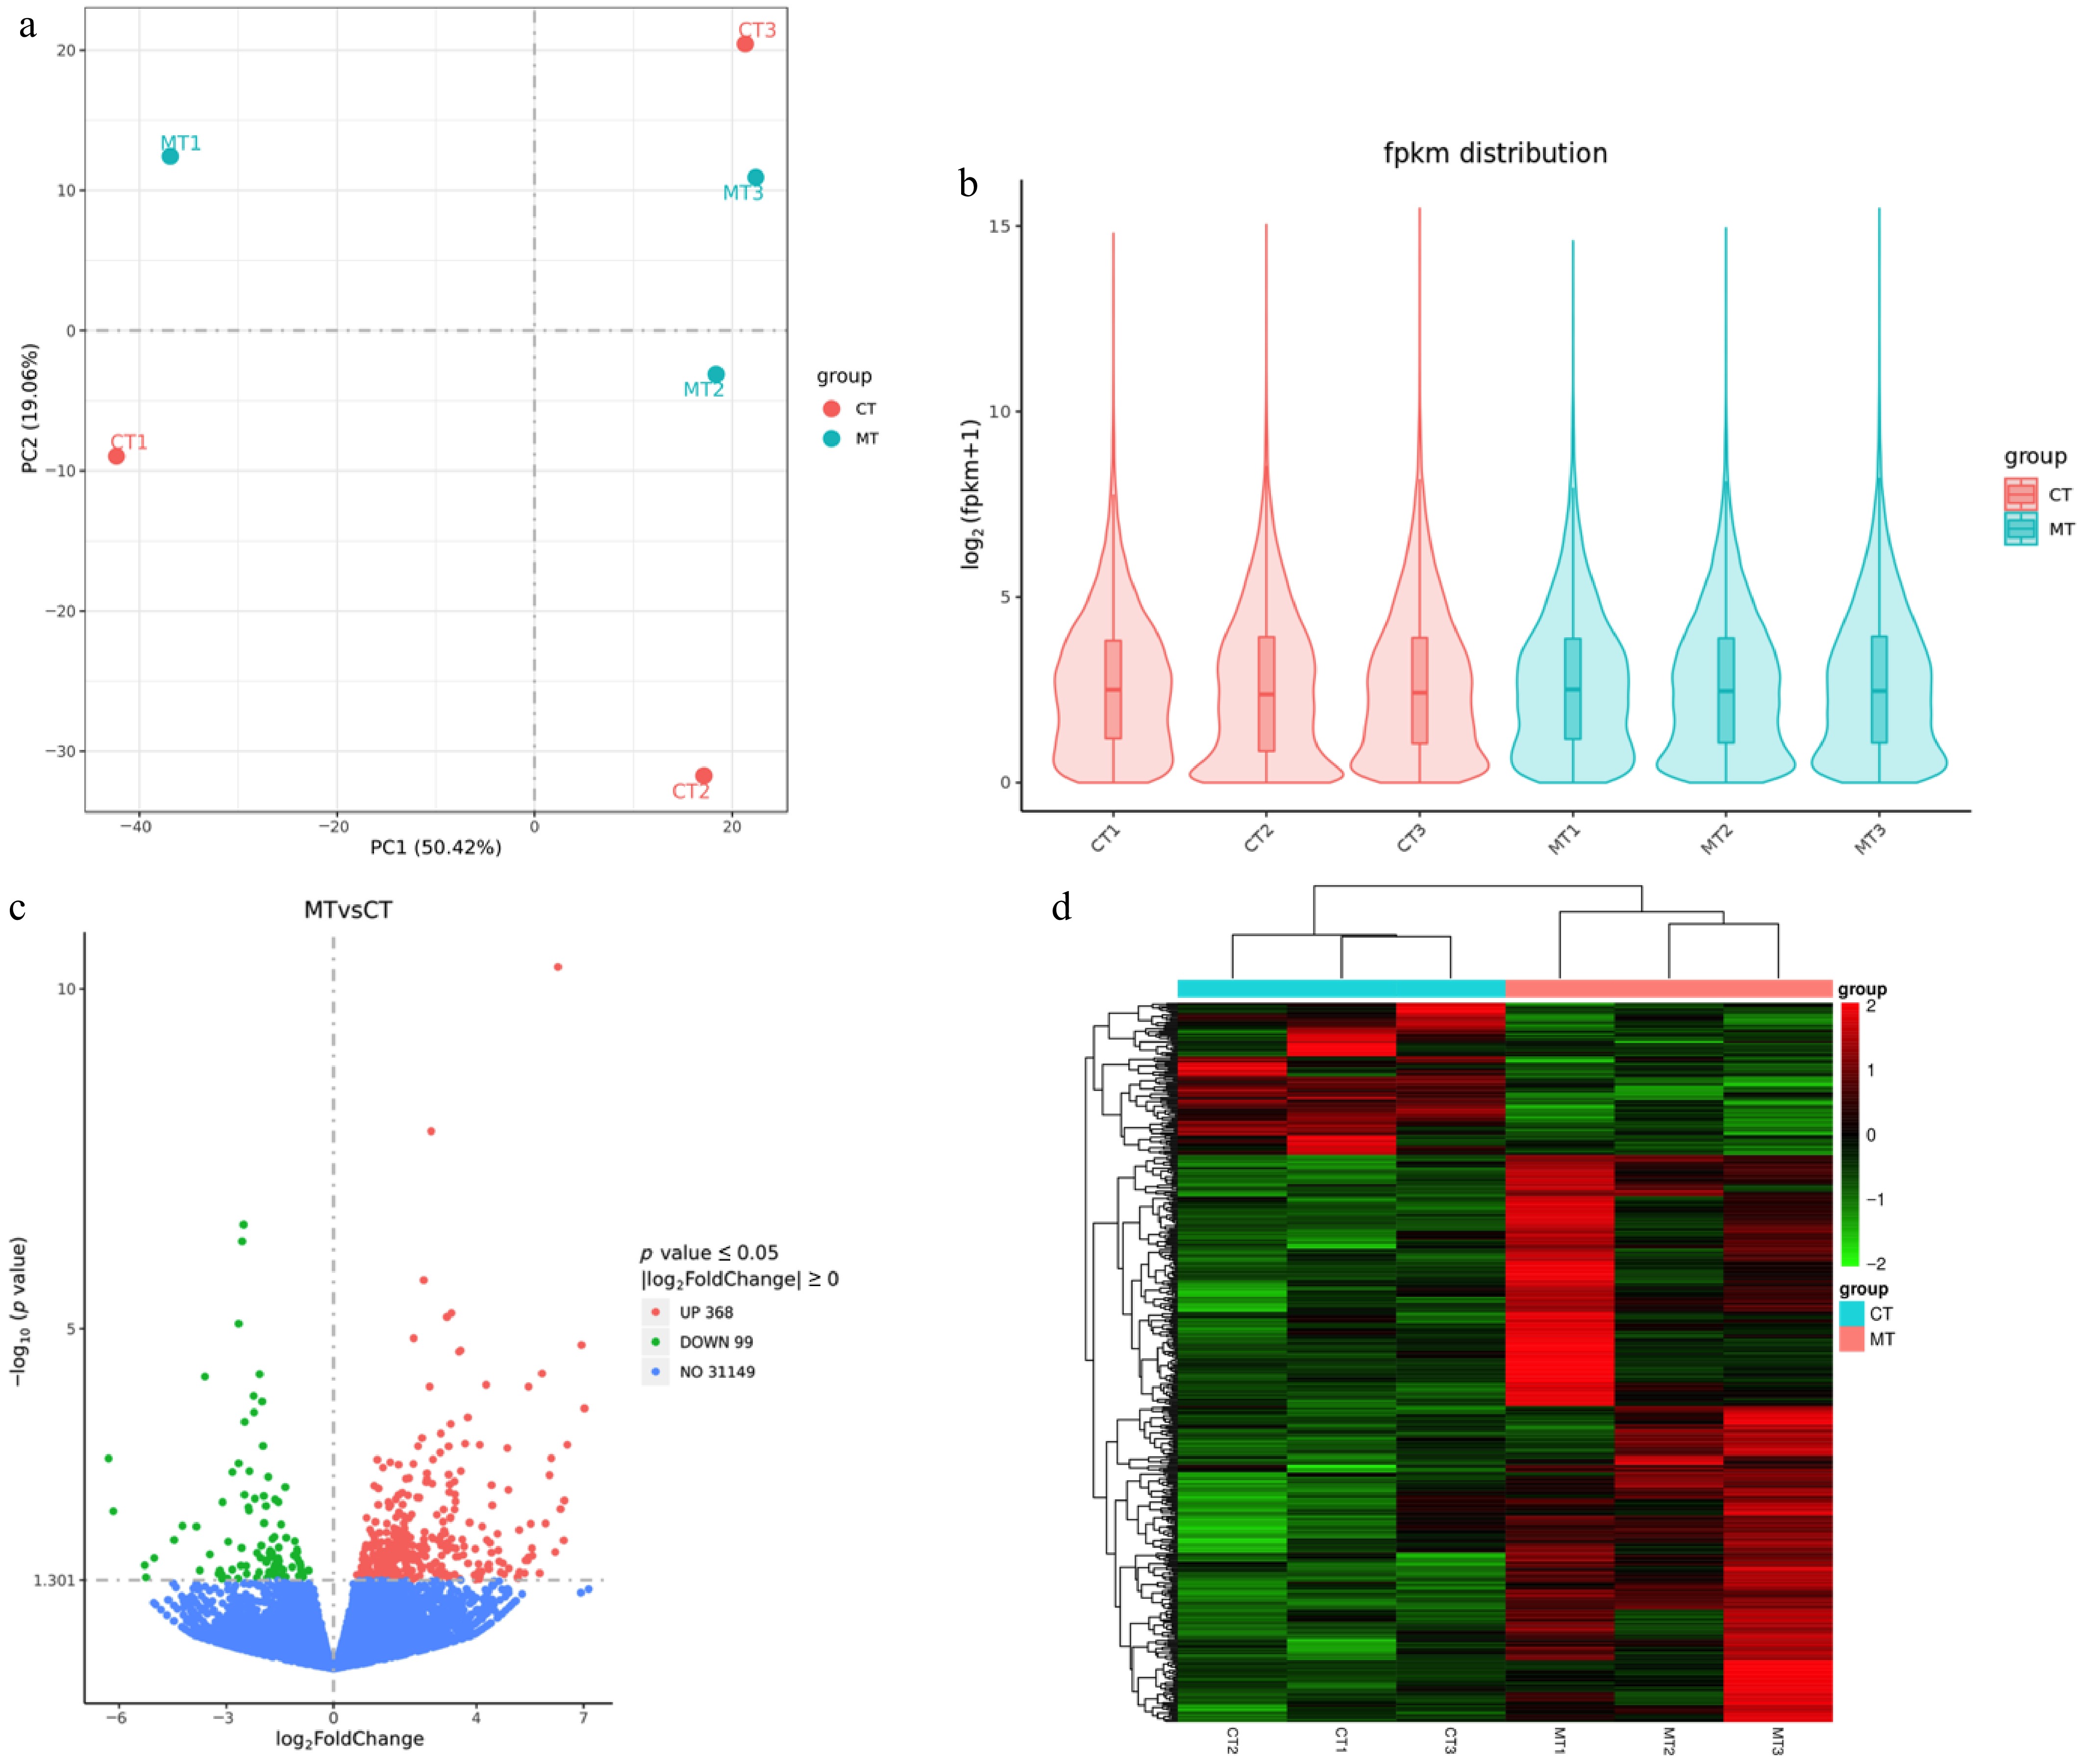
Figure 3.
Transcriptomic analysis of mutant-type (MT) and cultivated-type (CT) apple peels. (a) Principal component analysis (PCA) showing distinct clustering of MT and CT samples. (b) Violin plots displaying the distribution of fragments per kilobase of transcript per million mapped fragments (FPKM) values across all samples. (c) Volcano plot of differentially expressed genes (DEGs) between MT and CT groups. Red represents upregulated, green represents downregulated, and blue represents non-significant genes. (d) Heatmap of the DEGs, showing hierarchical clustering of expression profiles. Red indicates high expression, and green indicates low expression.
-
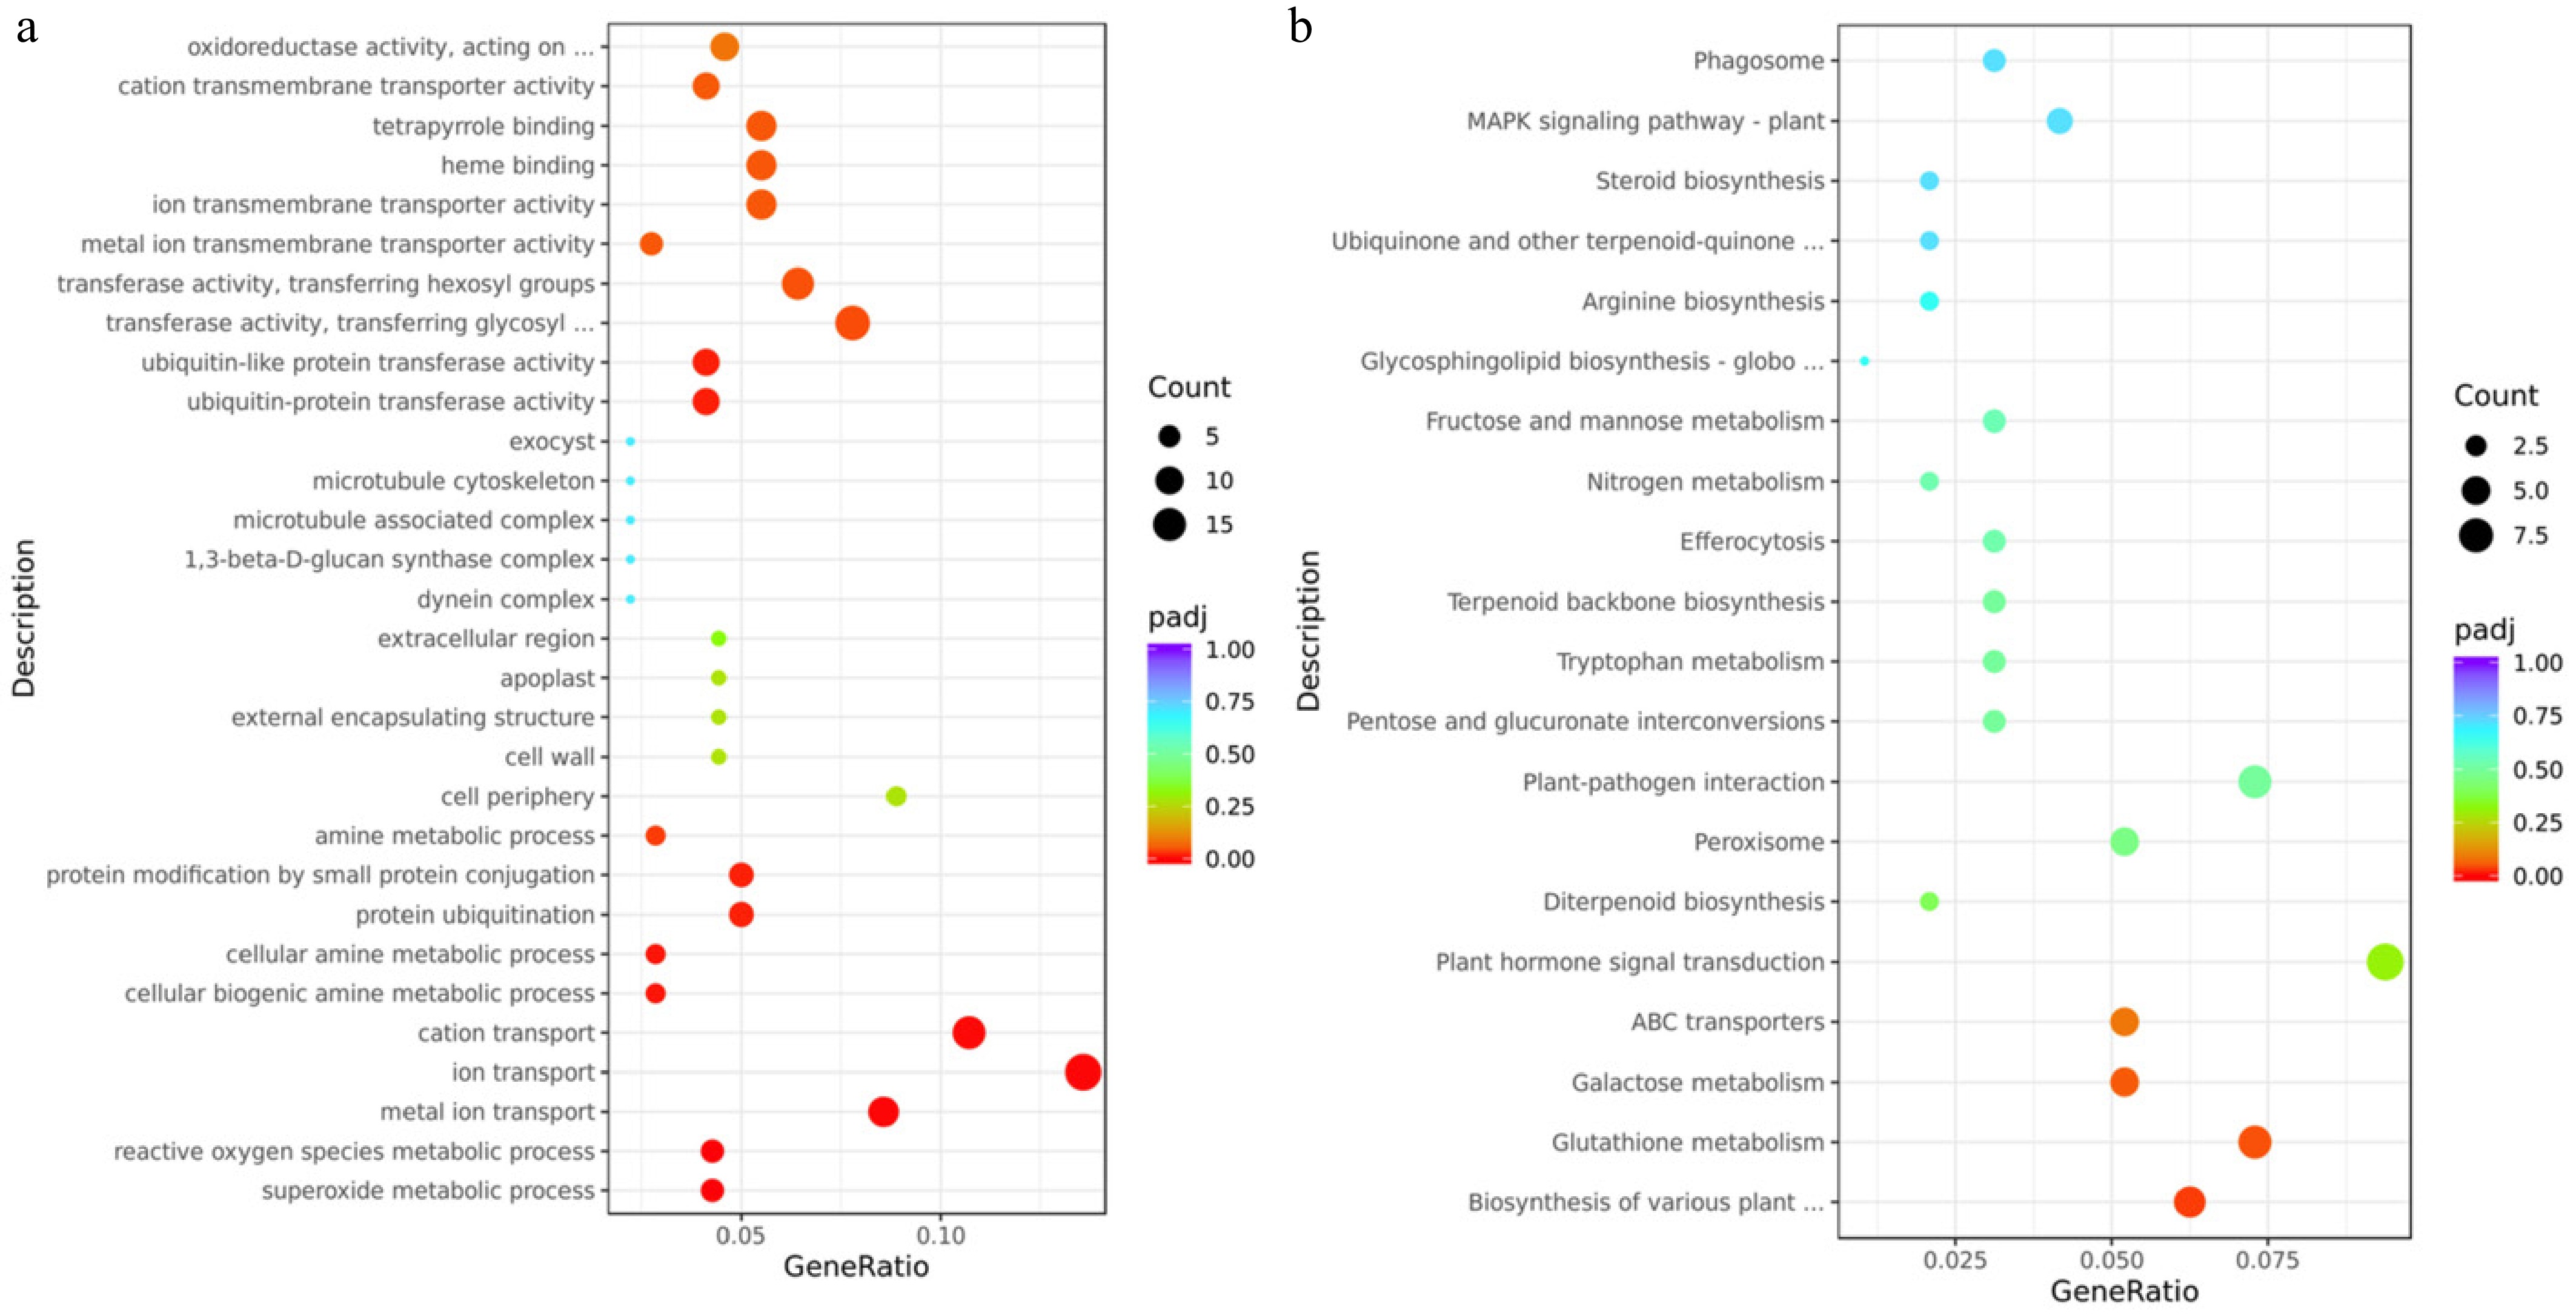
Figure 4.
Transcriptomic analysis of mutant-type (MT) and cultivated-type (CT) apple peels. (a) Gene Ontology (GO) enrichment analysis, and (b) Kyoto Encyclopedia of Genes and Genomes (KEGG) pathway enrichment analysis of differentially expressed genes (DEGs) between MT and CT peels. The vertical axis displays the names of enriched GO terms or KEGG pathways. The size of each dot represents the number of DEGs involved in the corresponding term or pathway (rich factor), while the color indicates the adjusted p-value (padj).
-
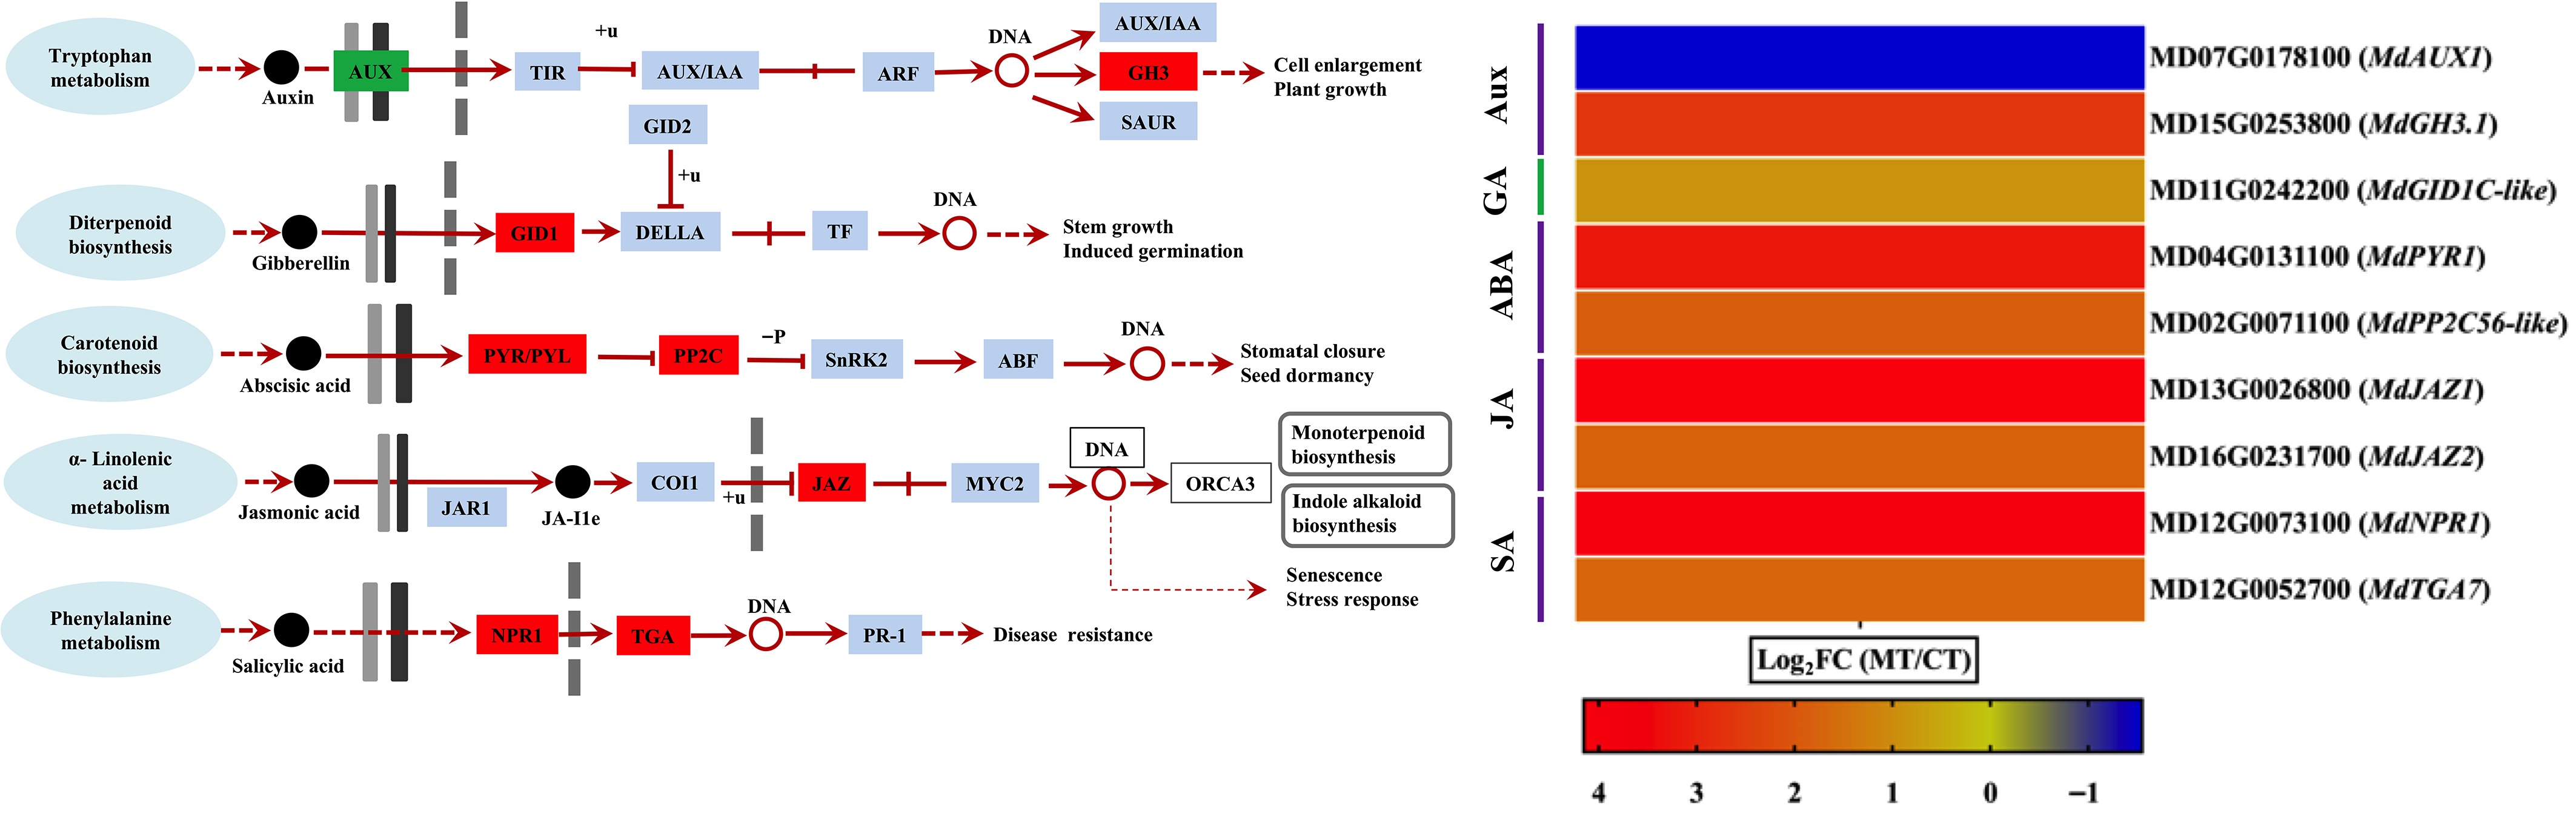
Figure 5.
Differential expression of hormone signaling-related genes in mutant-type (MT), and cultivated-type (CT) apple peels. The heatmap shows selected differentially expressed genes (DEGs) involved in major plant hormone signaling pathways, including auxin (AUX), gibberellin (GA), abscisic acid (ABA), jasmonic acid (JA), and salicylic acid (SA). Genes related to hormone receptors and downstream response regulators are included. Expression values are represented as log2 fold change (log2FC) between MT and CT. The color gradient indicates the relative expression level of each gene.
-
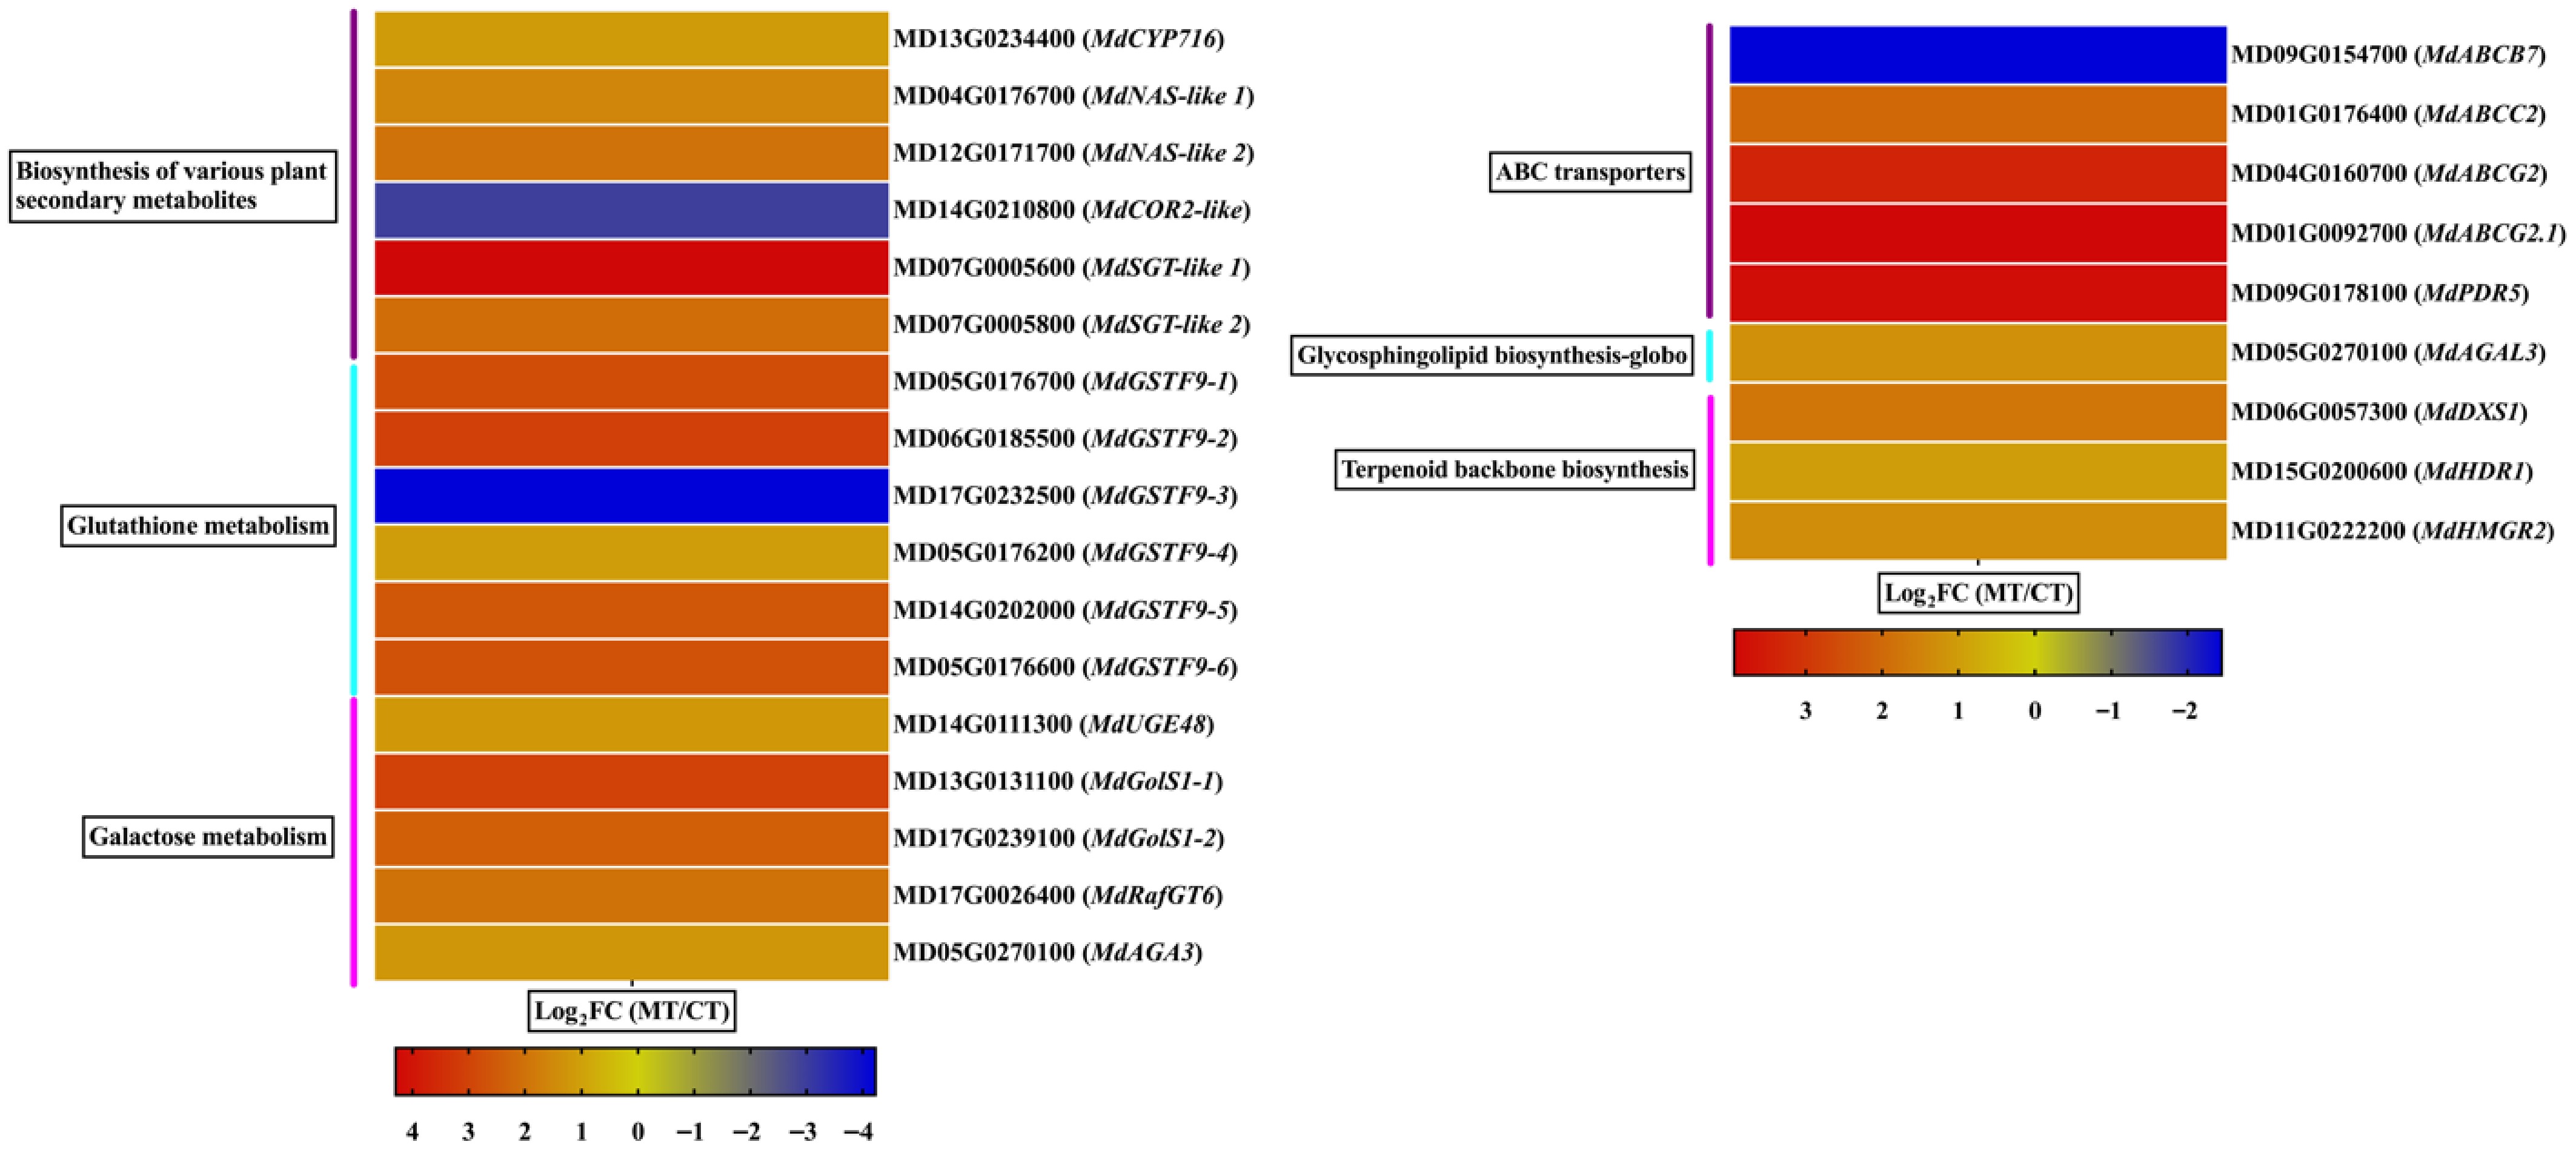
Figure 6.
Differential expression of genes involved in specialized metabolism and transport pathways in mutant-type (MT), and cultivated-type (CT) apple peels. The heatmap illustrates selected differentially expressed genes (DEGs) associated with key KEGG pathways, including the biosynthesis of various plant secondary metabolites, glutathione metabolism, galactose metabolism, ABC transporters, glycosphingolipid biosynthesis, and terpenoid backbone biosynthesis. Expression values are represented as log2 fold change (log2FC) between MT and CT. The color gradient indicates relative gene expression levels.
-
Investigated features Mutant type Cultivar type Fruit transverse and longitudinal diameters 1.12 ± 0.13 1.25 ± 0.09** Soluble solids content (%) 13.1 ± 0.6 12.7 ± 0.9 Firmness 3.46 ± 0.18 3.63 ± 0.22** Cellulose (%) 24.75 ± 0.25 25.05 ± 0.18** Acid-insoluble lignin (%) 21.20 ± 0.99 22.65 ± 0.49** Acid-soluble lignin (%) 1.90 ± 0.11 1.80 ± 0.08** Hemicellulose (%) 7.75 ± 0.07 7.80 ± 0.14** Data are mean ± SD (n = 24). ** Indicates a significant difference between genotypes at p < 0.01 (independent samples t-test). Table 1.
Physiological characteristics of mutant-type and cultivar-type apple peel.
-
Pathway description KEGG ID Total DEGs Up Down Plant hormone signal transduction mdm04075 9 8 1 Glutathione metabolism mdm00480 7 5 2 Plant-pathogen interaction mdm04626 7 6 1 Biosynthesis of various plant secondary metabolites mdm00999 6 5 1 Galactose metabolism mdm00052 5 5 0 ABC transporters mdm02010 5 4 1 Peroxisome mdm04146 5 1 4 Biosynthesis of cofactors mdm01240 5 4 1 MAPK signaling pathway−plant mdm04016 4 4 0 Carbon metabolism mdm01200 4 3 1 Pentose and glucuronate interconversions mdm00040 3 2 1 Tryptophan metabolism mdm00380 3 3 0 Terpenoid backbone biosynthesis mdm00900 3 3 0 Efferocytosis mdm04148 3 2 1 Fructose and mannose metabolism mdm00051 3 3 0 Phagosome mdm04145 3 2 1 Biosynthesis of nucleotide sugars mdm01250 3 3 0 Phenylpropanoid biosynthesis mdm00940 3 2 1 Pyruvate metabolism mdm00620 3 2 1 Amino sugar and nucleotide sugar metabolism mdm00520 3 3 0 Starch and sucrose metabolism mdm00500 3 3 0 Glycolysis/gluconeogenesis mdm00010 3 2 1 Endocytosis mdm04144 3 2 1 Biosynthesis of amino acids mdm01230 3 3 0 Diterpenoid biosynthesis mdm00904 2 2 0 Nitrogen metabolism mdm00910 2 2 0 Arginine biosynthesis mdm00220 2 2 0 Ubiquinone and other terpenoid-quinone biosynthesis mdm00130 2 1 1 Steroid biosynthesis mdm00100 2 2 0 Glycosphingolipid biosynthesis−globo and isoglobo series mdm00603 1 1 0 Total number of DEGs 110 90 20 Percentages of up and down genes 100% 81.90% 18.10% Table 2.
KEGG pathways are related to hormone signaling and intracellular activity.
Figures
(6)
Tables
(2)