-
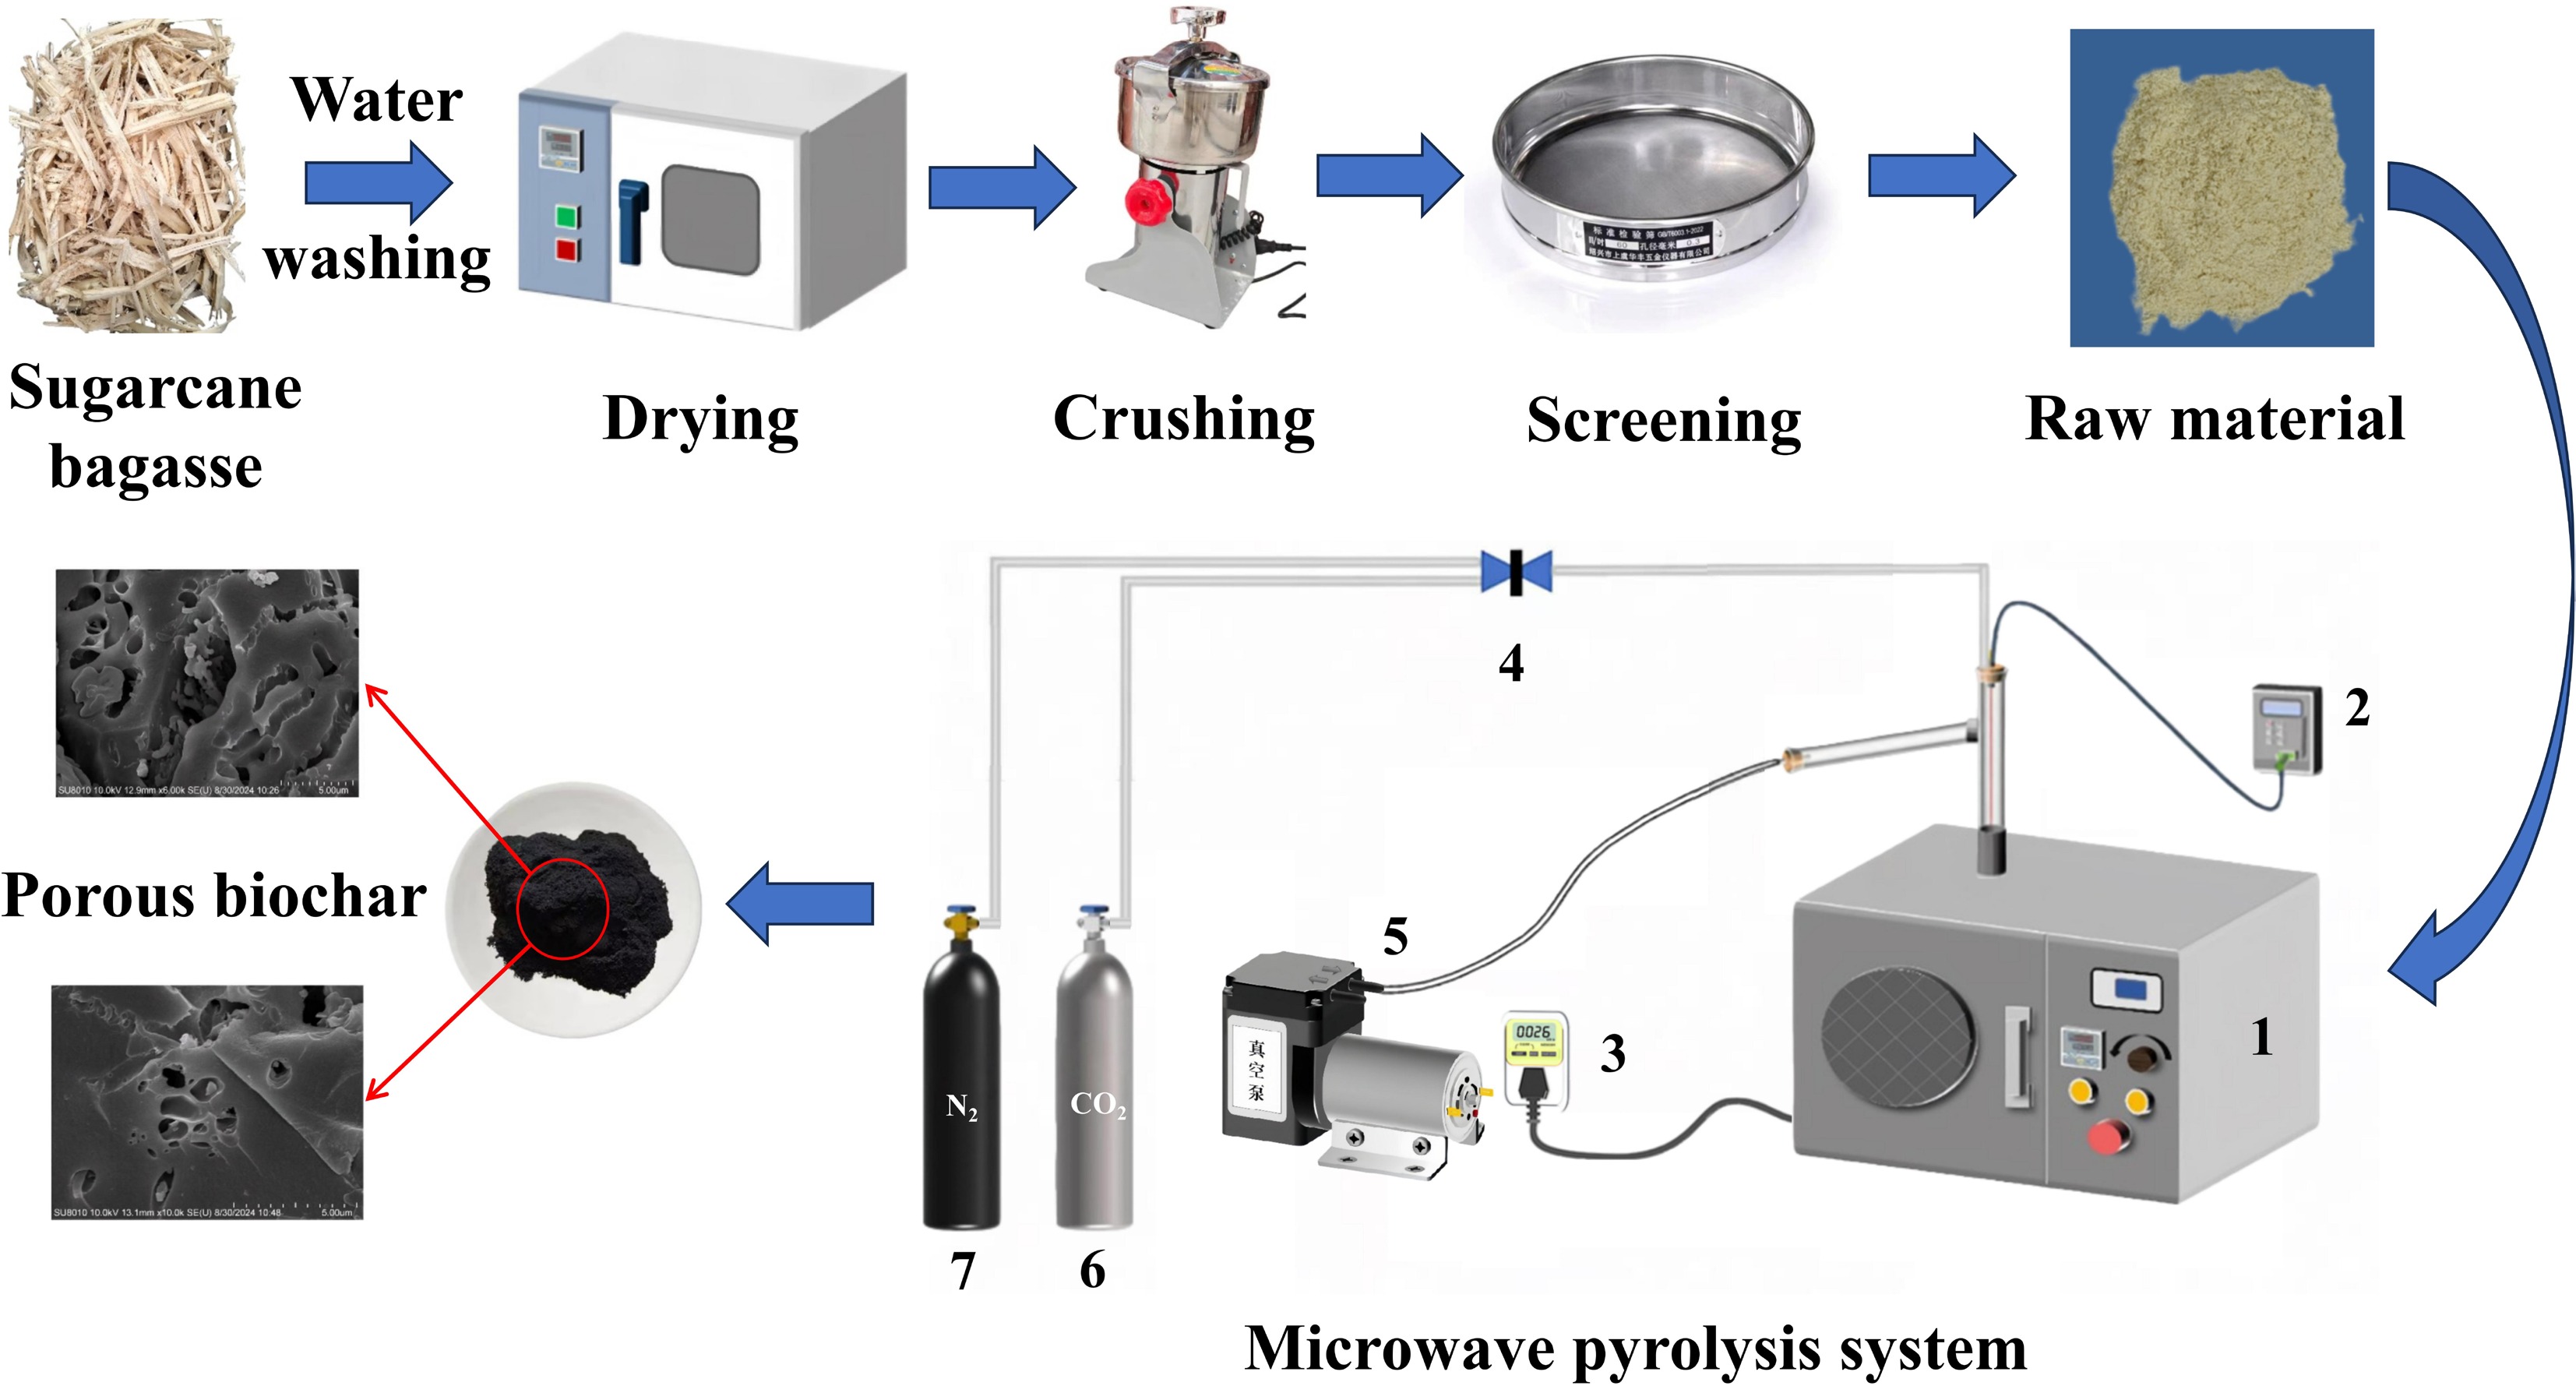
Figure 1.
Schematic diagram of experimental microwave-assisted pyrolysis system: (1) microwave oven, (2) thermocouple, (3) electric meter, (4) valve, (5) vacuum pump, (6) CO2, and (7) high purity nitrogen.
-
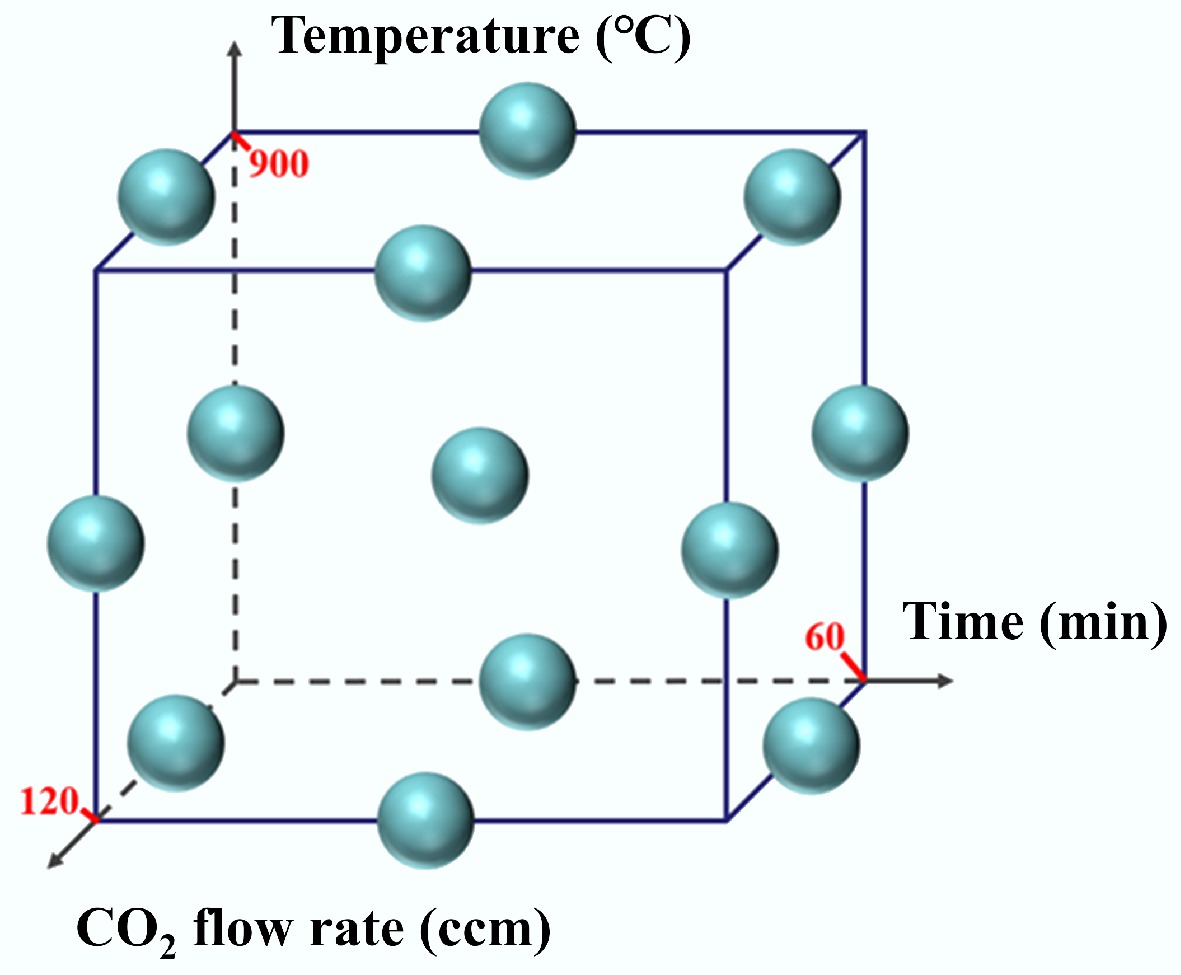
Figure 2.
Schematic diagram of actual sampling points in three-factor BBD.
-
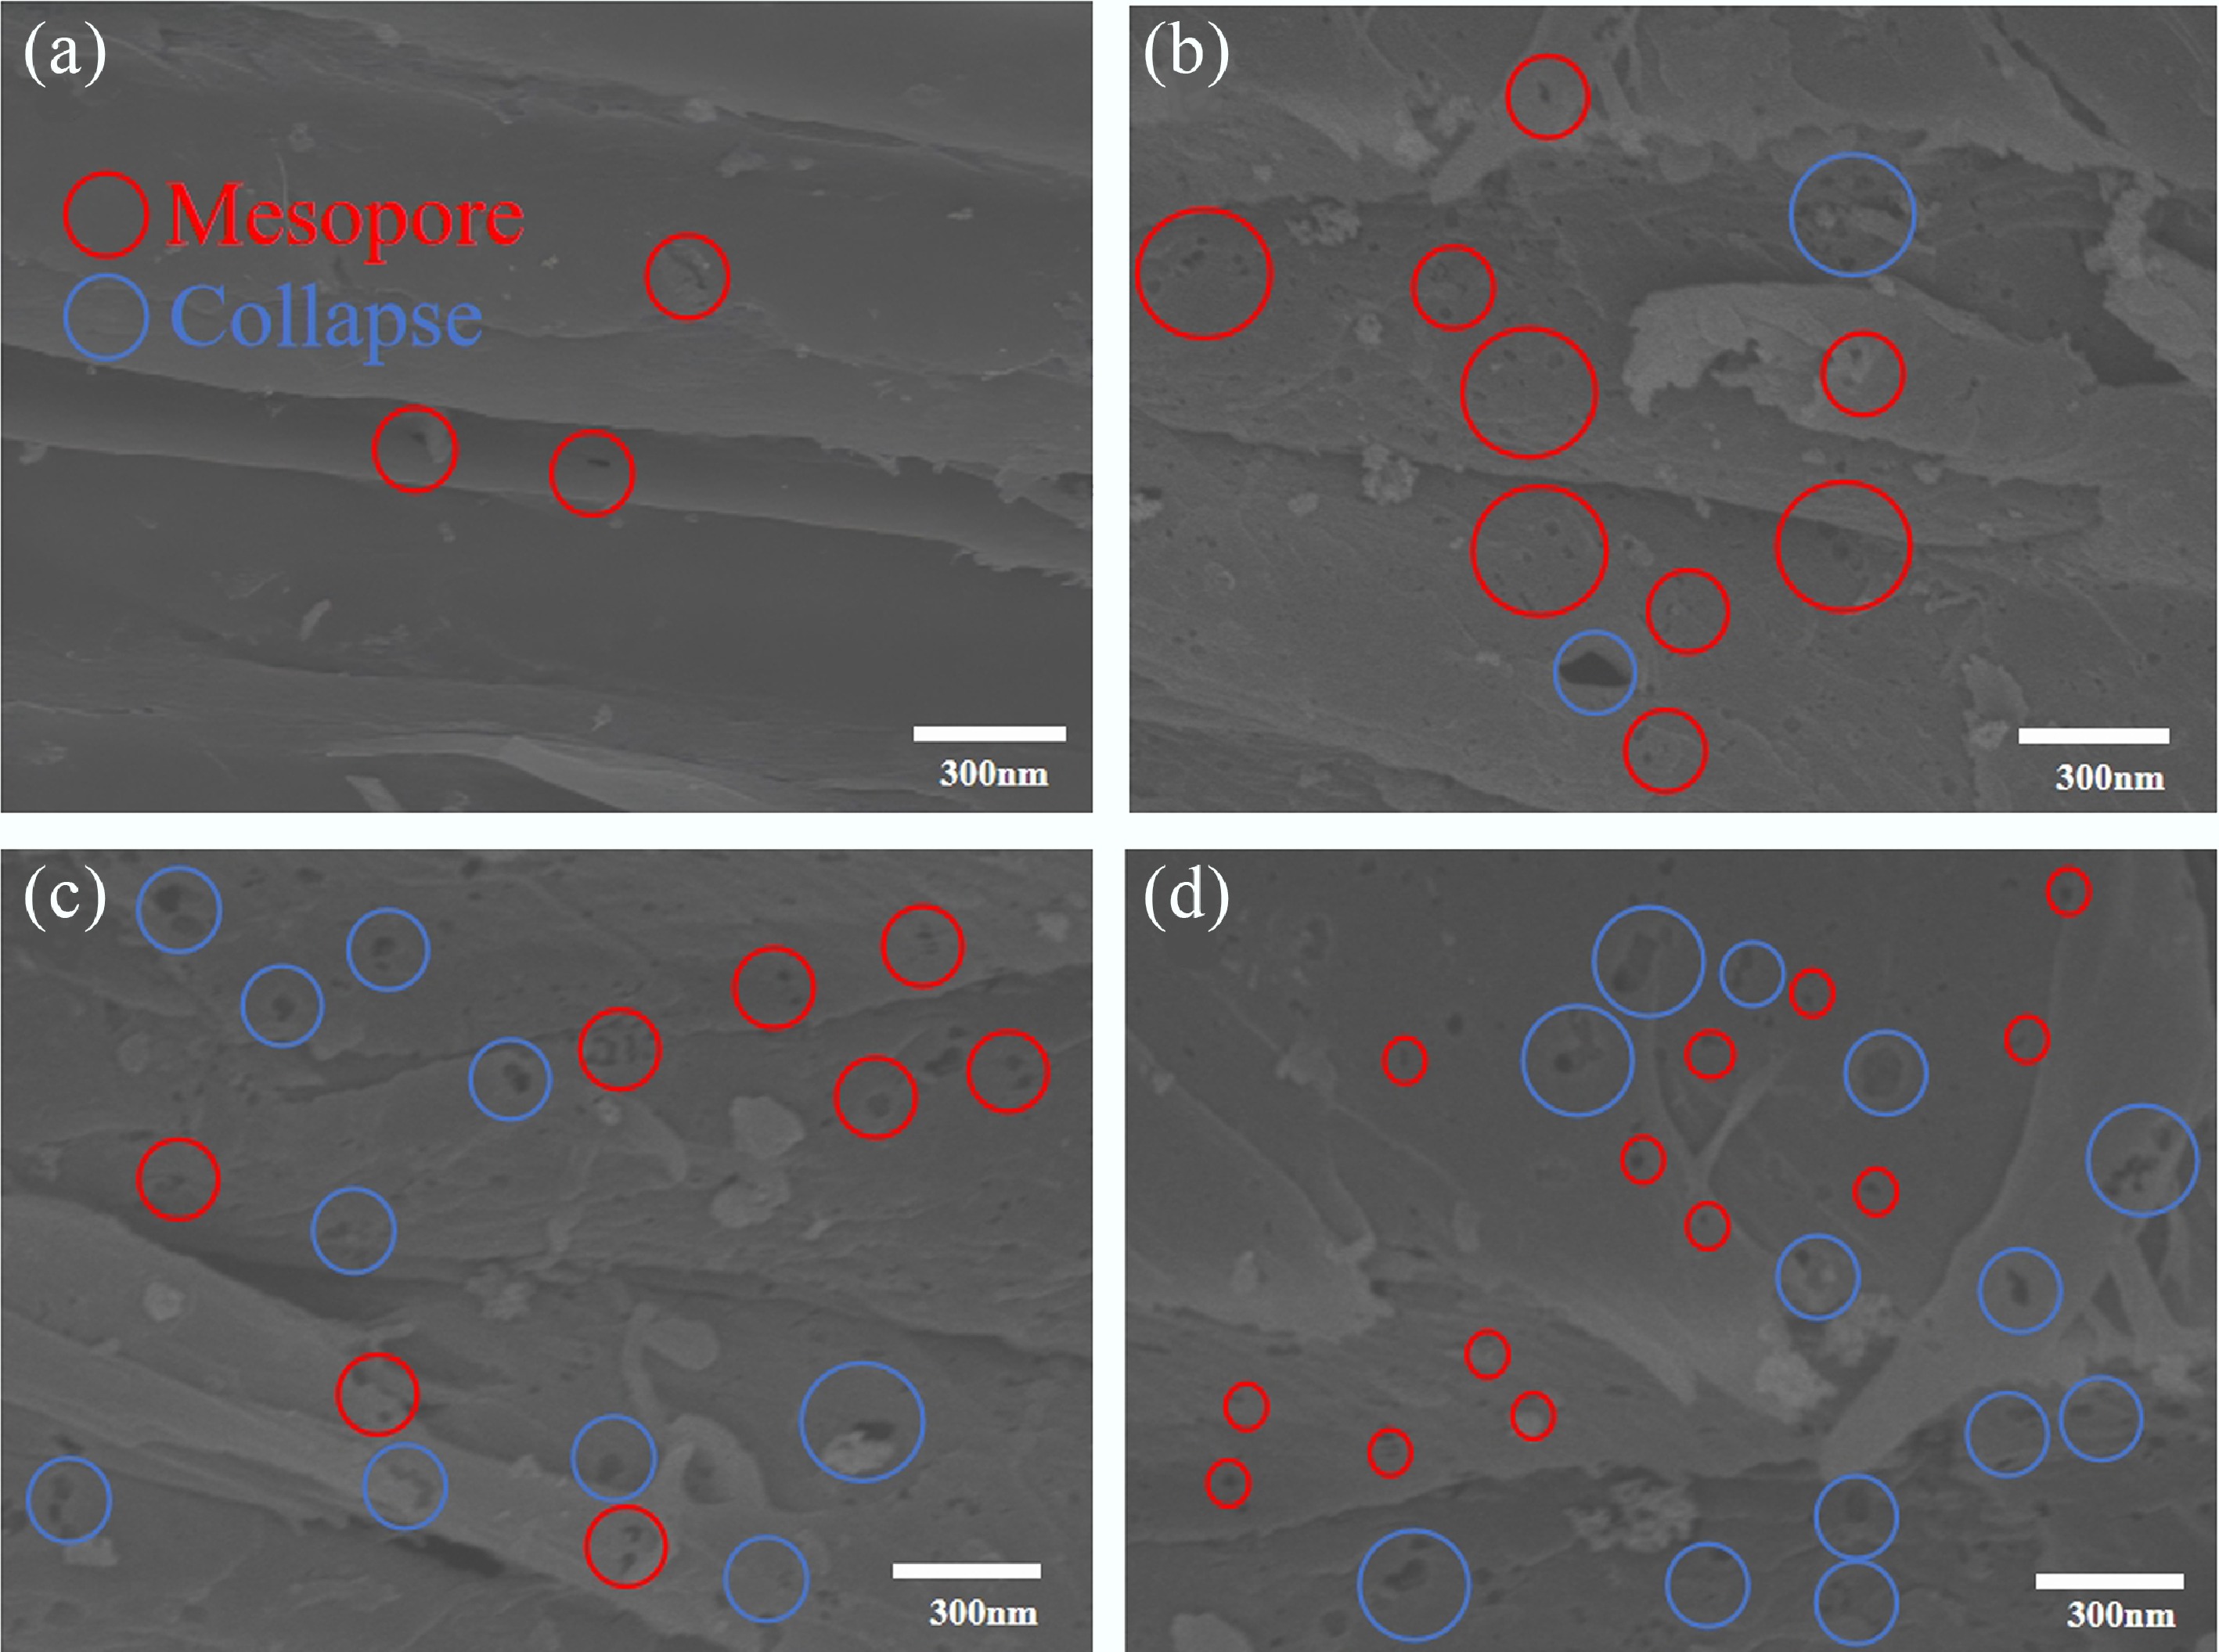
Figure 3.
SEM images of sugarcane bagasse biochar at different pyrolysis temperatures. (a) SEM images of SBPC-700, (b) SEM images of SBPC-800, (c) SEM images of SBPC-850, and (d) SEM images of SBPC-900.
-
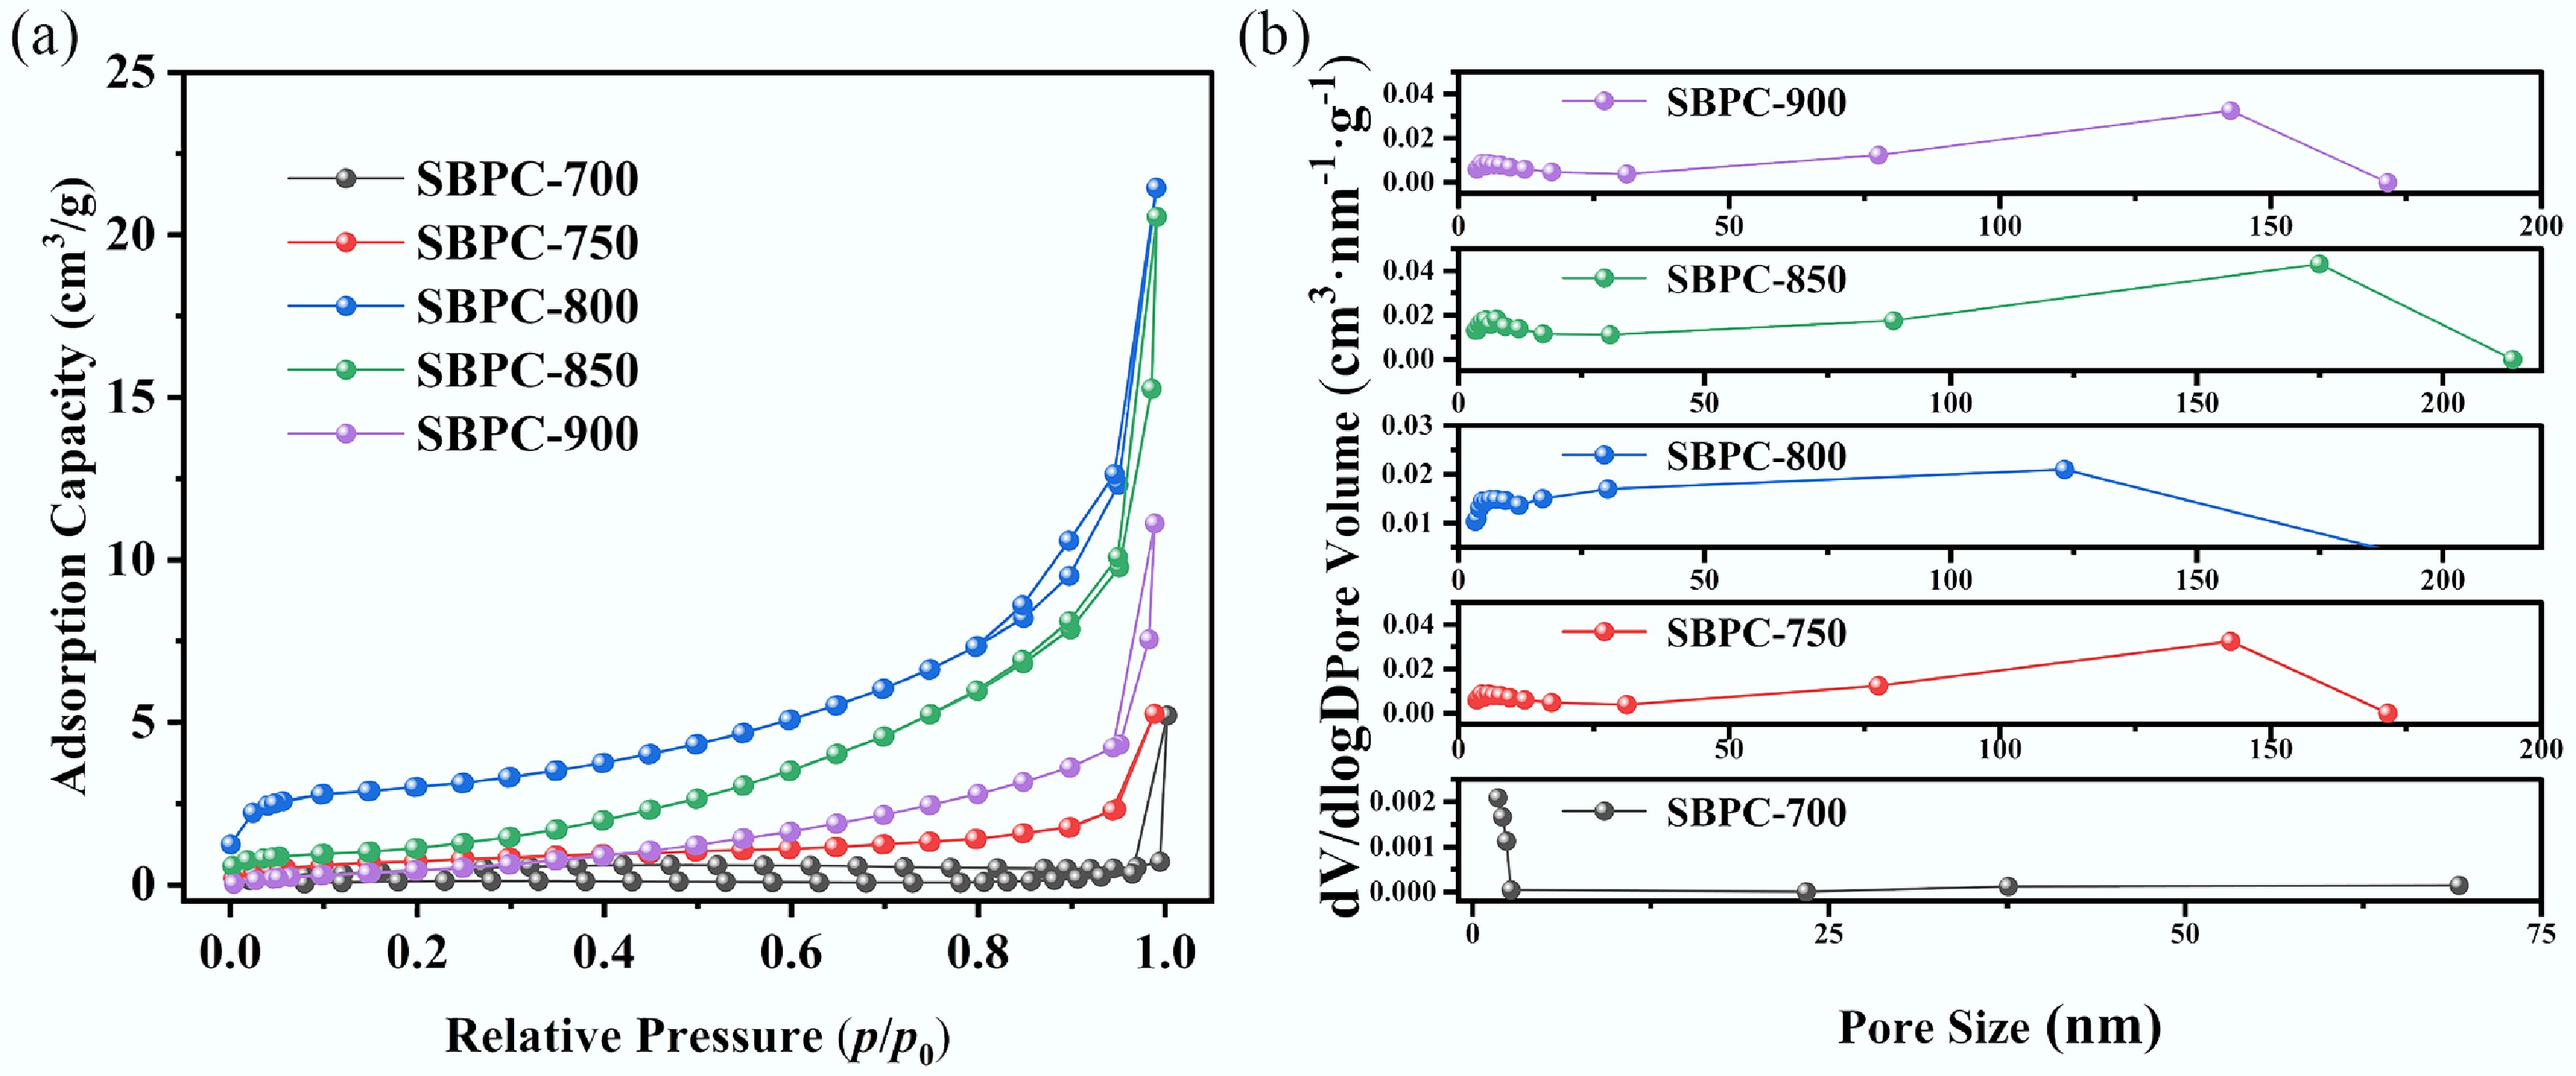
Figure 4.
Pore structure of biochar at different pyrolysis temperatures. (a) N2 adsorption-desorption isotherm and (b) pore size distribution.
-
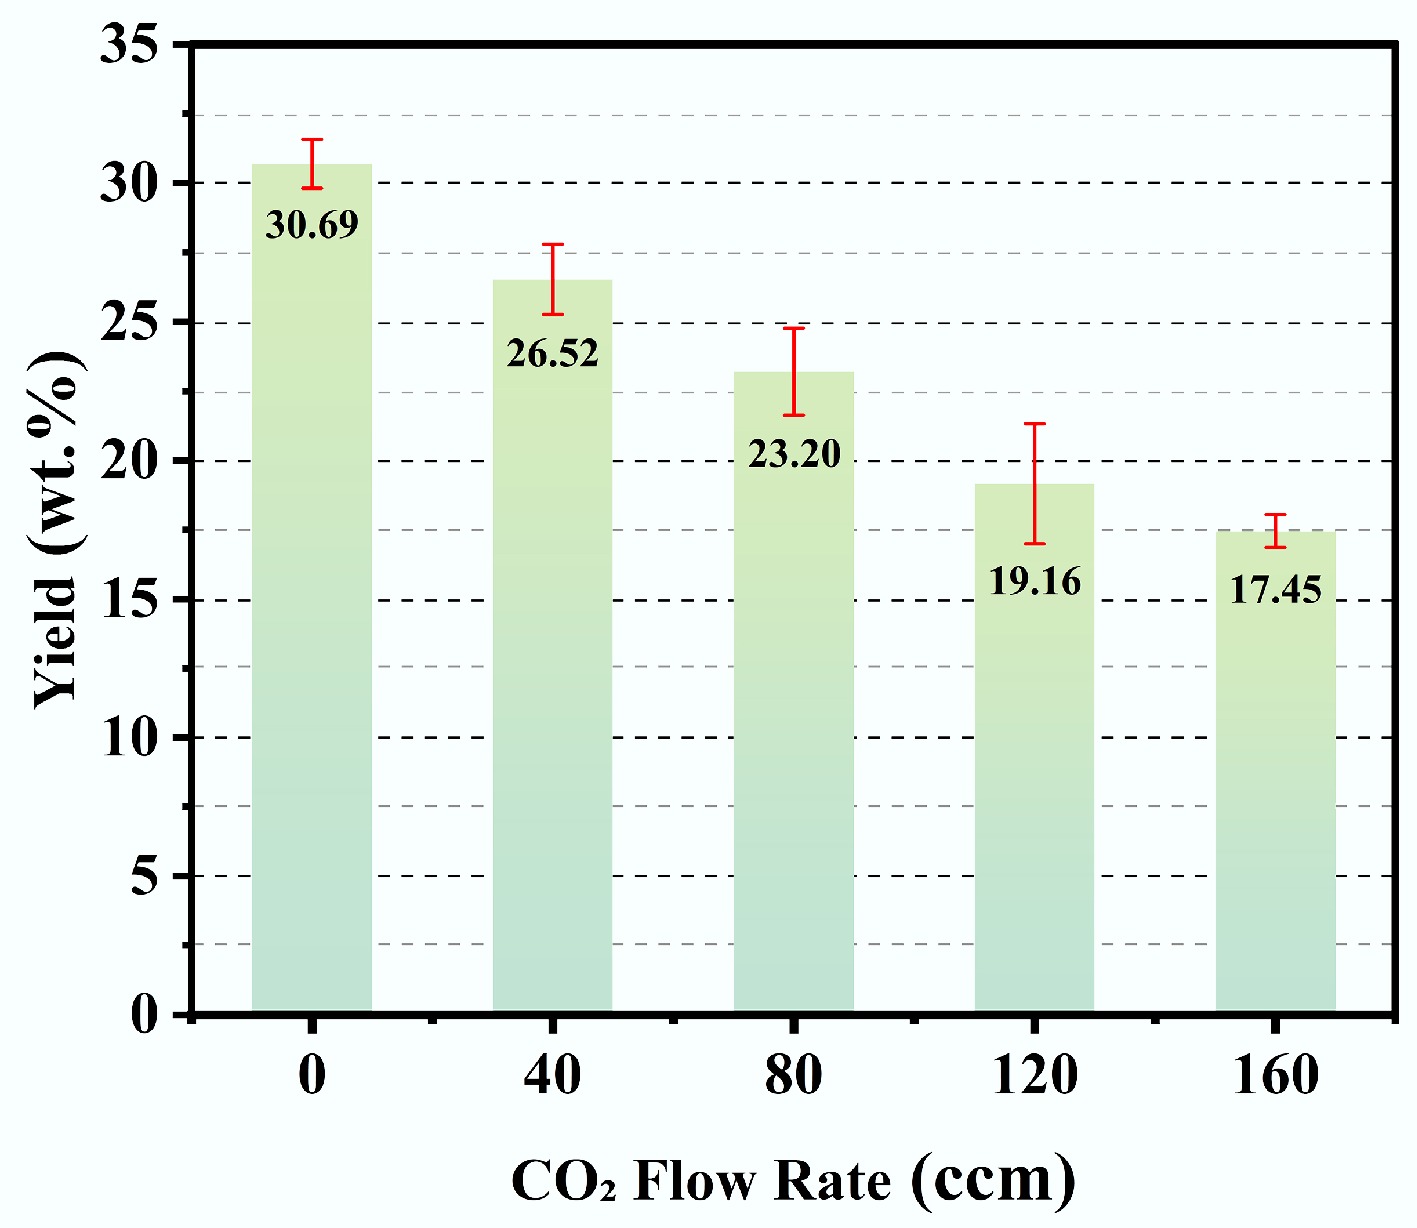
Figure 5.
Yield of biochar under varied CO2 flow rates.
-
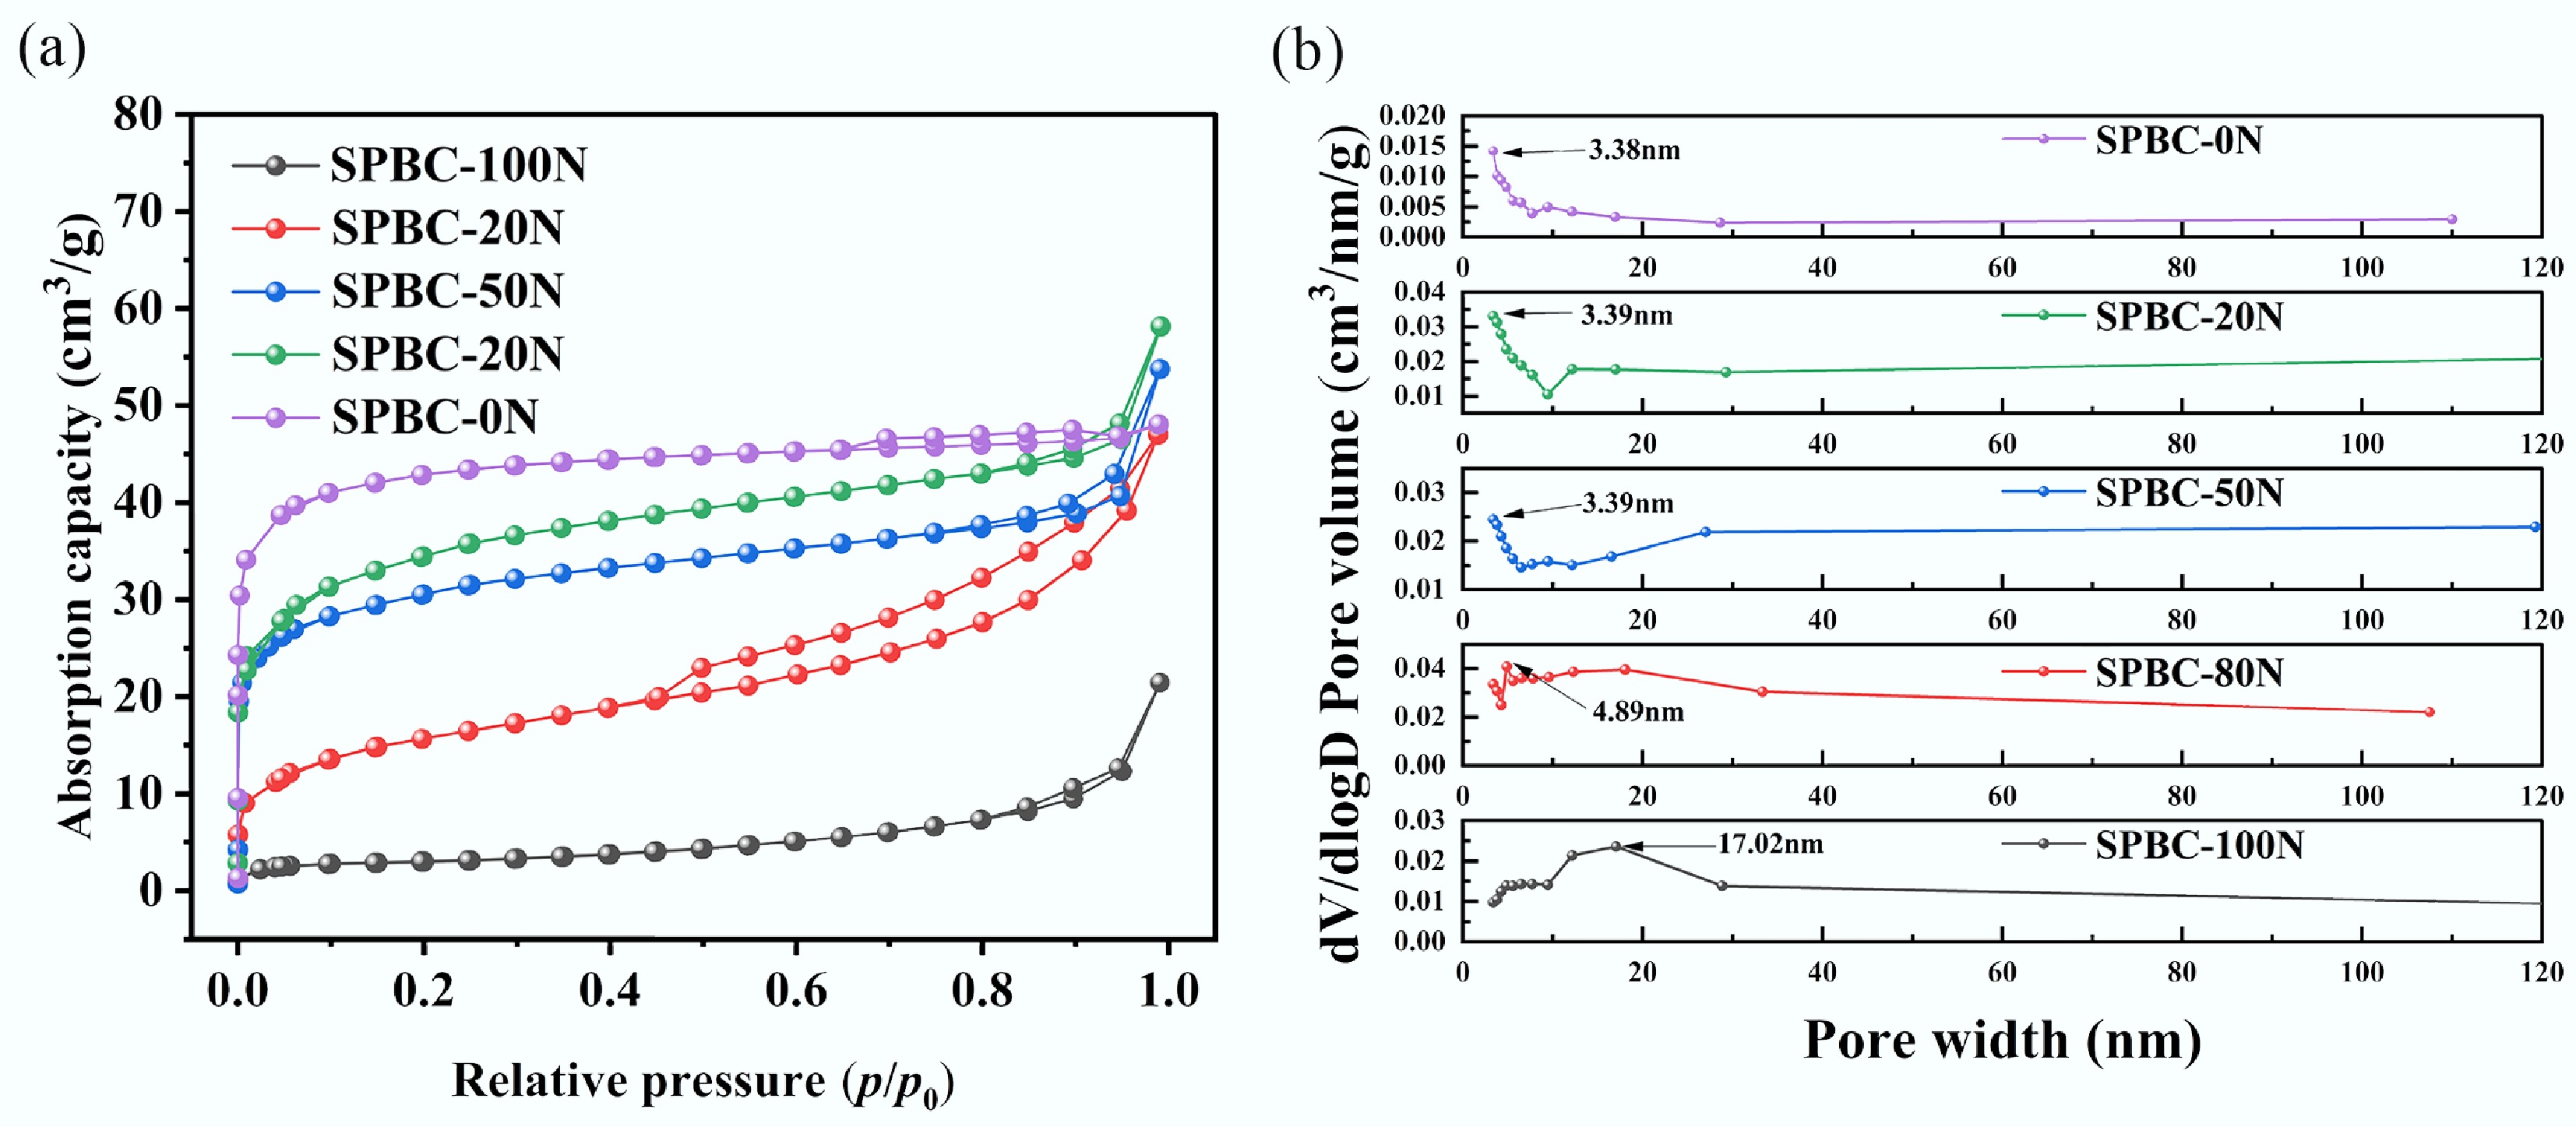
Figure 6.
Porous structure of biochar activated under varied CO2 flow rates. (a) N2 adsorption-desorption isotherm and (b) pore size distribution.
-
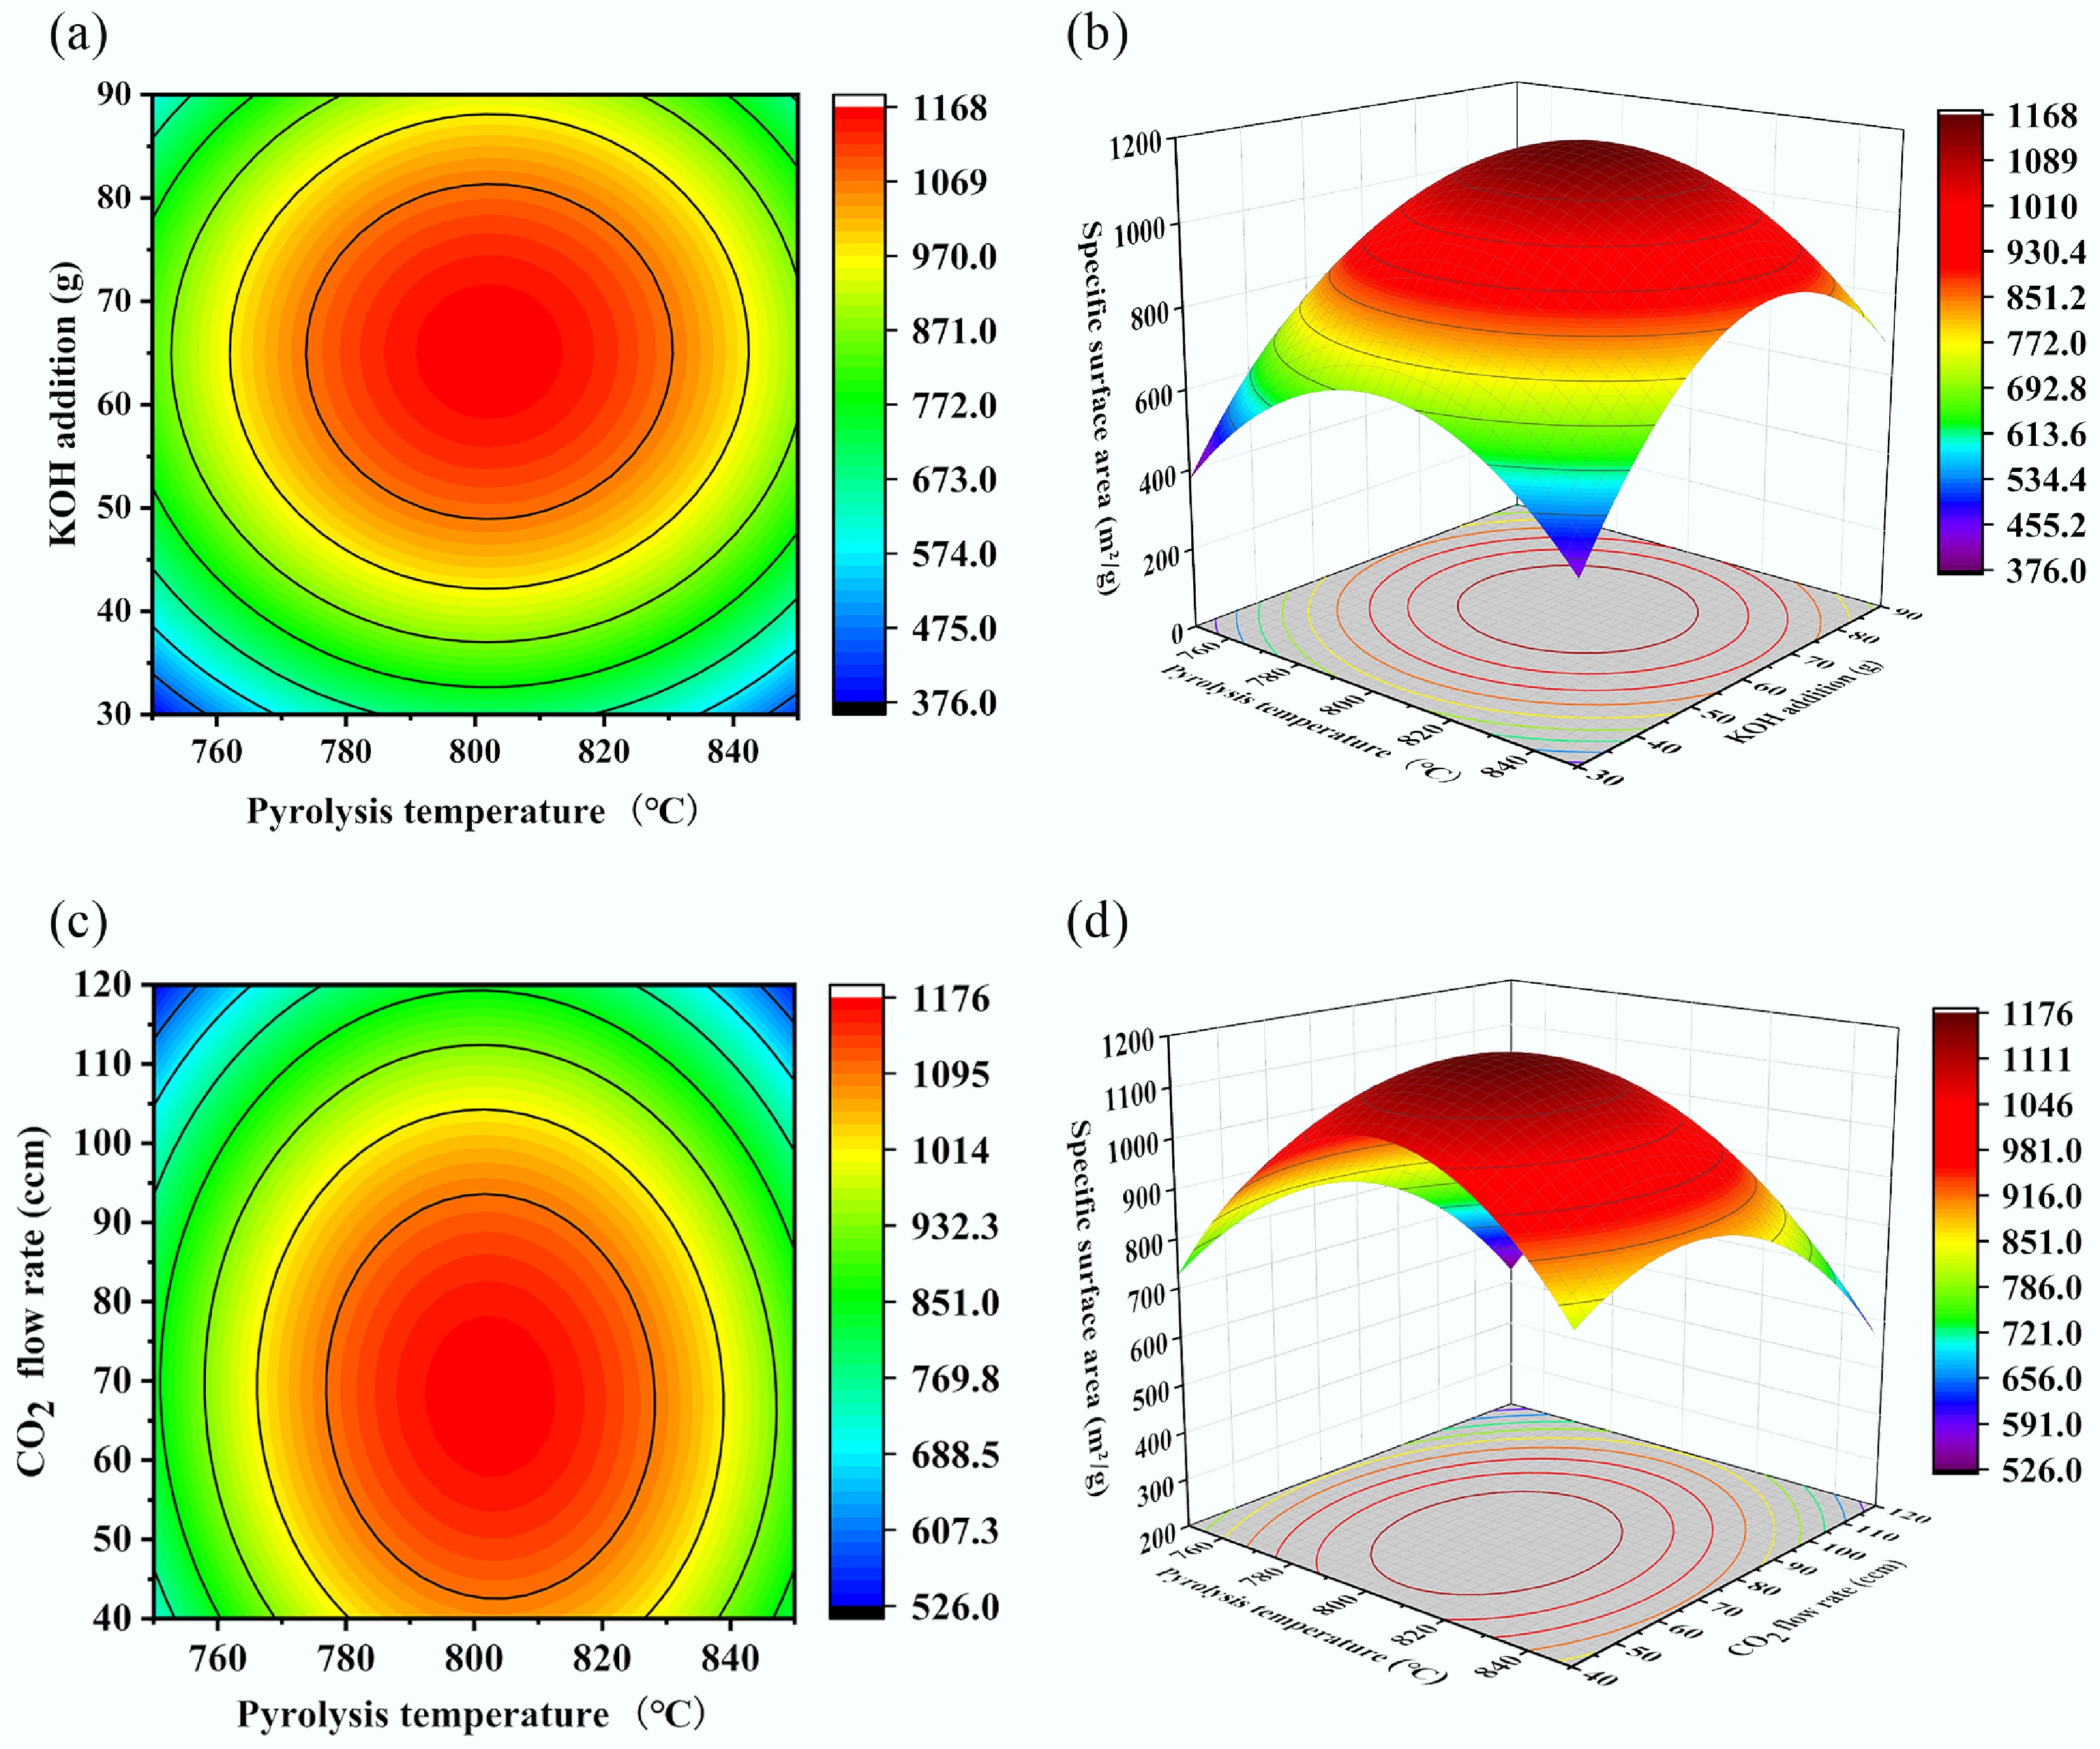
Figure 7.
Contour plots and response surface plots of specific surface area versus different parameters. (a) Pyrolysis temperature-KOH addition contour plot, (b) pyrolysis temperature-KOH addition response surface plot, (c) pyrolysis temperature-CO2 flow rate contour plot, and (d) pyrolysis temperature-CO2 flow rate response surface plot.
-
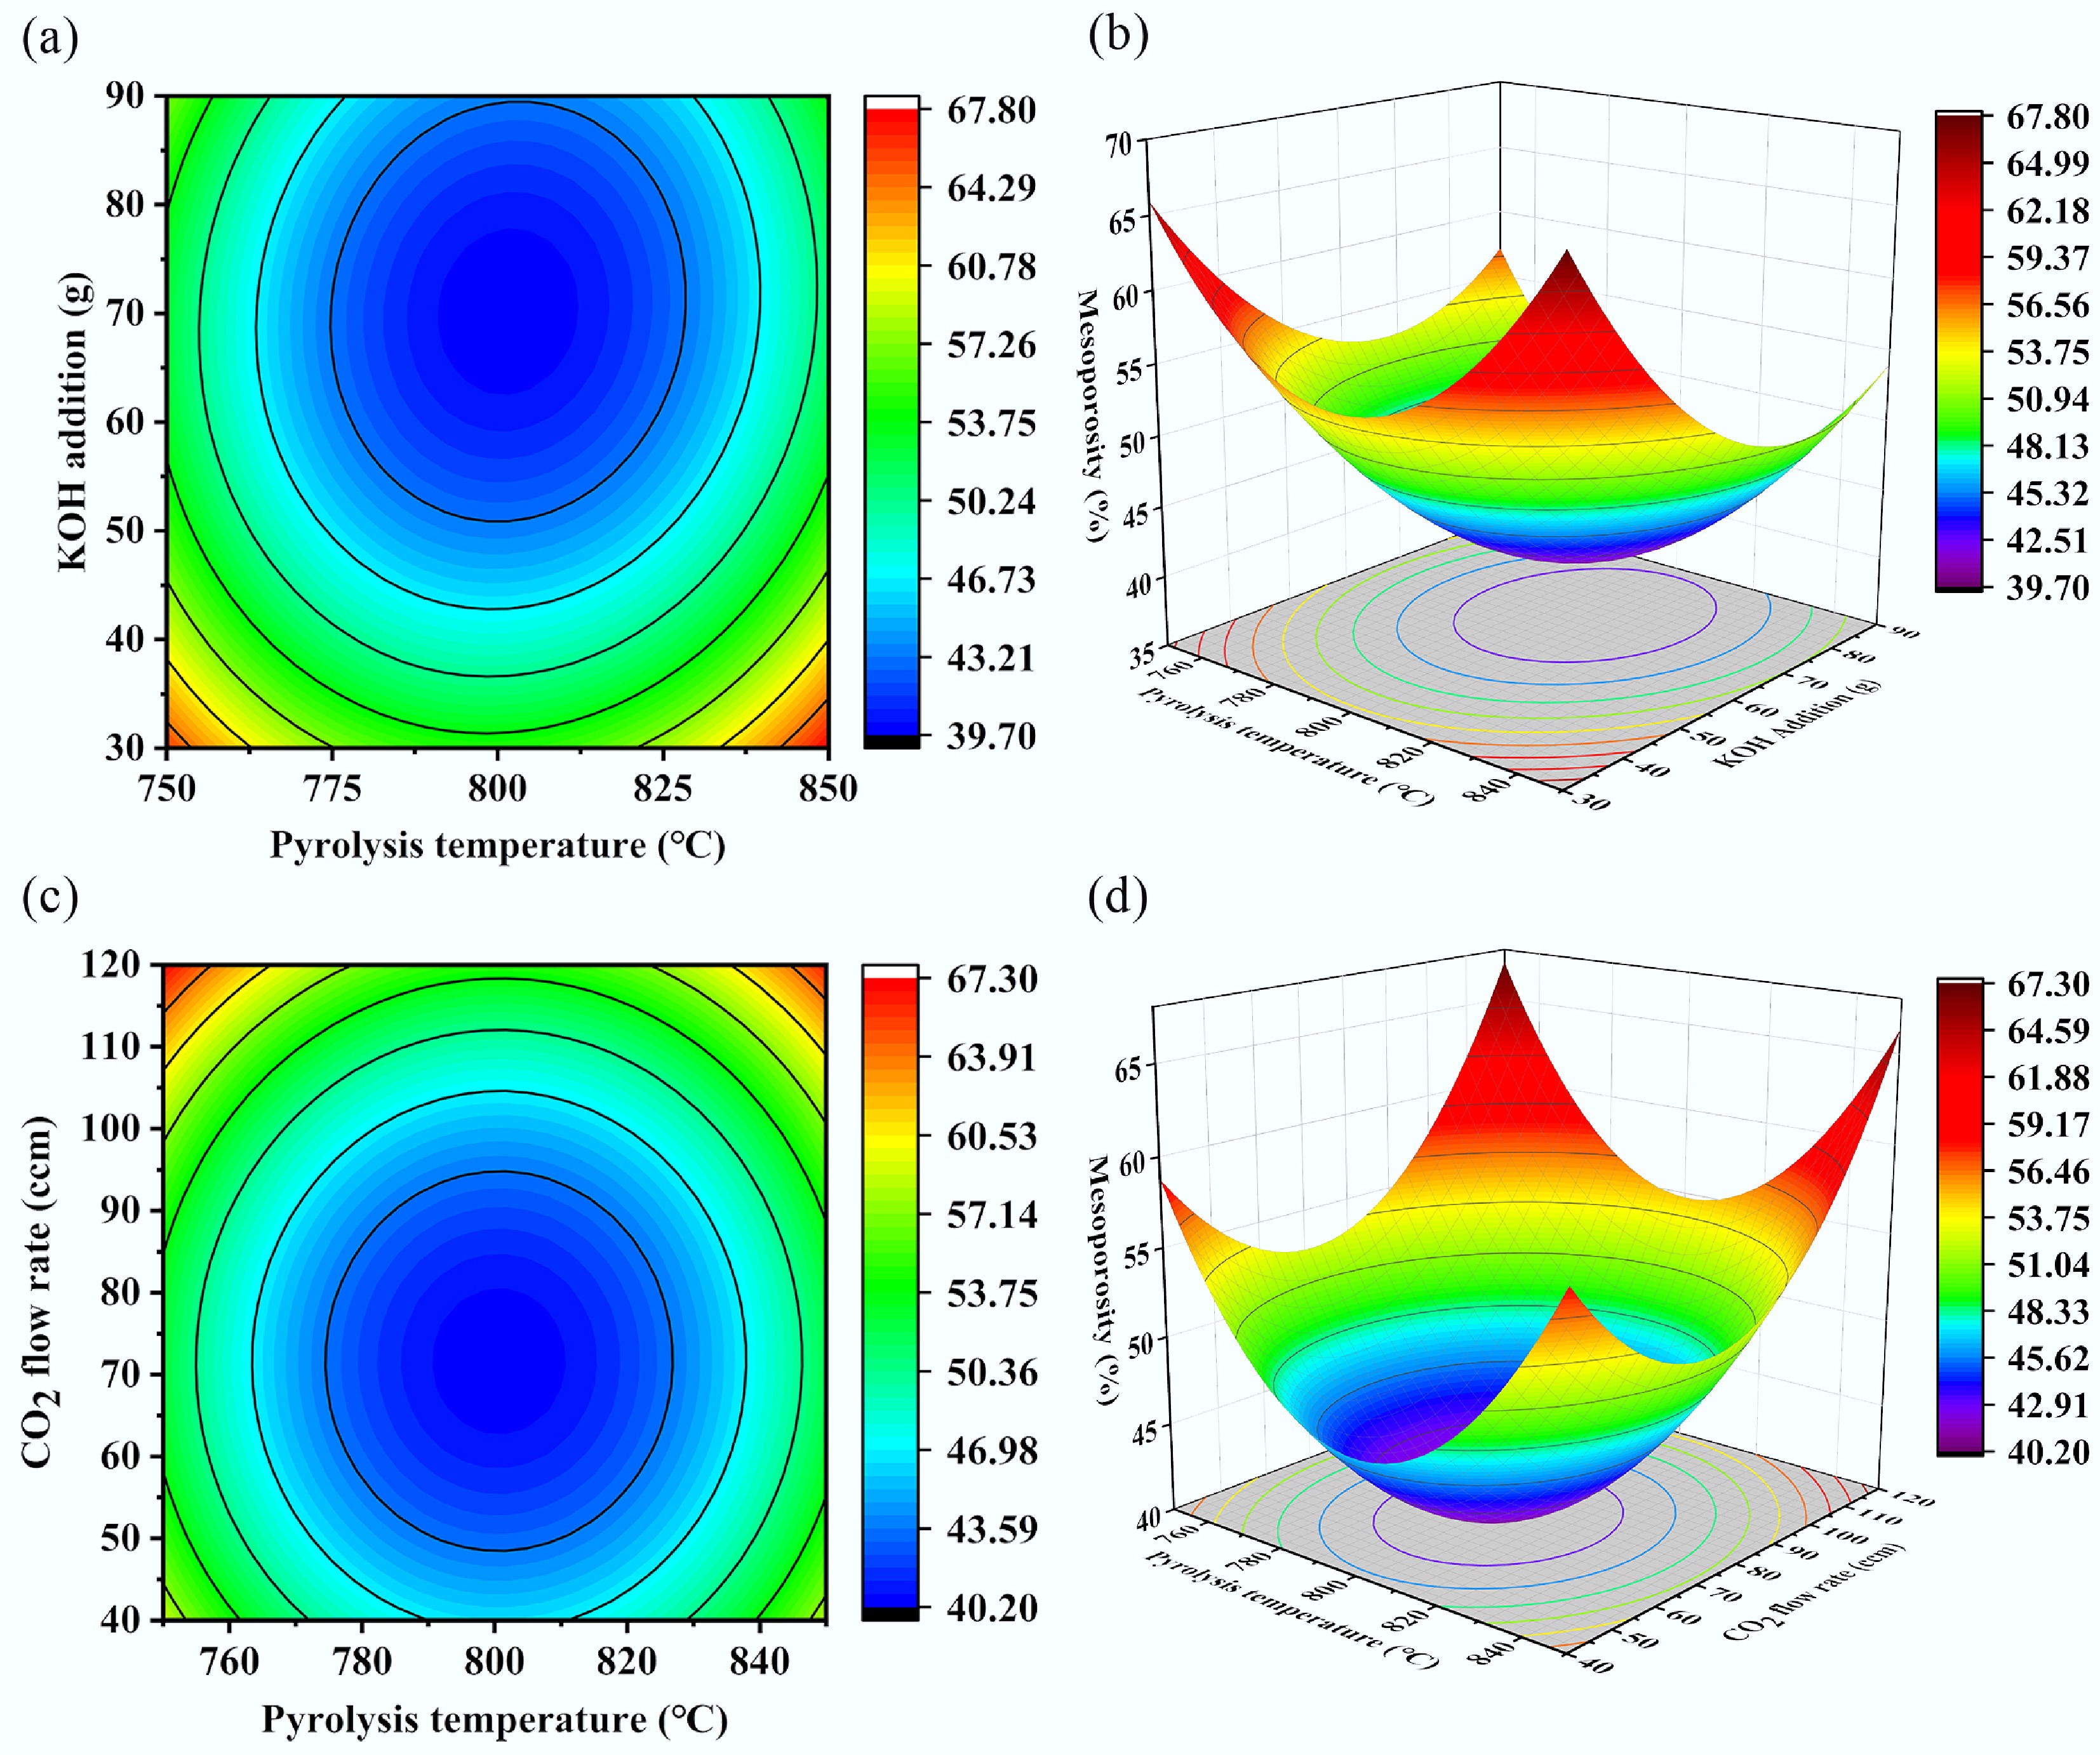
Figure 8.
Contour plots and response surface plots of mesoporosity versus different influencing factors. (a) Pyrolysis temperature-KOH addition contour plot, (b) pyrolysis temperature-KOH addition response surface plot, (c) pyrolysis temperature-CO2 flow rate contour plot, and (d) pyrolysis temperature-CO2 flow rate response surface plot.
-
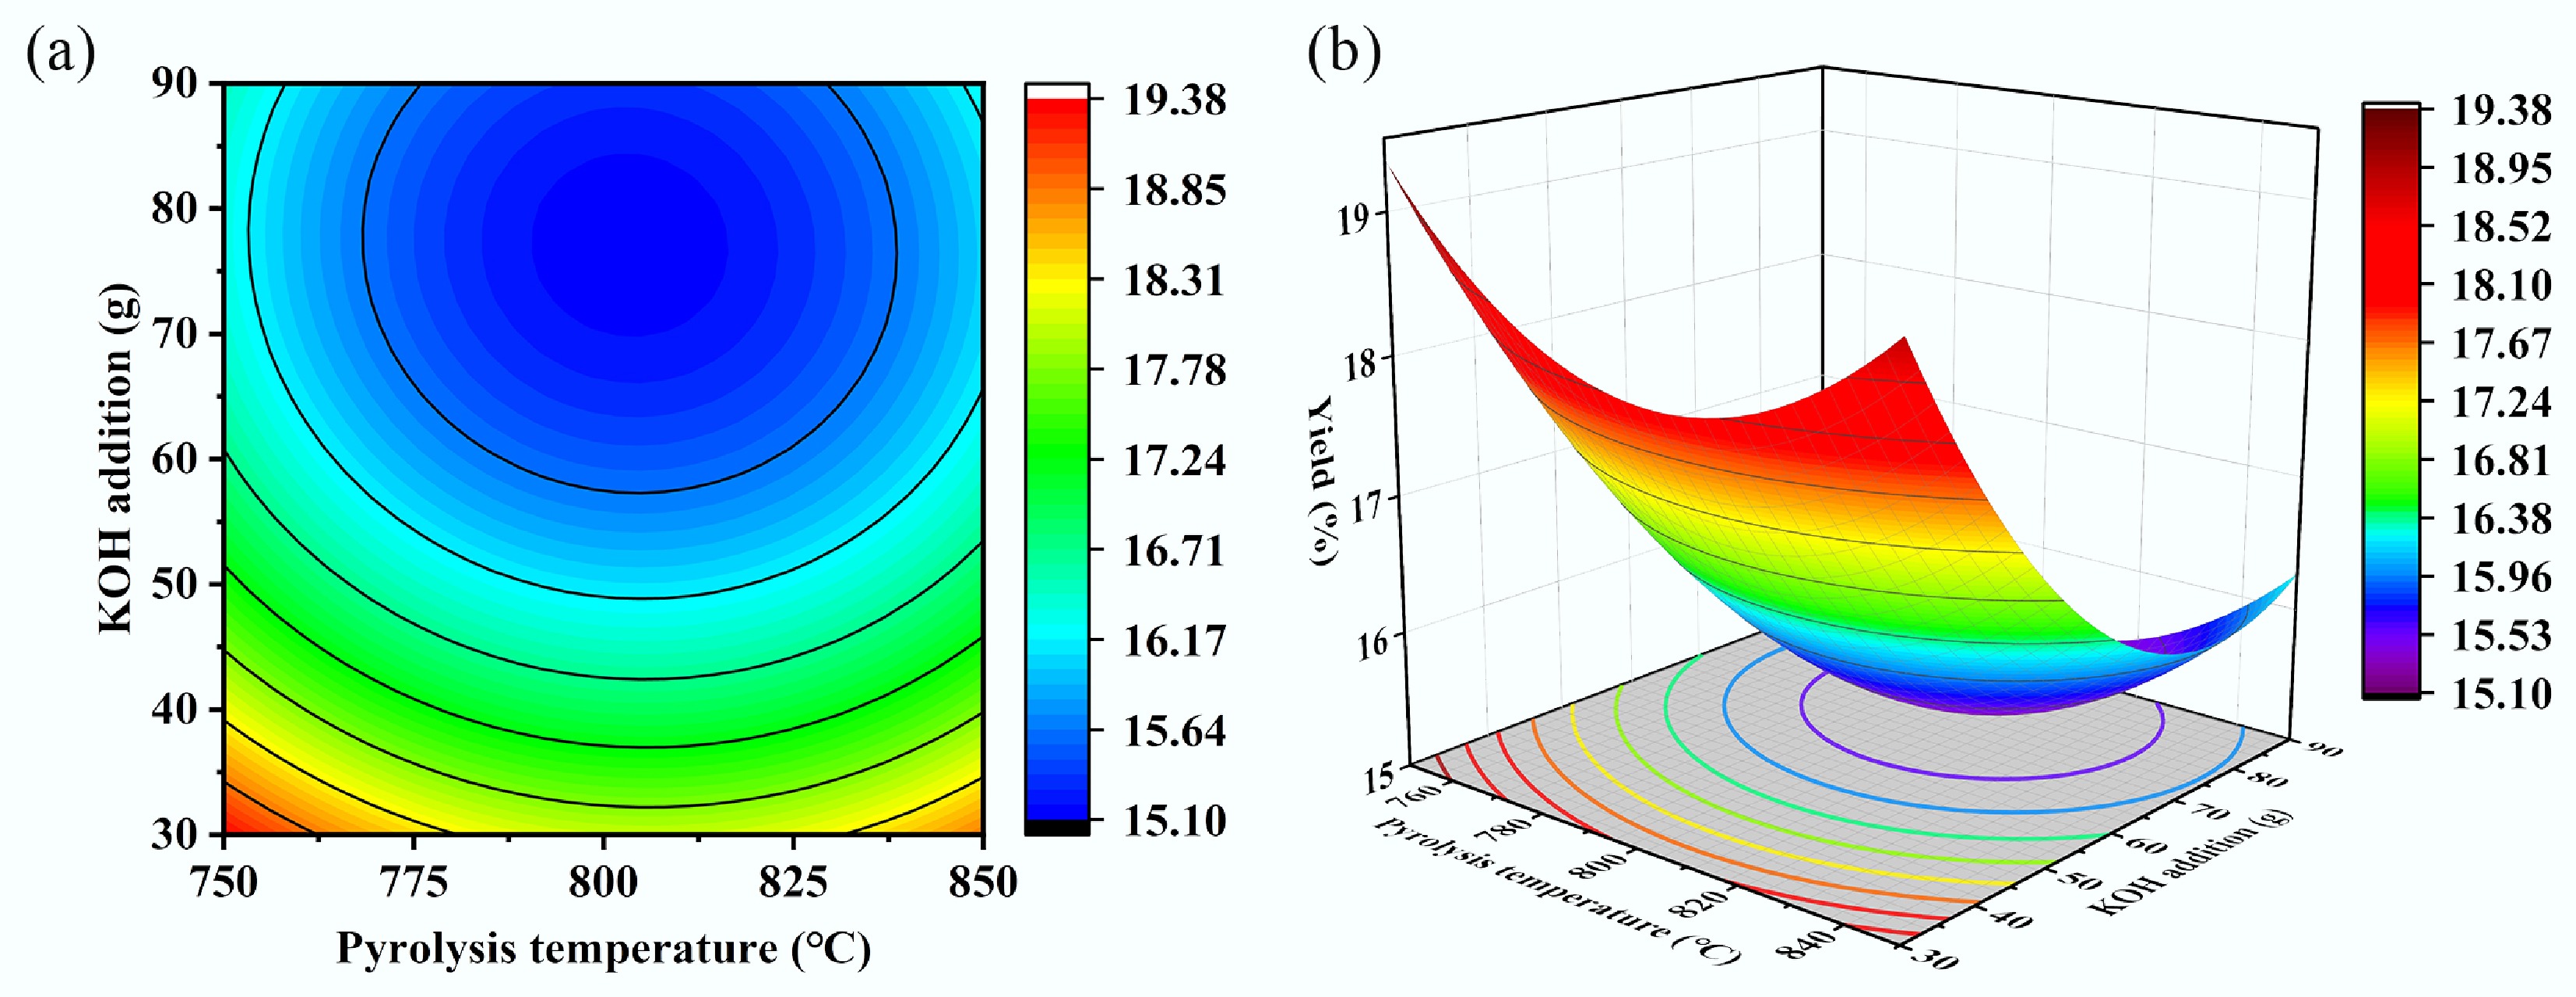
Figure 9.
Contour plots and response surface plots of biochar yield vs different parameters. (a) Pyrolysis temperature-KOH addition contour plot, (b) pyrolysis temperature-KOH addition response surface plot.
-
Parameters Value Proximate analysis (wt.%) Moisture 5.37 Ash 8.23 Volatile 70.31 Fixed carbon 16.09 Ultimate analysis (wt.%) C 44.80 H 5.35 Oa 40.55 N 0.38 S 8.92 a Calculation of variances. Table 1.
Proximate and ultimate analysis of sugarcane bagasse
-
Factor level Pyrolysis temperature (°C) KOH addition (g) CO2 flow rate
(ccm)1 850 90 120 0 800 60 80 −1 750 30 40 Table 2.
Experimental design of factors and levels
-
Sample name Pyrolysis temperature (°C) Atmosphere Residence time (min) Microwave power (W) SBPC-700 700 100%N2 50 650 SBPC-750 750 100%N2 50 650 SBPC-800 800 100%N2 50 650 SBPC-850 850 100%N2 50 650 SBPC-900 900 100%N2 50 650 Table 3.
Experimental conditions of the biochar from pyrolysis of sugarcane bagasse in relation to temperature
-
Sample name SBET
(m2/g)Vtotal
(cm3/g)Vmic
(cm3/g)Vmes
(cm3/g)Vmes/Vtotal
(%)SBPC-700 4.491 0.0318 0 0.0318 100.00 SBPC-750 5.2795 0.006348 0.000697 0.005651 89.02 SBPC-800 11.905 0.033 0.002 0.031 93.94 SBPC-850 10.608 0.0401 0.002 0.0381 95.01 SBPC-900 7.931 0.04506 0.001 0.04406 97.78 Table 4.
Porous structure parameters of biochar at varying pyrolysis temperatures
-
Sample name Pyrolysis temperature (°C) CO2 flow
rate (ccm)Residence time (min) Microwave power (W) SBPC-100N 800 0 50 650 SBPC-80N 800 40 50 650 SBPC-50N 800 80 50 650 SBPC-20N 800 120 50 650 SBPC-0N 800 160 50 650 Table 5.
Experimental conditions in relation to CO2 flow rate for of bagasse-derived biochar
-
Sample name SBET
(m2/g)Vtotal
(cm3/g)Vmic
(cm3/g)Vmes
(cm3/g)Vmes/Vtotal
(%)SBPC-100N 11.905 0.033 0.002 0.031 93.94 SBPC-80N 55.395 0.073 0.005 0.068 93.12 SBPC-50N 111.90 0.083 0.024 0.059 71.12 SBPC-20N 123.33 0.090 0.048 0.070 77.77 SBPC-0N 162.59 0.074 0.063 0.011 15.24 Table 6.
Pore structure parameters of biochar activated under varied CO2 flow rates
-
No. Factors SBET
(m2/g)Mesoporosity
(%)Yield
(wt. %)A B C 1 750 30 80 376.12 65.45 18.96 2 850 30 80 413.41 66.92 18.48 3 750 90 80 604.24 57.93 16.21 4 850 90 80 657.34 54.46 16.02 5 750 60 40 742.70 57.57 17.68 6 850 60 40 834.96 57.42 17.11 7 750 60 120 503.67 68.12 14.81 8 850 60 120 527.33 67.54 14.57 9 800 30 40 673.36 62.39 19.03 10 800 90 40 763.34 49.41 16.03 11 800 30 120 341.94 68.27 16.17 12 800 90 120 703.64 55.91 13.51 13 800 60 80 1,138.33 42.52 15.15 14 800 60 80 1,120.66 40.88 15.07 15 800 60 80 1,106.28 40.36 15.21 16 800 60 80 1,108.07 40.27 15.26 17 800 60 80 1,095.74 39.47 15.23 A: the pyrolysis temperature, B: the KOH addition, C: the CO2 flow rate. Table 7.
Experimental results of three-factor three-level design
-
Item Sum of squares Mean square F-value p-value Significance Model 1.23 × 10⁶ 1.37 × 10⁵ 227.29 < 0.0001 Highly significant A 5,320.48 5,320.48 8.82 0.0208 Significant B 1.07 × 10⁵ 1.07 × 10⁵ 176.85 < 0.0001 Highly significant C 1.10 × 10⁵ 1.10 × 10⁵ 182.27 < 0.0001 Highly significant AB 62.49 62.49 0.10 0.7569 Not significant AC 1,176.49 1,176.49 1.95 0.2052 Not significant BC 1.85 × 10⁵ 1.85 × 10⁵ 30.60 0.0009 Significant A2 3.41 × 10⁵ 3.41 × 10⁵ 565.96 < 0.0001 Highly significant B2 4.21 × 10⁵ 4.21 × 10⁵ 698.53 < 0.0001 Highly significant C2 1.32 × 10⁵ 1.32 × 10⁵ 218.55 < 0.0001 Highly significant Residual 4,221.75 603.11 / / / Lack-of-fit 3,157.43 1,052.48 3.96 0.1086 Not significant Absolute error 1,064.33 266.08 / / / Total 1.24 × 10⁶ / / / / Table 8.
Analysis of variance table for specific surface area of biochar
-
Item Sum of
squaresMean
squareF-value p-value Significance Model 1,874.86 208.32 83.13 < 0.0001 Highly significant A 0.93 0.93 0.37 0.5613 Not significant B 256.74 256.74 102.45 < 0.0001 Highly significant C 136.54 136.54 54.49 0.0002 Highly significant AB 6.1 6.1 2.43 0.1627 Not significant AC 0.046 0.046 0.018 0.8958 Not significant BC 0.096 0.096 0.038 0.8503 Not significant A2 614.3 614.3 245.14 < 0.0001 Highly significant B2 297.89 297.89 118.87 < 0.0001 Highly significant C2 411.32 411.32 164.14 < 0.0001 Highly significant Residual 17.54 2.51 / / / Lack-of-fit 12.38 4.13 3.2 0.1452 Not significant Absolute error 5.16 1.29 / / / Total 1,892.4 / / / / Table 9.
Analysis of variance table for mesoporosity of biochar
-
R2 Adjusted R2 Predicted R2 Signal-to-noise ratio 0.9966 0.9922 0.9578 42.148 Table 10.
Coefficient analysis table of specific surface area for biochar.
Figures
(9)
Tables
(10)