-
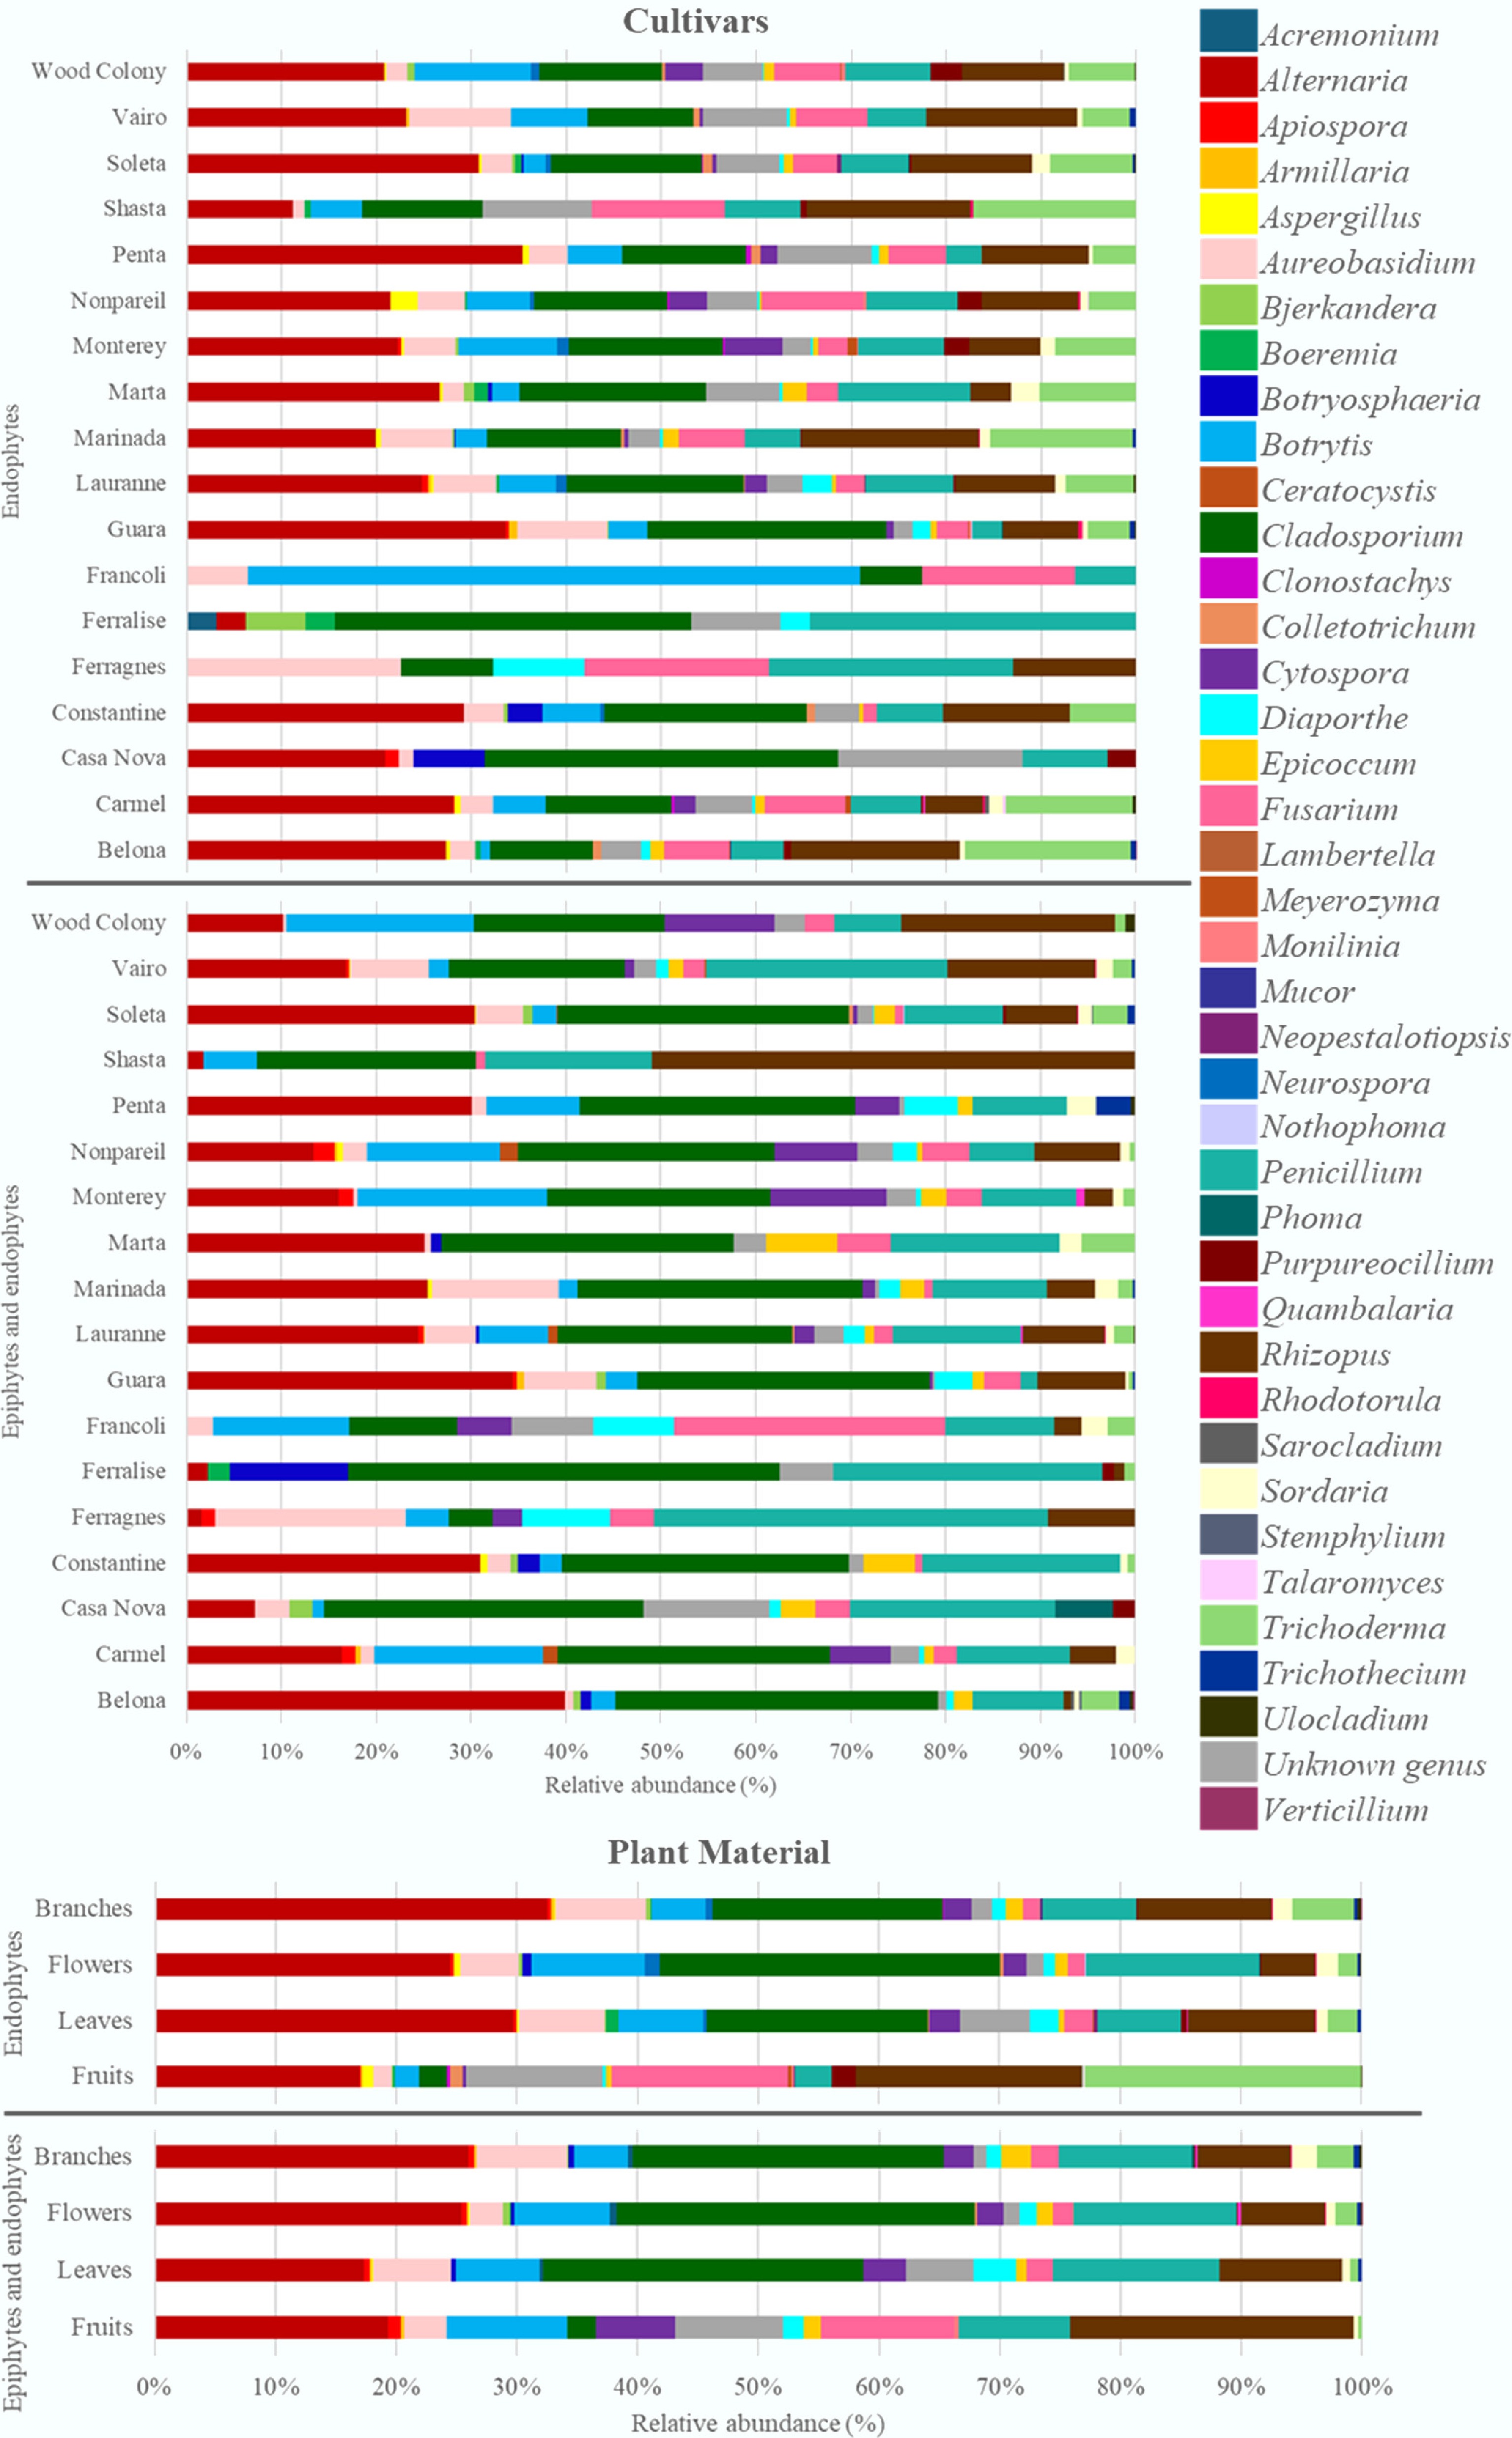
Figure 1.
Relative abundance of genera of endophytic fungi and the set of epiphytic and endophytic fungi associated with the plant material from the 16 almond cultivars analysed.
-
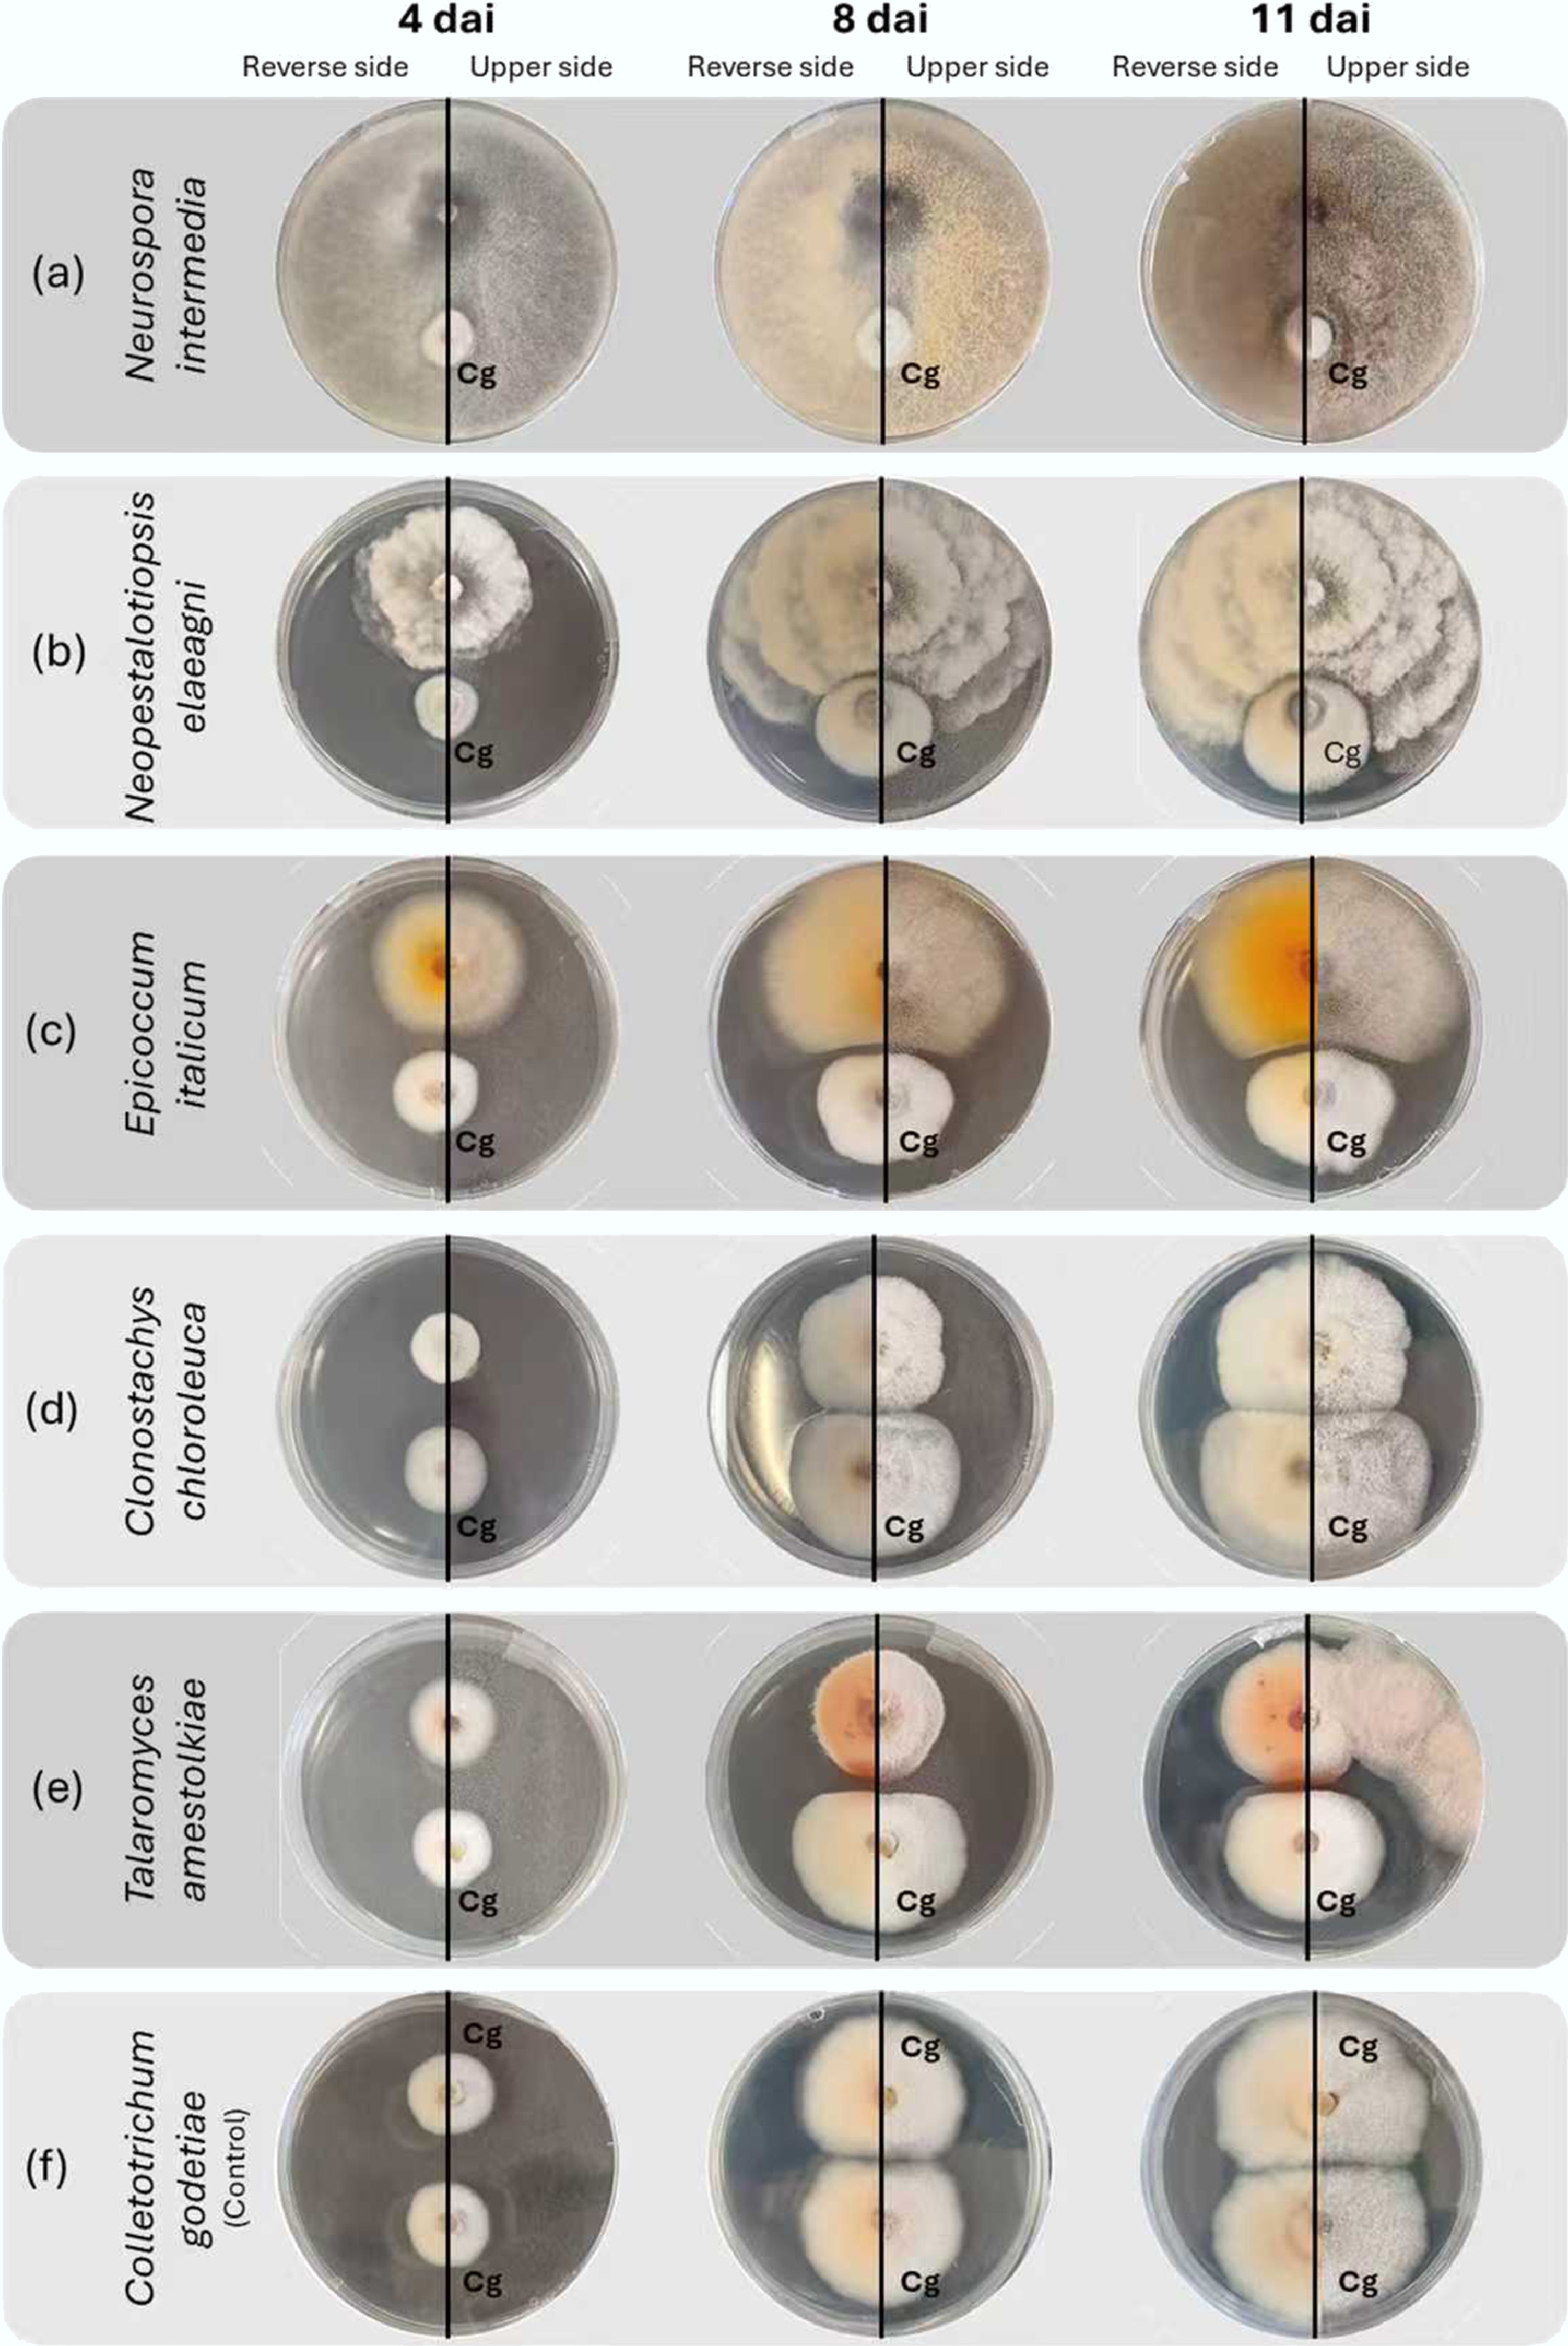
Figure 2.
Evolution of interactions on potato dextrose agar between Colletotrichum godetiae and fungal antagonists obtained from almond trees, 4, 8, and 11 days after inoculation (dai). The fungal isolates to be tested are located at the top of the Petri dishes, while Colletotrichum godetiae (Cg) is located at the bottom. Excessive growth of (a) Neurospora intermedia mycelium on C. godetiae is observed; excessive growth of (b) Neopestalotiopsis elaeagni on C. godetiae by contact inhibition, without the formation of a visible inhibition zone; overgrowth of (c) Epicoccum italicum mycelium on C. godetiae, creating a dividing line without contact between the colonies; C. godetiae mycelium is replaced by (d) Clonostachys chloroleuca; the growth of (e) Talaromyces amestolkiae and C. godetiae stops at the contact line of the mycelium of both colonies, causing a reddish discolouration at the contact edge of C. godetiae; (f) Colletotrichum godetiae in the control culture.
-
Cultivar/Organ Endophytes Endophytes and epiphytes No. of isolates No. of genera FC (%) H No. of isolates No. of genera H Cultivar Belona 1,119 21 75.9 2.14 355 17 1.64 Carmel 588 23 74.4 2.31 202 15 2.10 Casa Nova 67 8 44.7 1.65 83 12 1.97 Constantine 216 15 62.4 2.07 130 14 1.76 Ferragnes 31 6 32.3 1.72 65 10 1.79 Ferralise 32 8 26.7 1.56 88 9 1.46 Francoli 31 5 47.0 1.11 35 11 2.12 Guara 684 23 50.1 2.05 680 18 1.85 Lauranne 2,701 26 54.0 2.34 2,303 22 2.19 Marinada 813 20 64.4 2.23 449 15 1.96 Marta 274 16 61.0 2.18 175 10 1.82 Monterey 741 22 64.0 2.41 416 15 2.14 Nonpareil 700 21 68.6 2.42 321 17 2.28 Penta 399 16 67.4 2.13 193 12 1.90 Shasta 314 12 74.4 2.13 108 6 1.27 Soleta 2,195 28 67.1 2.25 1,078 22 1.96 Vairo 614 17 49.4 2.23 630 18 2.09 Wood Colony 693 22 70.9 2.42 284 11 1.98 Organ Fruits 3,576 28 92.5 2.15 290 16 2.21 Leaves 2,504 27 63.1 2.25 1,463 19 2.21 Flowers 2,605 26 43.7 2.13 3,354 28 2.09 Branches 3,527 33 58.6 2.18 2,488 27 2.20 The results are presented separately for endophytic communities and for the combined endophytes and epiphytes communities. FC: Frequency of colonization (%); H: Shannon-Wiener index. Table 1.
Number of isolates, number of genera, colonisation frequency and Shannon-Wiener diversity index (H) of fungi obtained from 16 cultivars and their plant material of Prunus dulcis
-
Isolate code ITS GenBank Accession No. Origin of isolates Family Species Location, cultivar and plant material Treatment1 Dothideomycetes-Cladosporiales MR101 PX249825 Ferreira do Alentejo, 'Marinada'
FlowerD Cladosporiaceae Cladosporium sp. Dothideomycetes-Dothideales MR110 PX250994 Aljustrel, 'Belona', Flower ND Saccotheciaceae Aureobasidium pullulans Dothideomycetes-Pleosporales MR130 PX251240 Alfândega da Fé, 'Casa Nova', Flower ND Didymellaceae Epicoccum italicum MR090 PX249718 Ferreira do Alentejo, 'Francoli', Branch D Epicoccum layuense MR106 PX250333 Évora, 'Soleta', Branch ND Nothophoma spiraeae MR141 PX251299 Alvito, 'Nonpareil', Leaf D Pleosporaceae Alternaria sp. MR104 PX249852 Aljustrel, 'Soleta', Leaf D Alternaria vitis MR098 PX249723 Aljustrel, 'Soleta', Flower ND Stemphylium vesicarium Eurotiomycetes-Eurotiales MR117 PX251002 Beja, 'Soleta', Flower D Aspergillaceae Aspergillus ochraceus MR108 PX250988 Ferreira do Alentejo, 'Marinada', Flower ND Aspergillus tubingensis MR092 PX249719 Mirandela, 'Ferralise', Leaf ND Penicillium expansum MR149 PX251741 Aljustrel, 'Nonpareil', Almond D Trichocomaceae Talaromyces amestolkiae Sordariomycetes-Diaporthales MR099 PX249724 Macedo de Cavaleiros, 'Ferragnes', Flower ND Diaporthaceae Diaporthe foeniculina MR105 PX249856 Ferreira do Alentejo, 'Marinada', Flower ND Cytosporaceae Cytospora italica Sordariomycetes-Hypocreales MR153 PX251777 Beja, 'Penta', Almond D Bionectriaceae Clonostachys chloroleuca MR142 PX395649 Aljustrel, 'Soleta', Branch D Hypocreaceae Trichoderma citrinoviride MR093 PX249720 Ferreira do Alentejo, 'Soleta', Branch ND Trichoderma viridescens MR089 PX249569 Aljustrel, 'Soleta', Almond D Nectriaceae Fusarium chlamydosporum species complex MR127 PX251237 Aljustrel, 'Nonpareil', Branch ND Fusarium tricinctum species complex MR134 PX251287 Idanha-a-Nova, 'Guara', Almond D Fusarium annulatum MR094 PX249721 Portel, 'Lauranne', Branch ND Fusarium sambucinum species complex Sordariomycetes-Sordariales MR126 PX251117 Mirandela, 'Vairo', Leaf ND Sordariaceae Neurospora intermedia Sordariomycetes-Amphisphaeriales MR096 PX249722 Beja, 'Soleta', Flower D Apiosporaceae Apiospora kogelbergensis MR137 PX251290 Beja, 'Soleta', Leaf D Sporocadaceae Neopestalotiopsis elaeagni MR007 PX251788 Beja, 'Belona', Almond ND Glomerellaceae Colletotrichum godetiae 1Treatment of plant material: D–Plant material disinfected with 1% NaClO; ND–Plant material not disinfected. Table 2.
List of 24 isolates used in this study (and the almond anthracnose pathogen), according to their provenance and identification based on a match of the ITS sequence using a phylogenetic tree constructed using the maximum likelihood method
-
Family Species Isolate code Macroscopic analysis1 Average
colony
inhibition (%)Colony inhibition
last day (%)Conidia production (conidia/cm2) Conidia production inhibition (%)
per unit areaConidia production
(total of conidia)Conidia production inhibition (%) per total Cladosporiaceae Cladosporium sp. MR101 1 −1.84 ± 2.2 gh2 −12.54 ± 4.1 g2 1.27 × 10⁶ ± 7.8 × 10⁴g2 −91.53 ± 11.8 b2 3.89 × 10⁷ ± 1.3 × 10⁶ h2 −455.69 ± 19.0 c2 Saccotheciaceae Aureobasidium pullulans MR110 1 4.05 ± 2.2 fg 21.07 ± 4.1 eh 4.38 × 10⁵ ± 7.8 × 10⁴ bcdef 33.78 ± 11.8 a 1.26 × 10⁷ ± 1.3 × 10⁶ g −79.79 ± 19.0 a Didymellaceae Epicoccum italicum MR130 2, 3 26.83 ± 2.3 cd 32.53 ± 5.3 def 1.78 × 10⁵ ± 5.5 × 10⁴ abc 73.11 ± 8.3 a 1.81 × 10⁶ ± 9.4 × 10⁵ abc 74.12 ± 13.5 a Epicoccum layuense MR090 2, 3 19.06 ± 2.2 de 24.28 ± 4.1 ef 5.55 × 10⁵ ± 7.8 × 10⁴ def 16.11 ± 11.8 a 1.05 × 10⁷ ± 1.3 × 10⁶ fg −49.68 ± 19.0 a Nothophoma spiraeae MR106 2 −8.54 ± 2.0 h 0.21 ± 4.1 gh 3.83 × 10⁵ ± 7.8 × 10⁴ abcdef 42.17 ± 11.8 a 9.14 × 10⁶ ± 1.3 × 10⁶ dfg −30.44 ± 19.0 a Pleosporaceae Alternaria sp. MR141 1 35.34 ± 3.1 bc 53.88 ± 9.3 bcde 3.80 × 10⁵ ± 7.8 × 10⁴ abcdef 42.60 ± 11.8 a 2.62 × 10⁶ ± 1.3 × 10⁶ abcd 62.56 ± 19.0 a Alternaria vitis MR104 2 4.30 ± 1.9 fg 10.06 ± 4.1 fgh 3.32 × 10⁵ ± 7.8 × 10⁴ abcdef 49.83 ± 11.8 a 7.67 × 10⁶ ± 1.3 × 10⁶ cdfg −9.56 ± 19.0 a Stemphylium vesicarium MR098 2 22.87 ± 2.2 cde 29.38 ± 4.1 ef 2.56 × 10⁴ ± 2.1 × 10⁵ a 96.13 ± 31.2 a 5.35 × 10⁵ ± 3.5 × 10⁶ ab 92.37 ± 50.3 a Aspergillaceae Aspergillus ochraceus MR117 1 2.71 ± 2.8 fgh 8.32 ± 4.6 fgh 4.75 × 10⁵ ± 7.8 × 10⁴ cdef 28.27 ± 11.8 a 6.93 × 10⁶ ± 1.3 × 10⁶ bcdfg 1.02 ± 19.0 a Aspergillus tubingensis MR108 2 24.50 ± 1.6 cd 37.05 ± 4.1 cde 5.95 × 10⁵ ± 5.5 × 10⁴ def 10.16 ± 8.3 a 8.98 × 10⁶ ± 9.4 × 10⁵ dfg −28.12 ± 13.5 a Penicillium expansum MR092 2 32.30 ± 2.2 c 39.29 ± 4.1 cde 1.61 × 10⁶ ± 7.8 × 10⁴ g −143.12 ± 11.8 b 2.86 × 10⁷ ± 1.3 × 10⁶ e −307.76 ± 19.0 b Trichocomaceae Talaromyces amestolkiae MR149 1 12.32 ± 2.5 ef −2.70 ± 4.1 g 3.85 × 10⁴ ± 5.5 × 10⁴ a 94.18 ± 8.3 a 4.27 × 10⁵ ± 9.4 × 10⁵ a 93.90 ± 13.5 a Diaporthaceae Diaporthe foeniculina MR099 1, 3 21.82 ± 2.2 cde 31.96 ± 4.1 ef 1.40 × 10⁶ ± 7.8 × 10⁴ g −111.29 ± 11.8 b 2.62 × 10⁷ ± 1.3 × 10⁶ e −274.41 ± 19.0 b Cytosporaceae Cytospora italica MR105 1, 3 24.59 ± 2.2 cd 39.12 ± 4.1 cde 6.55 × 10⁵ ± 7.8 × 10⁴ ef 0.98 ± 11.8 a 1.05 × 10⁷ ± 1.3 × 10⁶ fg −49.39 ± 19.0 a Bionectriaceae Clonostachys chloroleuca MR153 4 9.75 ± 4.2 efg 15.85 ± 9.3 efgh 5.03 × 10⁴ ± 7.8 × 10⁴ ab 92.40 ± 11.8 a 6.34 × 10⁵ ± 1.3 × 10⁶ ab 90.95 ± 19.0 a Hypocreaceae Trichoderma citrinoviride MR142 3 77.21 ± 2.5 a 73.30 ± 4.1 ab 1.60 × 10⁵ ± 7.8 × 10⁴ abc 75.87 ± 11.8 a 5.52 × 10⁵ ± 1.3 × 10⁶ ab 92.12 ± 19.0 a Trichoderma viridescens MR093 3 83.69 ± 2.2 a 91.61 ± 4.1 a 2.84 × 10⁴ ± 2.1 × 10⁵ a 95.71 ±31.2 a 4.83 × 10⁴ ± 3.5 × 10⁶ a 99.31 ± 50.3 a Nectriaceae Fusarium chlamydosporum SC MR089 1, 3 27.83 ± 2.2 cd 42.34 ± 4.1 cde 2.76 × 10⁵ ± 1.2 × 10⁵ abcde 58.31 ± 18.0 a 3.88 × 10⁶ ± 2.0 × 10⁶ abcdf 44.62 ± 29.1 a Fusarium tricinctum SC MR127 1 −1.30 ± 3.2 fgh 4.21 ± 5.3 fgh 2.46 × 10⁵ ± 7.8 × 10⁴ abcd 62.91 ± 11.8 a 3.88 × 10⁶ ± 1.3 × 10⁶ abcdf 44.60 ± 19.0 a Fusarium annulatum MR134 1, 3 31.27 ± 2.5 c 26.95 ± 4.6 ef 2.88 × 10⁵ ± 7.8 × 10⁴ abcde 56.52 ± 11.8 a 2.48 × 10⁶ ± 1.3 × 10⁶ abcd 64.61 ± 19.0 a Fusarium
sambucinum SCMR094 1, 3 47.52 ± 2.2 b 58.71 ± 4.1 bc 1.34 × 10⁵ ± 7.8 × 10⁴ abc 79.79 ± 11.8 a 1.47 × 10⁶ ± 1.3 × 10⁶ abc 79.02 ± 19.0 a Sordariaceae Neurospora intermedia MR126 3 81.81 ± 2.5 a 88.53 ± 4.1 a 1.64 × 10⁵ ± 7.8 × 10⁴ abc 75.15 ± 11.8 a 2.60 × 10⁵ ± 1.3 × 10⁶ a 96.30 ± 19.0 a Apiosporaceae Apiospora kogelbergensis MR096 1, 3 24.17 ± 2.2 cde 42.29 ± 4.1 cde 9.92 × 10⁴ ± 9.2 × 10⁴ abc 85.01 ± 13.9 a 1.46 × 10⁶ ± 1.6 × 10⁶ abc 79.12 ± 22.5 a Sporocadaceae Neopestalotiopsis elaeagni MR137 1, 3 49.95 ± 2.8 b 58.46 ± 4.6 bcd 2.64 × 10⁵ ± 7.8 × 10⁴ abcde 60.06 ± 11.8 a 1.51 × 10⁶ ± 1.3 × 10⁶ abc 78.47 ± 19.0 a Glomerellaceae Colletotrichum godetiae MR007 − − − 6.62 × 10⁵ ± 5.6 × 10⁴ f − 7.00 × 10⁶ ± 9.5 × 10⁵ cdfg − Each column shows the mean values ± SE. Average colony inhibition represents the mean inhibition across all assay days and is provided as a descriptive summary of the overall performance of each isolate. 1Macroscopic analysis: (1) The growth of the mycelium of both fungal colonies stops at the contact line; (2) Neither colony grows in the area occupied by the other; (3) Rapid growth of the mycelium of the fungus antagonistic to C. godetiae is observed; (4) Replacement of the mycelium of C. godetiae by the antagonistic fungus. 2In each column, the mean values followed by the same letter are not significantly different according to Tukey test (p < 0.05), which was conducted following the verification of significant differences in the ANOVA for each parameter: Average colony inhibition (%) – F(23,1099) = 116, p-value = 2 × 10⁻¹⁶; Colony inhibition last day (%) – F(23,81) = 40.27, p-value = 2 × 10⁻¹⁶; Conidia production (conidia/cm2) – F(26,612) = 27.26, p-value = 2 × 10⁻¹⁶; Conidia production inhibition (%) per unit area – F(27,610) = 27.20, p-value = 2 × 10⁻¹⁶; Conidia production (total of conidia) – F(26,612) = 31.34, p-value = 2 × 10⁻¹⁶; Conidia production inhibition (%) total – F(27,610) = 38.10, p-value = 2 × 10⁻¹⁶. For the parameter 'Average colony inhibition (%)', Tukey comparisons were applied to the time-averaged values for descriptive purposes, complementing the two-factor ANOVA (Isolate × dpi) presented in the Results section: F(23,1099) = 116, p-value = 2 × 10⁻¹⁶. Table 3.
Antagonistic effect of 24 fungal isolates on the mycelial growth and sporulation of Colletotrichum godetiae
Figures
(2)
Tables
(3)