-
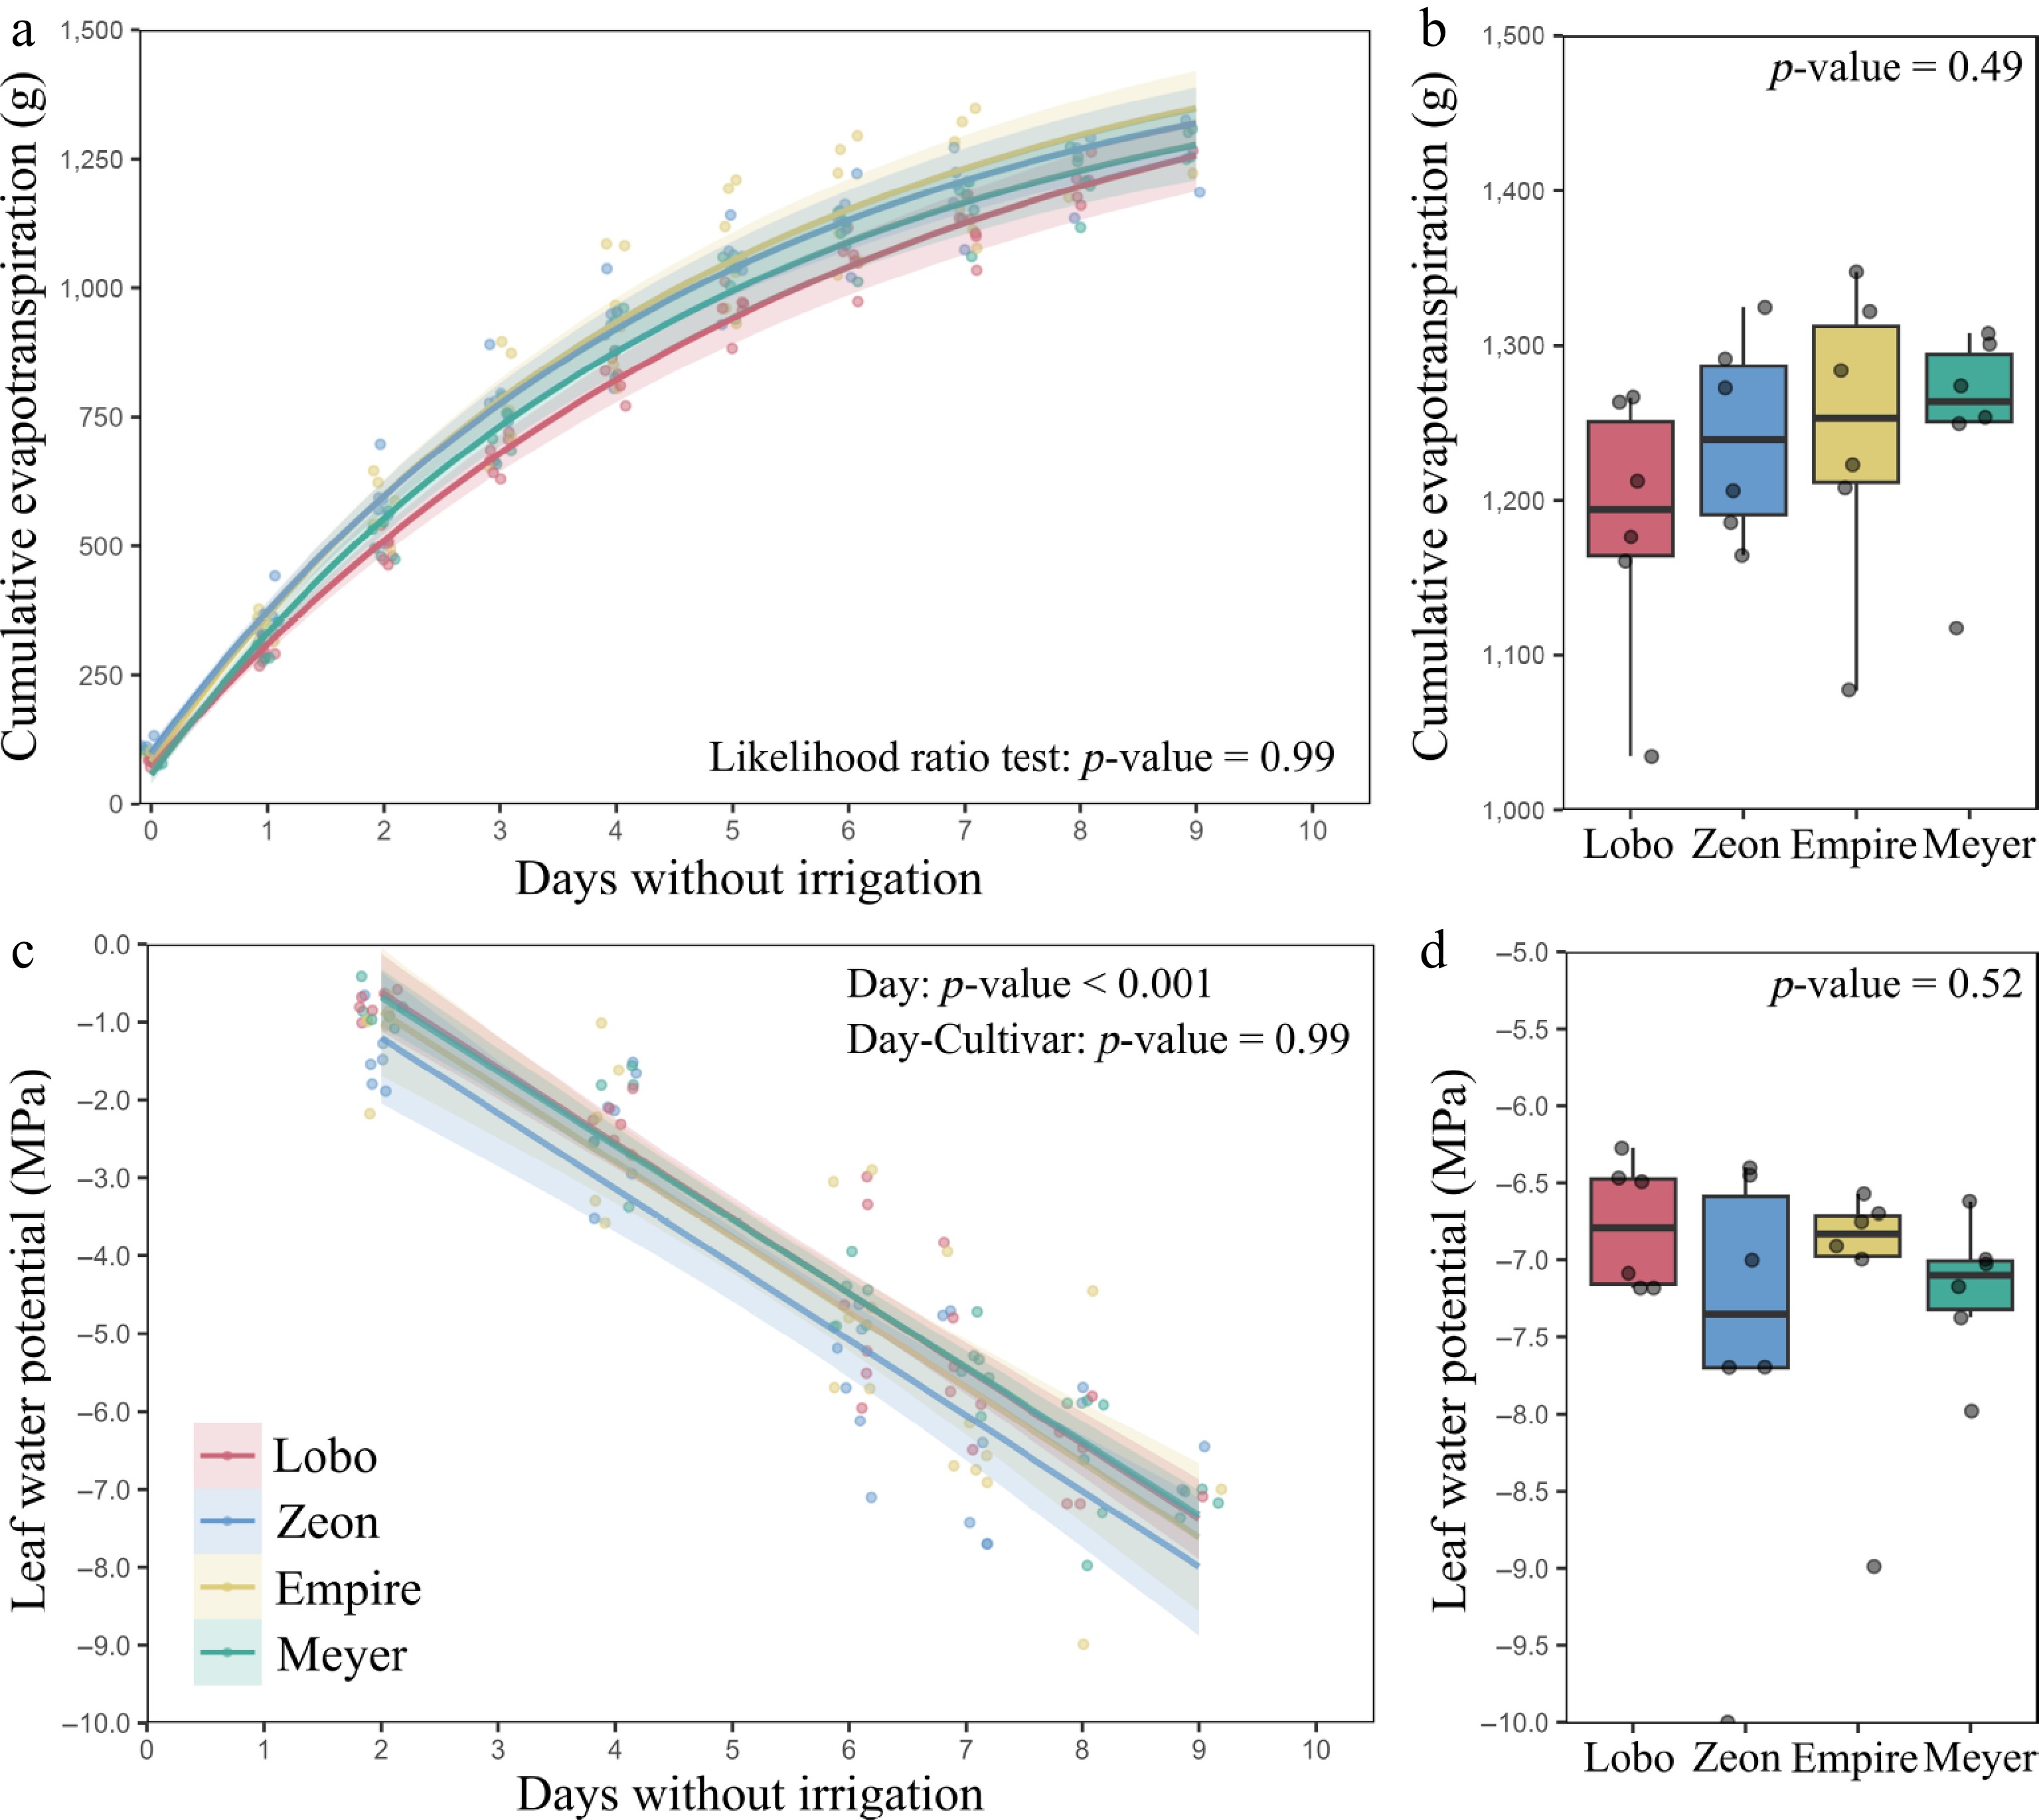
Figure 1.
Changes in cumulative evapotranspiration and leaf water potential during drought under controlled conditions. (a) Plateauing cumulative evapotranspiration after irrigation withholding, and (b) final cumulative evapotranspiration on the last day of drought. (c) Declines in leaf water potential after irrigation withholding, and (d) minimum leaf water potential on the last day of drought. Data are for four zoysiagrass cultivars (n = 6). Lines in (a) and (c) represent curve fits to data points, and shadings represent 95% confidence intervals. Parameters for the curves are present in the Supplementary Table S2. The p-value in (a) was calculated using a likelihood ratio test, and the p-values in (b)−(d) were calculated using ANOVA.
-
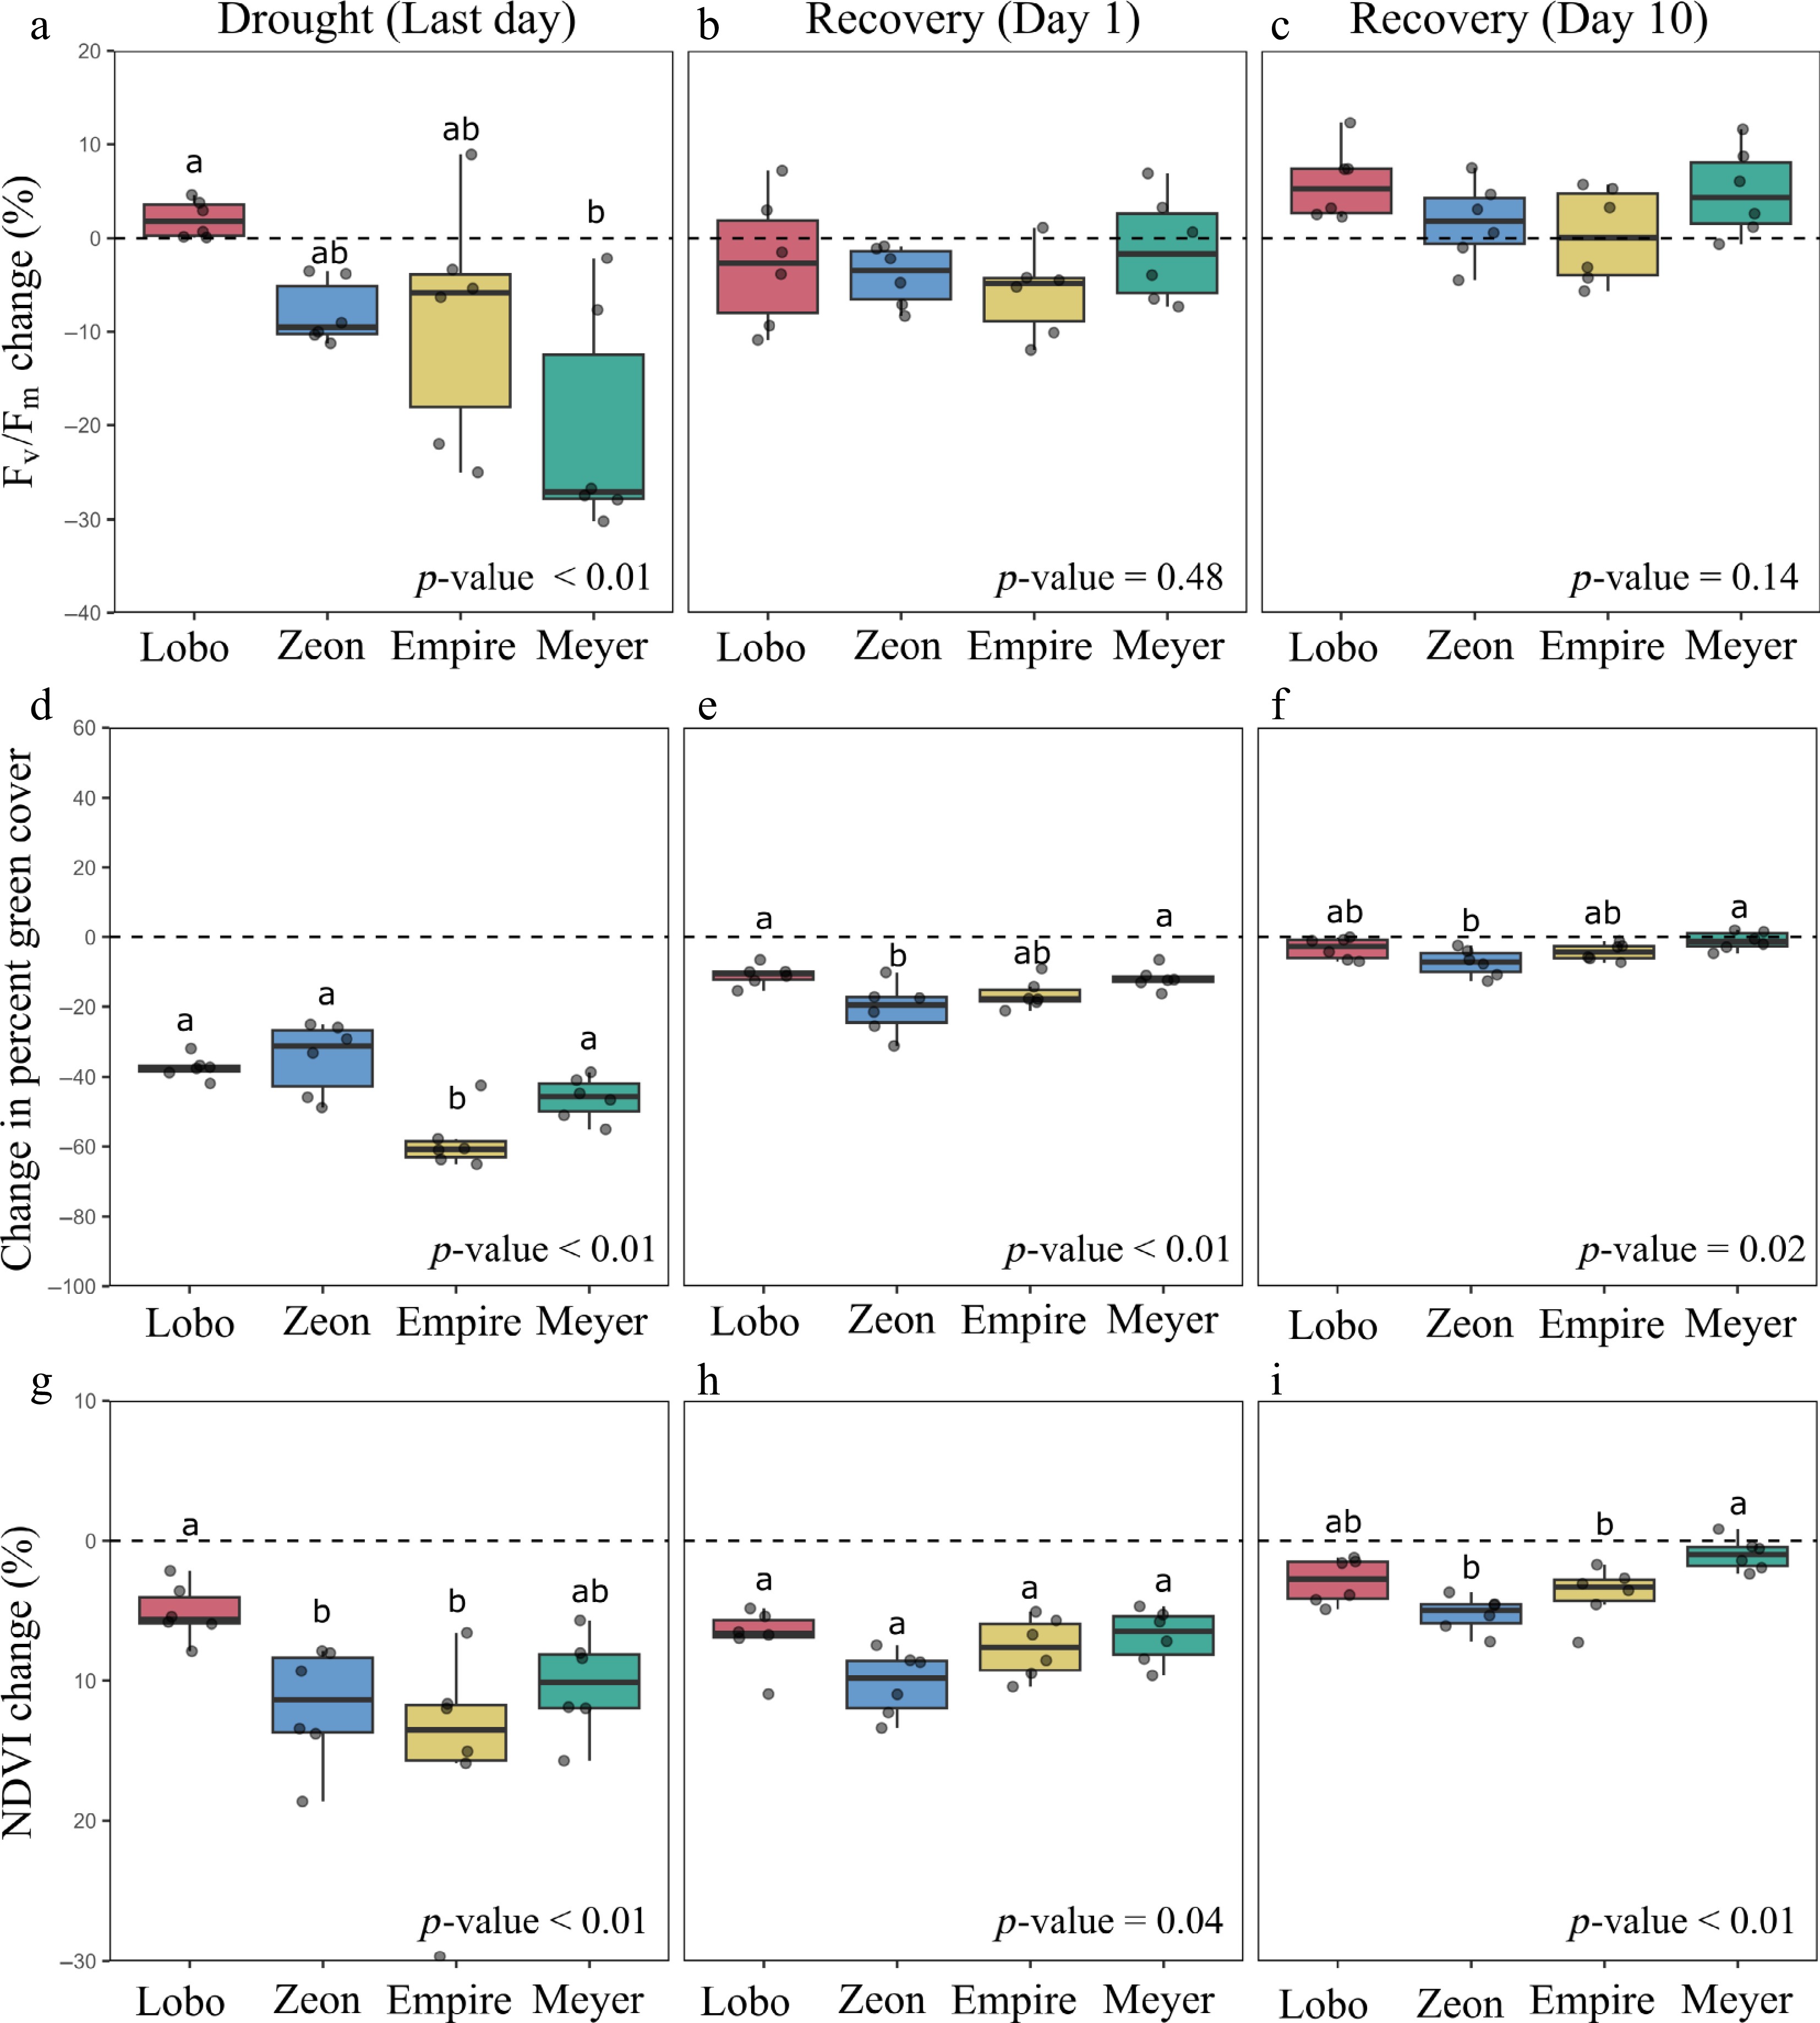
Figure 2.
Changes at the leaf and canopy levels during and after drought under controlled conditions. Percent changes in maximum photochemical quantum yield of photosystem II (Fv/Fm), canopy green cover, and normalized difference vegetation index (NDVI) on the (a)–(c) last day of drought as well as on the (d)–(f) first, and (g)–(i) tenth days of recovery. Percent changes were calculated based on values obtained prior to the drought (represented by the dashed lines). Data are for four zoysiagrass cultivars (n = 6). Original values are present in the Supplementary Data 1. The p-values were calculated using ANOVA, and different letters denote statistical differences among cultivars according to Tukey's test (p-value < 0.05). In (a), (c), p-values were calculated using Kruskal-Wallis, and different letters denote statistical differences among cultivars according to Dunn's test with Bonferroni correction.
-
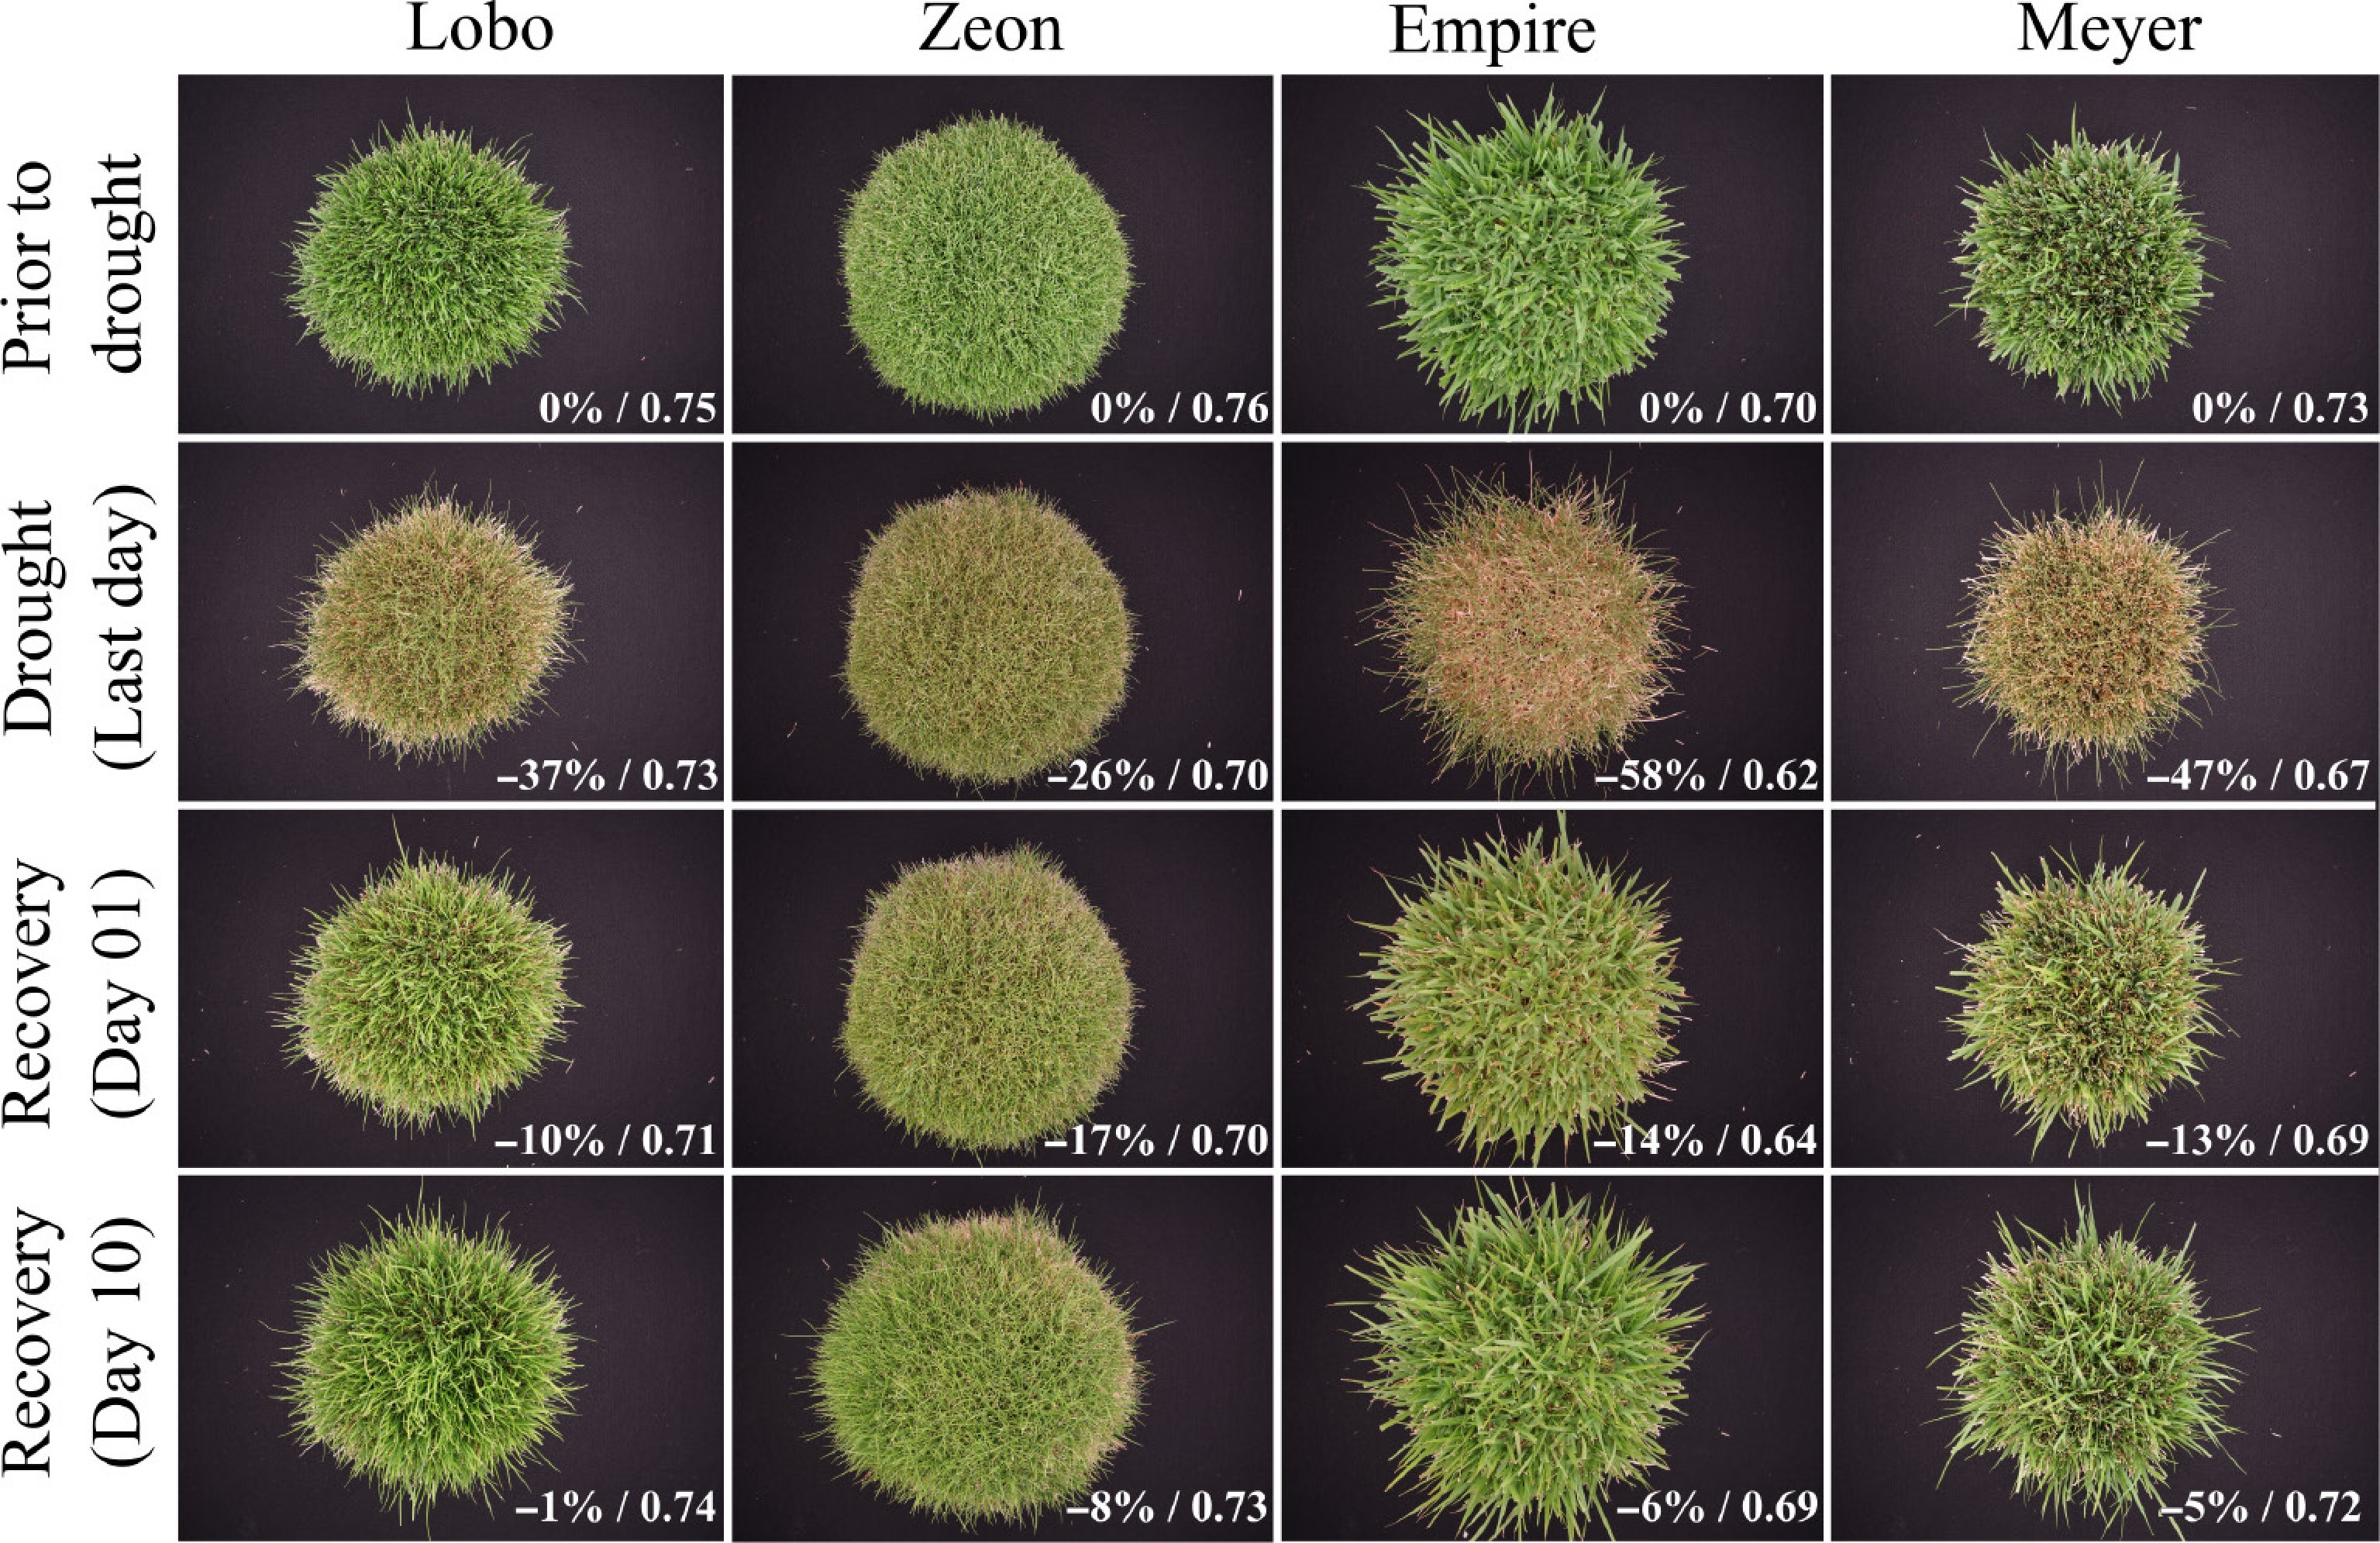
Figure 3.
Changes in canopy during and after drought under controlled conditions. Sequence of canopy appearance of plants from four zoysiagrass cultivars before the drought, on the last day of the drought, and during the recovery (first and tenth d). Values at the bottom right are percentage changes in green cover relative to the control and NDVI for the specific plants represented in this image. For size reference, pot diameter = 15 cm.
-
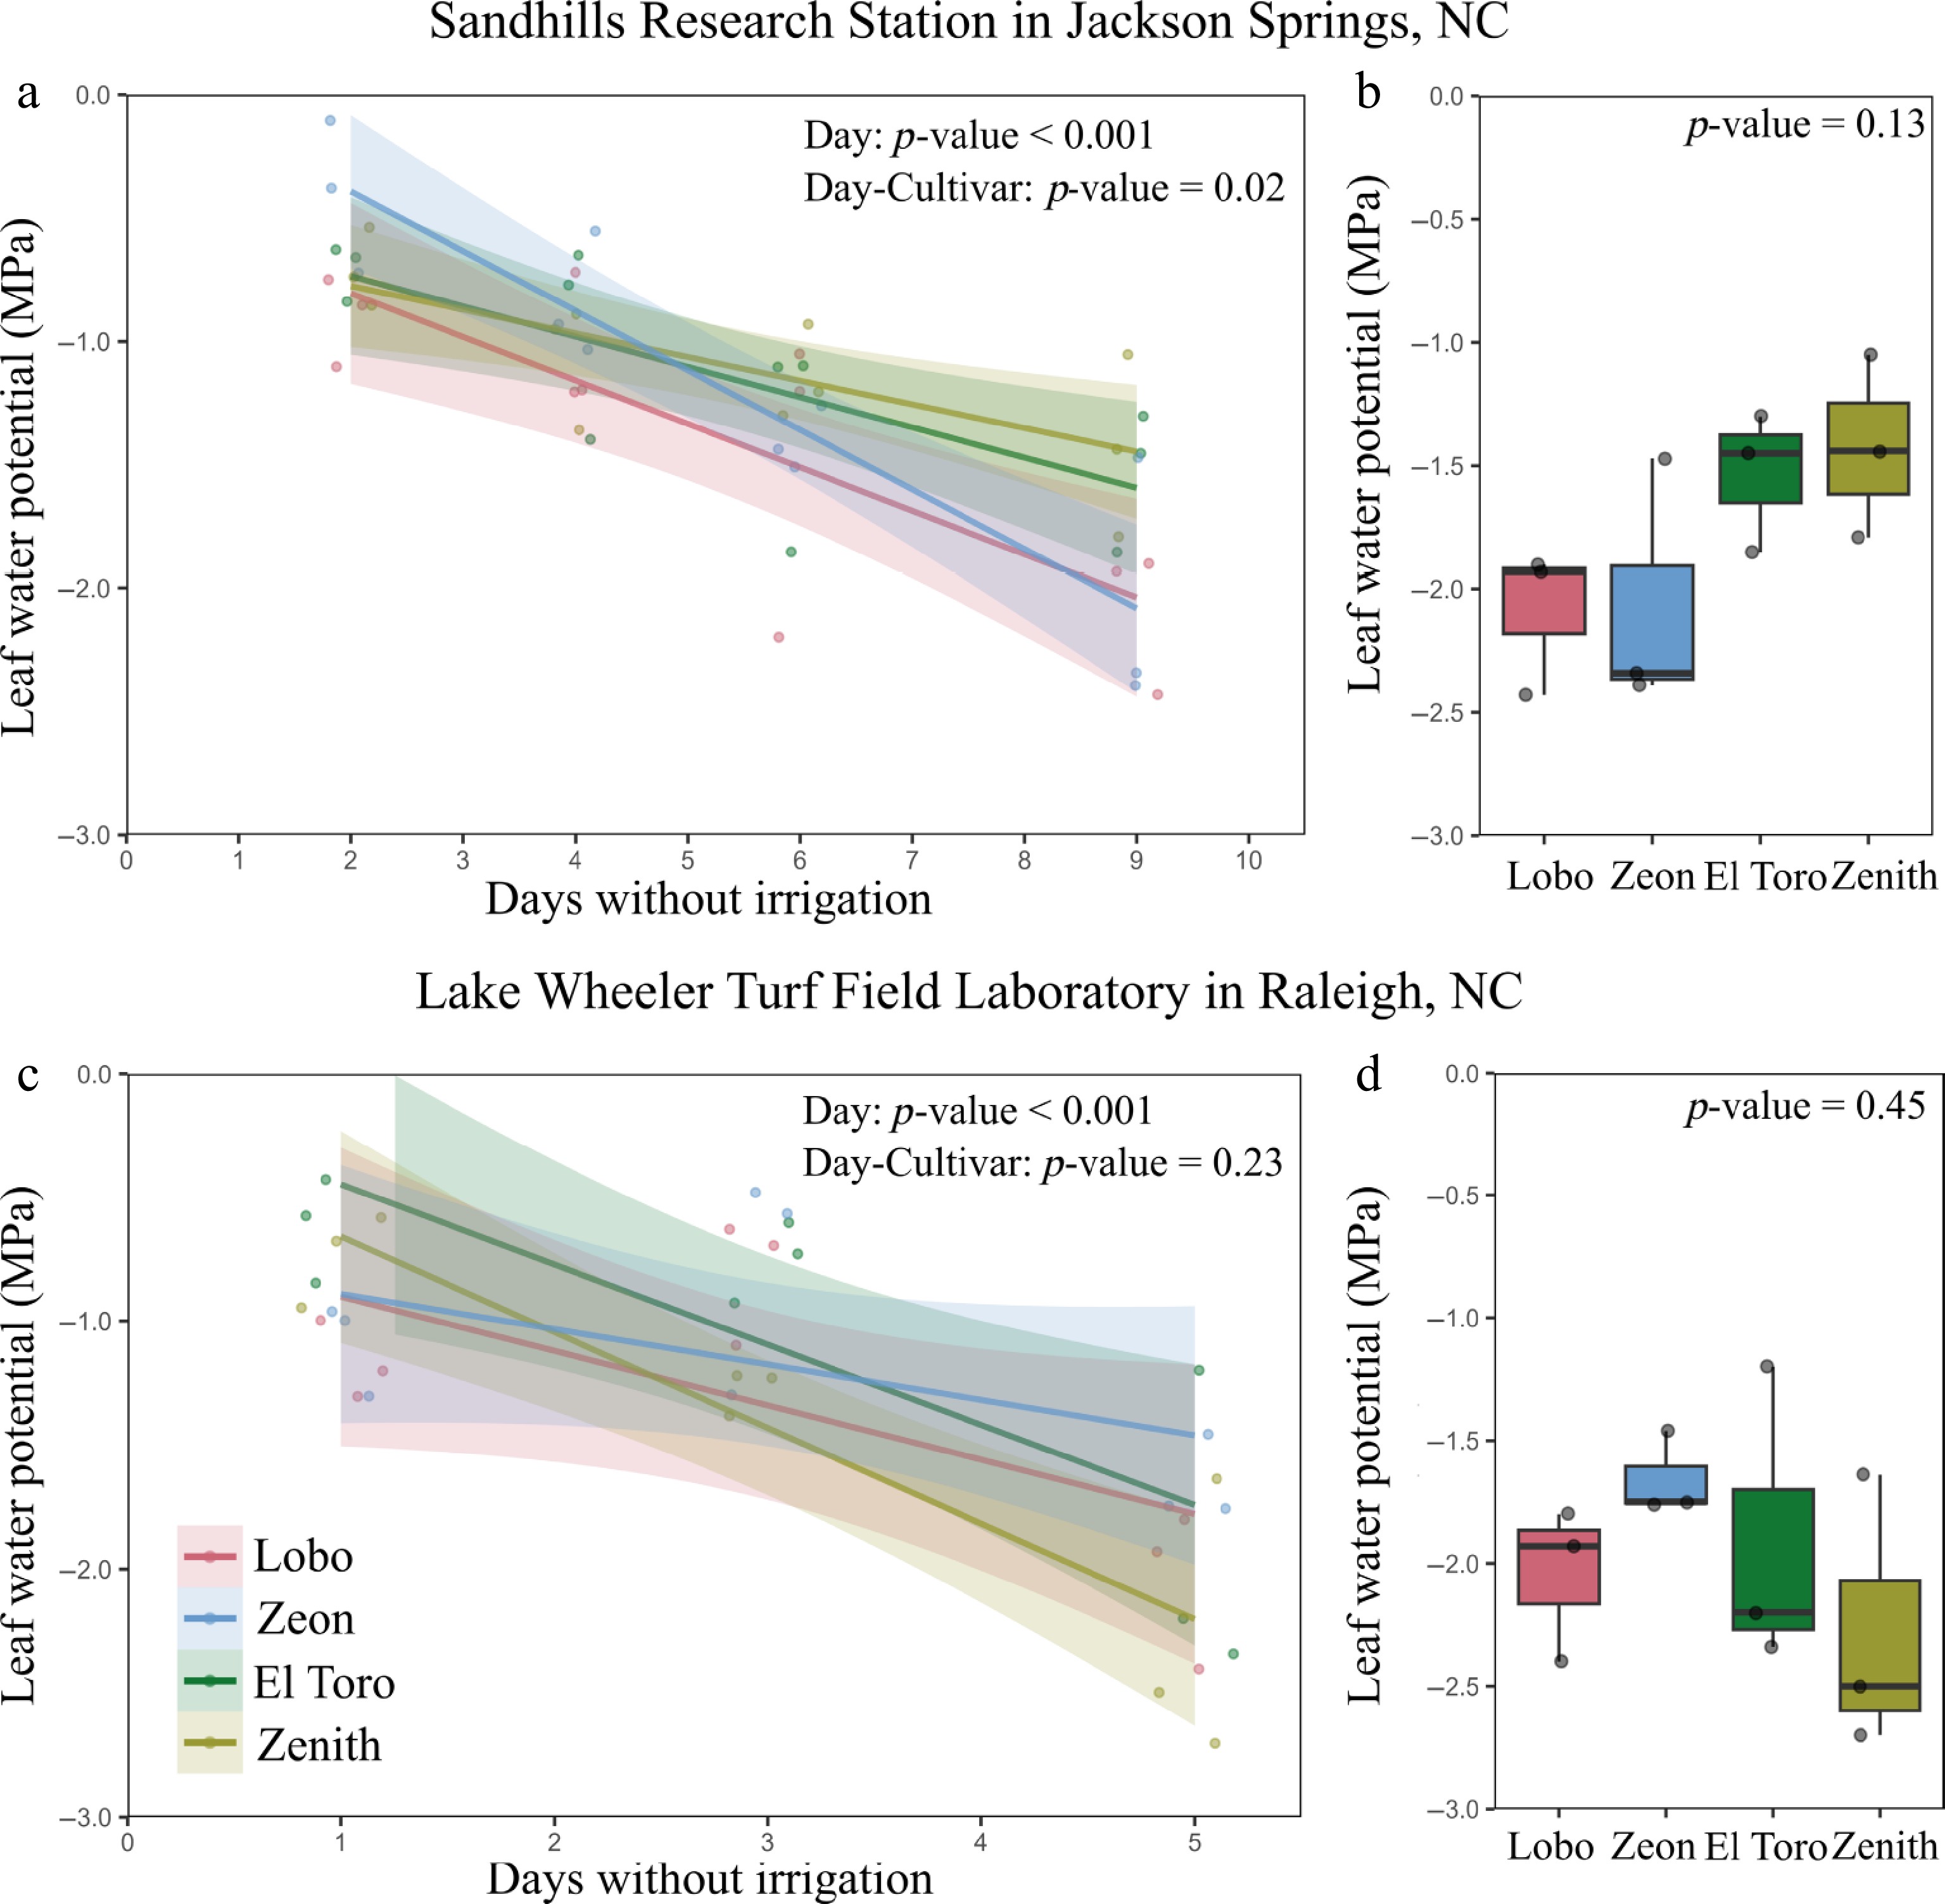
Figure 4.
Changes in leaf water potential during natural field droughts. (a) Declines in leaf water potential with days without irrigation during a rain-free period at Sandhills Research Station in Jackson Springs, NC, USA, and (b) minimum leaf water potential on the last day of drought. (c) Declines in leaf water potential with days without irrigation during a rain-free period at Lake Wheeler Turf Field Laboratory in Raleigh, NC, USA, and (d) minimum leaf water potential on the last day of drought. Data are for four zoysiagrass cultivars (n = 3). Lines in (a) and (c) represent curve fits to data points, and shadings represent 95% confidence intervals. Parameters for the curves are present in the Supplementary Table S3. The p-values were calculated using ANOVA.
-
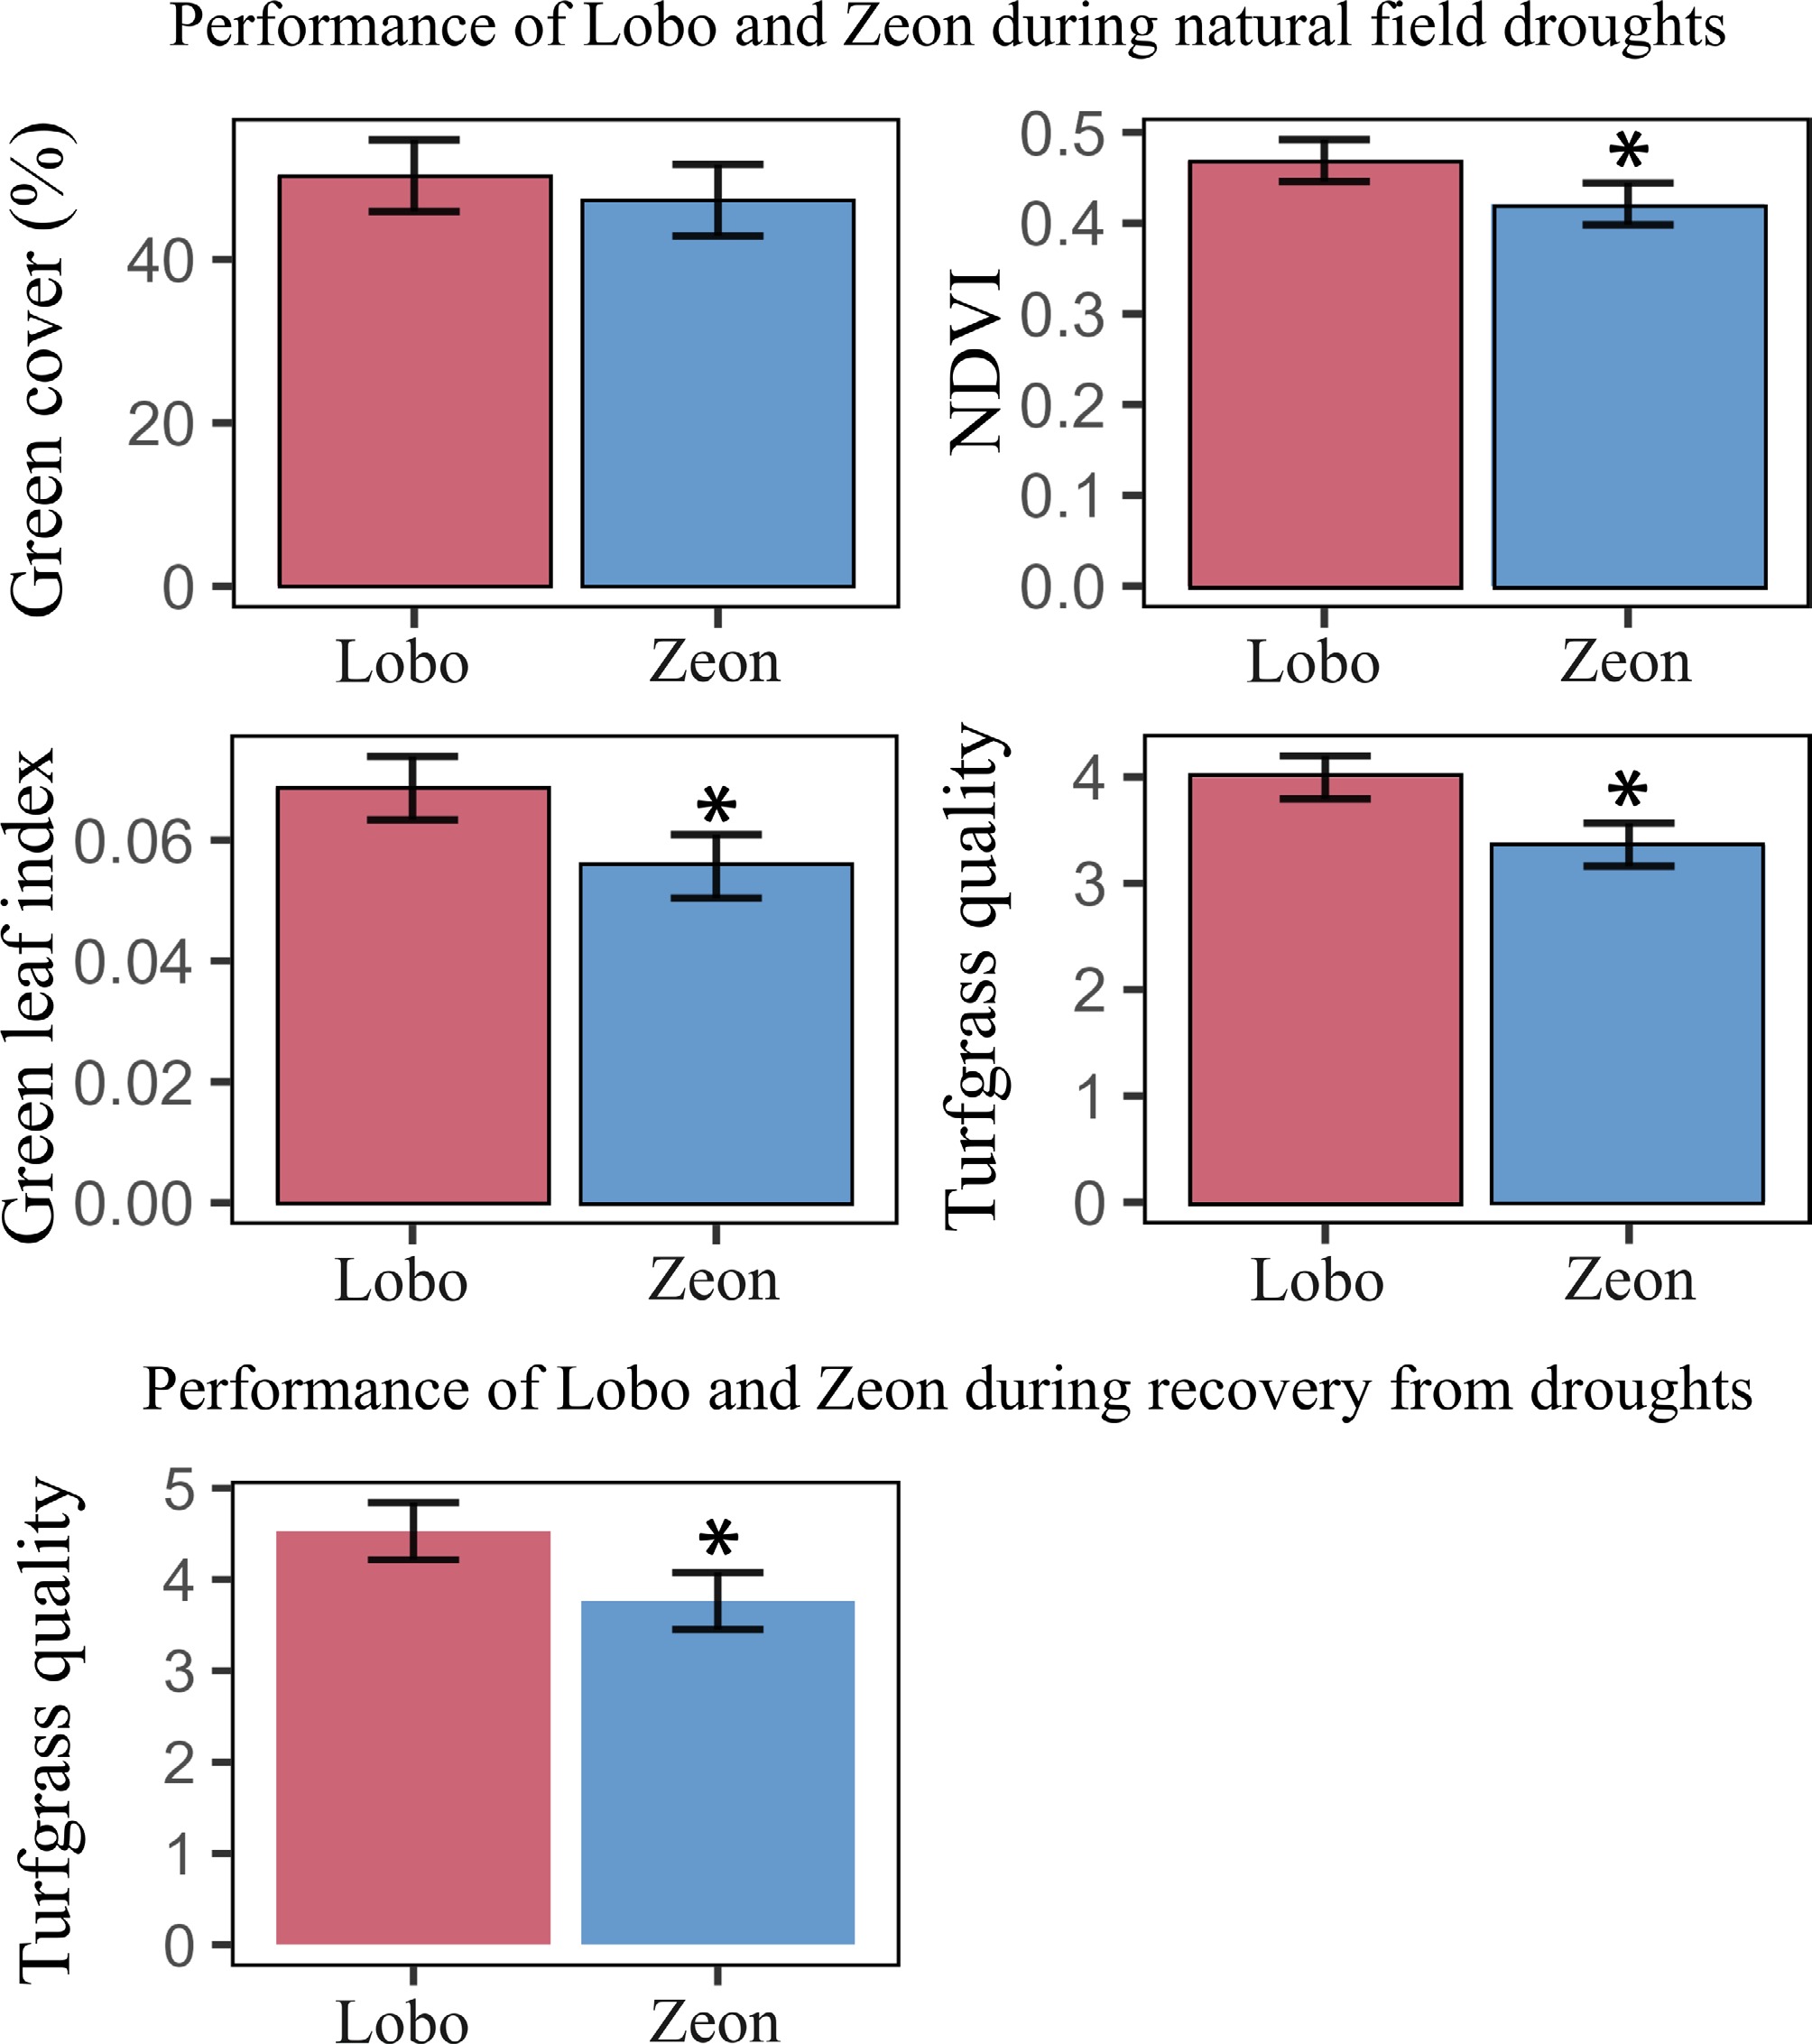
Figure 5.
Critical turfgrass traits of Lobo and Zeon during natural field droughts and recovery. Best linear unbiased estimates for percent green ground cover, normalized difference vegetation index (NDVI), green leaf index, and turfgrass quality for Lobo and Zeon evaluated in field trials from 2020−2023 across eight locations in the southern US. Error bars represent the least significant difference. Asterisks denote statistical differences between cultivars according to the least significant difference.
Figures
(5)
Tables
(0)