-
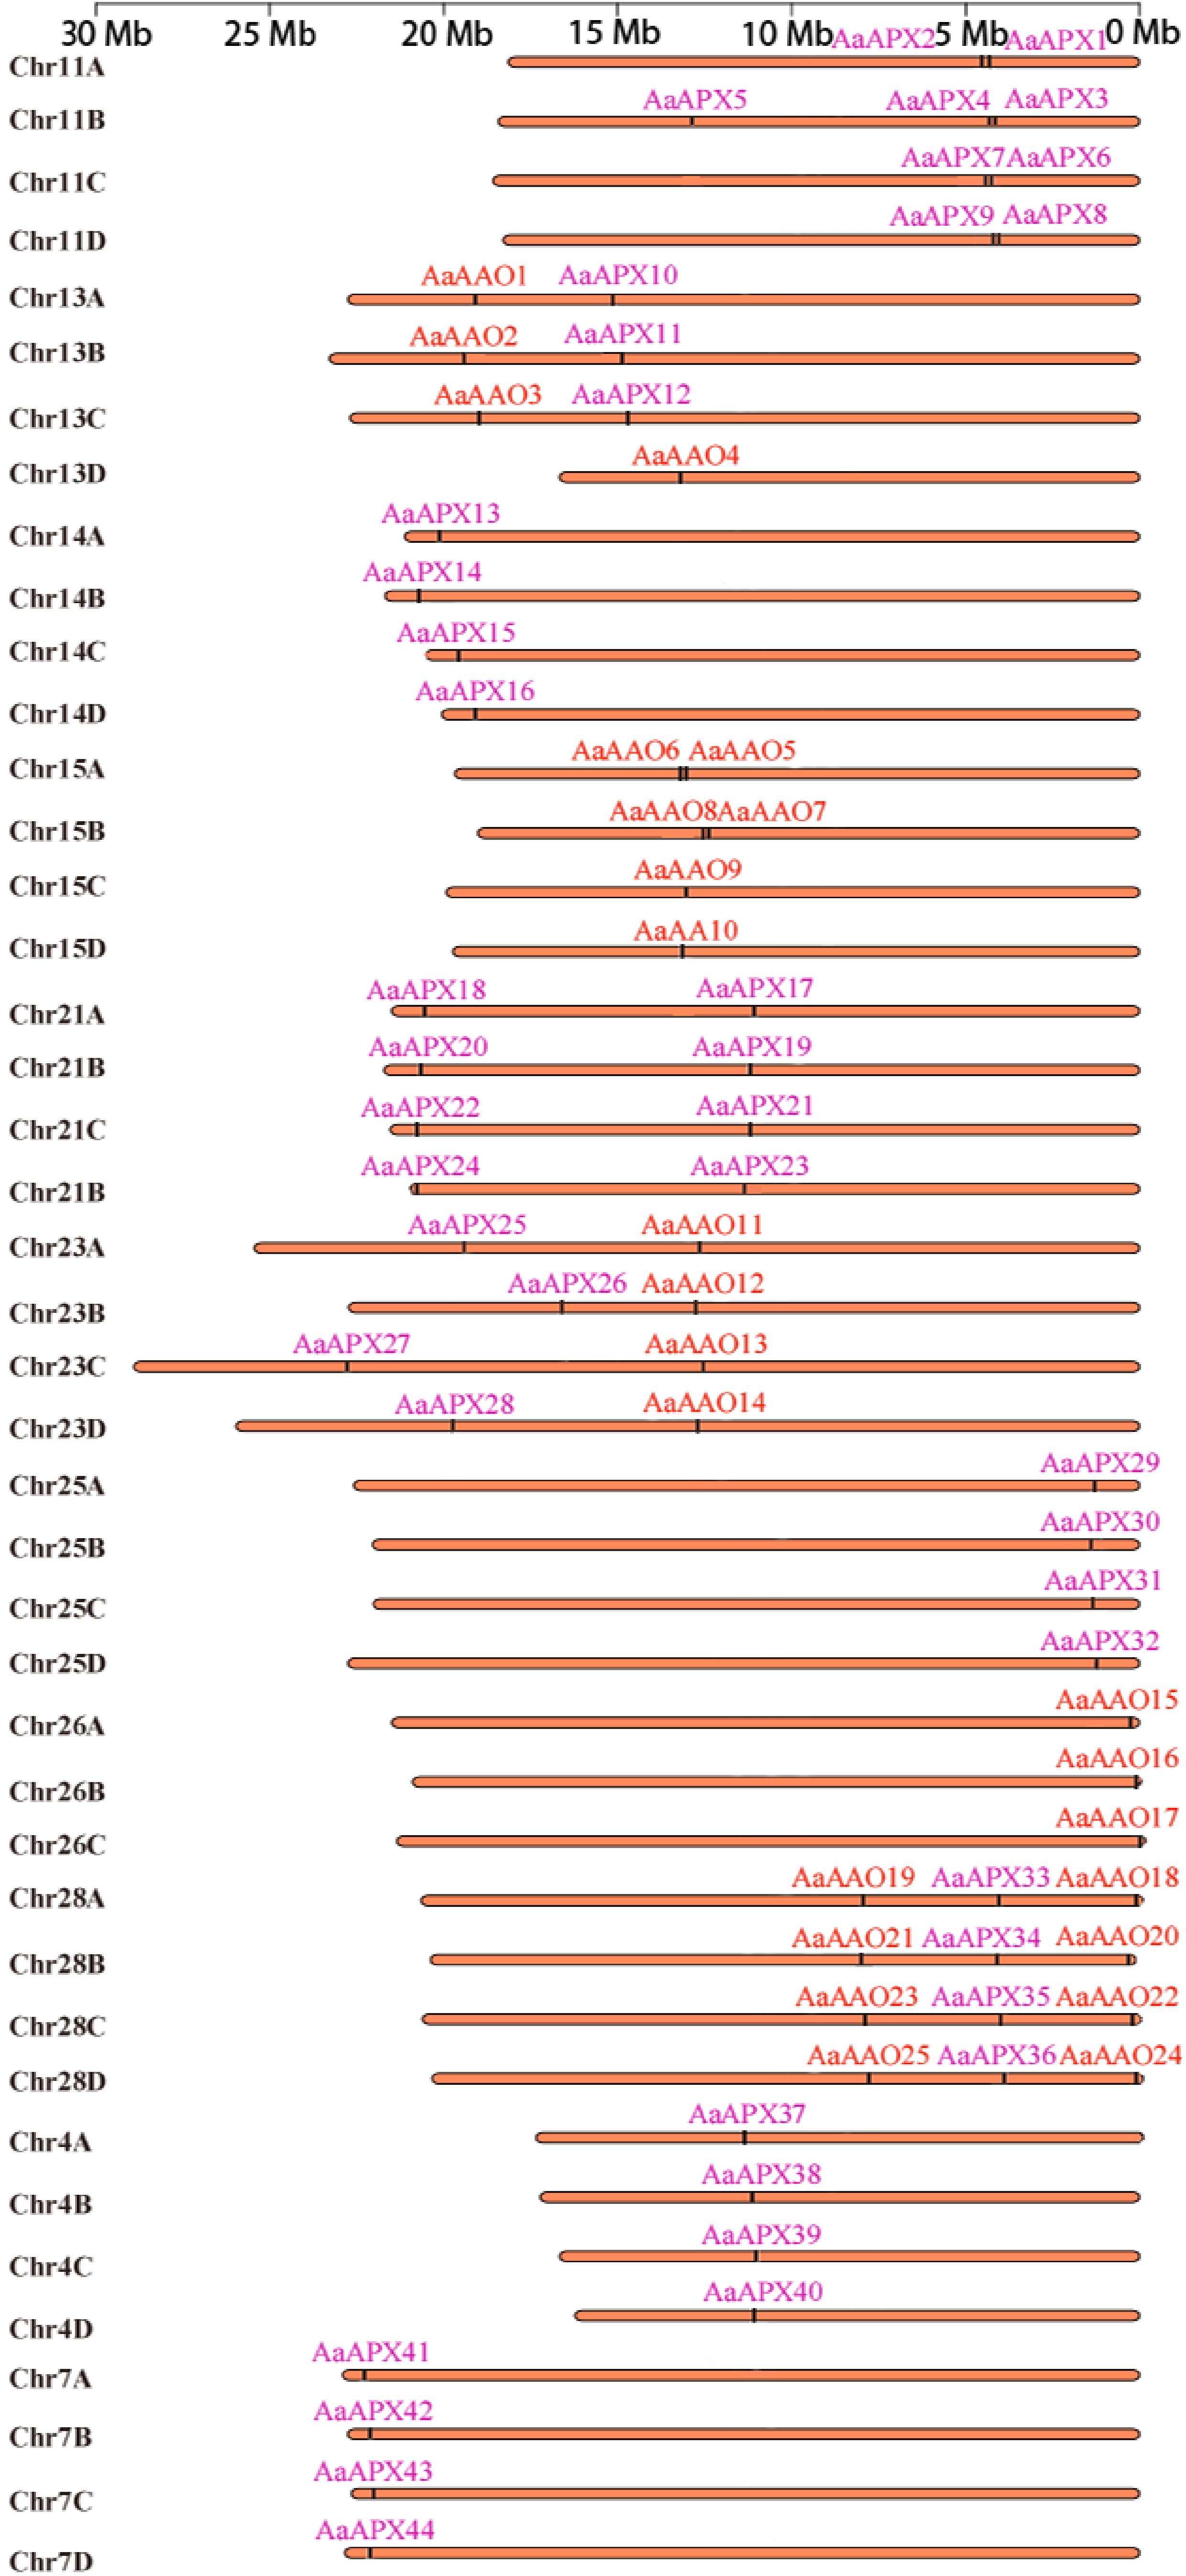
Figure 1.
Distribution of AaAAO and AaAPX genes on chromosome of A. arguta.
-
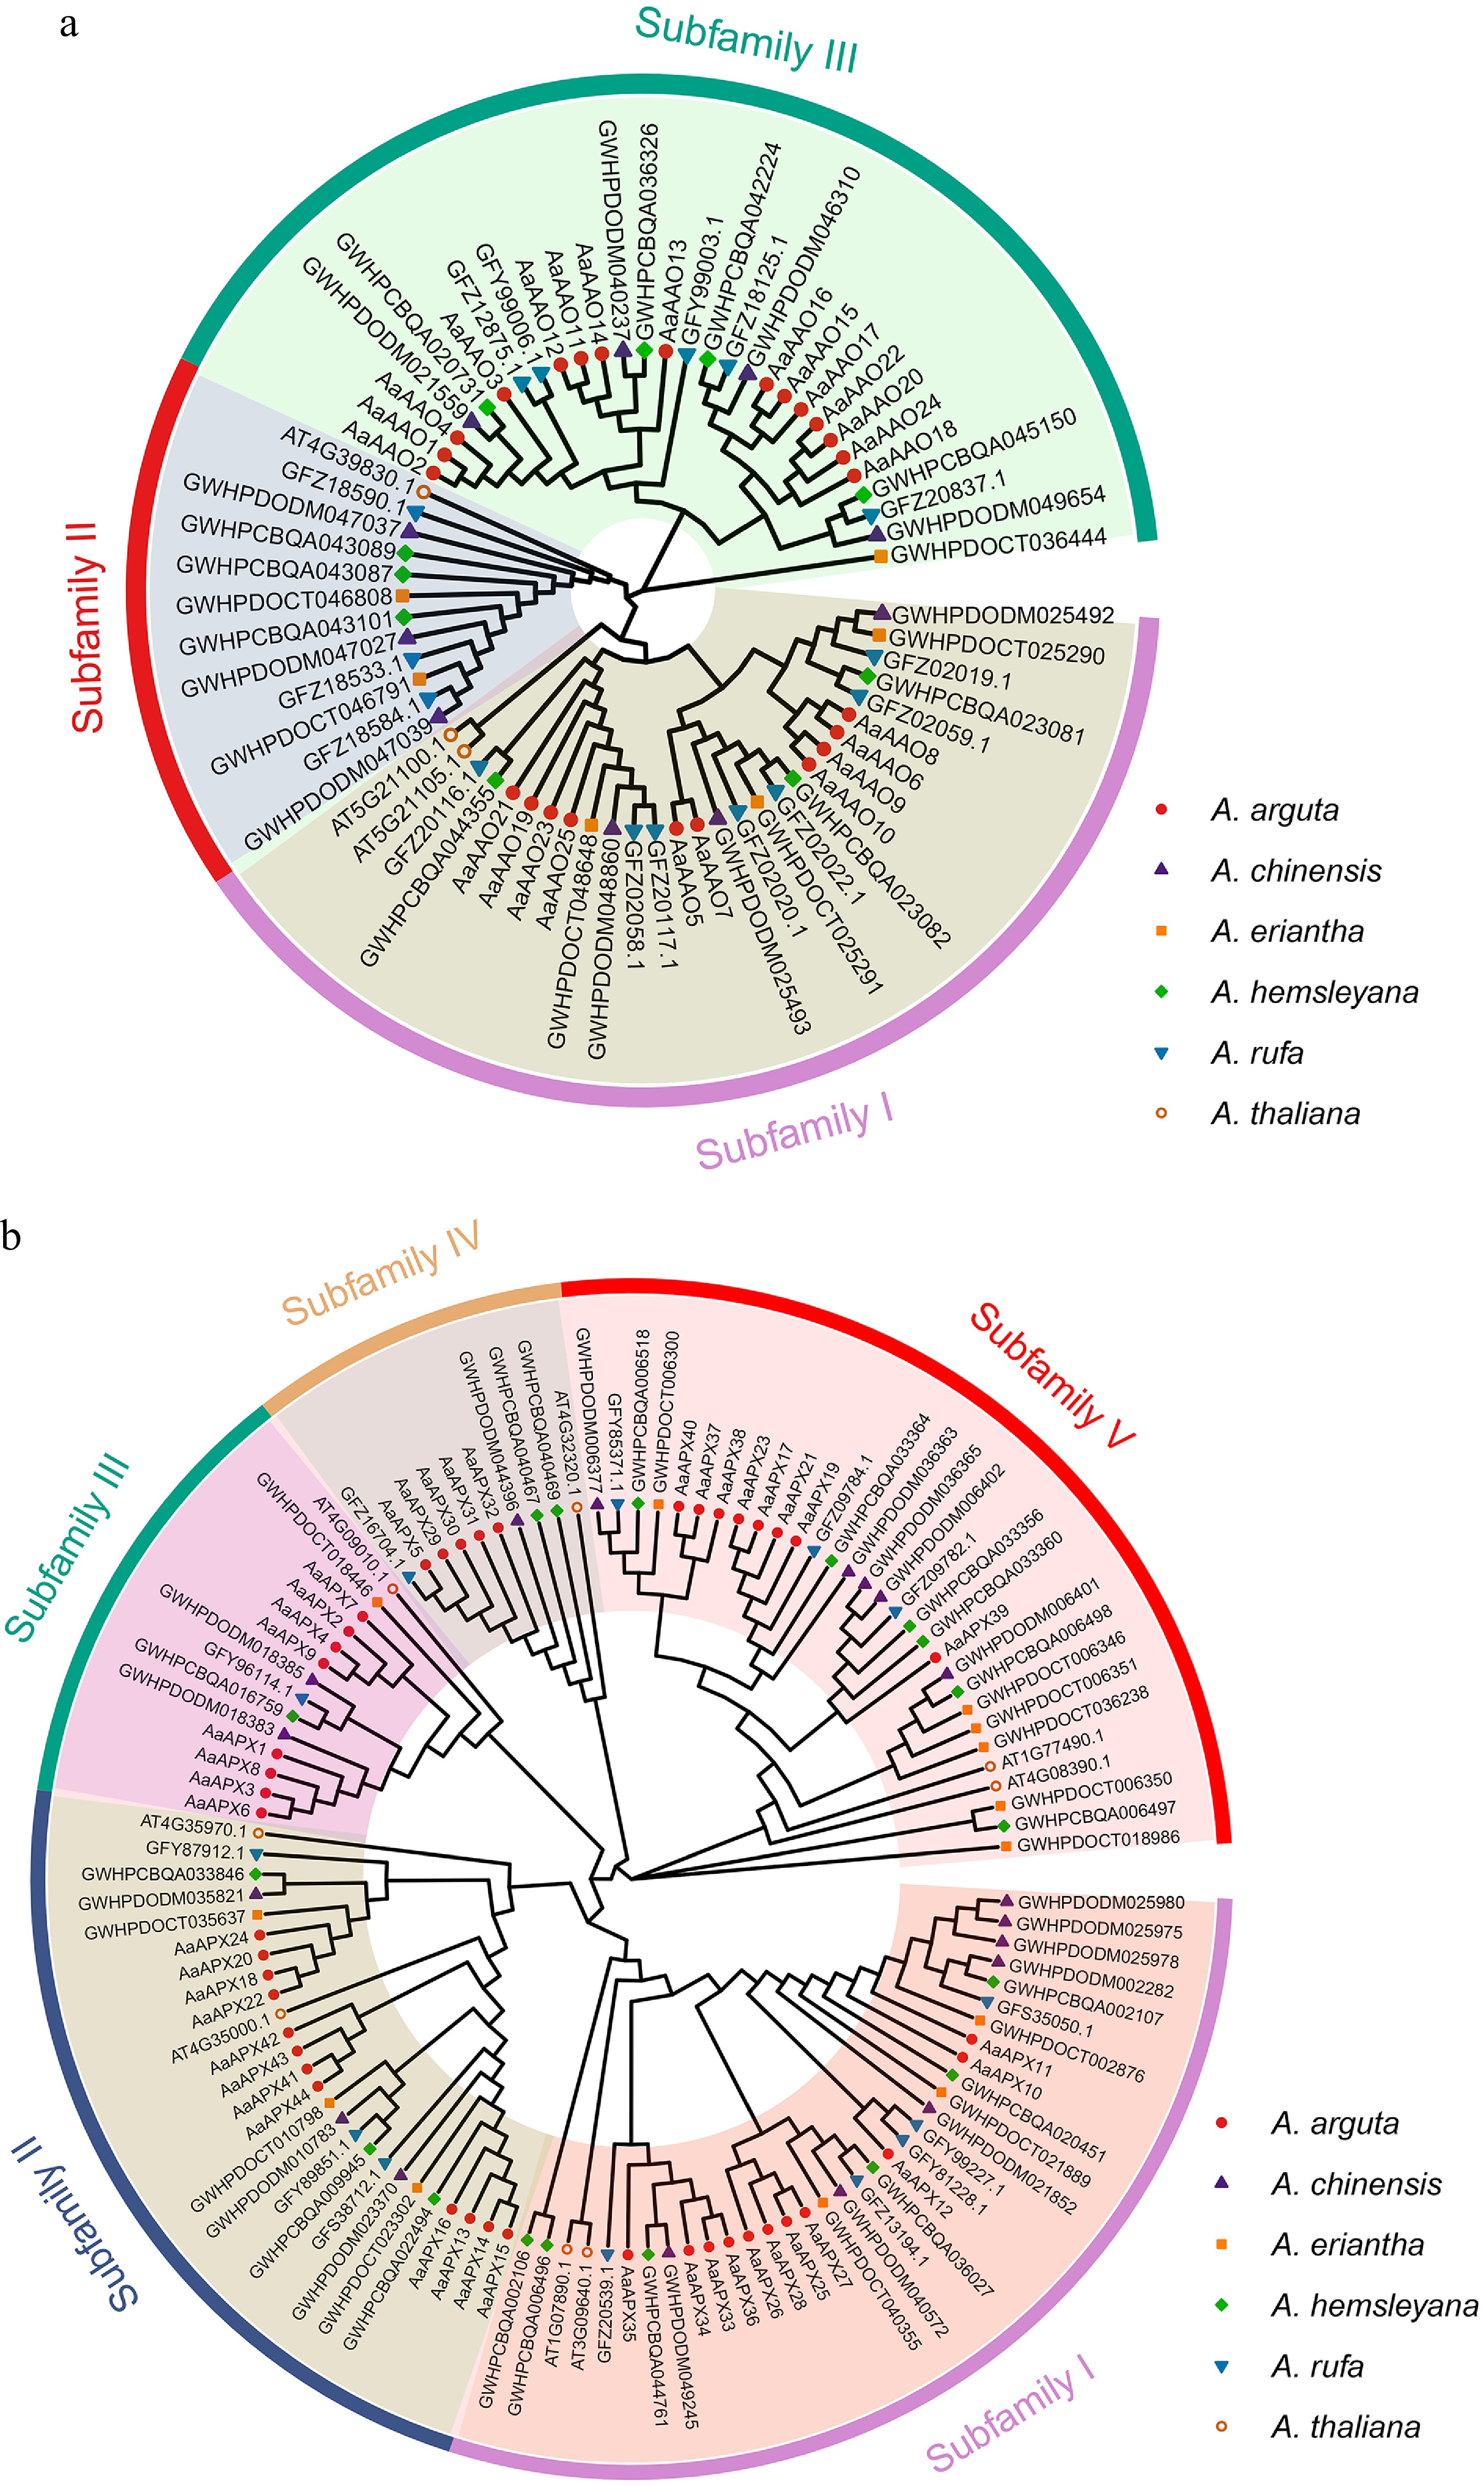
Figure 2.
Phylogenetic analyses of the (a) AAO, and (b) APX families from five Actinidia species and Arabidopsis. Colored outer rings represent diverse subfamilies.
-
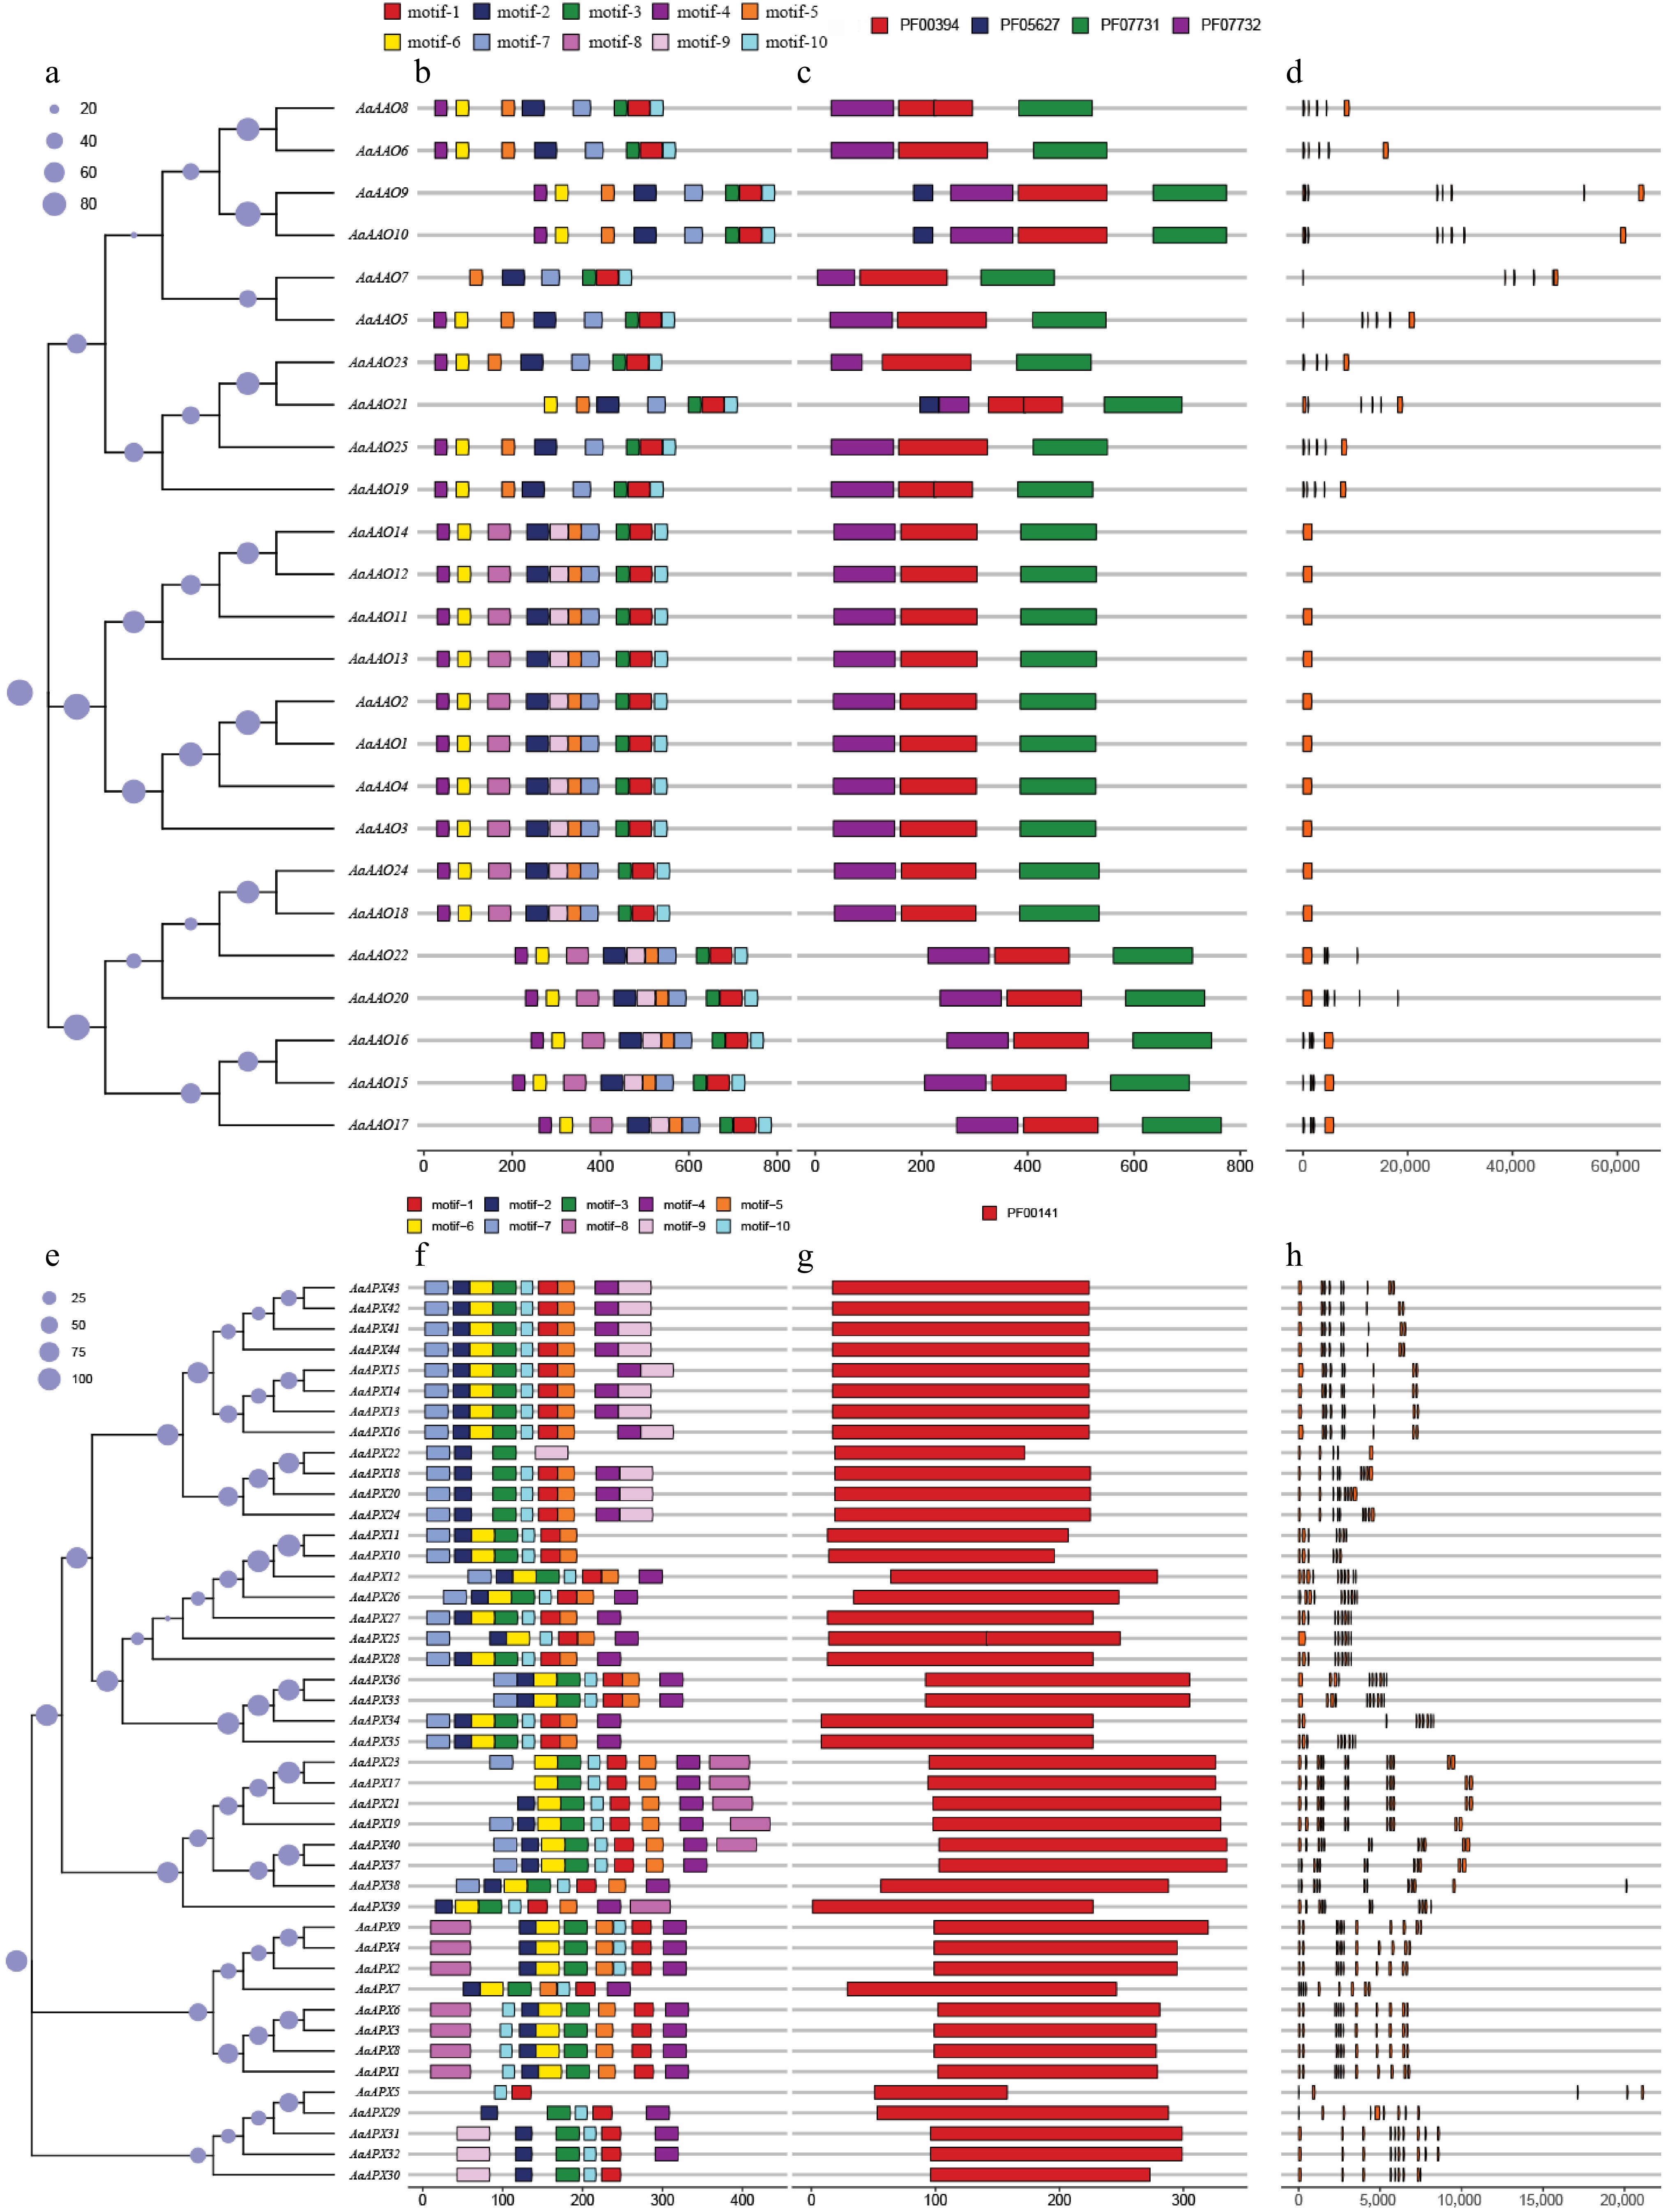
Figure 3.
(a)–(d) shows the analysis of AaAAOs genes, and (e)–(h) shows the analysis of AaAPXs genes. (a), (e) Neighbor-joining trees constructed for AaAAOs and AaAPXs genes, respectively. (b), (f) Protein motifs, with motifs 1–10 displayed in different colored boxes. (c), (g) Conserved domains, represented by different colored boxes. (d), (h) Gene structures, where orange boxes represent CDS.
-
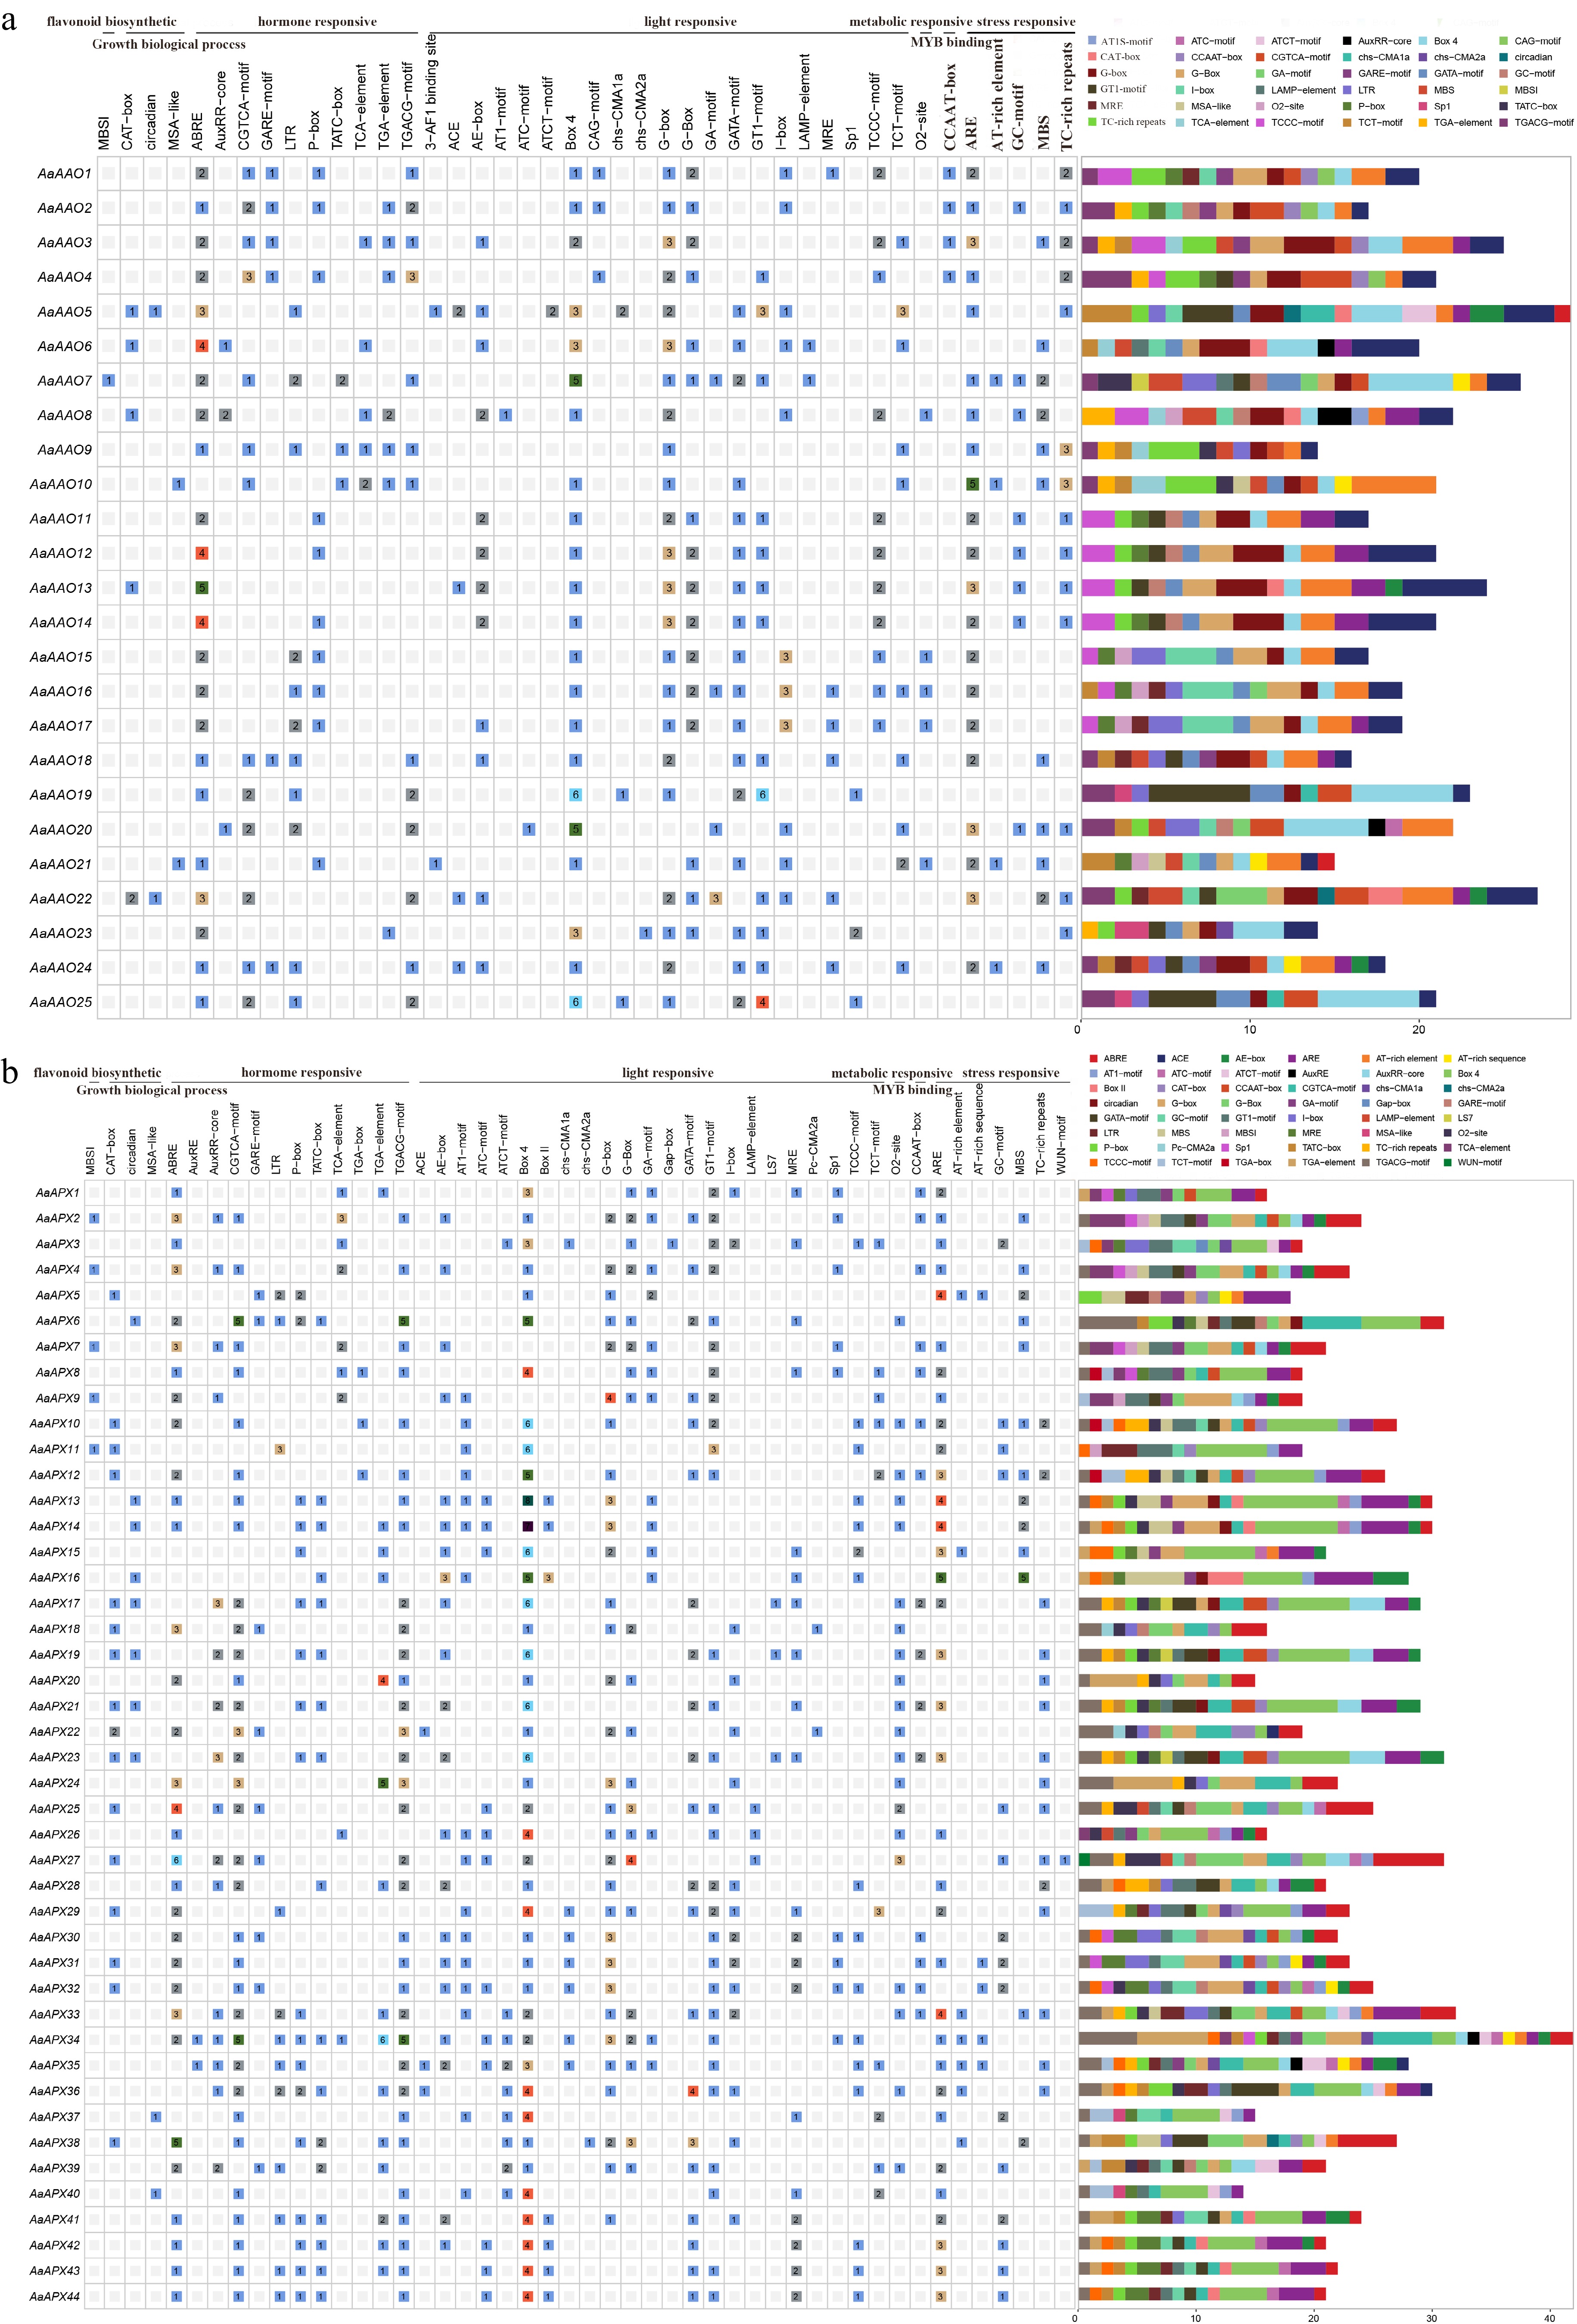
Figure 4.
Predicted cis-elements within the 2,000 bp upstream region of AaAAO and AaAPX genes. Different colors indicate distinct cis-element categories, with numbers displayed in the corresponding boxes. (a) AAO gene family. (b) APX gene family.
-
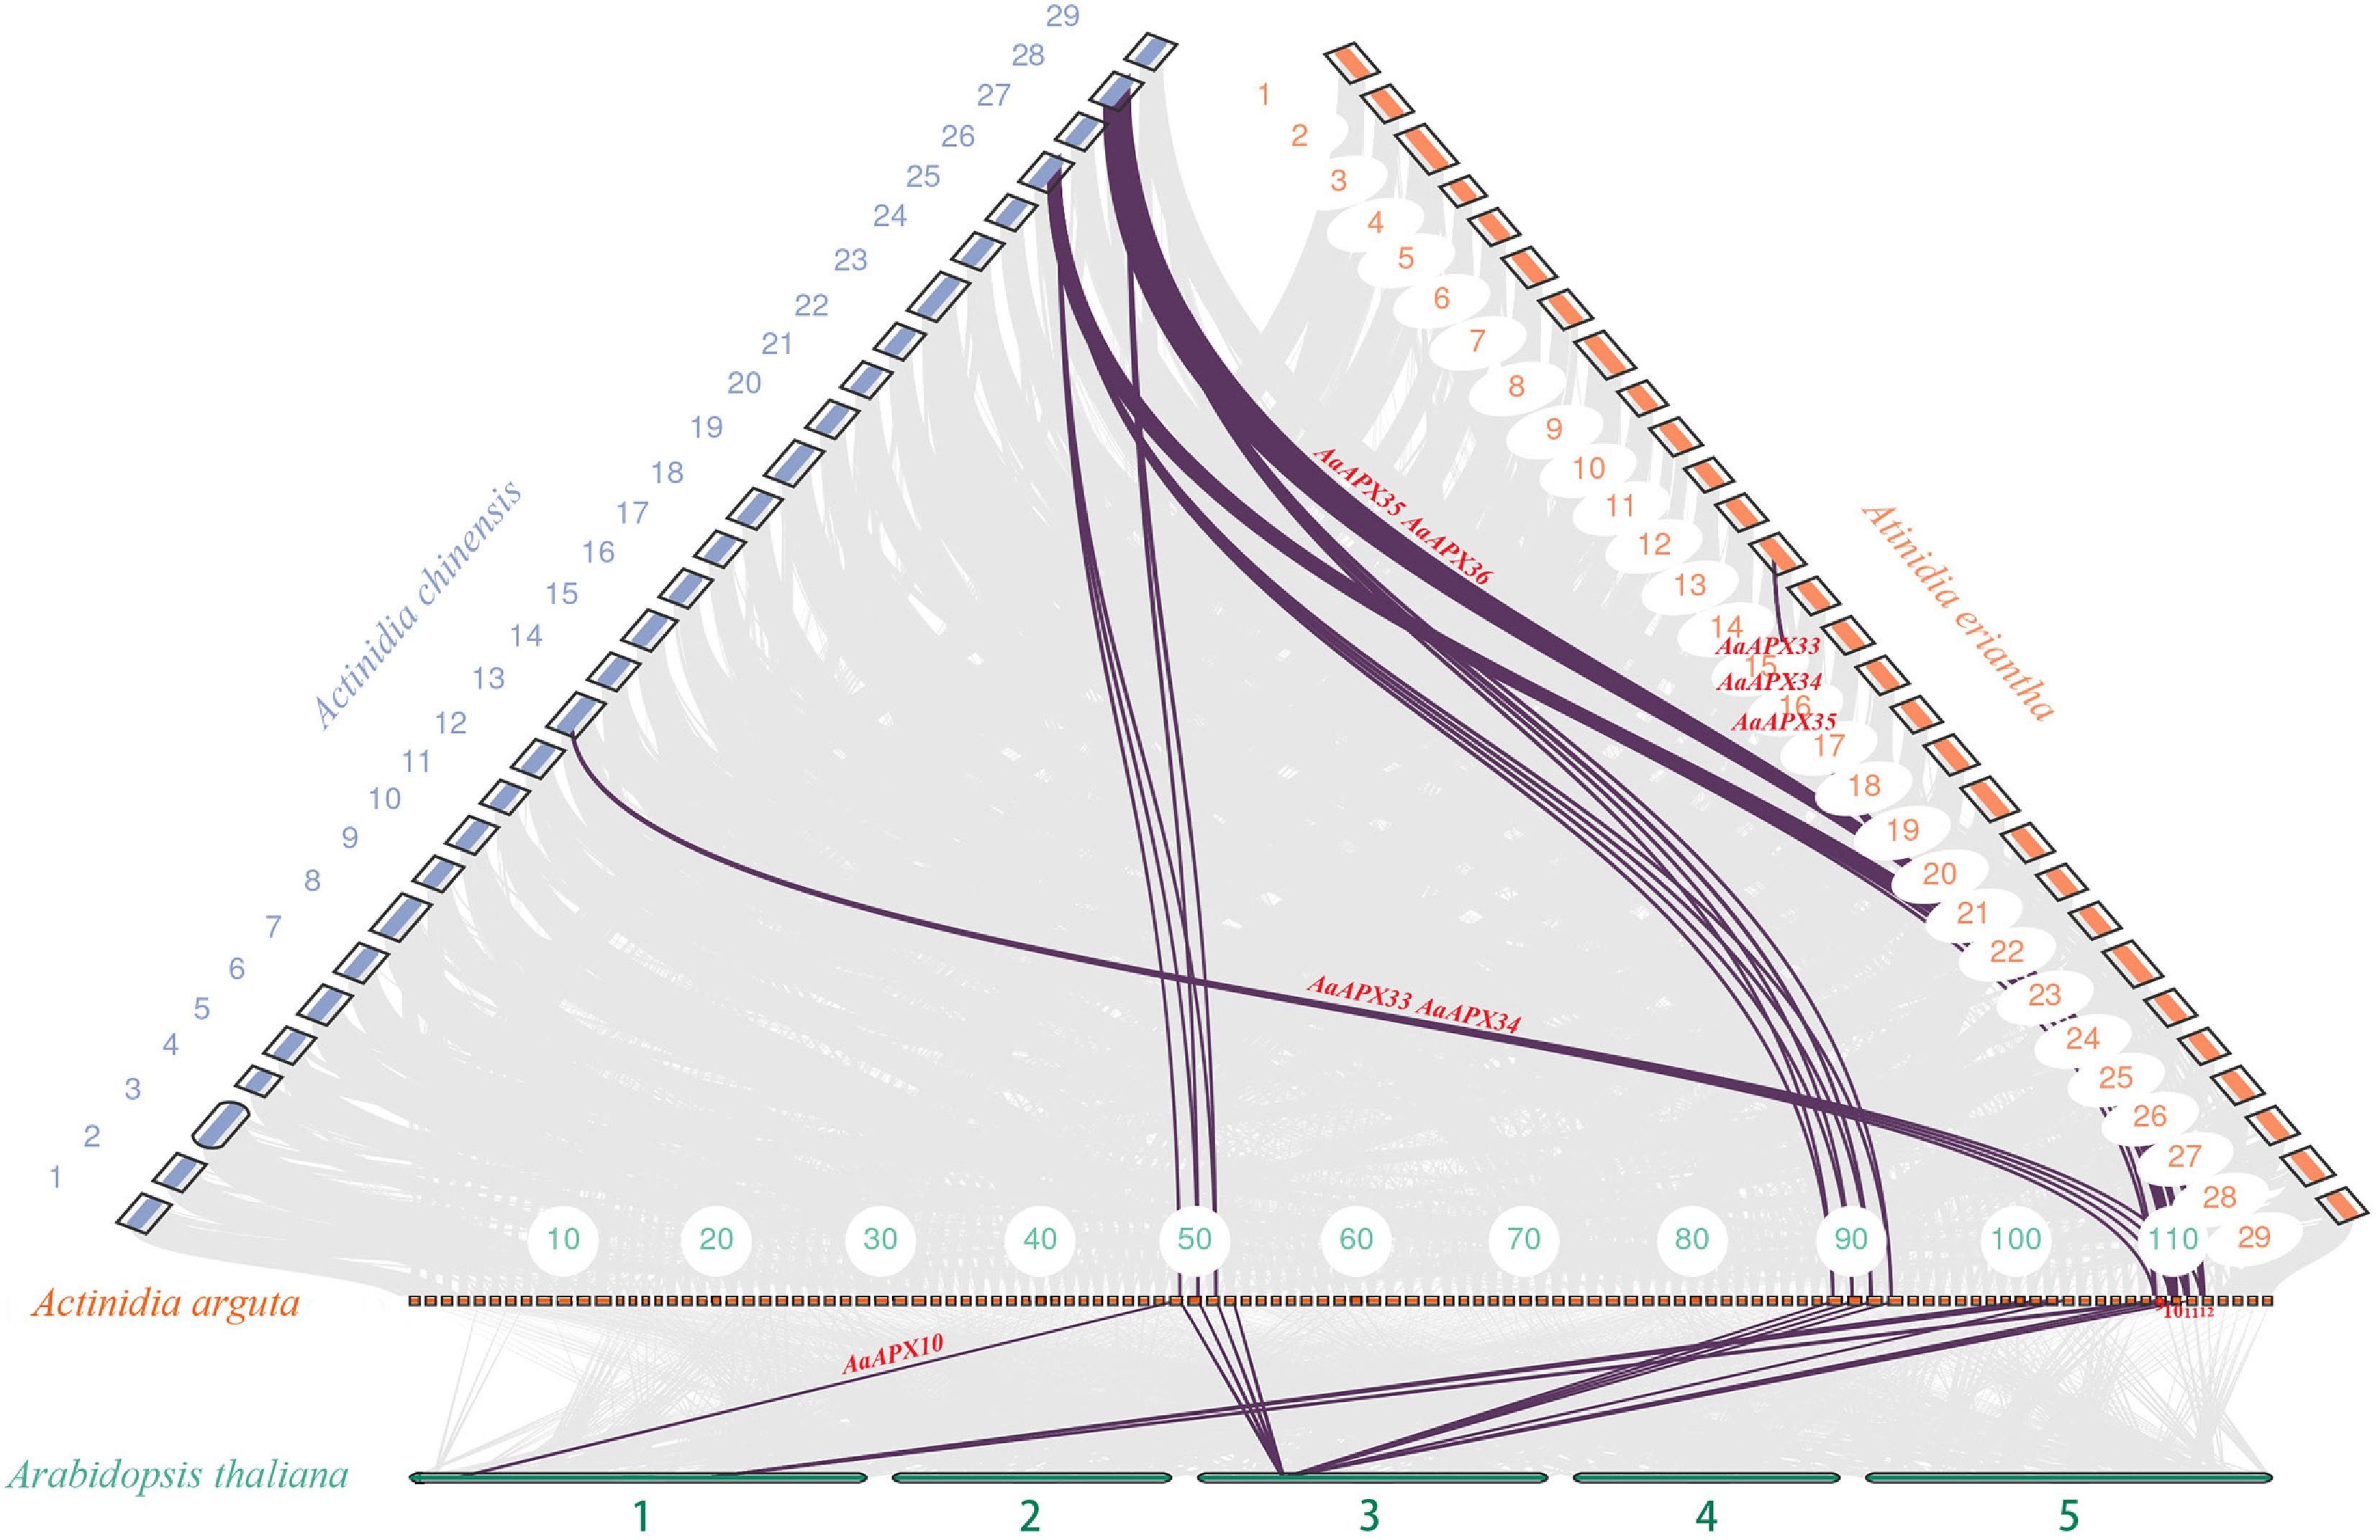
Figure 5.
Collinearity analysis of the APX gene family between A. arguta and three related species (A. thaliana, A. chinensis, and A. eriantha). Gray lines indicate overall collinear regions, while colored lines denote orthologous gene pairs.
-
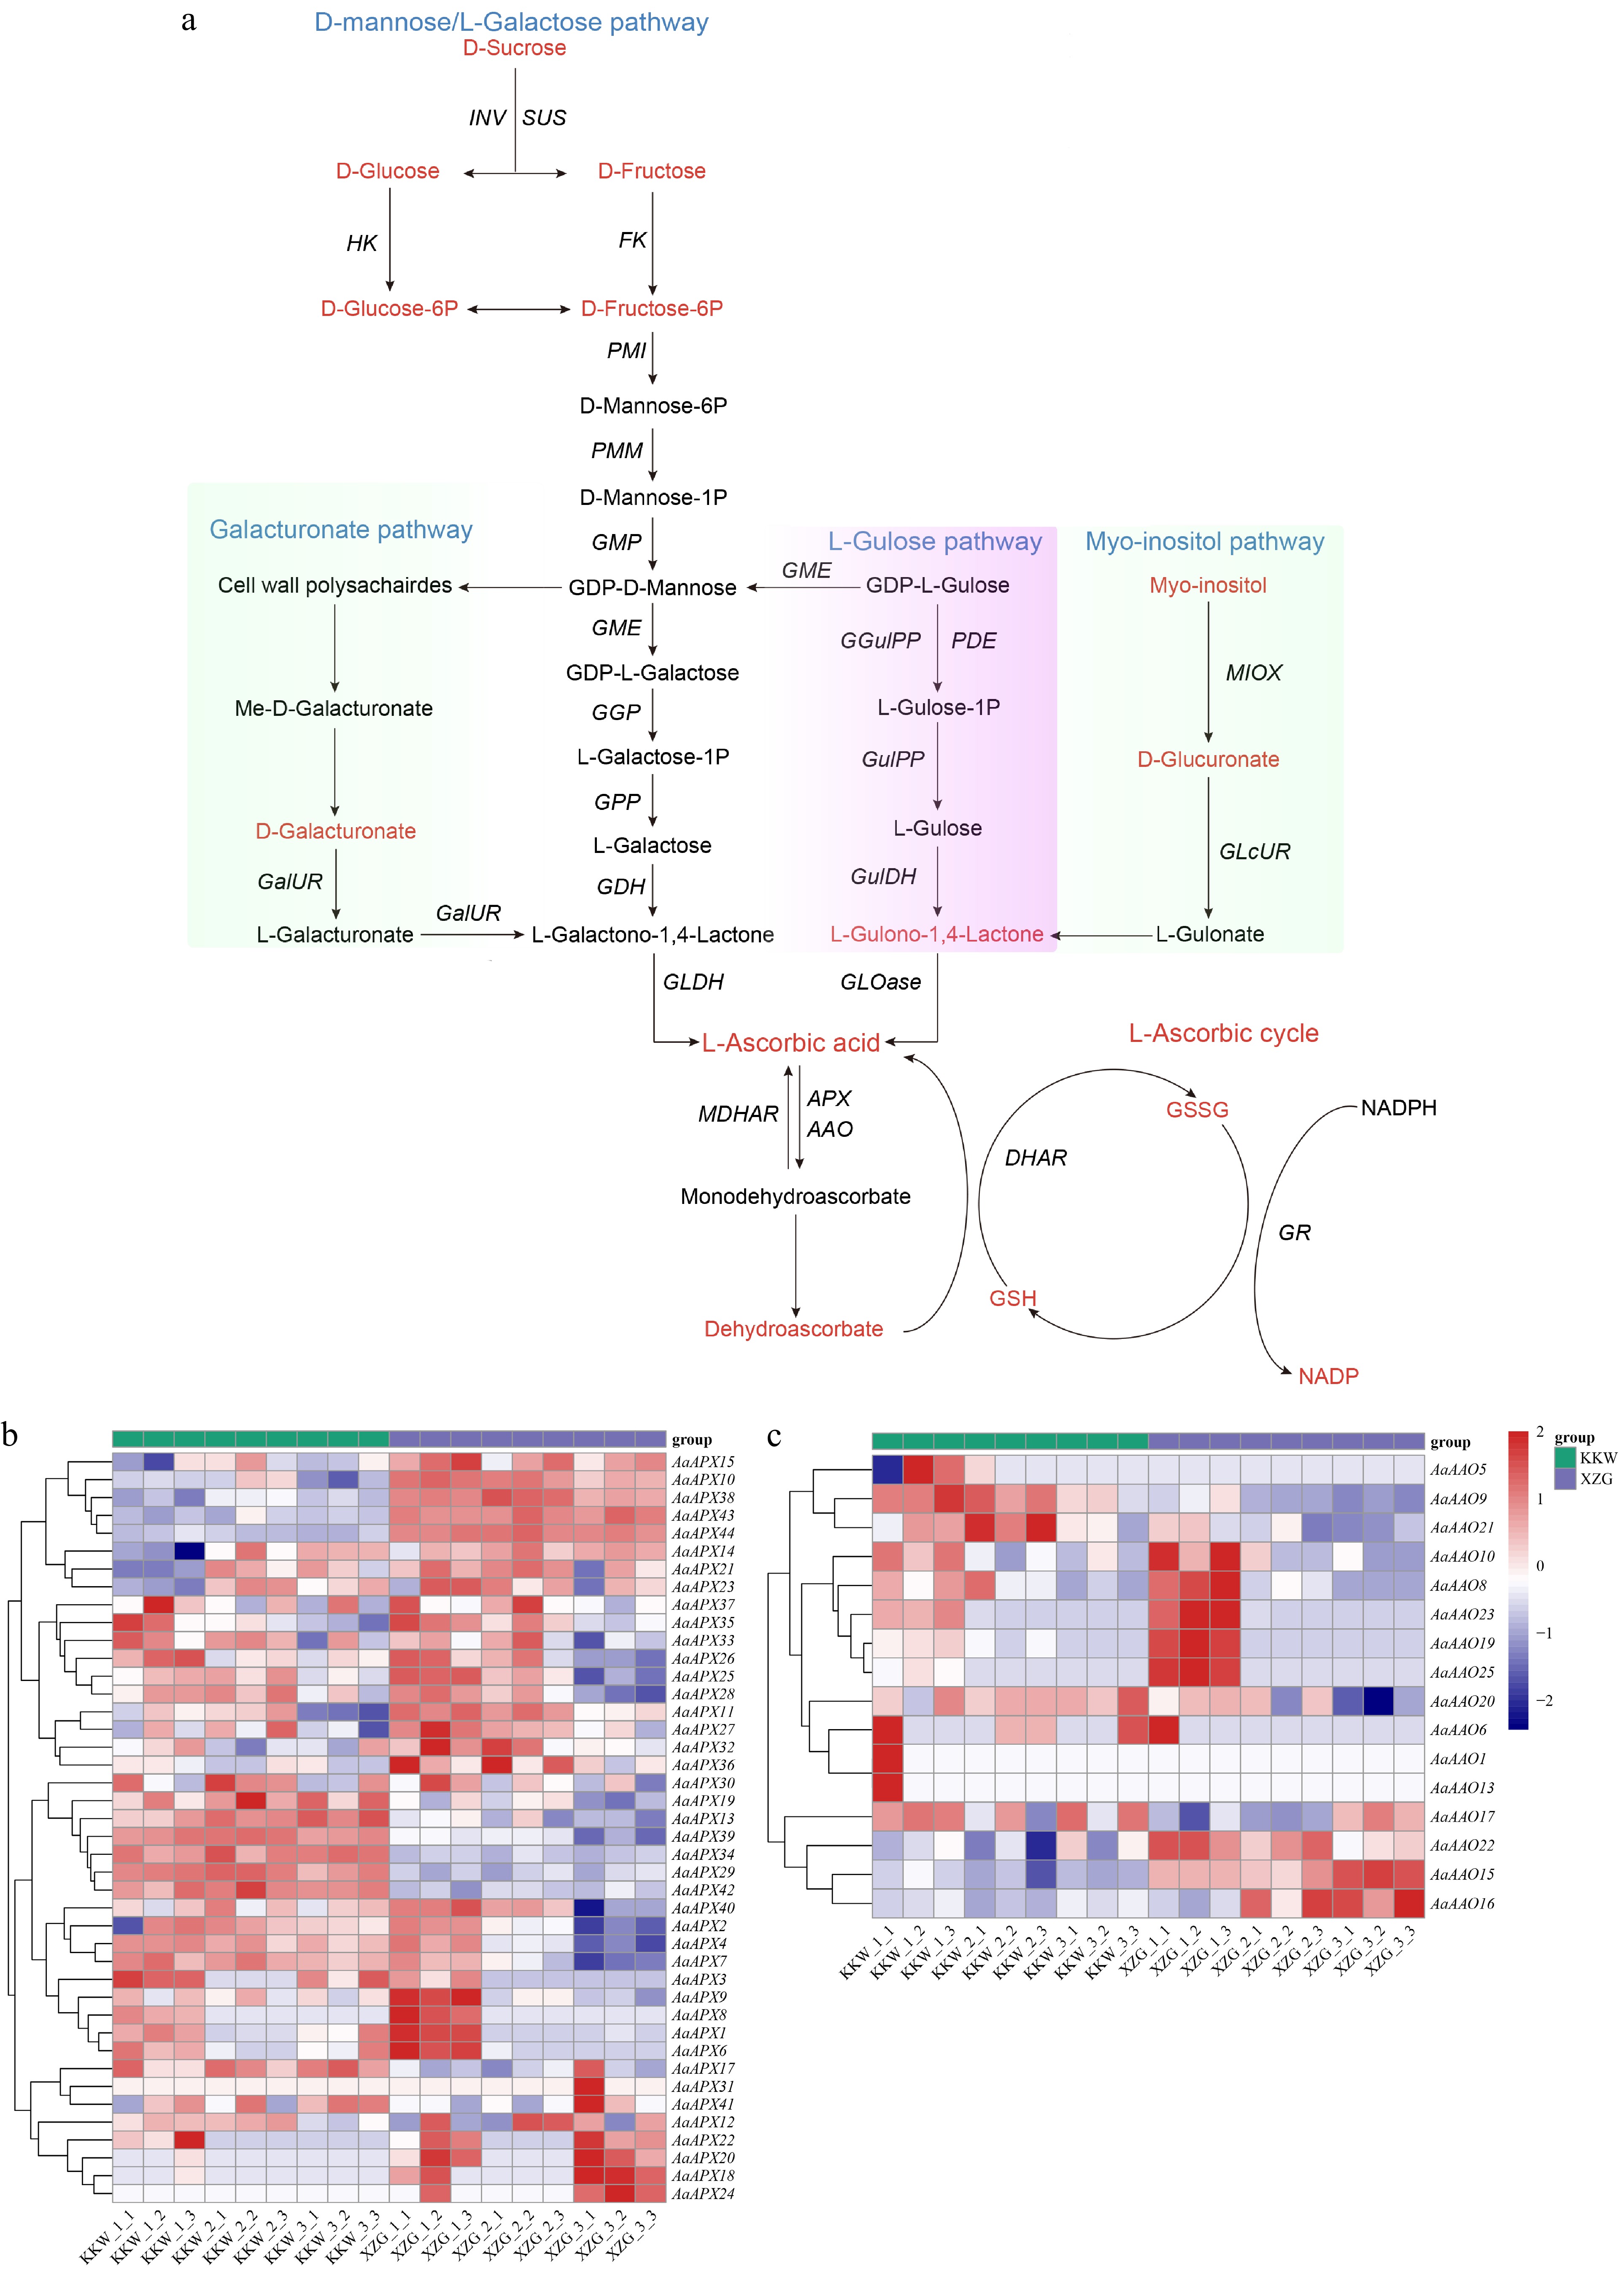
Figure 6.
(a) Overview of the AsA metabolome profiles in two kiwifruit varieties. (b) Differential expression of AaAPX gene family members. (c) Differential expression of AaAAO gene family members.
-
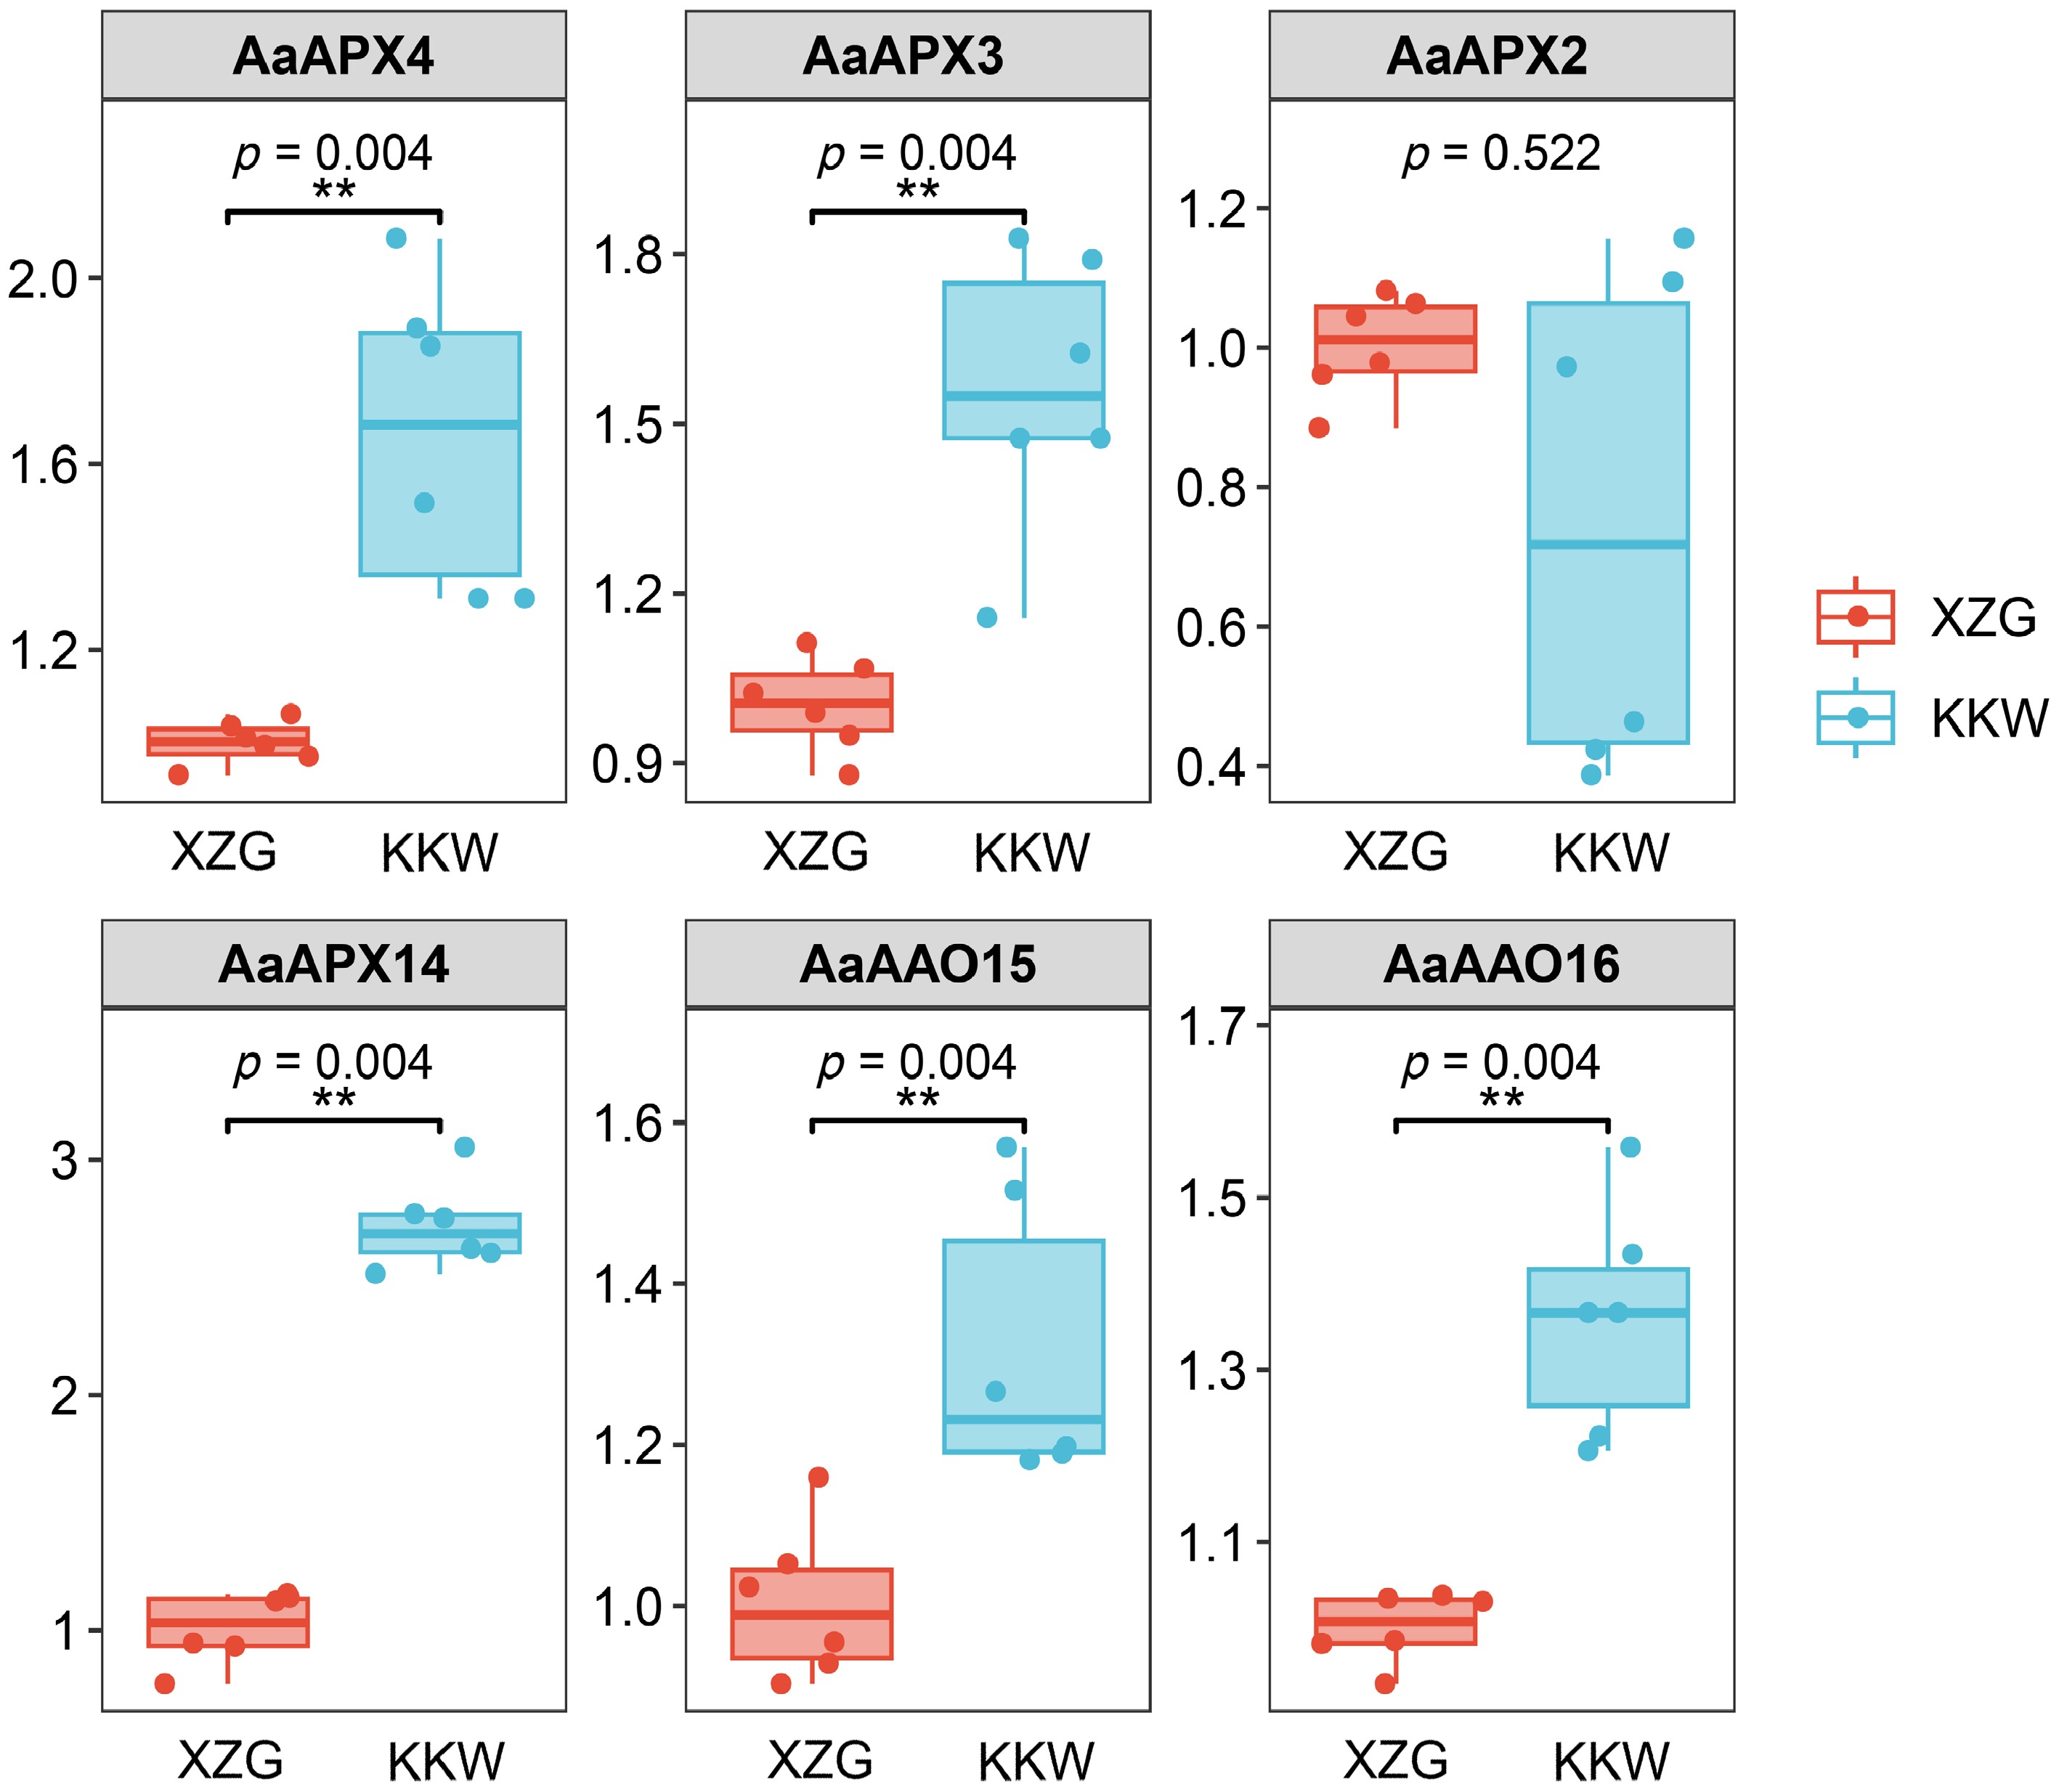
Figure 7.
Results of qPCR analysis of the six selected AaAPXs in KKW and XZG.
-
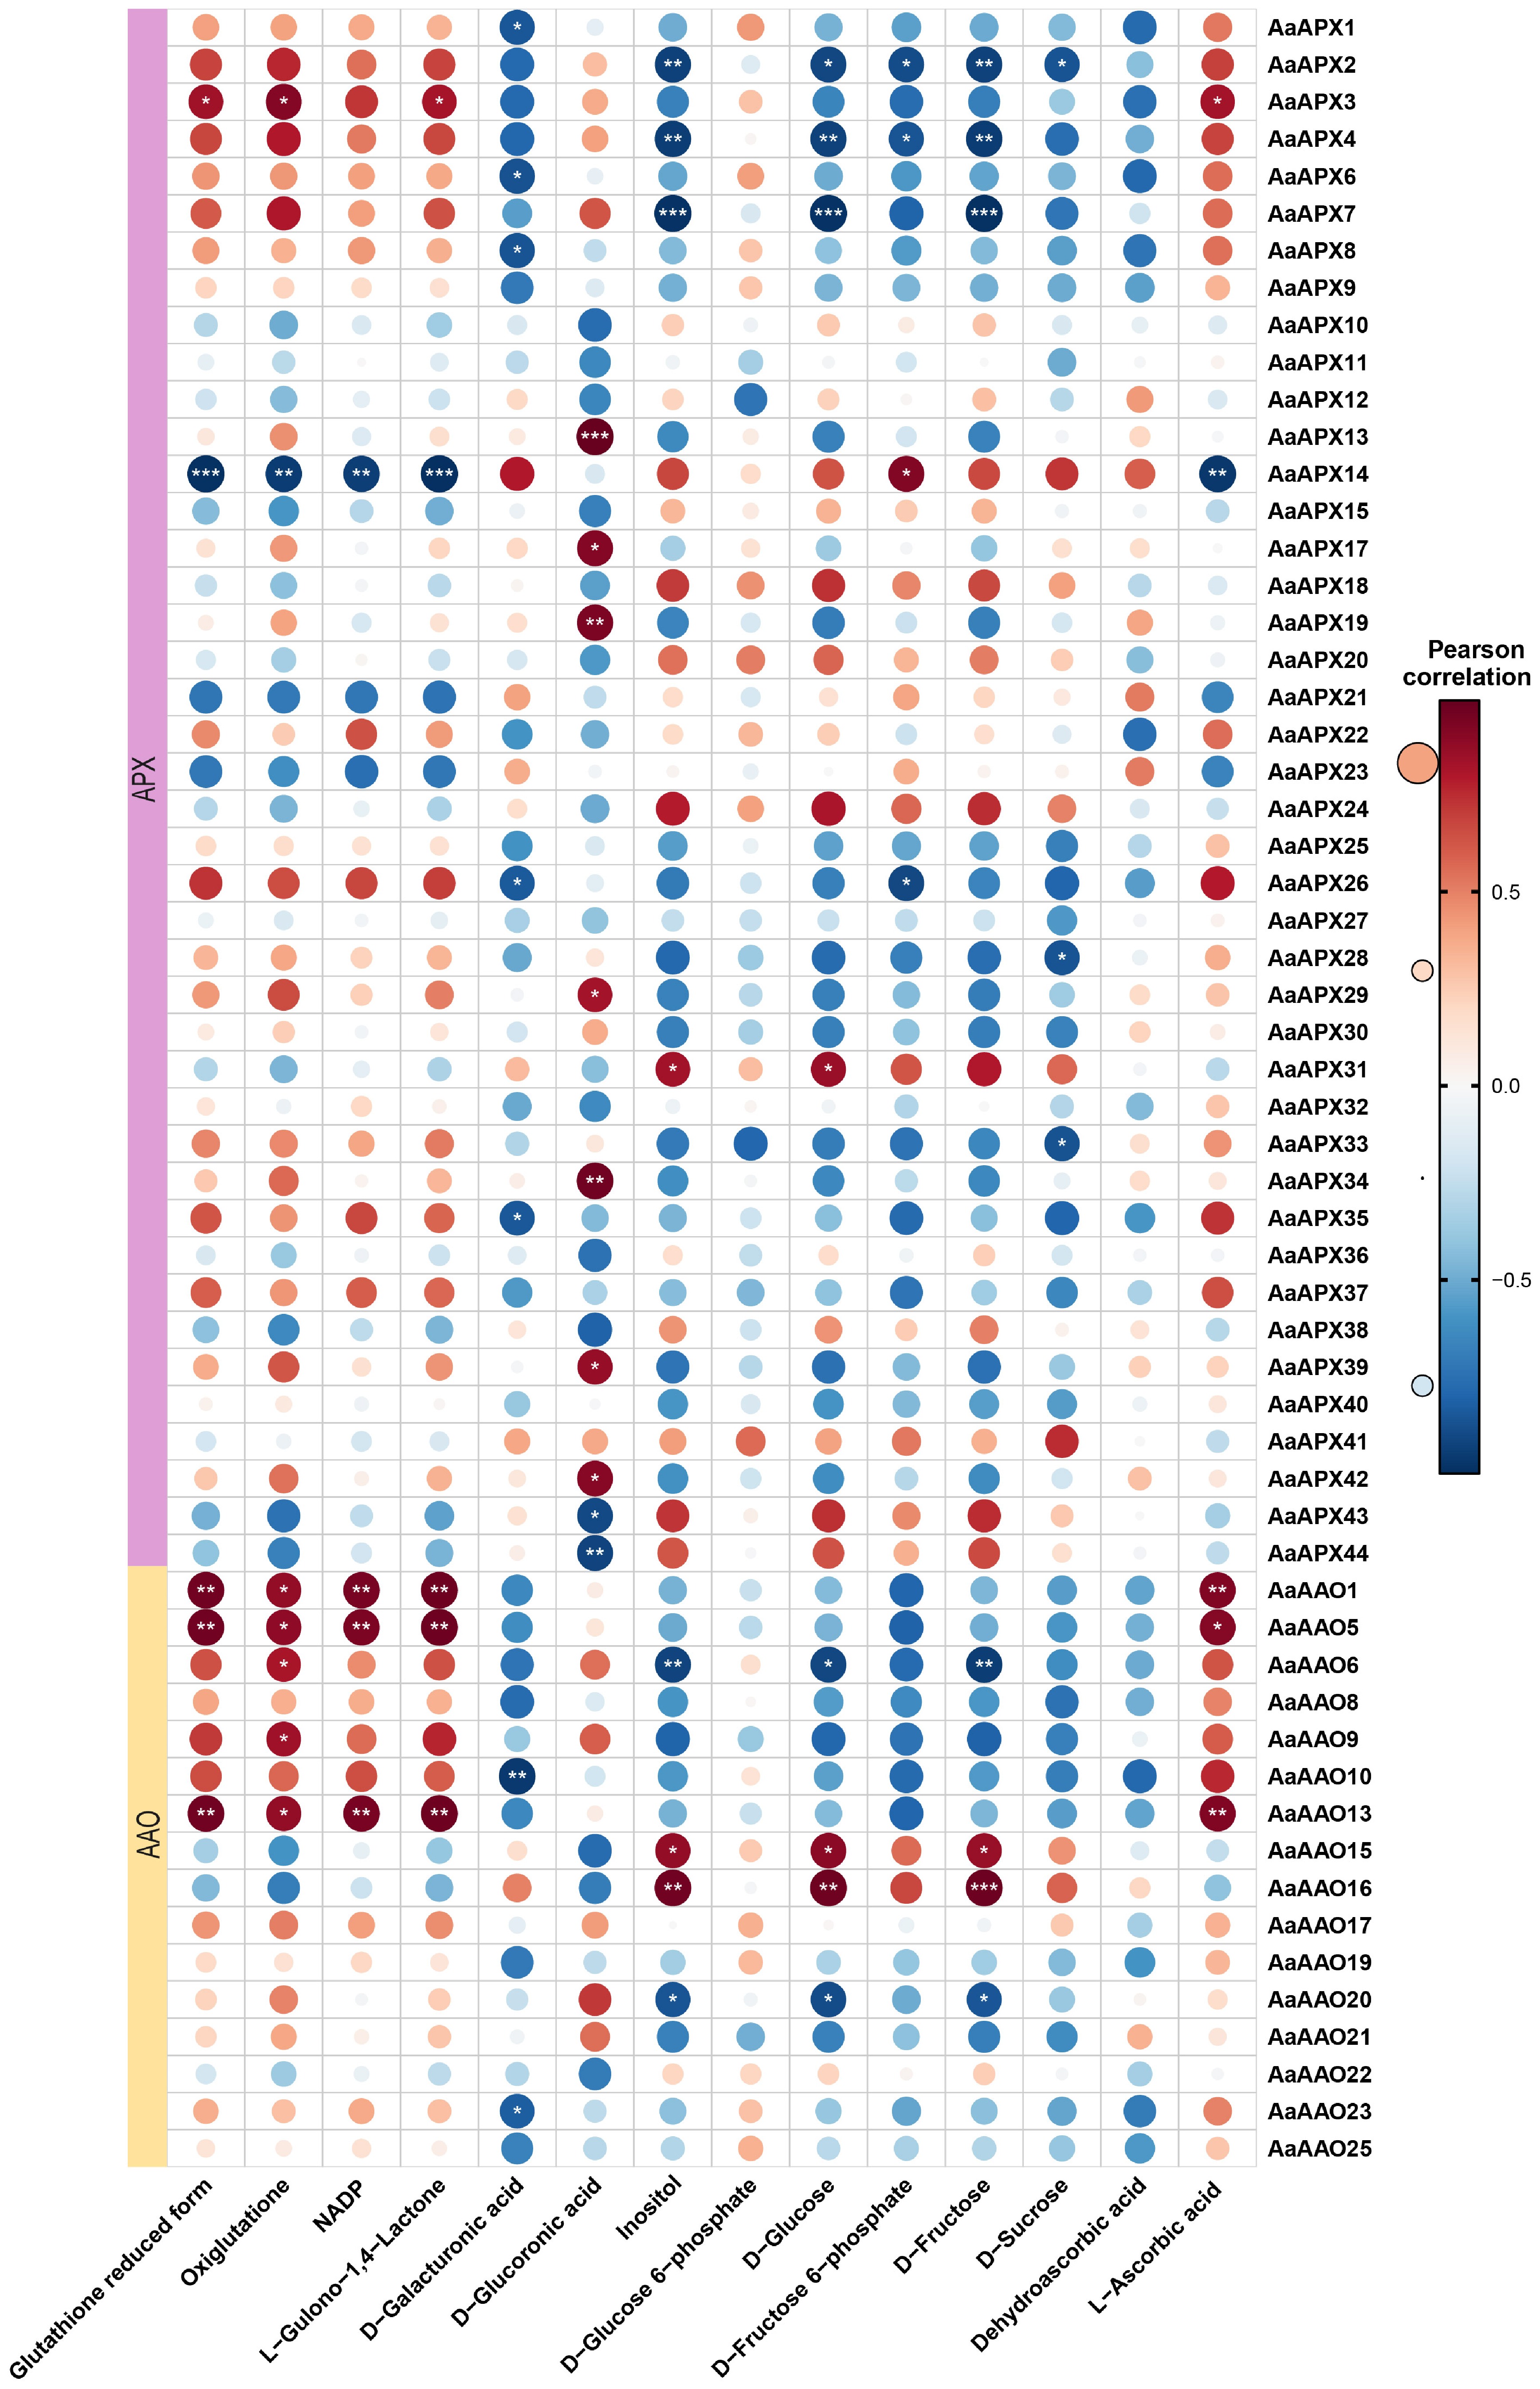
Figure 8.
Correlation analysis between the expression of AaAAO and AaAPX genes and ascorbic acid-related metabolites in A. arguta. Red and blue color notes positive and negative correlations with gene expression, respectively.
-
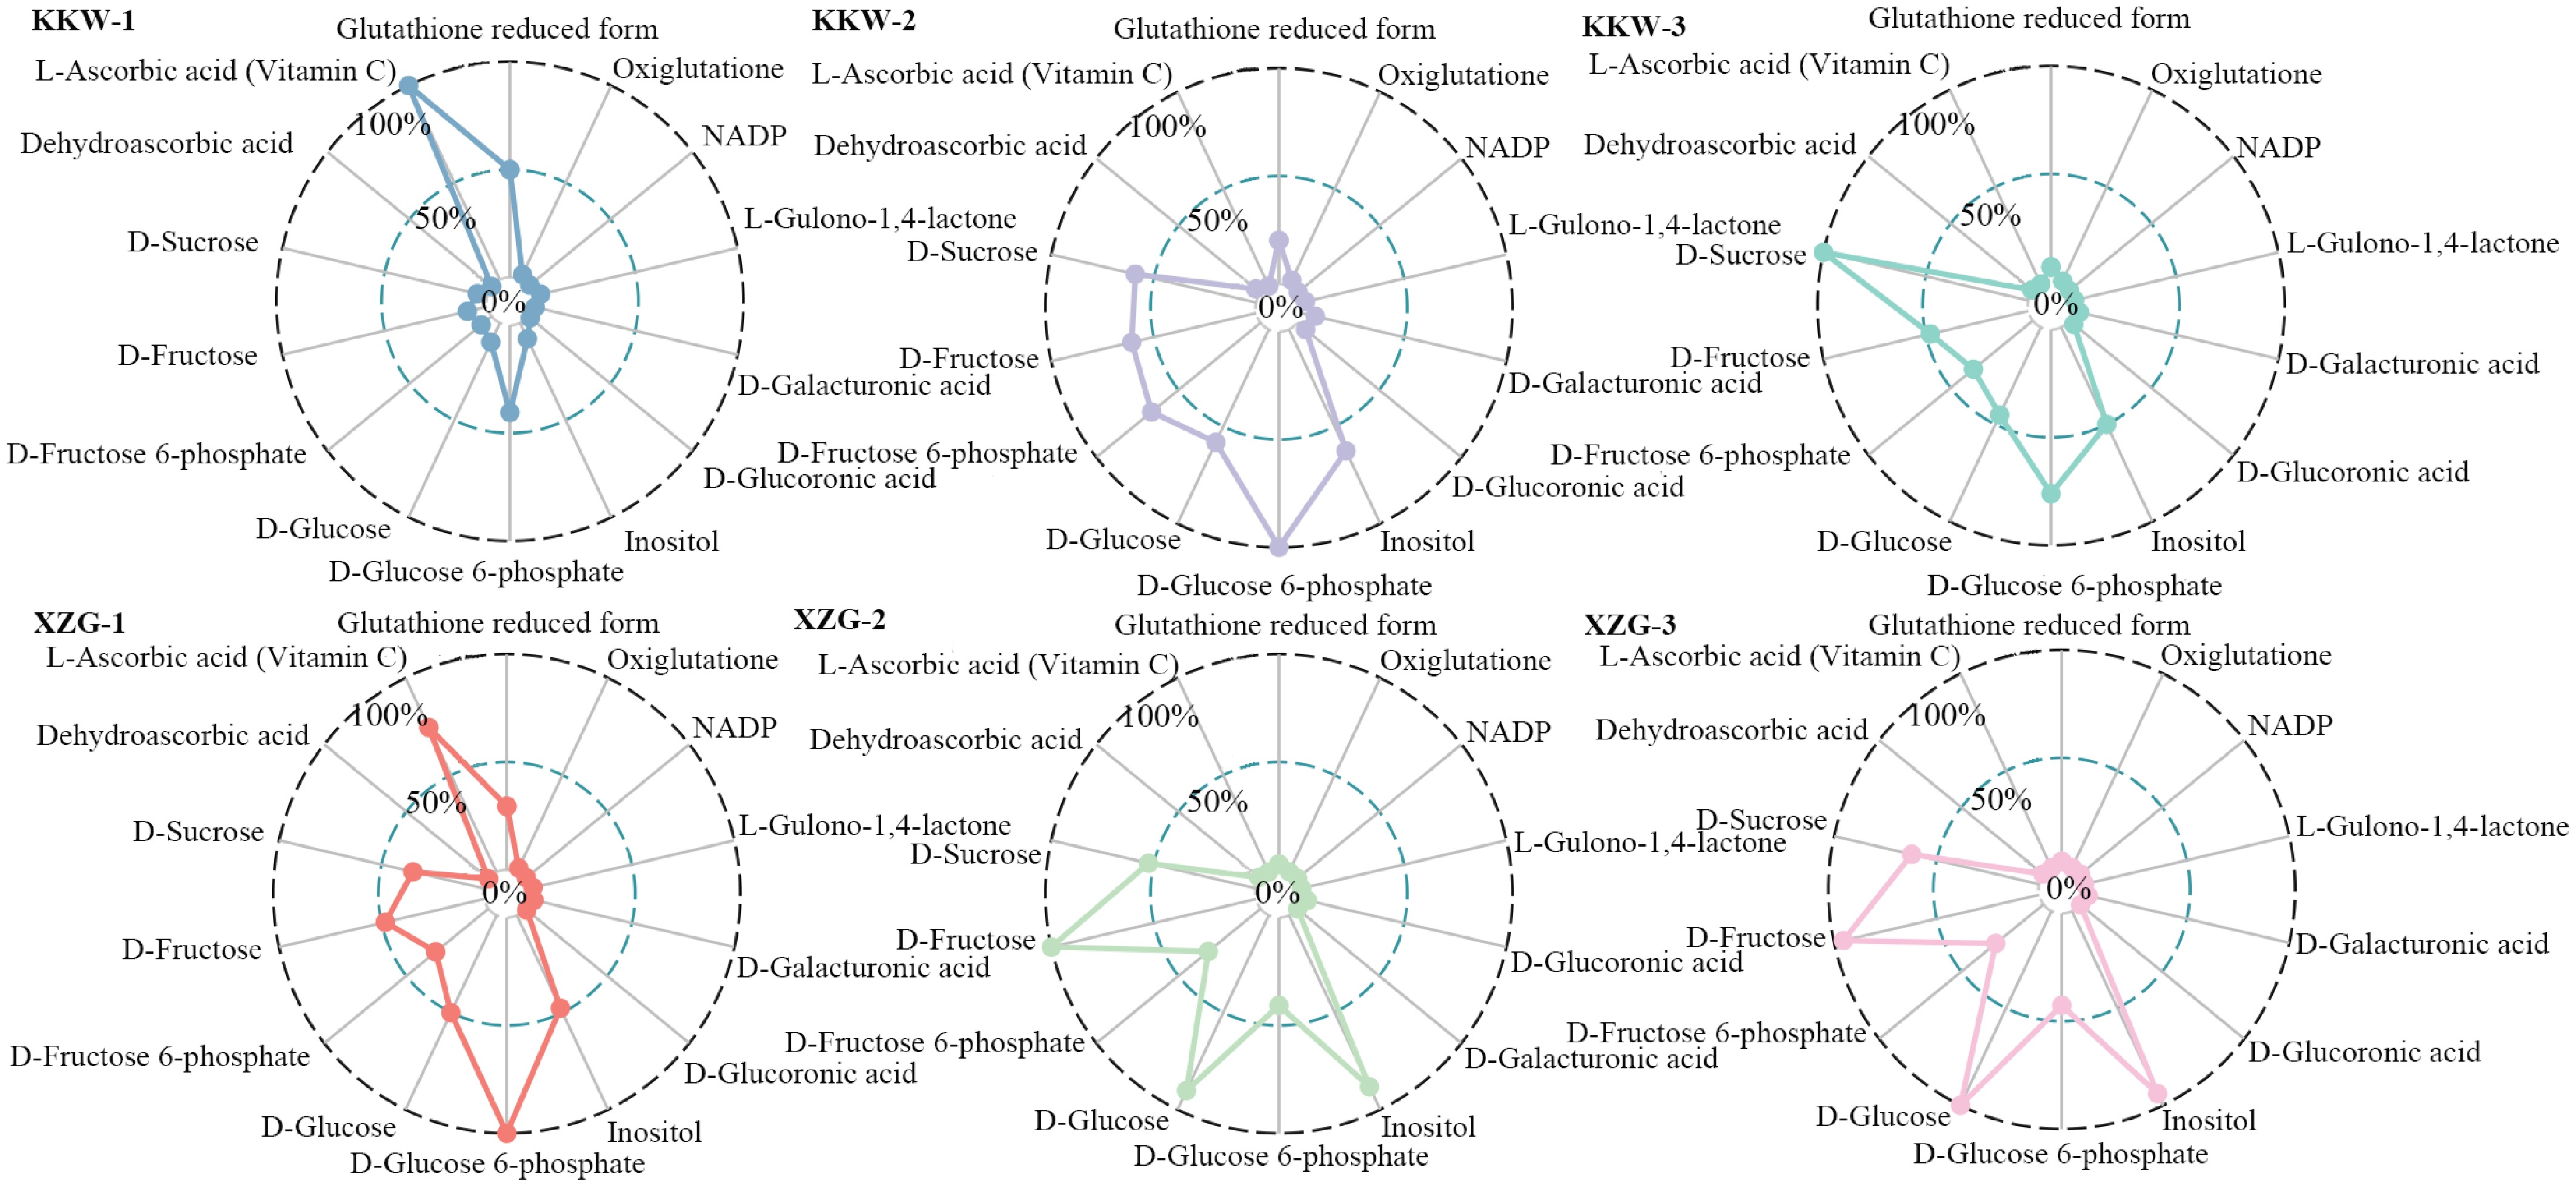
Figure 9.
Comparison of the 13 representative metabolites between two kiwifruit varieties.
Figures
(9)
Tables
(0)