-
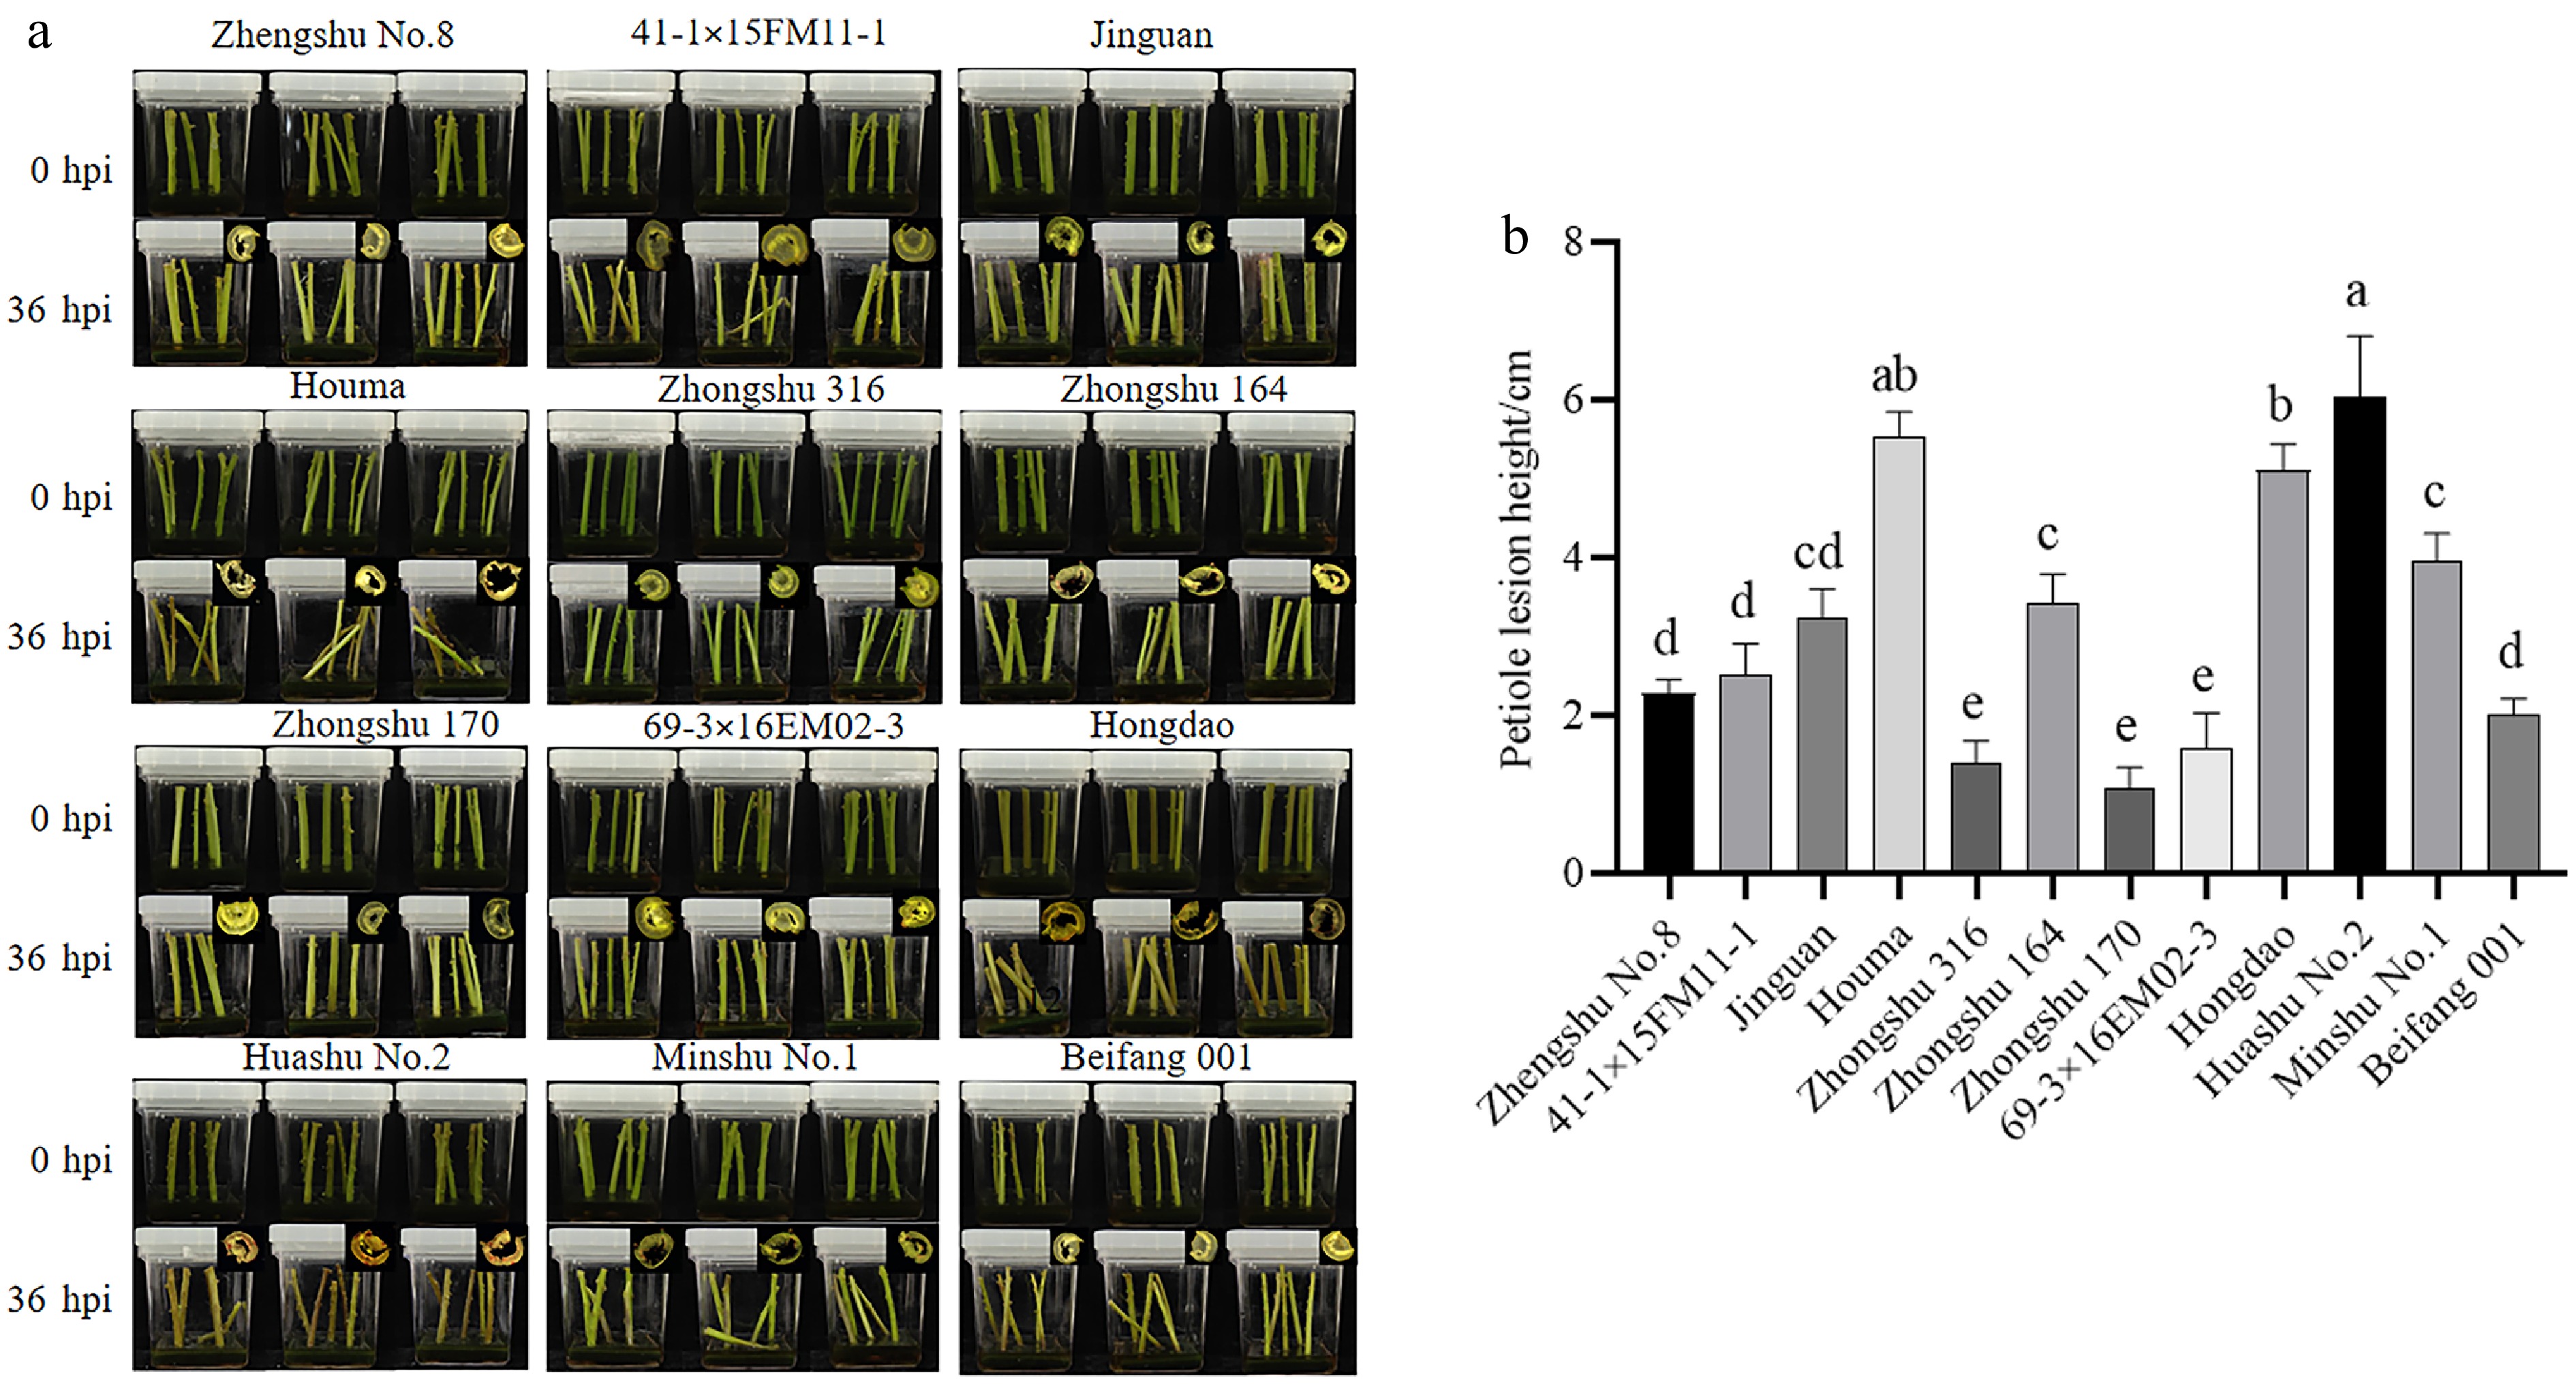
Figure 1.
Evaluation of resistance of different potato varieties to Pectobacterium carotovorum infection. (a) Phenotypes of different potato varieties at 0 and 36 h post-infection with blackleg disease. (b) Lesion height of petioles on different varieties. Different lowercase letters above the bars indicate significant differences among varieties (p < 0.05, One-way ANOVA followed by Tukey's HSD test). Error bars represent standard error (SE). n = 3 (biological replicates); each biological replicate contained three technical replicates (culture flasks, five petioles per flask), and data were computed as the average of technical replicates across three biological replicates.
-
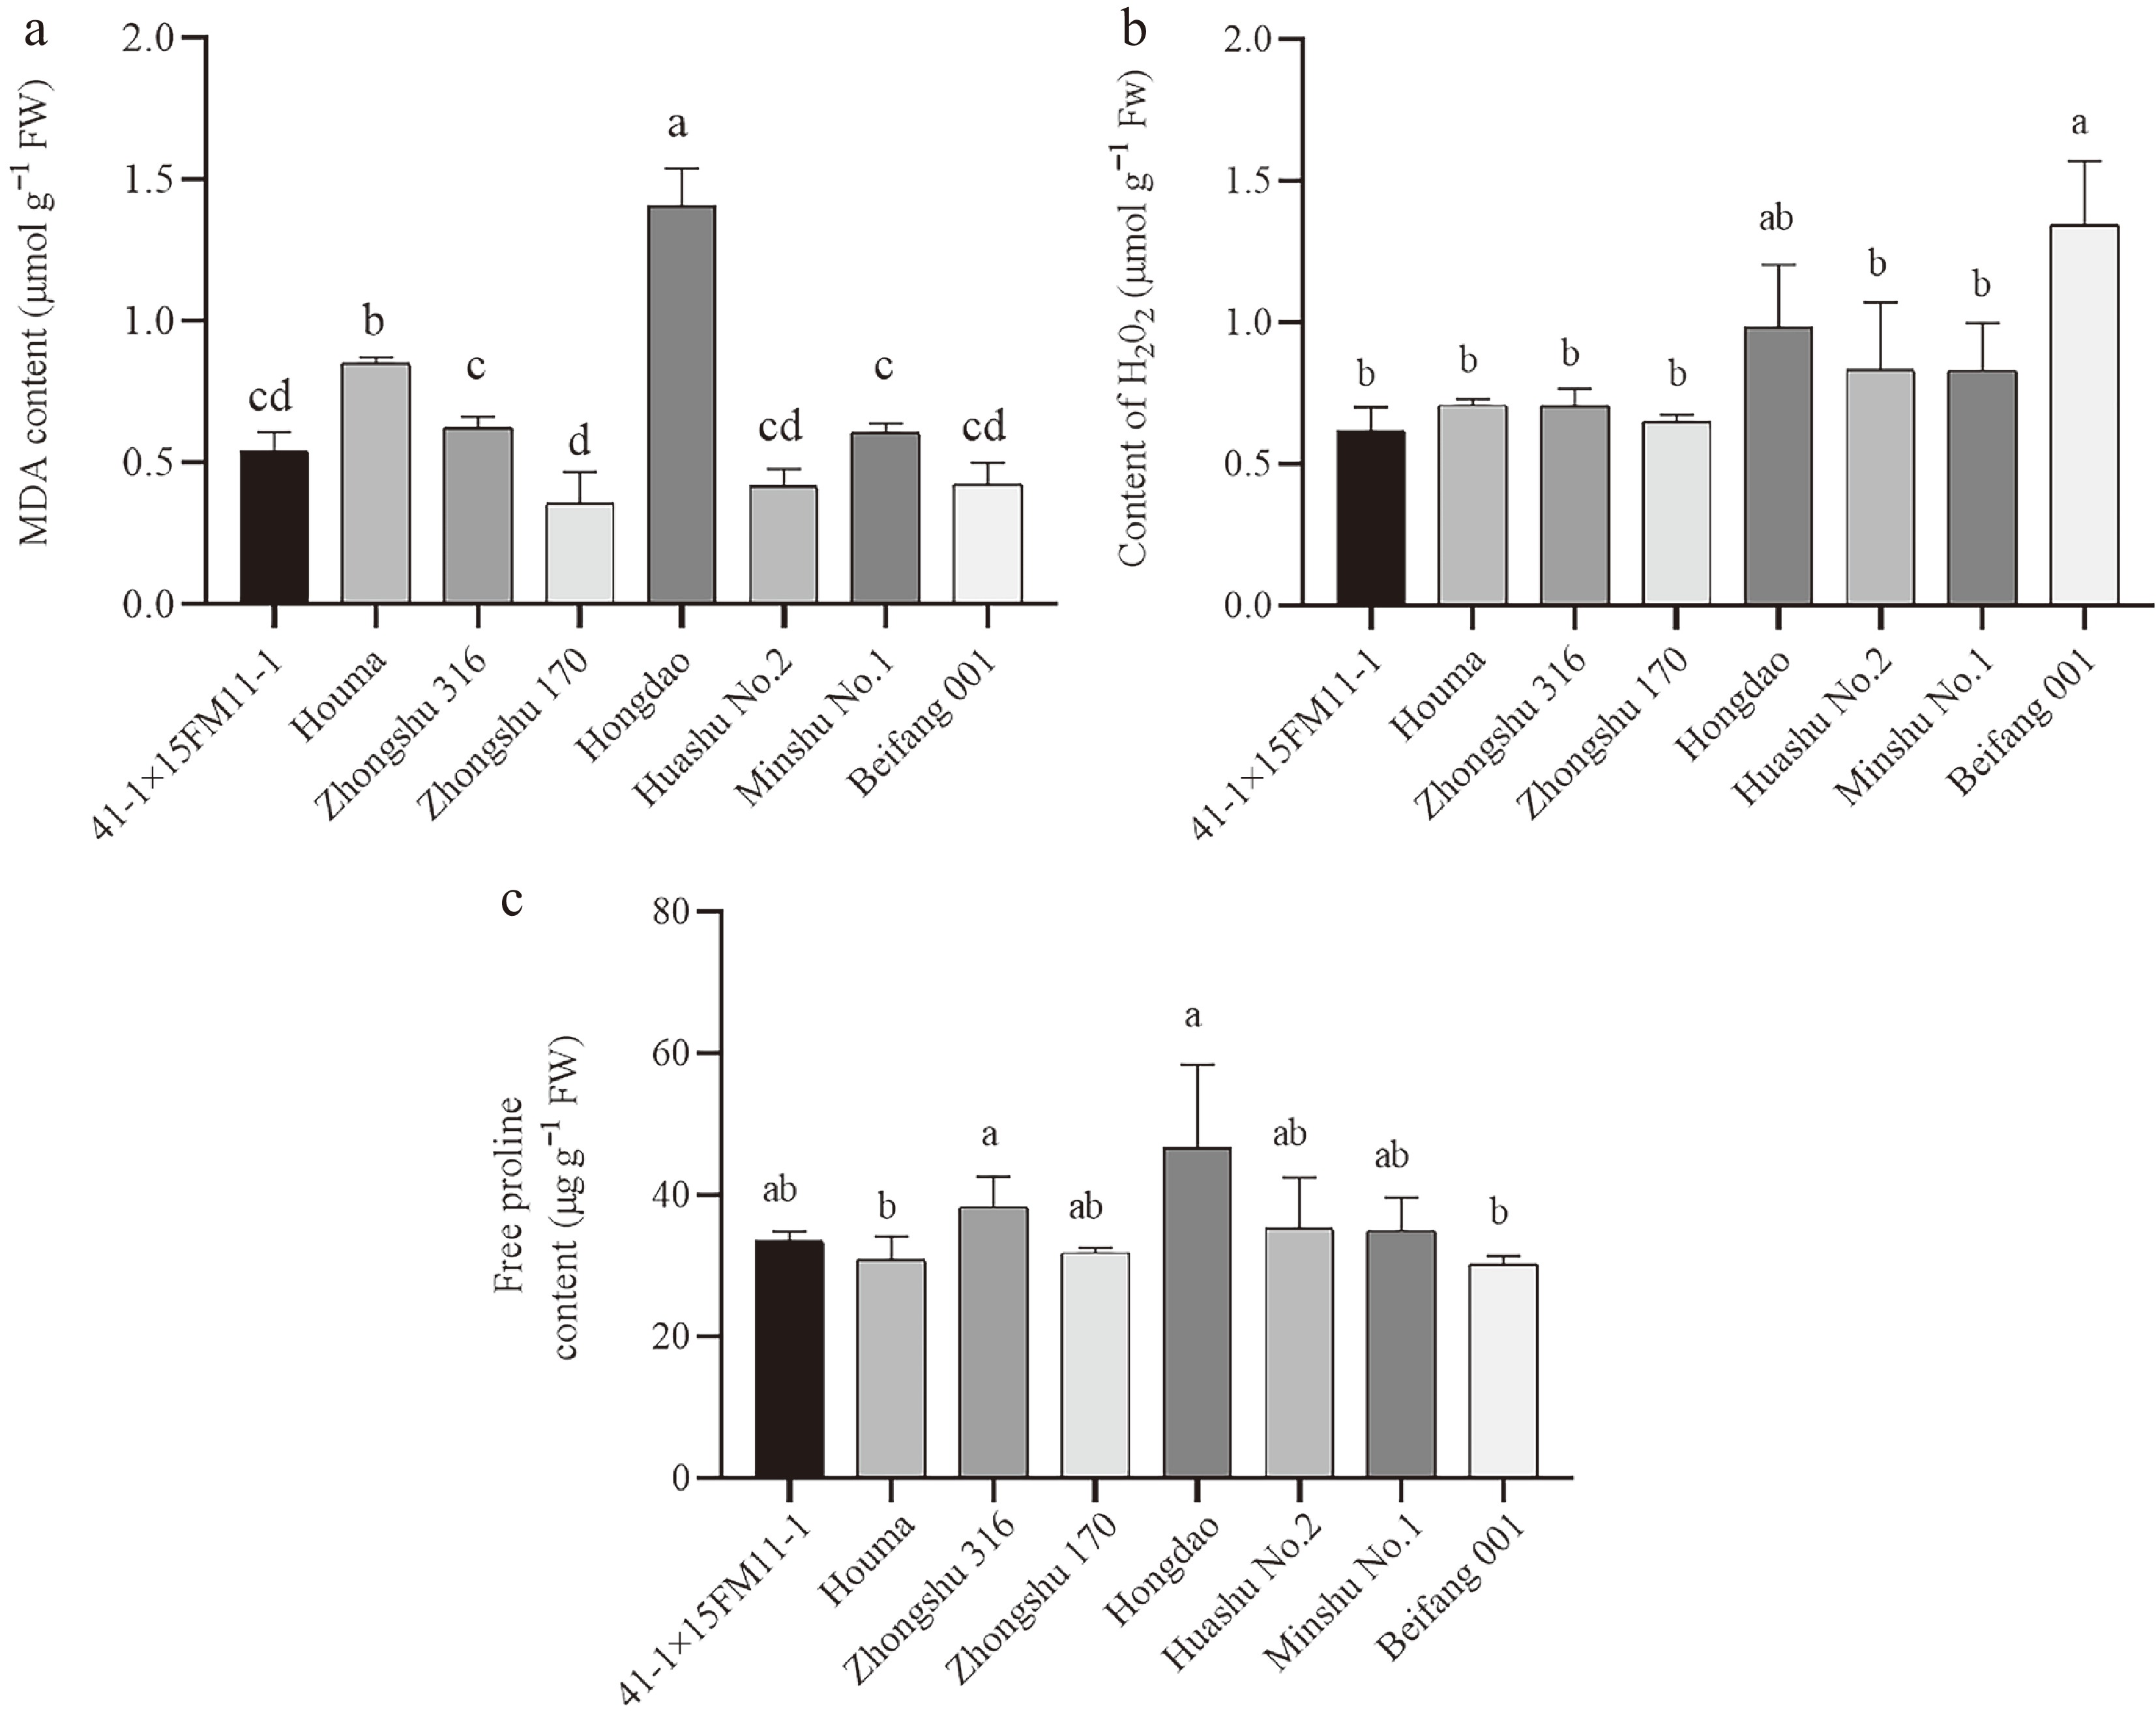
Figure 2.
Changes of (a) MDA, (b) H2O2, and (c) proline content of different potato varieties after blackleg disease infection. Different lowercase letters above the bars indicate significant differences among varieties (p < 0.05, One-way ANOVA followed by Tukey's HSD test). Error bars represent standard error (SE). n = 3 (biological replicates); each biological replicate contained three technical replicates (culture flasks, five petioles per flask), and data were computed as the average of technical replicates across three biological replicates.
-
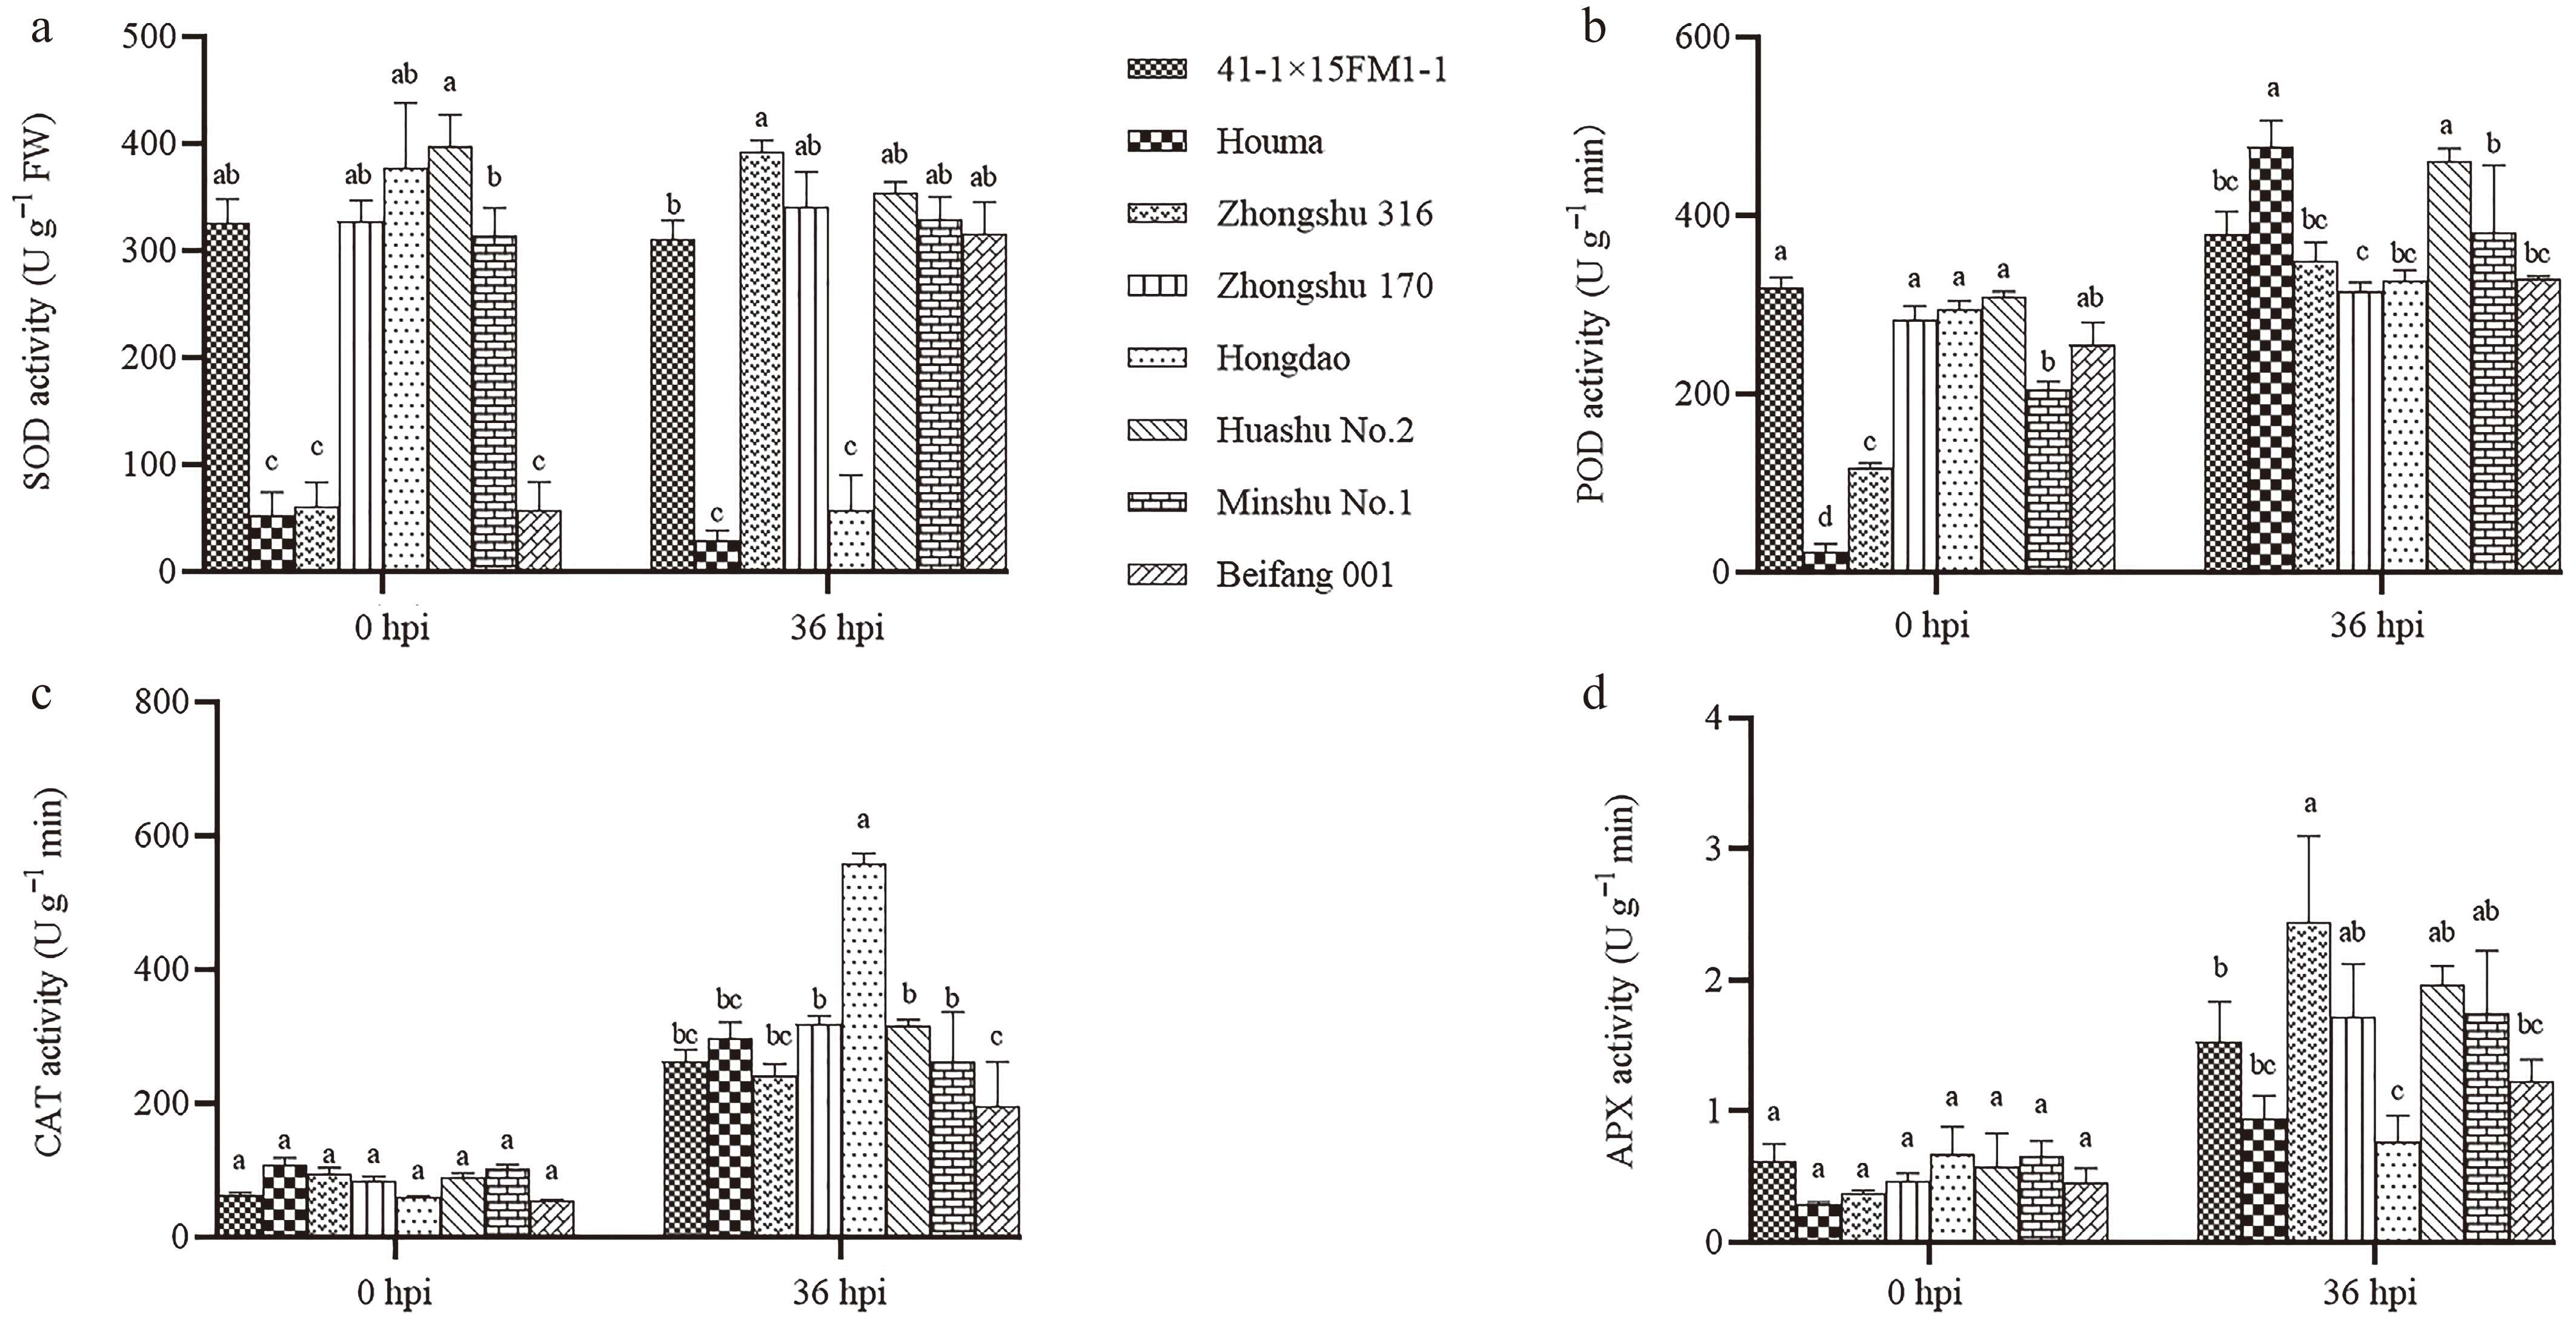
Figure 3.
Changes of antioxidant enzyme activity on blackleg infection. (a) Changes in SOD enzyme activity at 0 and 36 h post-infection with blackleg disease. (b) Changes in POD enzyme activity. (c) Changes in CAT enzyme activity. (d) Changes in APX enzyme activity. Different lowercase letters above the bars indicate significant differences among varieties (p < 0.05, One-way ANOVA followed by Tukey's HSD test). Error bars represent standard error (SE). n = 3 (biological replicates); each biological replicate contained three technical replicates (culture flasks, five petioles per flask), and data were computed as the average of technical replicates across three biological replicates.
-
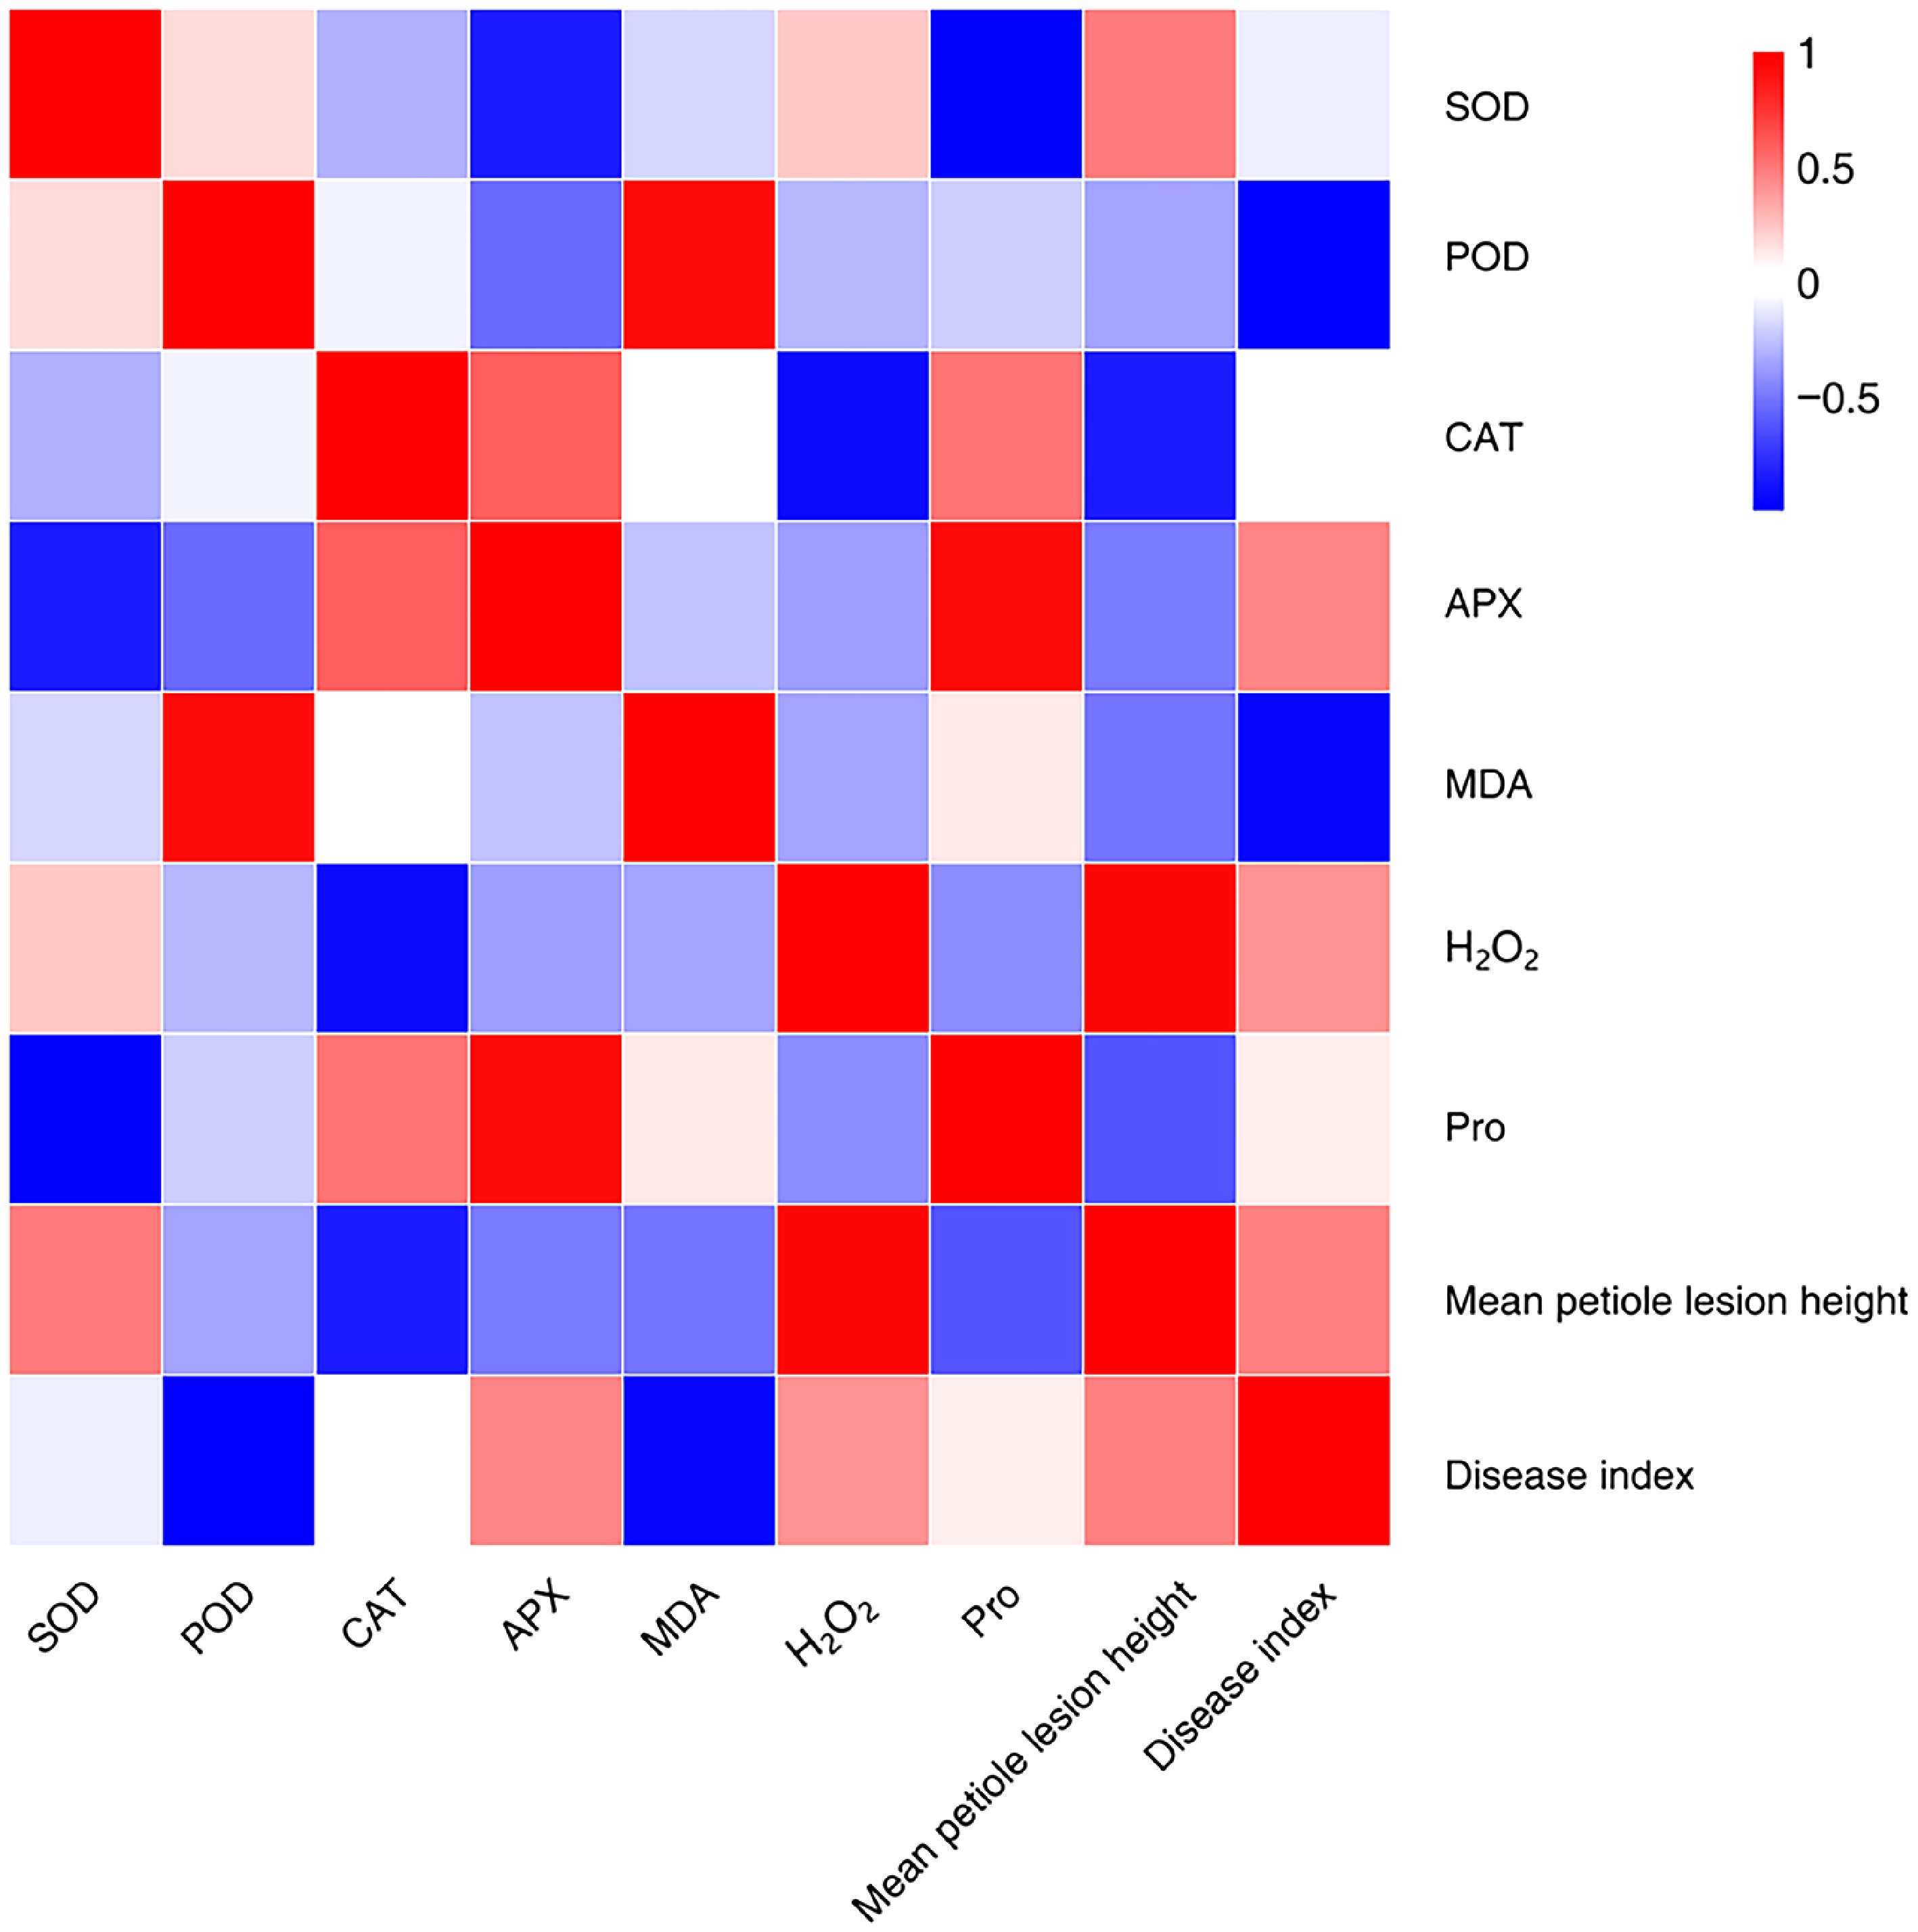
Figure 4.
Correlation analysis between disease resistance and physiological indexes of different potato varieties.
-
Number Variety Number Variety 1 Zhengshu No. 8 7 Zhongshu 170 2 41-1×15FM11-1 8 69-3×16EM02-3 3 Jinguan 9 Hongdao 4 Houma 10 Huashu No. 2 5 Zhongshu 316 11 Minshu No.1 6 Zhongshu 164 12 Beifang 001 Table 1.
Potato varieties used in the study.
-
Mean of petiole lesion height (cm) Disease grade 0~0.5 0 0.5~1 1 1~2 2 2~4 3 4~6.5 4 Table 2.
Standardized assessment of disease grade.
-
Materials Petiole lesion
height (cm)Disease
gradeDisease
indexGrade Zhengshu No.8 2.3d 3 0.65 MR 41-1×15FM11-1 2.5d 3 0.58 MR Jinguan 3.2cd 3 0.73 MS Houma 5.5ab 4 0.85 S Zhongshu 316 1.4e 2 0.4 R Zhongshu 164 3.4c 3 0.72 MS Zhongshu 170 1.1e 2 0.38 R 69-3×16EM02-3 1.6e 2 0.45 MR Hongdao 5.1b 4 0.96 S Huashu No.2 6.0a 4 0.96 S Minshu No.1 4.0c 4 0.8 MS Beifang 001 2.0d 2 0.46 MR Table 3.
Investigation on infection of petiole infected by blackleg.
Figures
(4)
Tables
(3)