-
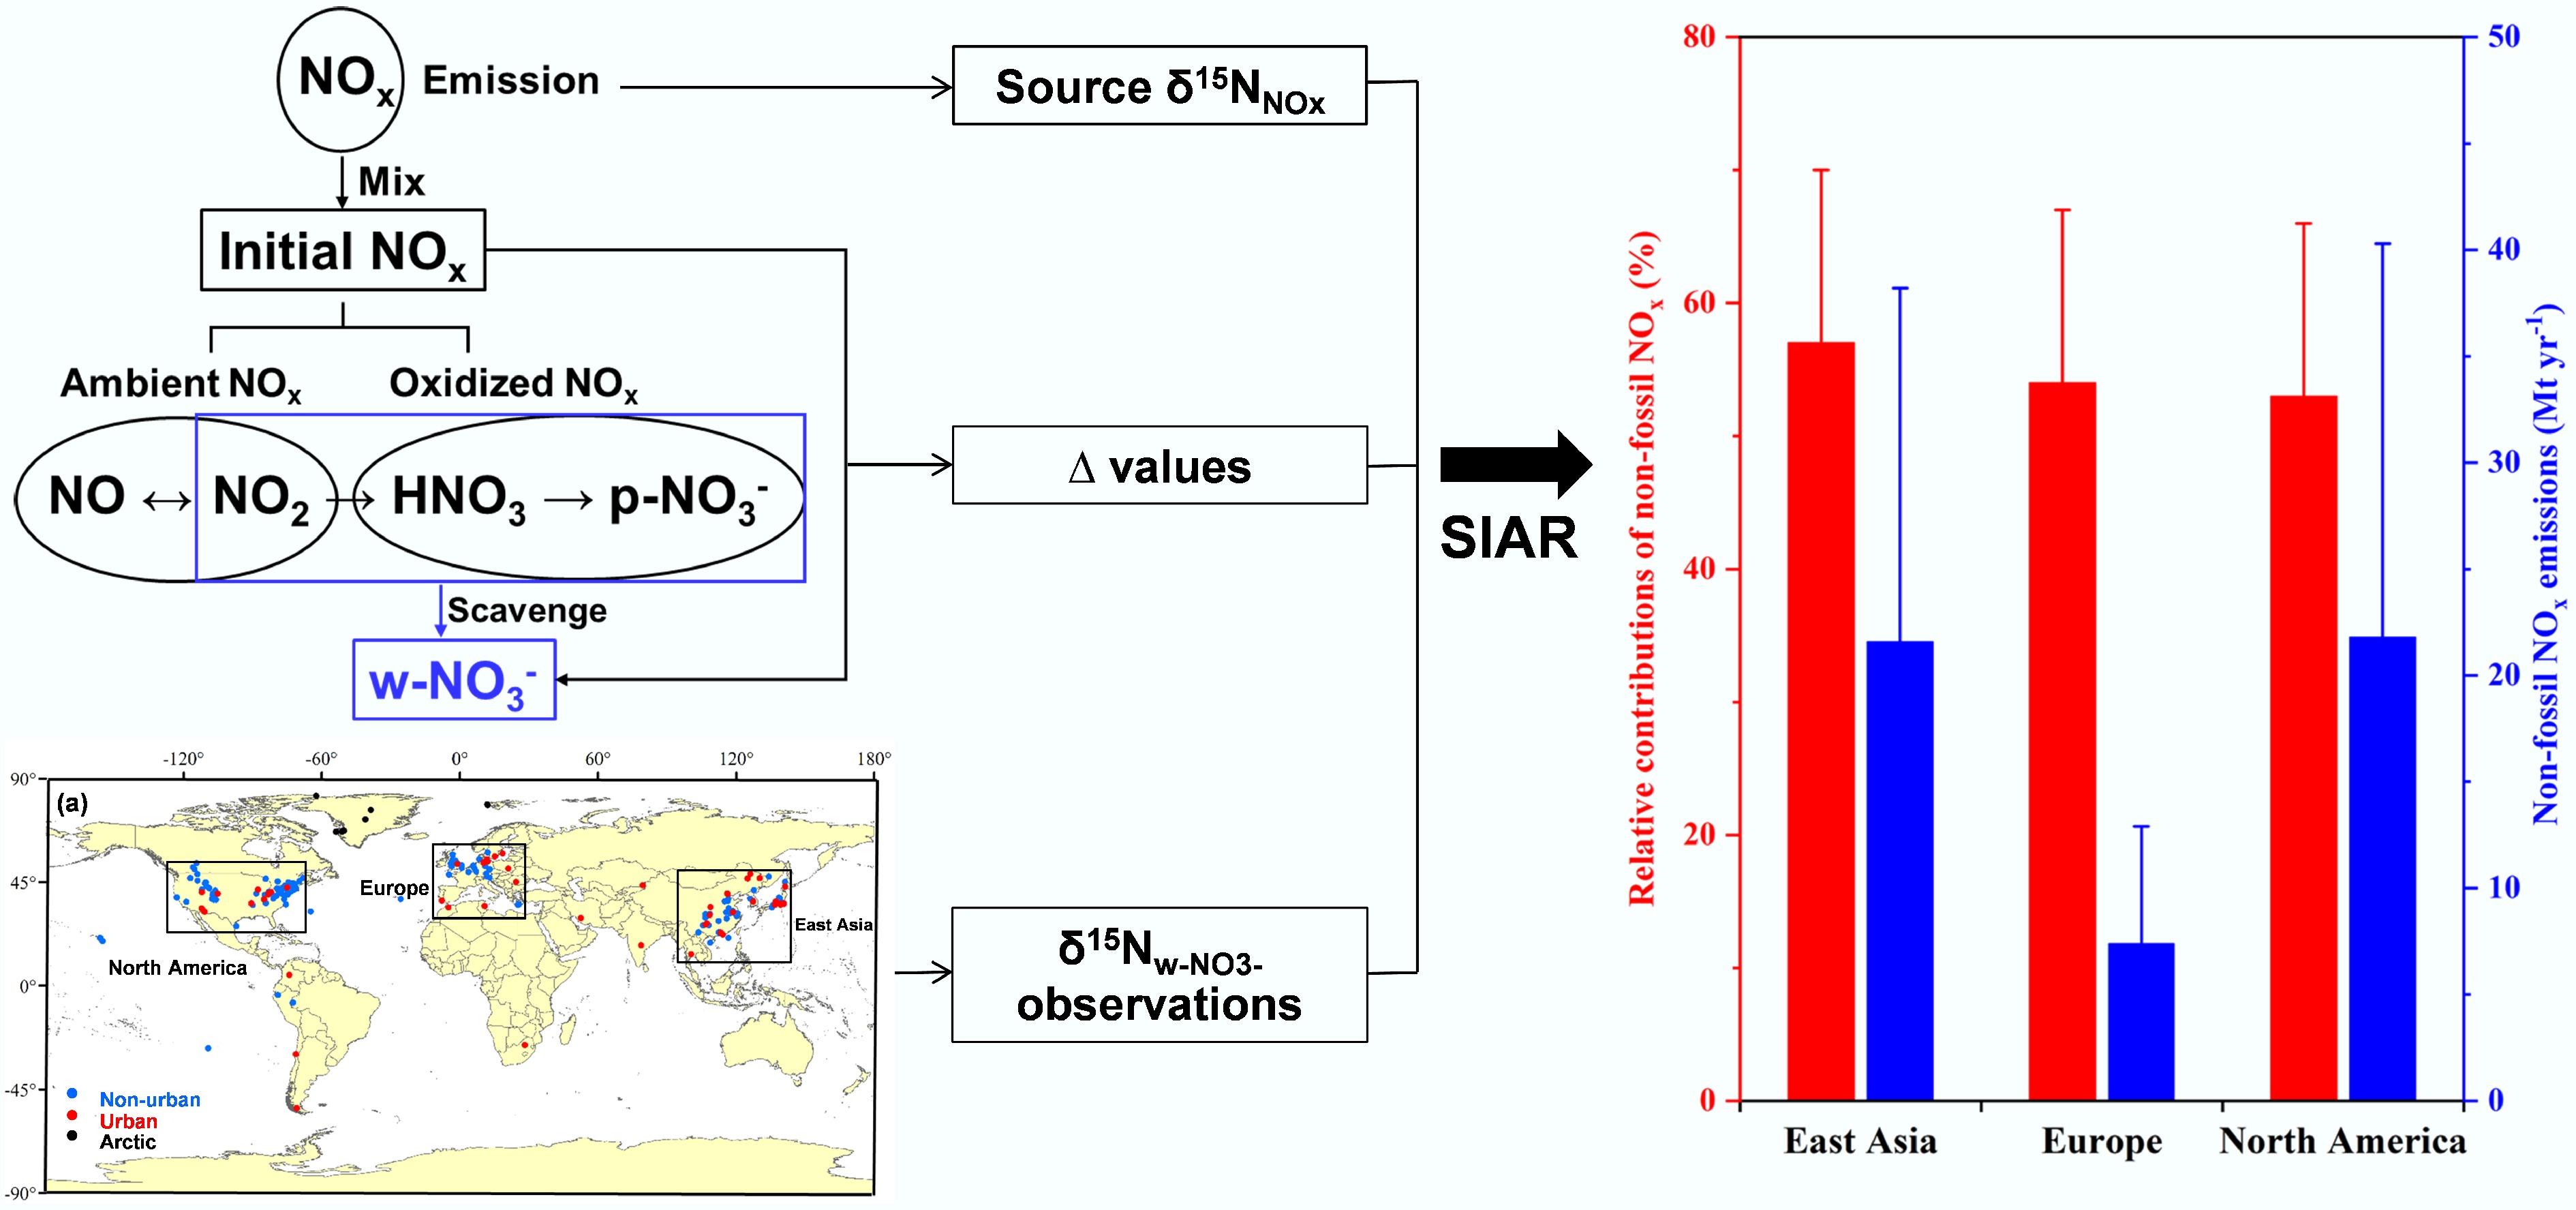
Figure 1.
Isotope analysis diagram of NO3− sources in precipitation (modified from Song et al.[7]).
-
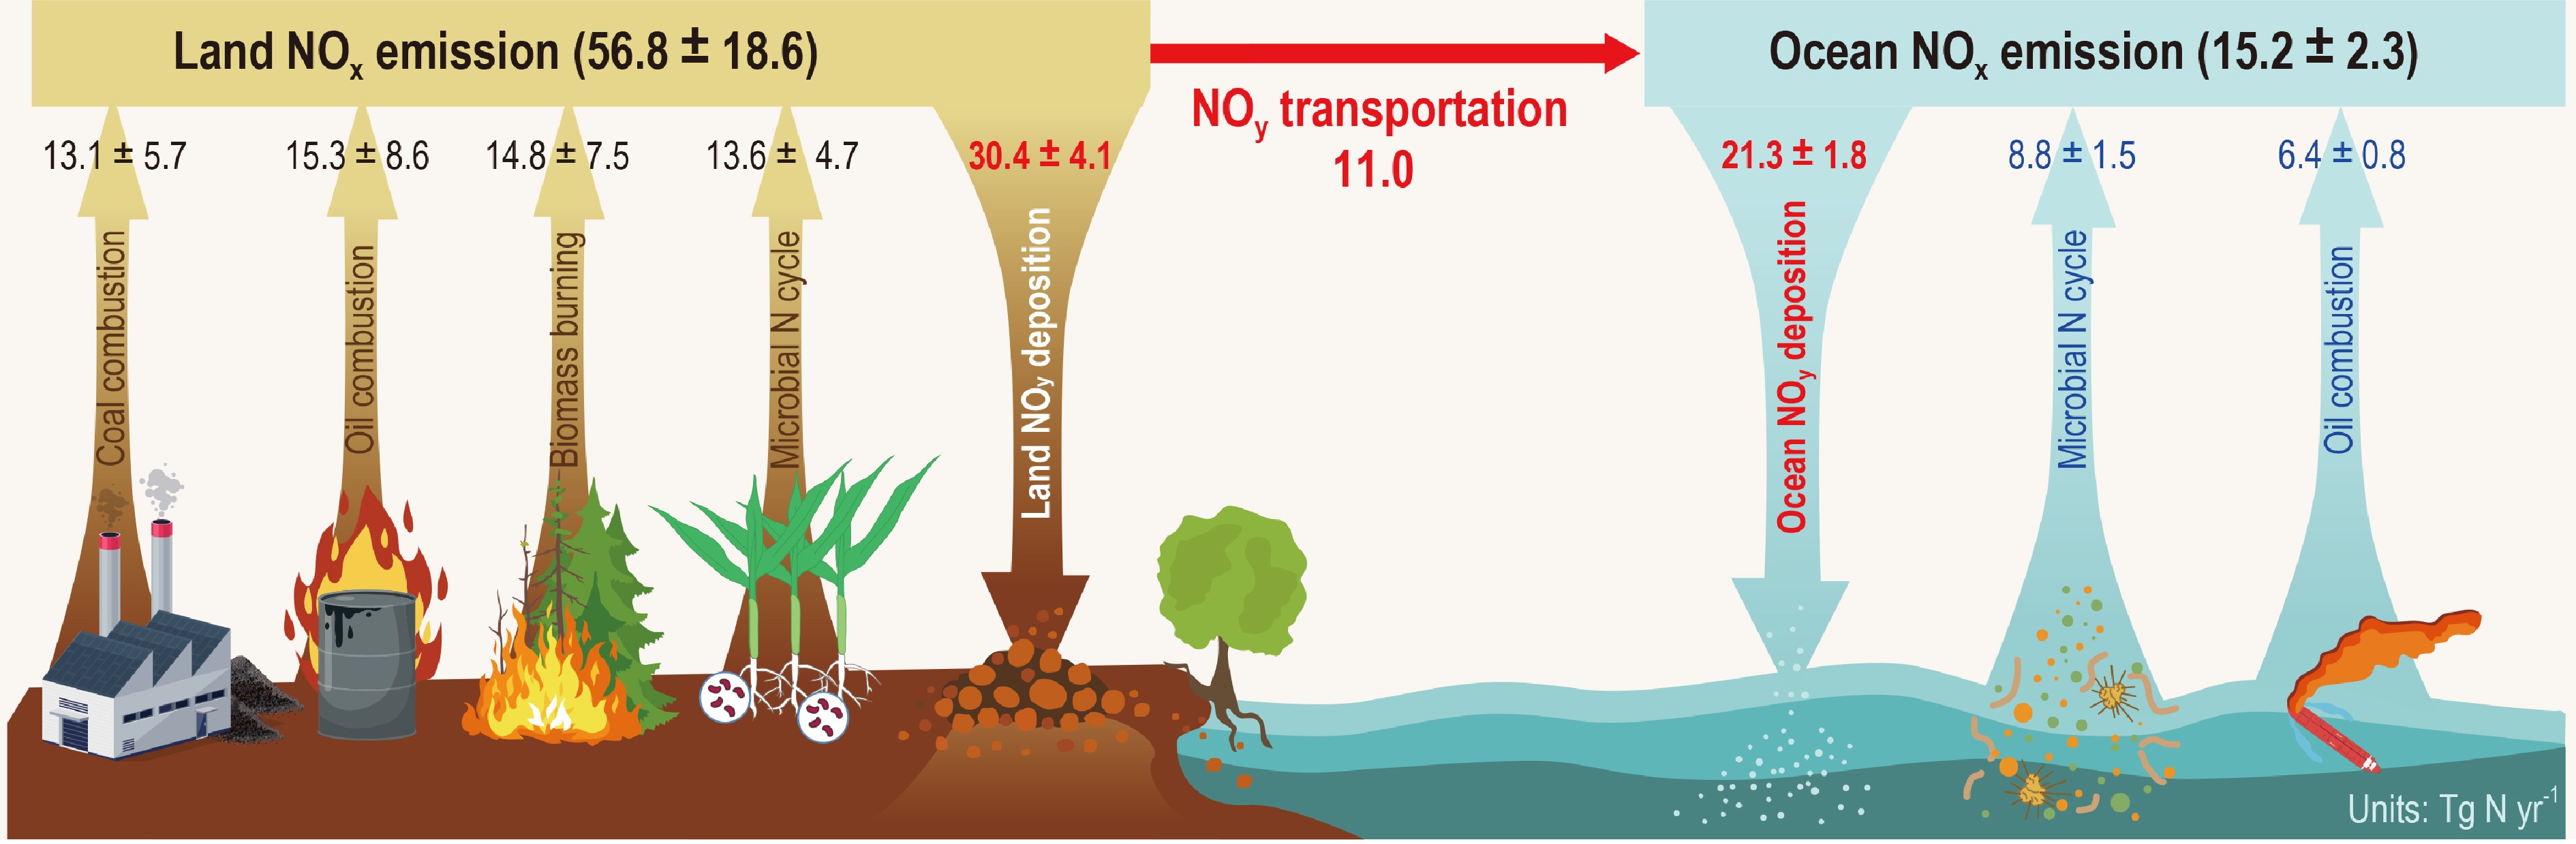
Figure 2.
Emission fluxes from major NOx sources in the atmosphere and NOy transportation and deposition fluxes (modified from Song et al.[26]).
-
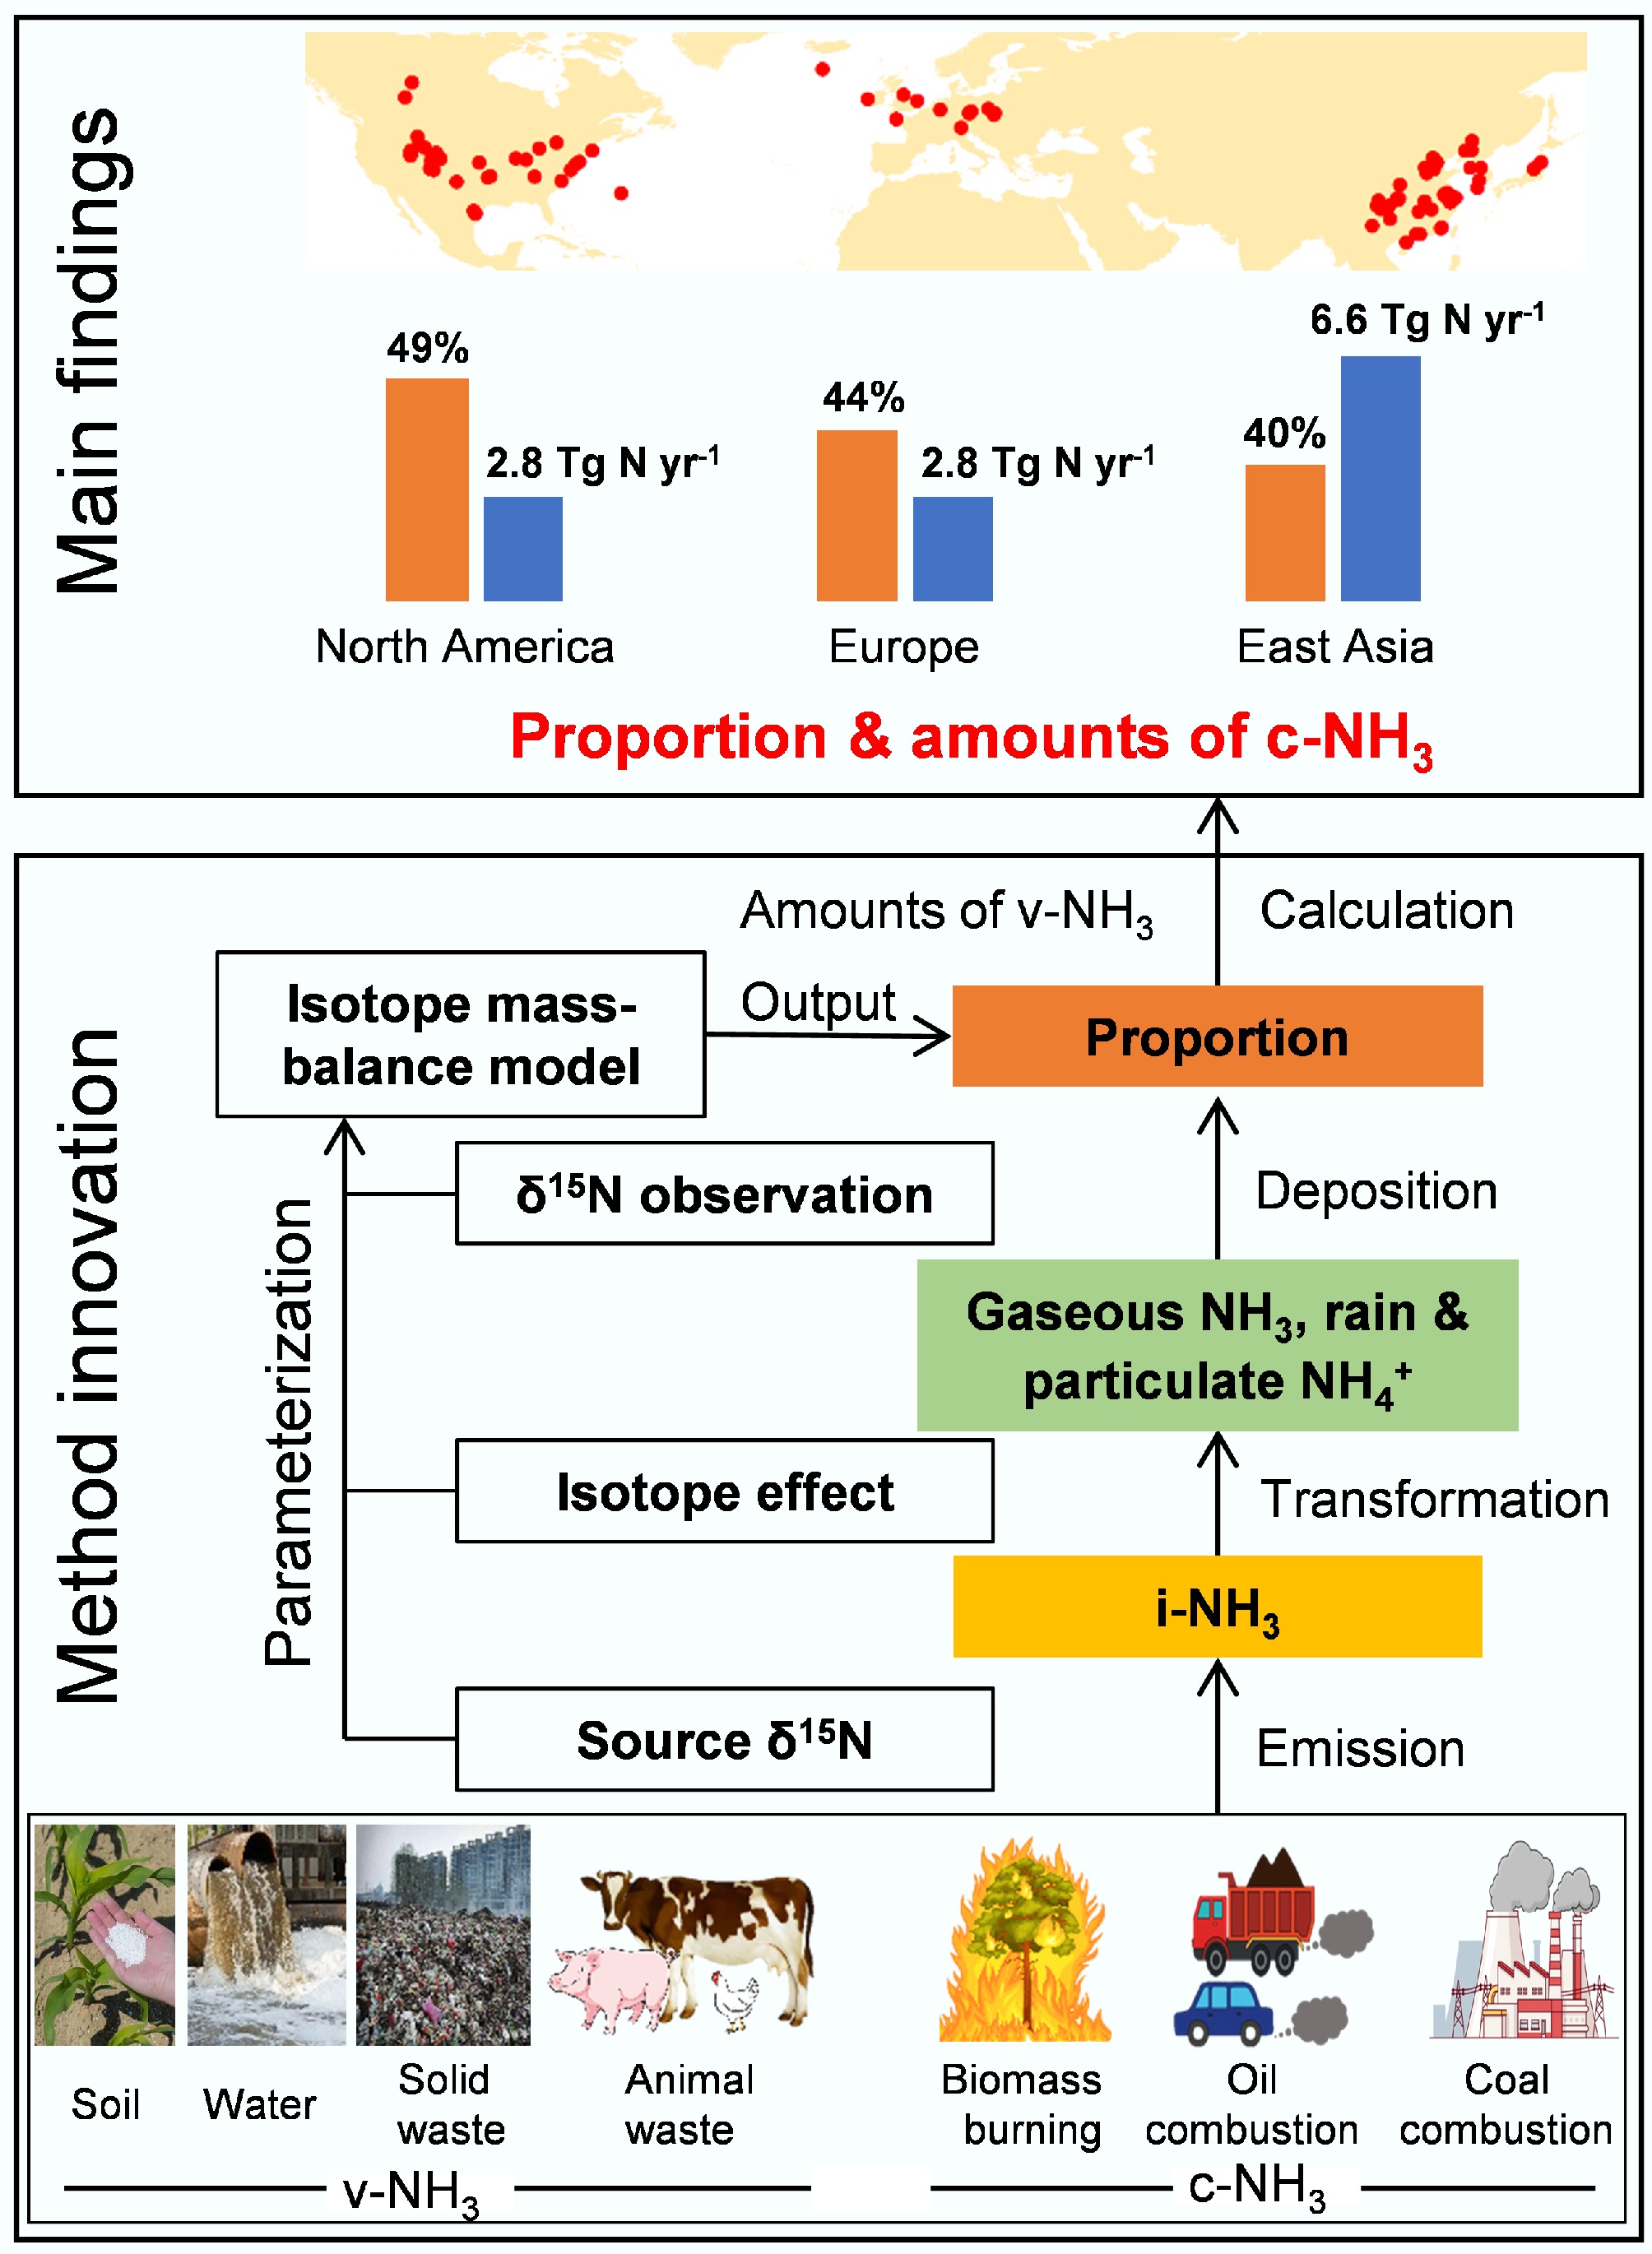
Figure 3.
Main principles and key findings of atmospheric NH3 and NH4+ isotope analysis (modified from Chen et al.[6]).
-
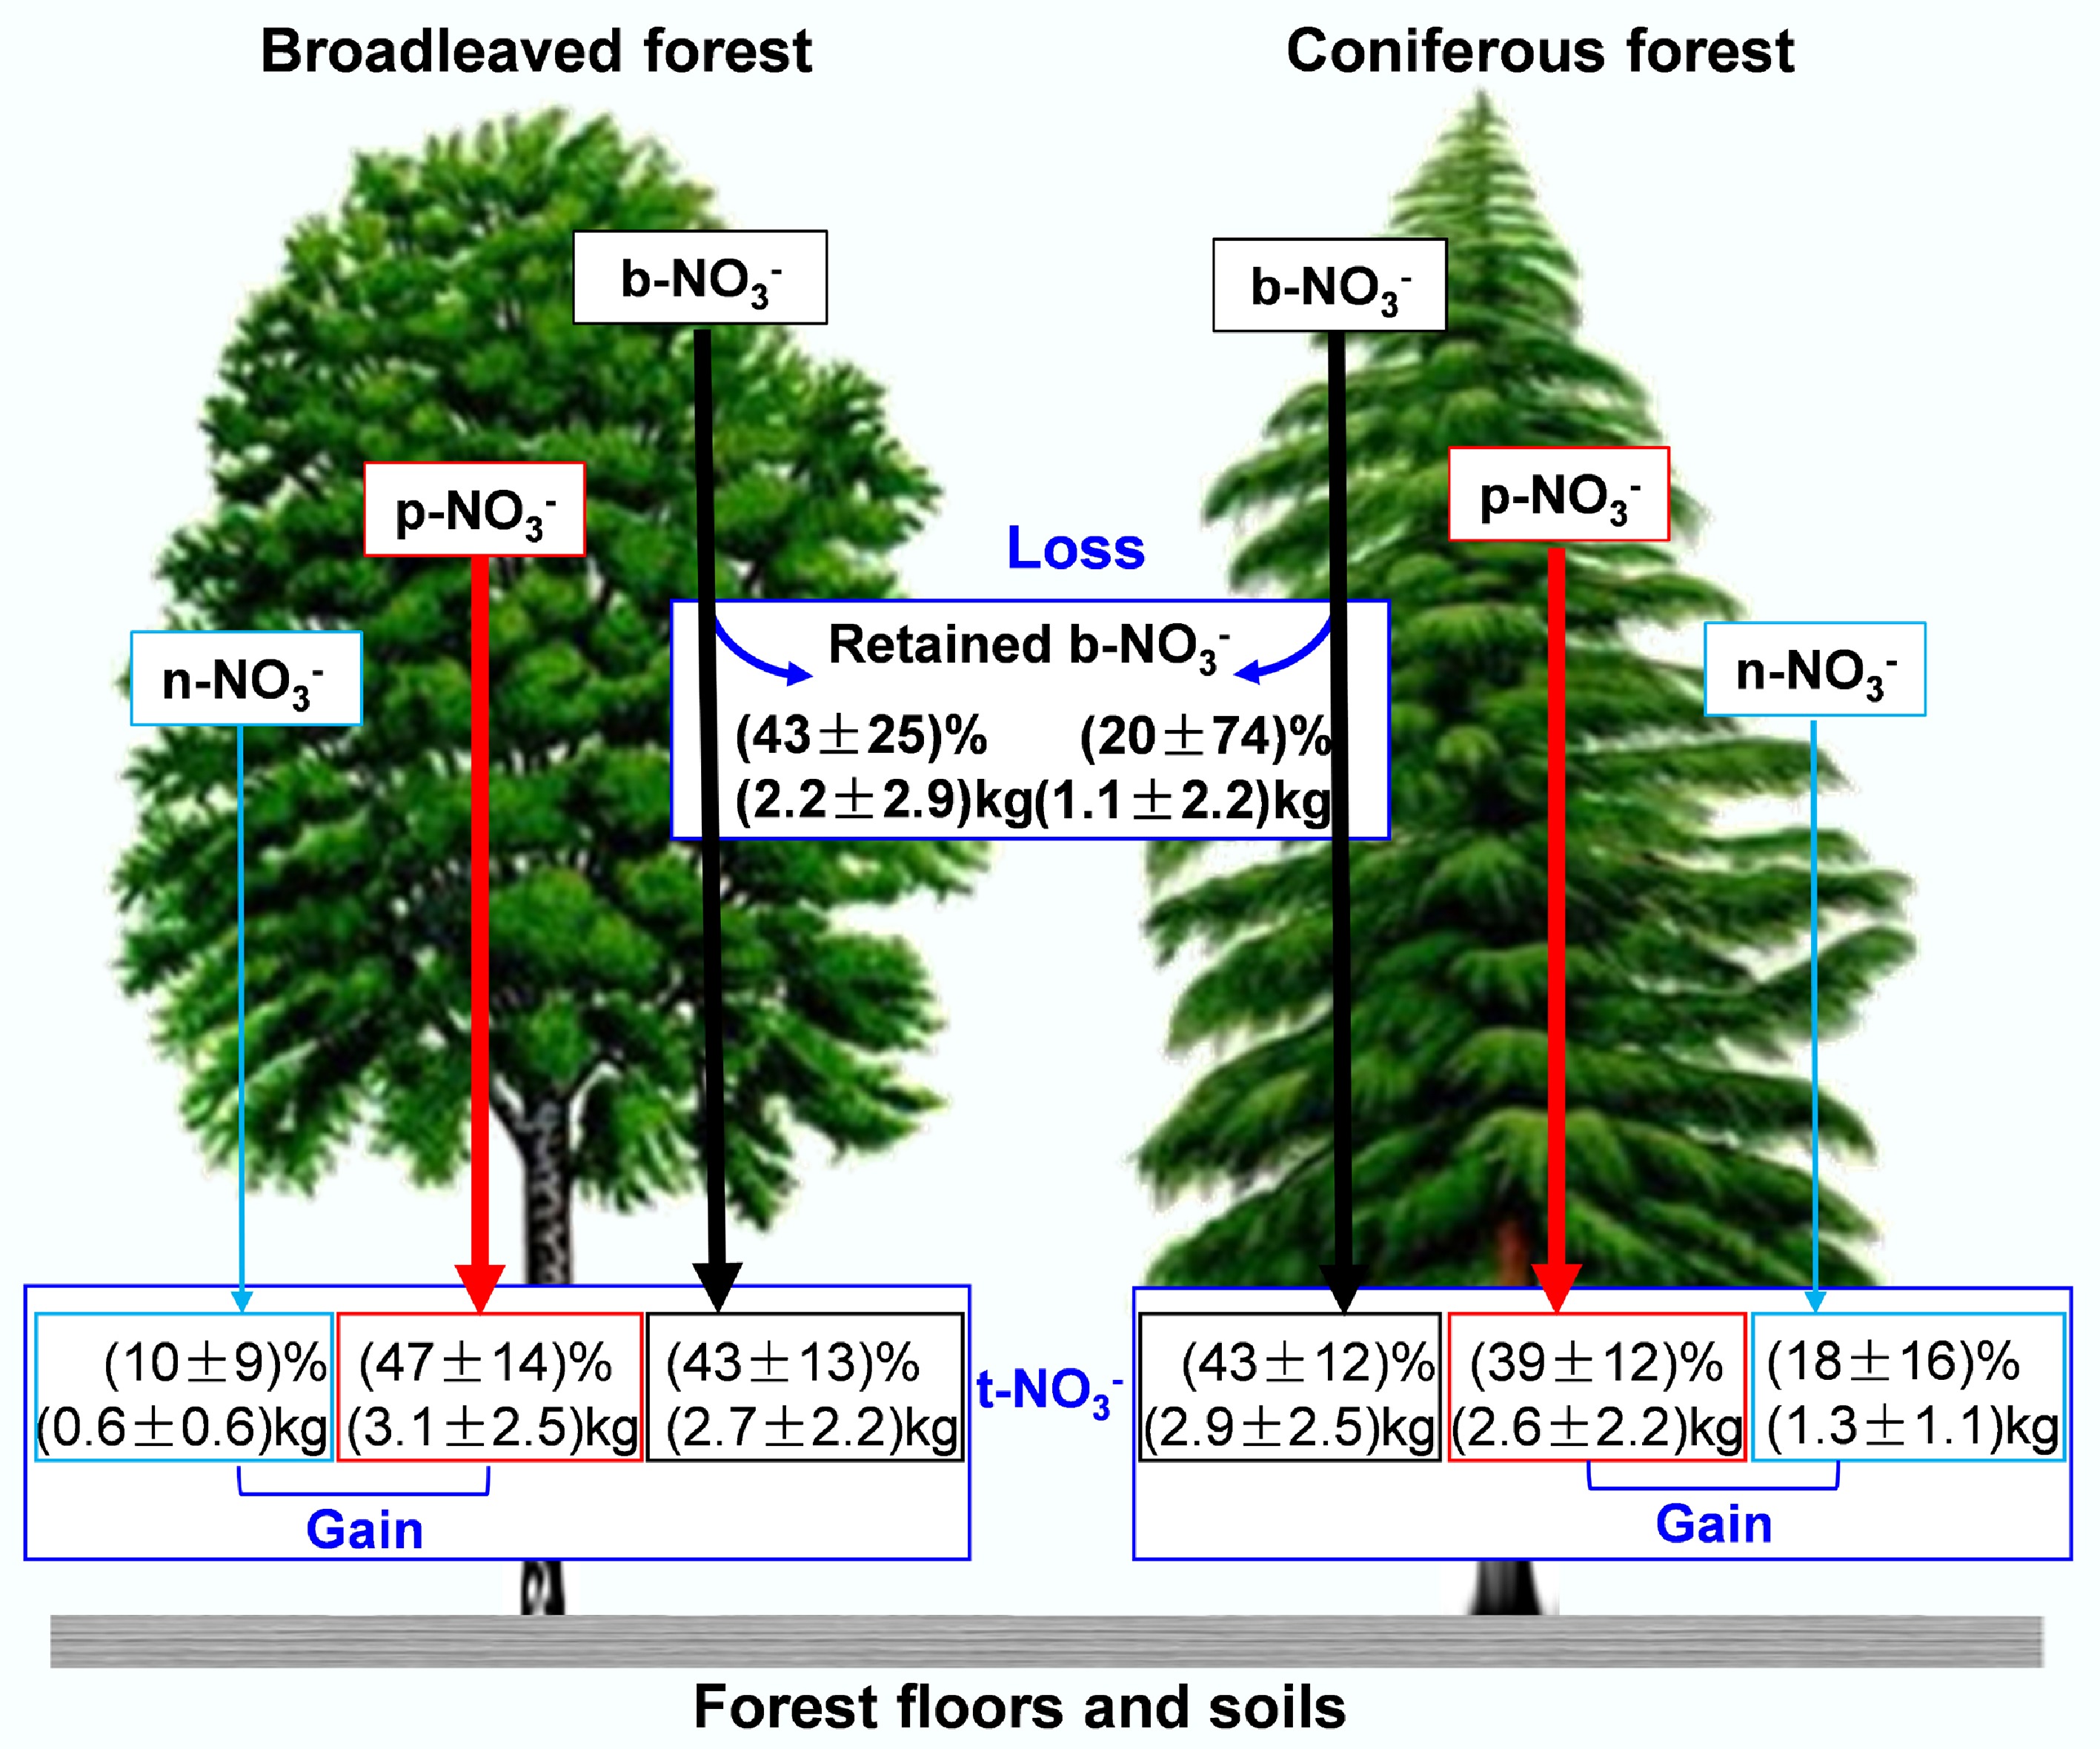
Figure 4.
Proportion and flux of the primary exchange process of nitrate between precipitation and canopy (modified from Liu et al.[32]).
-
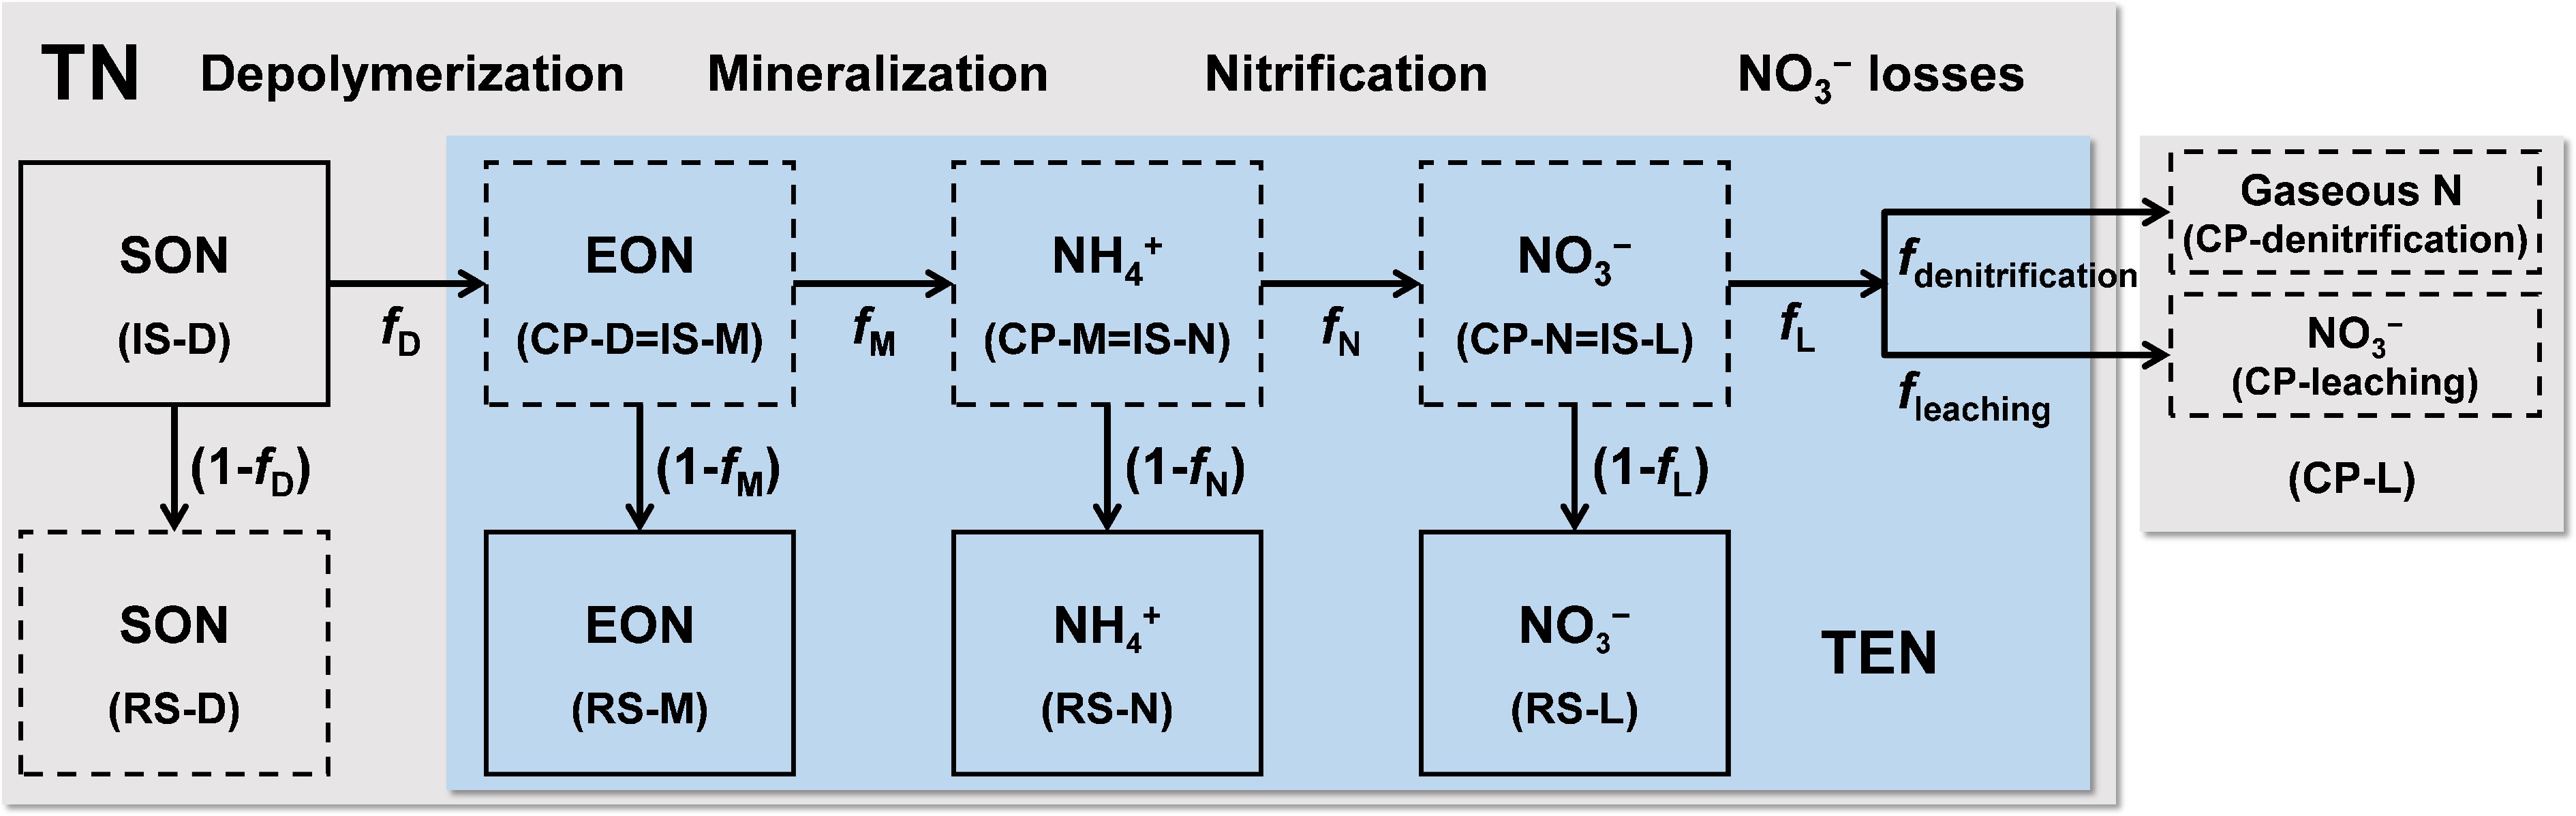
Figure 5.
Conceptual diagram of soil nitrogen transformation process model (modified from Xu et al.[43]). D: Depolymerization; M: Mineralization; N: Nitrification; TN: Total nitrogen; SON: Soil organic nitrogen; EON: Extractable organic nitrogen; TEN: Total extractable nitrogen. IS: The initial substrate of the nitrogen conversion process; CP: The reaction products of the nitrogen conversion process; RS: Remaining substrates in the nitrogen conversion process. f: The proportion of reaction products in the initial substrate for each nitrogen conversion process. 1-f: The proportion of residual substrates in the initial substrate for each nitrogen conversion process.
-
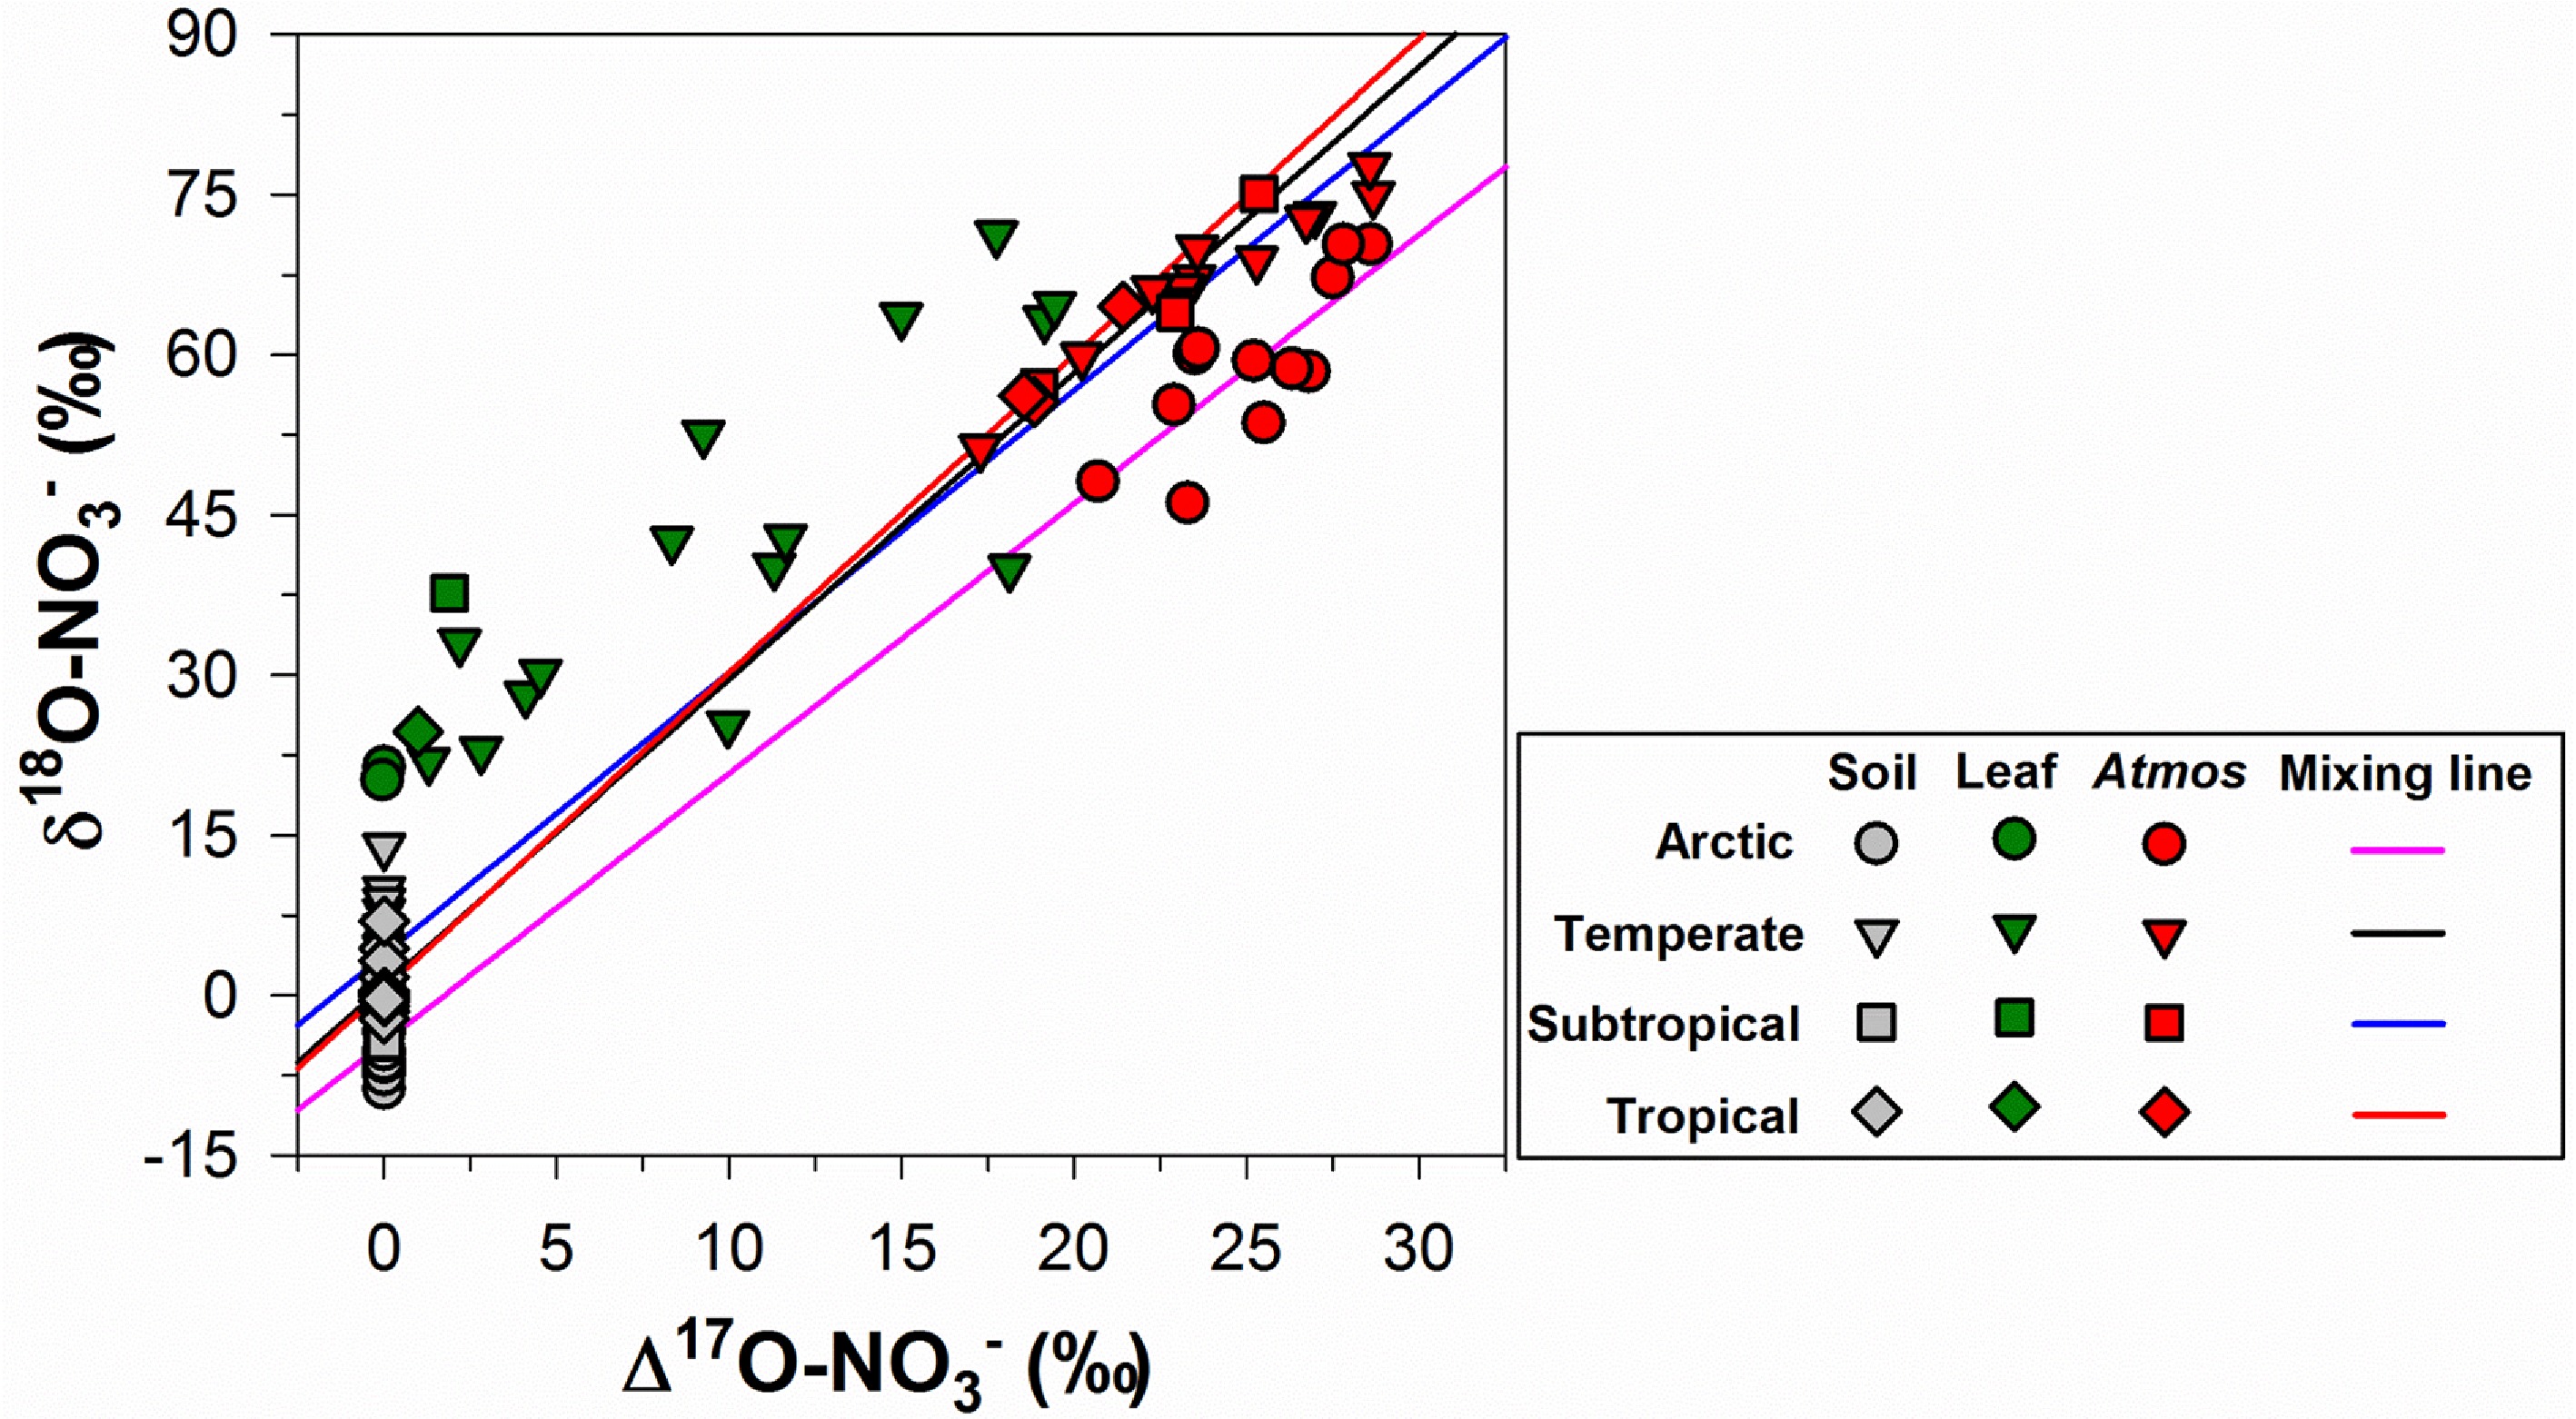
Figure 6.
Distribution of Δ17O and δ18O in nitrates of atmosphere-plant-soil systems (modified from Liu et al.[8]).
-
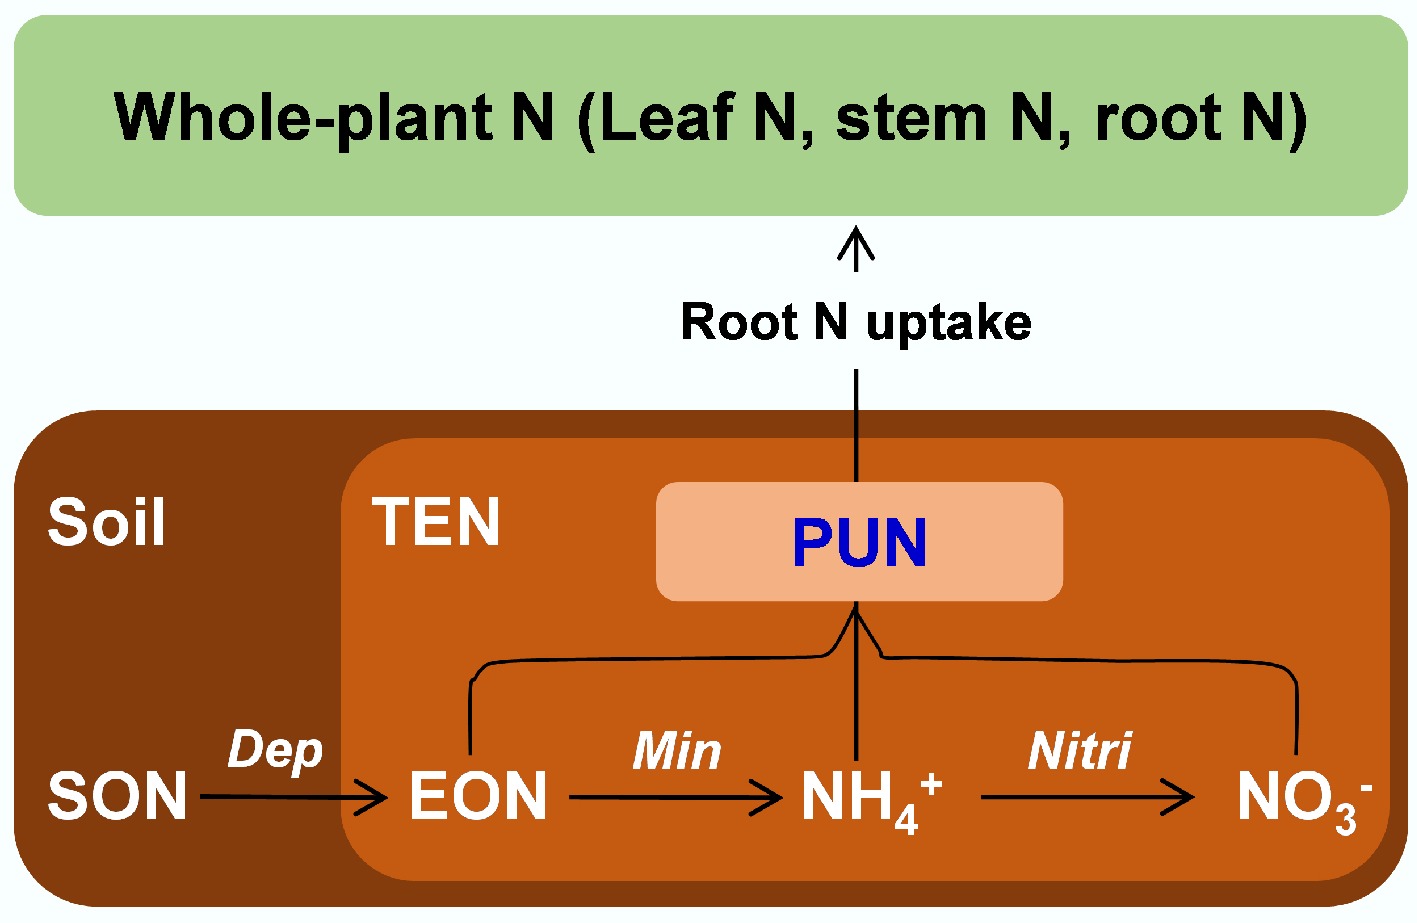
Figure 7.
Sources and processes of PUN in terrestrial ecosystems (modified from Hu et al.[9]). PUN: plant-used N, SON: soil organic N, TEN: total extractable N, EON: extractable organic N, NH4+: ammonium, NO3−: nitrate, Dep: depolymerization, Min: mineralization, Nitri: nitrification.
-
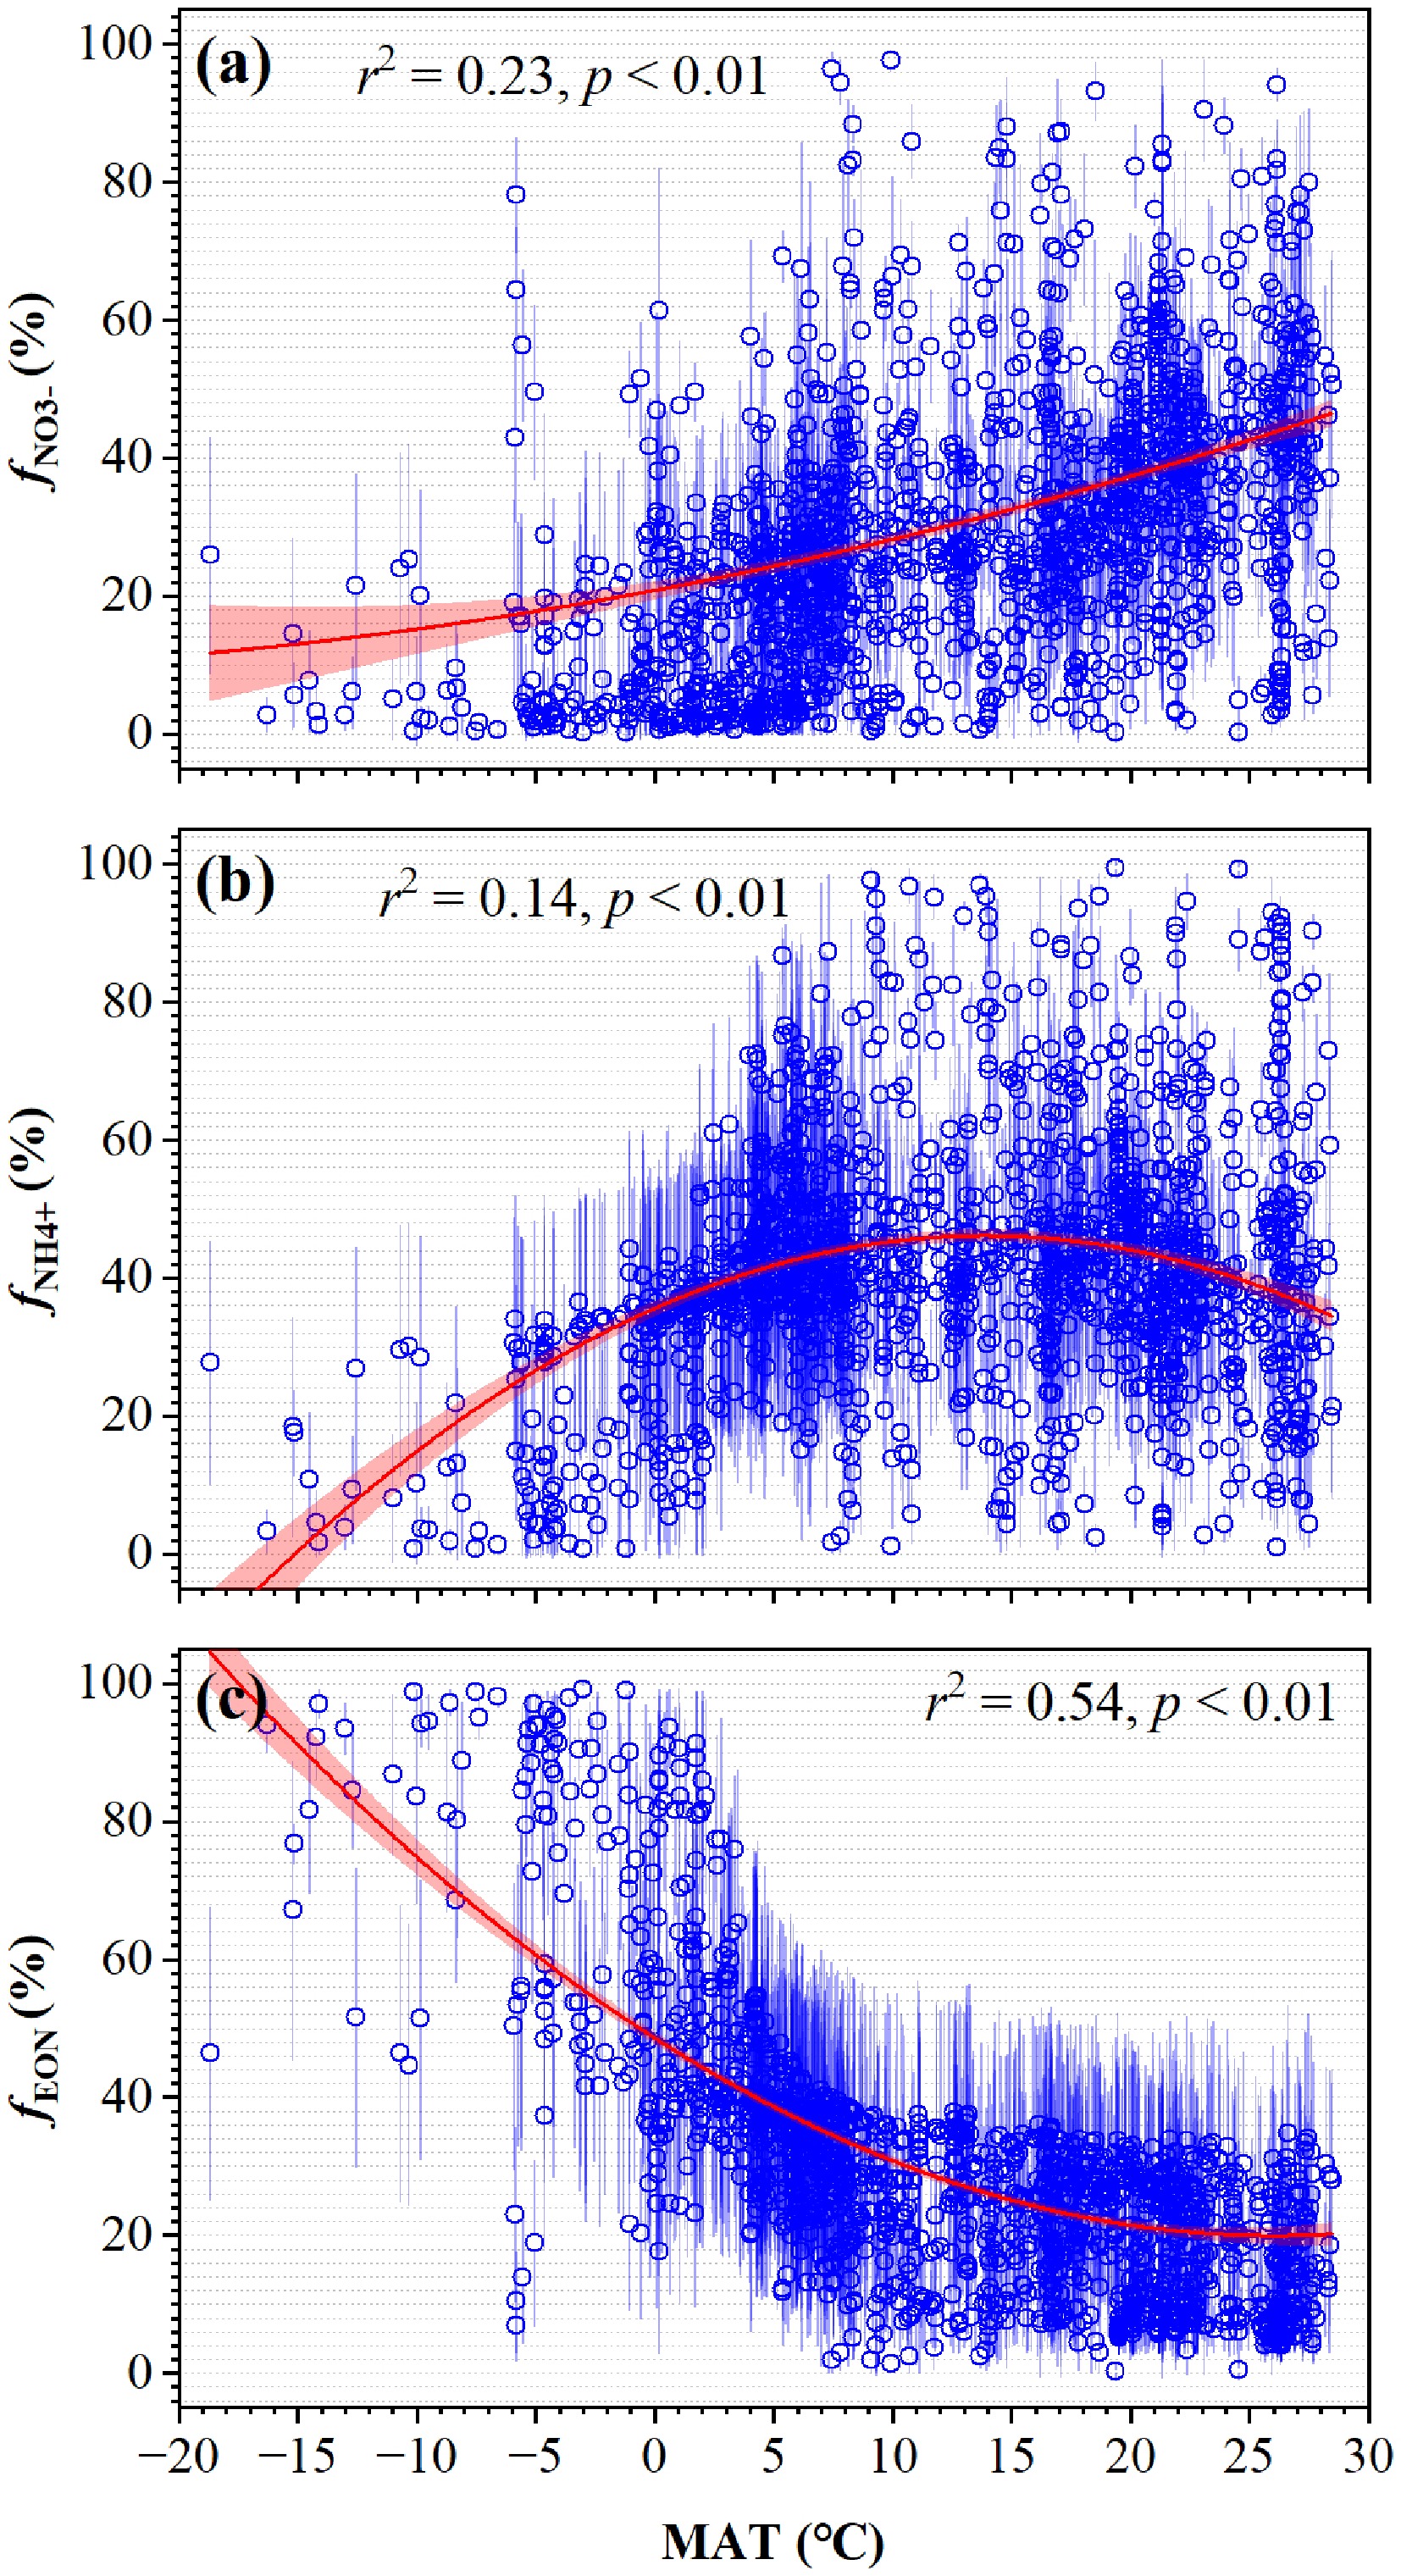
Figure 8.
Variations of soil N-source contributions to PUN with MAT (modified from Hu et al.[9]). (a)
$f_{\rm NO_3^-} $ $f_{\rm NH_4^+} $ $f_{\rm EON} $ -
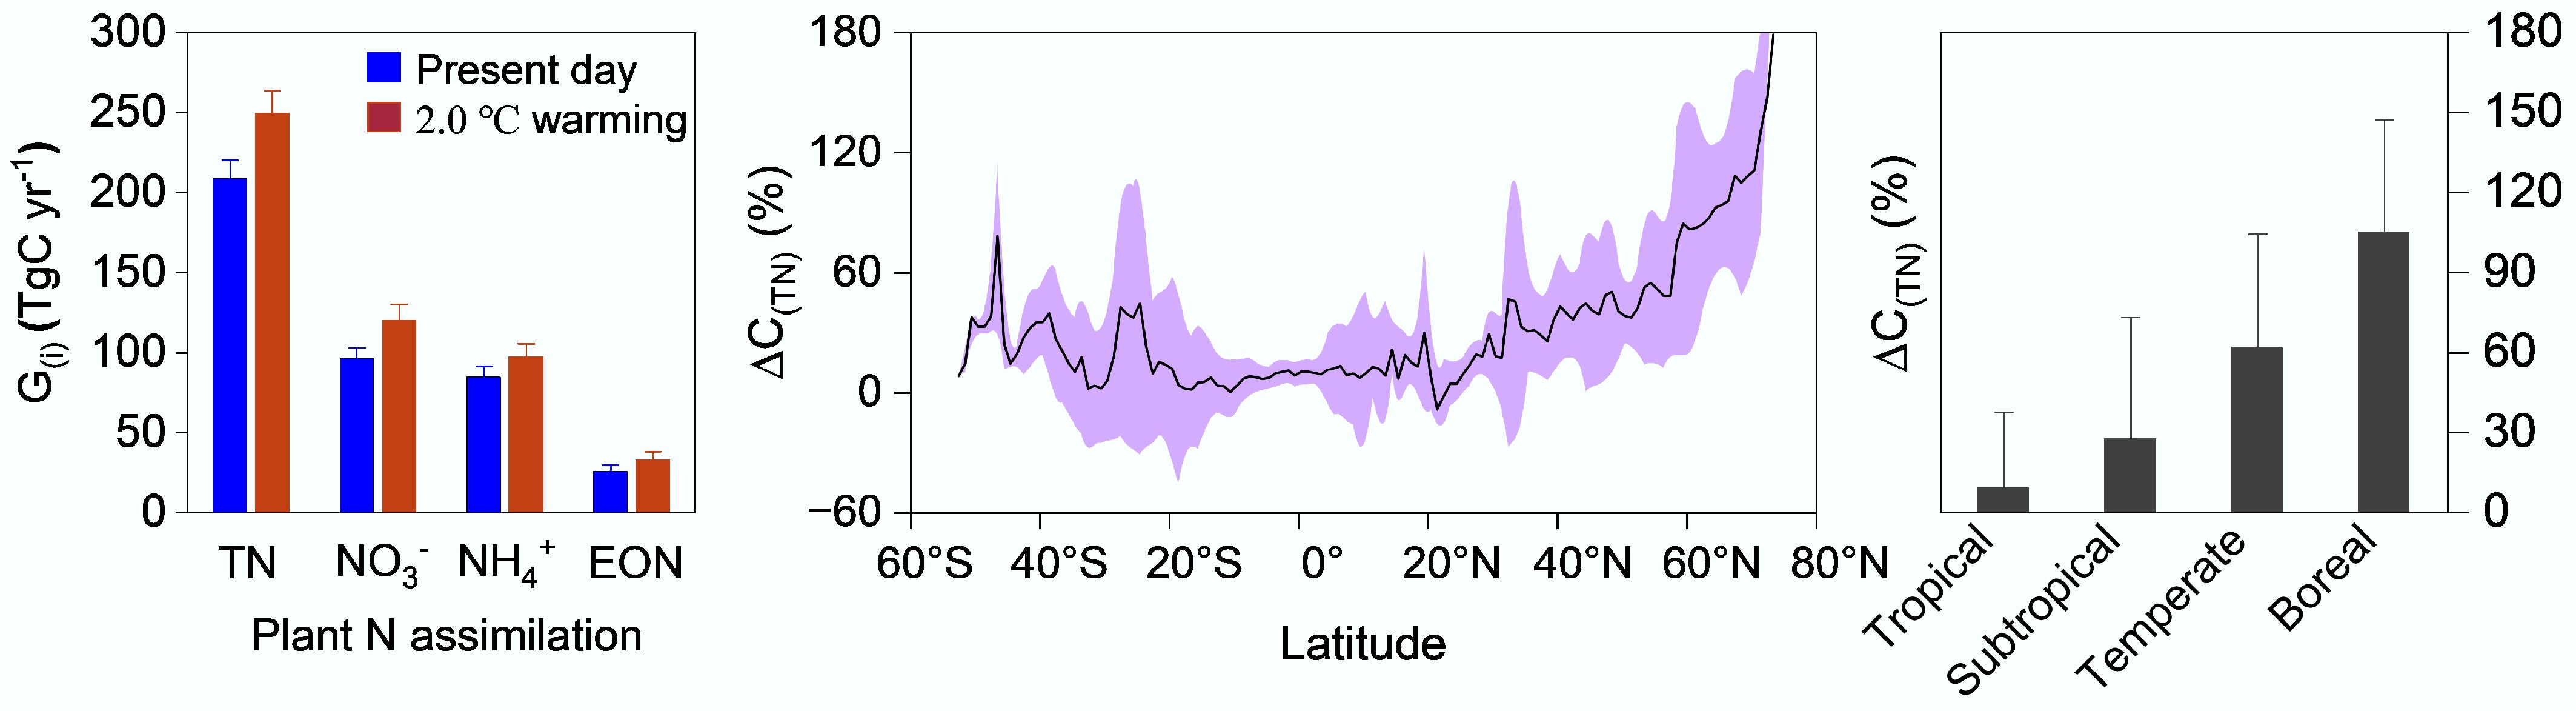
Figure 9.
Carbon consumption for nitrogen assimilation by global terrestrial plants and its response to climate warming (modified from Hu et al.[61]). (G(i) represents the gross C consumption associated with the assimilation of total N (TN), nitrate (NO3−), ammonium (NH4+), and extractable organic N (EON) by global terrestrial plants. ΔC(TN) denotes the relative change in C consumption for TN assimilation under the 2.0 °C warming scenario compared with the present-day.
-

Figure 10.
Mechanisms of plant nitrogen assimilation and its carbon costs in response to climate warming (modified from Hu et al.[61]).
Figures
(10)
Tables
(0)