-
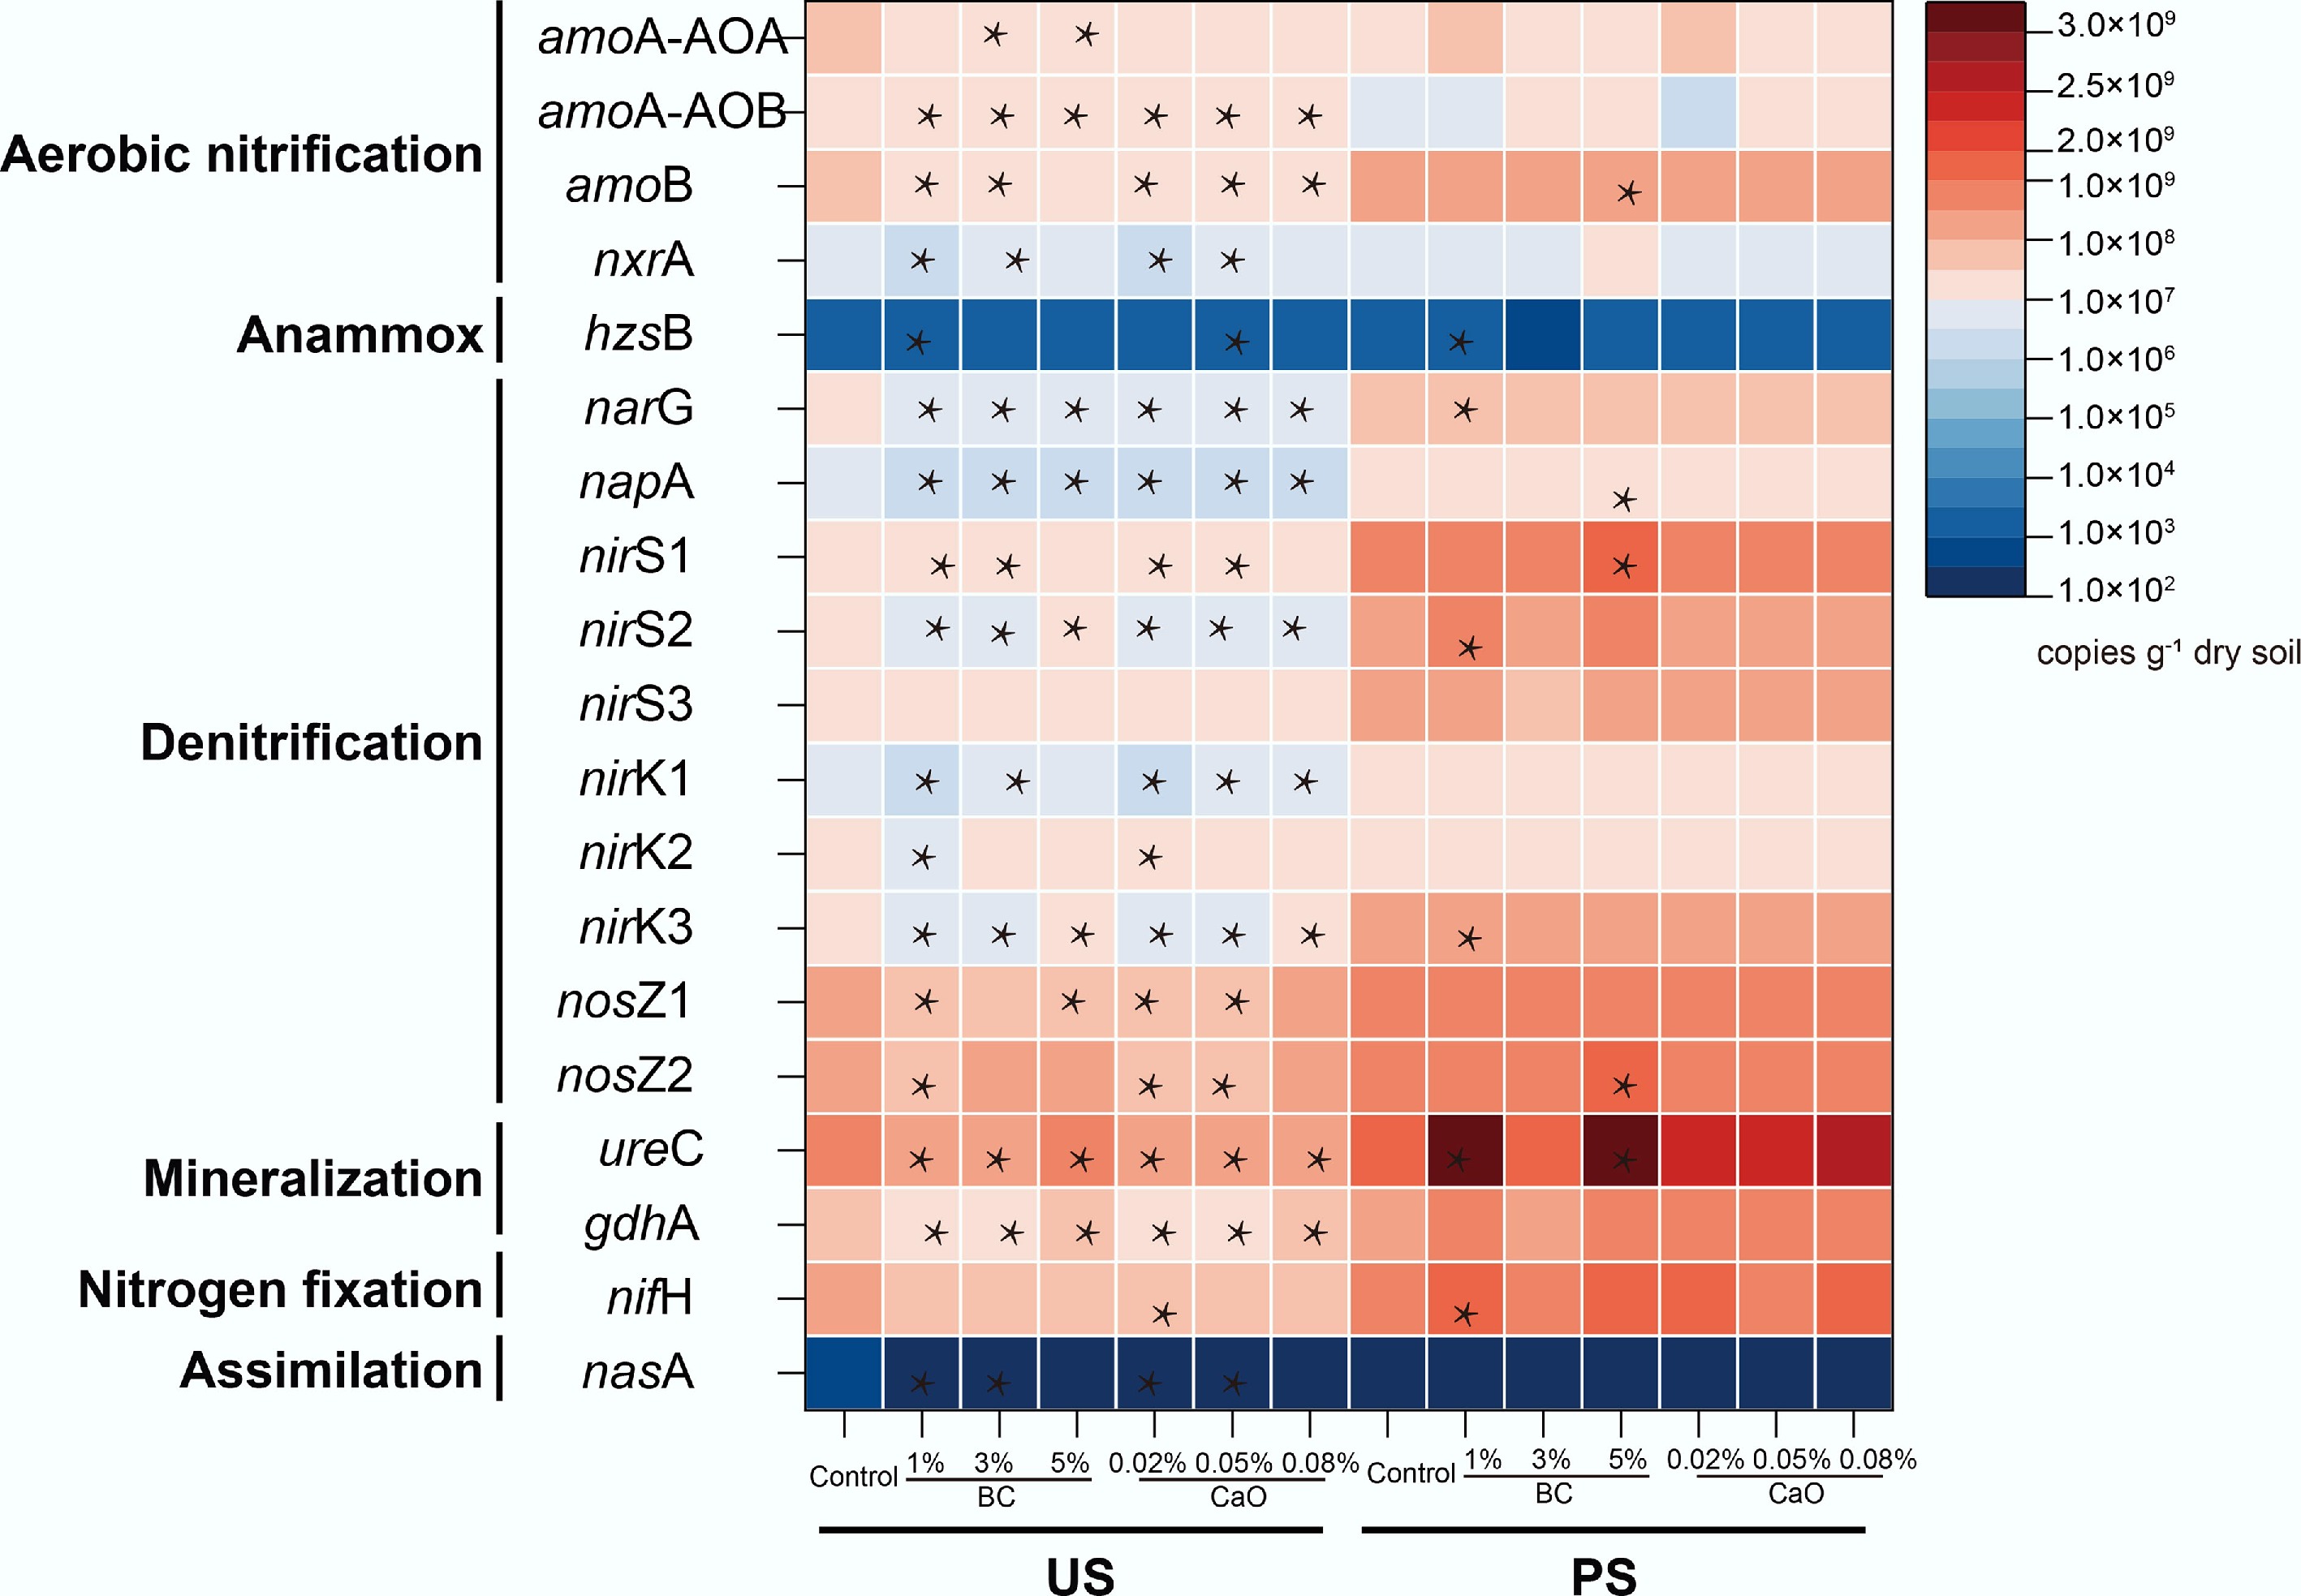
Figure 1.
Soil nitrogen cycling related functional gene abundance after biochar or CaO addition in two studied soils; the color of the block represents the functional gene abundance in nitrogen transformation. * Indicate the statistical significance with significance levels of p < 0.05. BC, Biochar; CaO, lime; US, upland soil; PS, paddy soil.
-
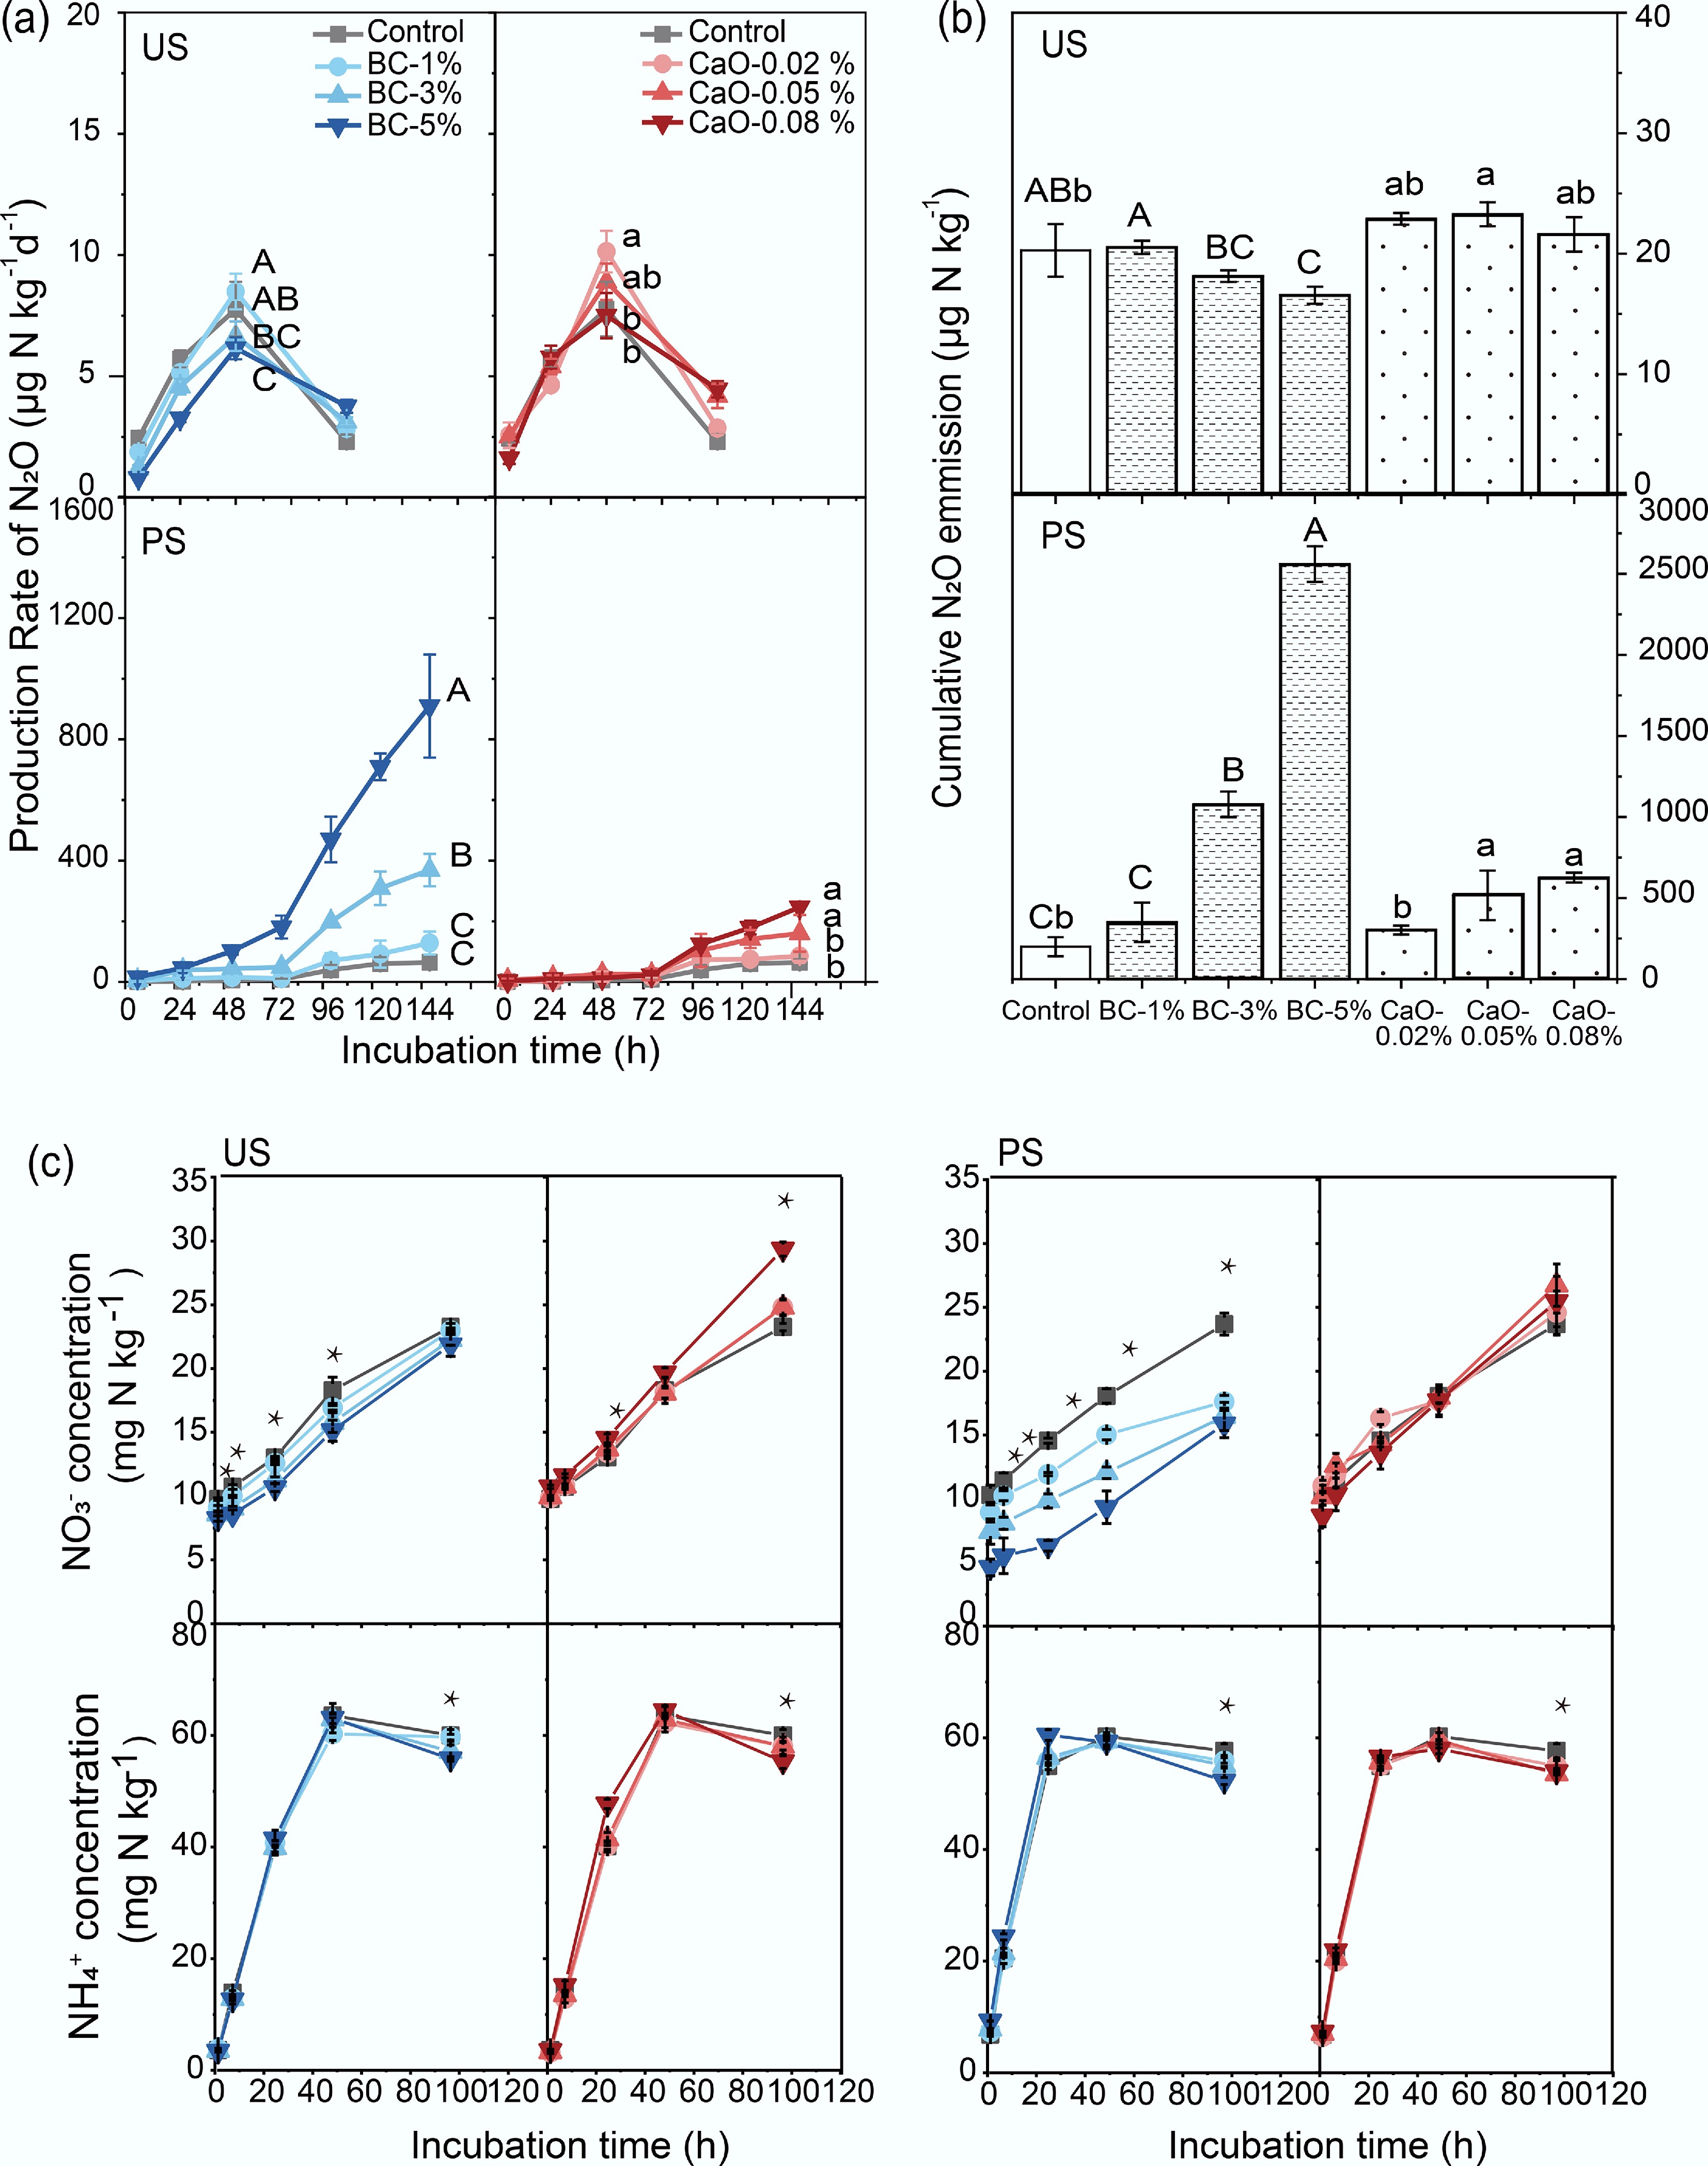
Figure 2.
Dynamics of (a) soil N2O production rate, and (b) cumulative soil N2O emission, and (c) inorganic nitrogen concentrations after biochar or CaO addition in two studied soils. Error bars indicate the standard deviations of the means (n = 3). Different capital letters indicate significant differences between BC treatments in the same soil (p < 0.05); different lowercase letters indicate significant differences between CaO treatments in the same soil (p < 0.05). * Indicate statistical significance at p < 0.05. BC, Biochar; CaO, lime; US, upland soil; PS, paddy soil.
-
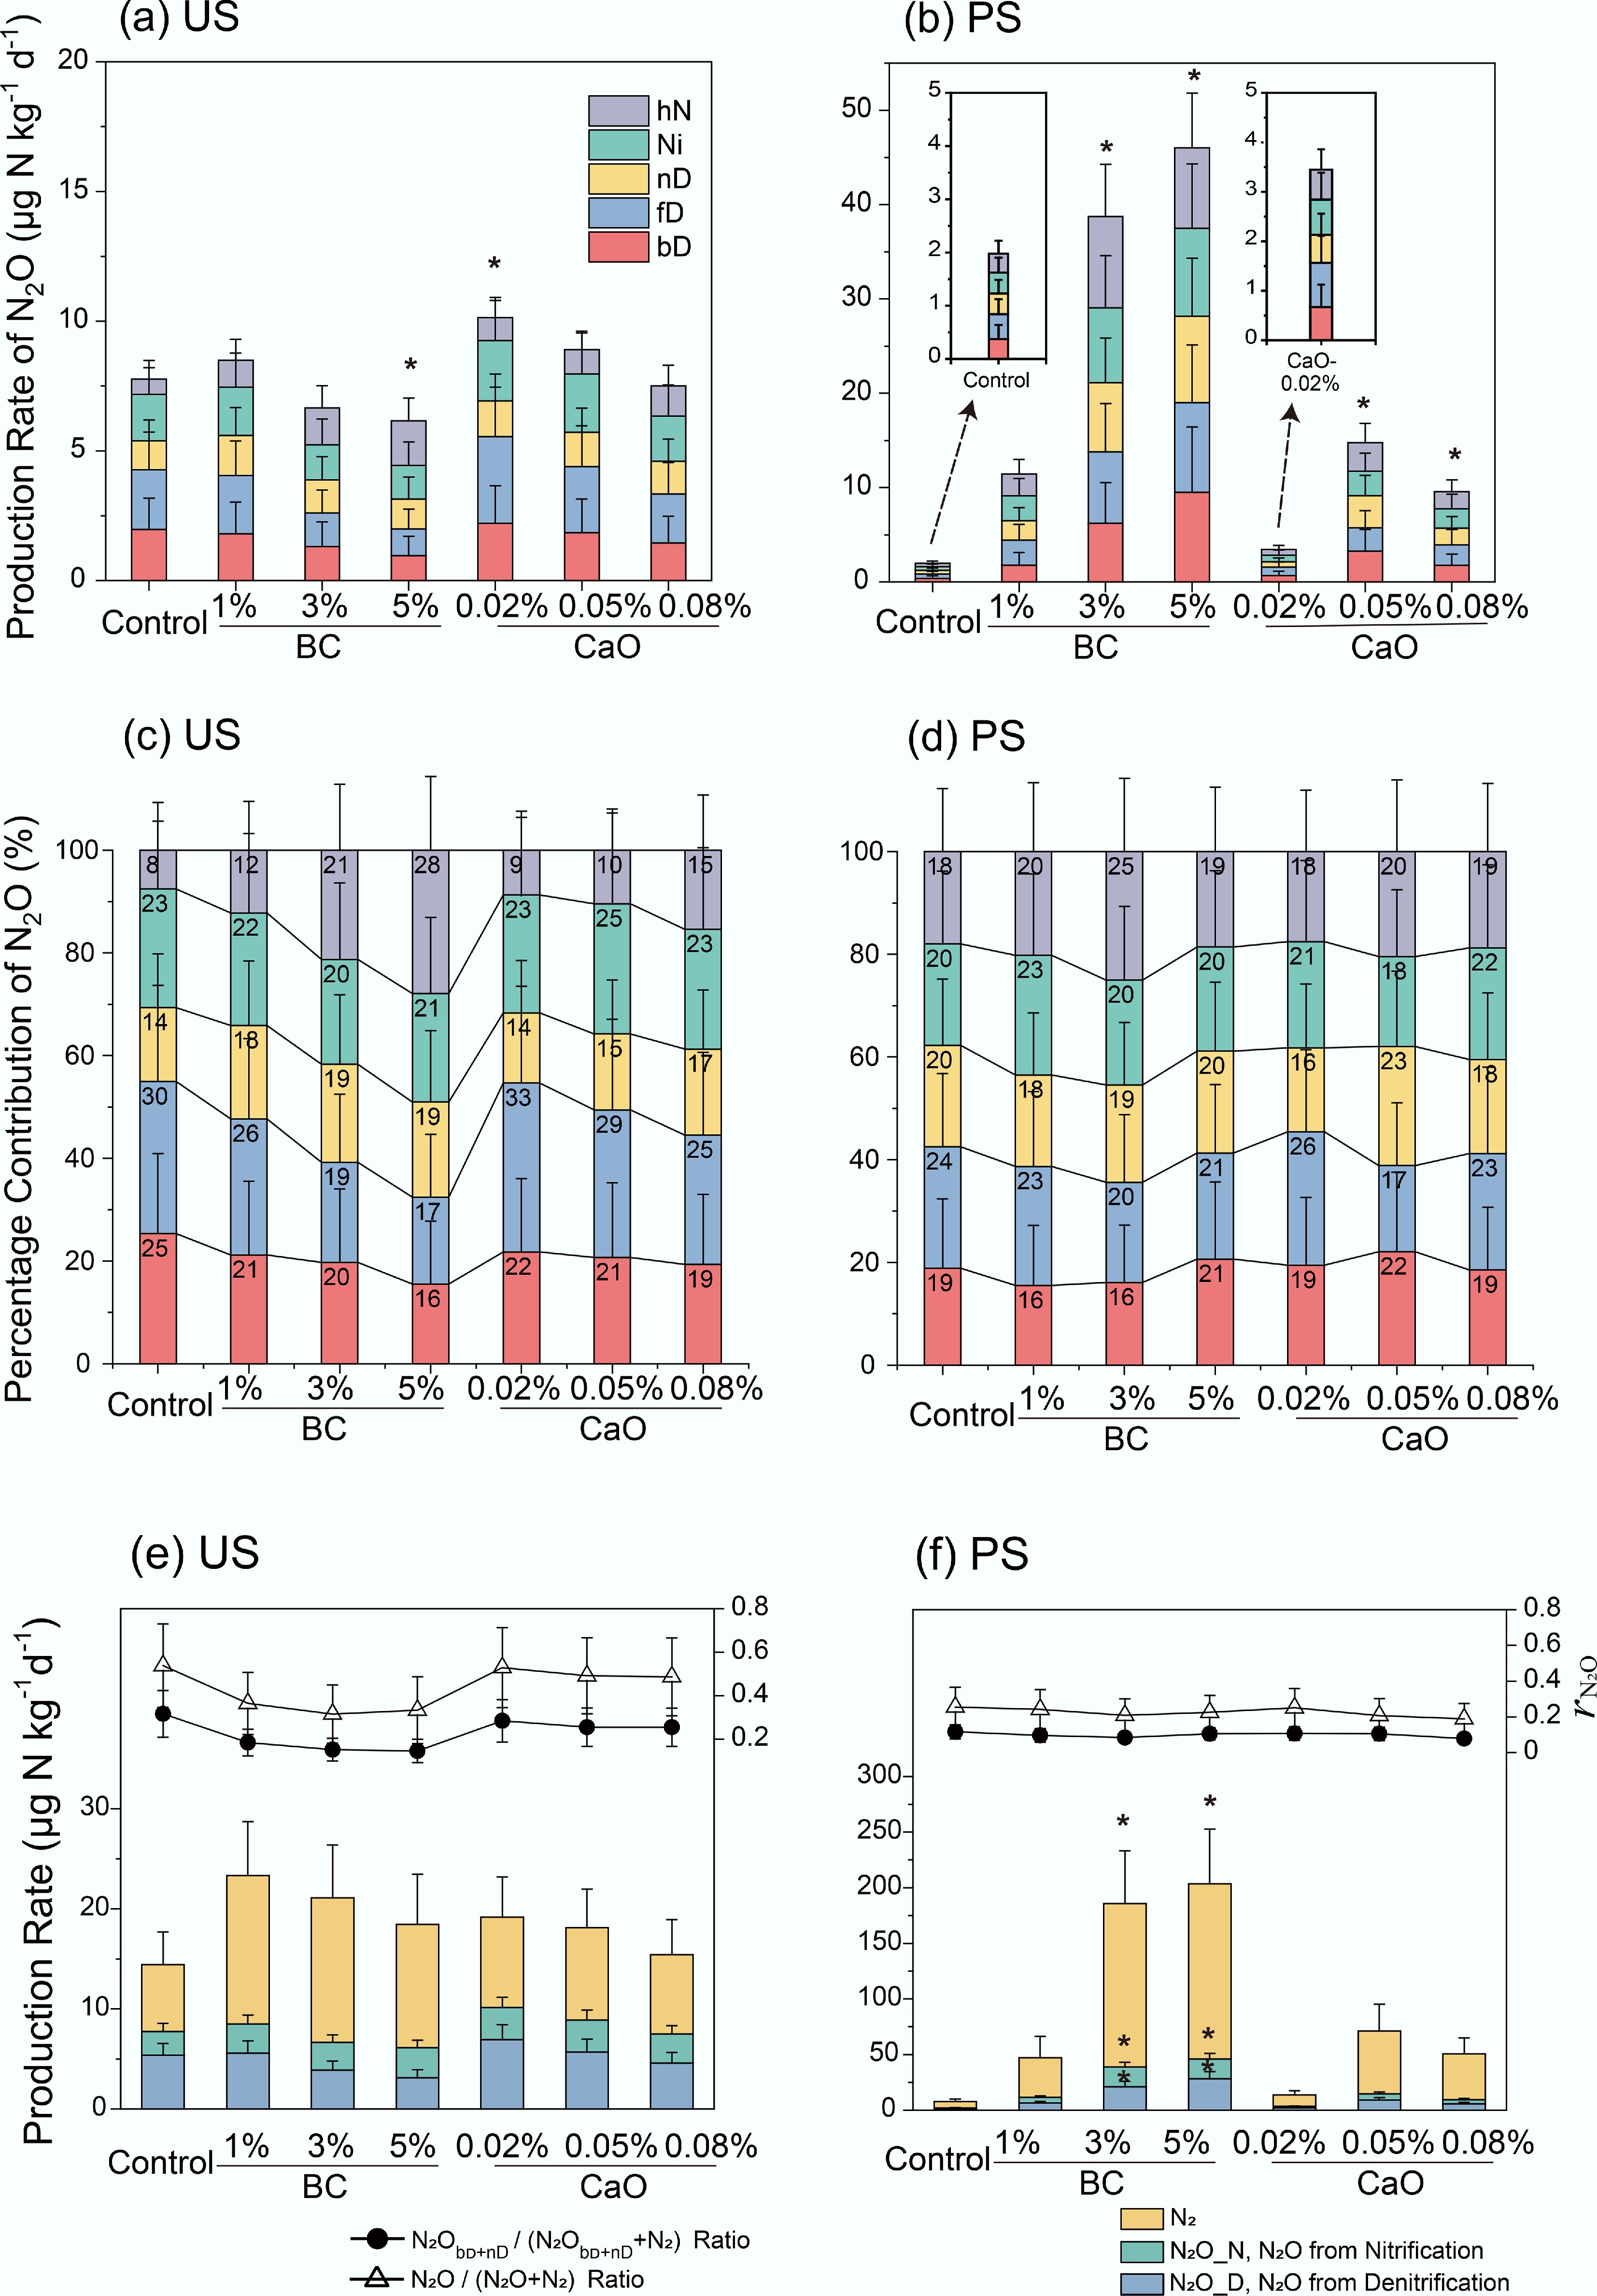
Figure 3.
(a), (b) N2O production from soil N2O pathways, (c), (d) their percentage contribution to total N2O emission, and (e), (f) N2O/N2 production rate (column) and the proportion of N2O after biochar or CaO addition in two studied soils. bD, bacterial denitrification; fD, fungal denitrification; nD, nitrifier denitrification; Ni, nitrification; hN, heterotrophic nitrification. * Indicate the statistical significance with significance levels of p < 0.05. BC, Biochar; CaO, lime; US, upland soil; PS, paddy soil.
-
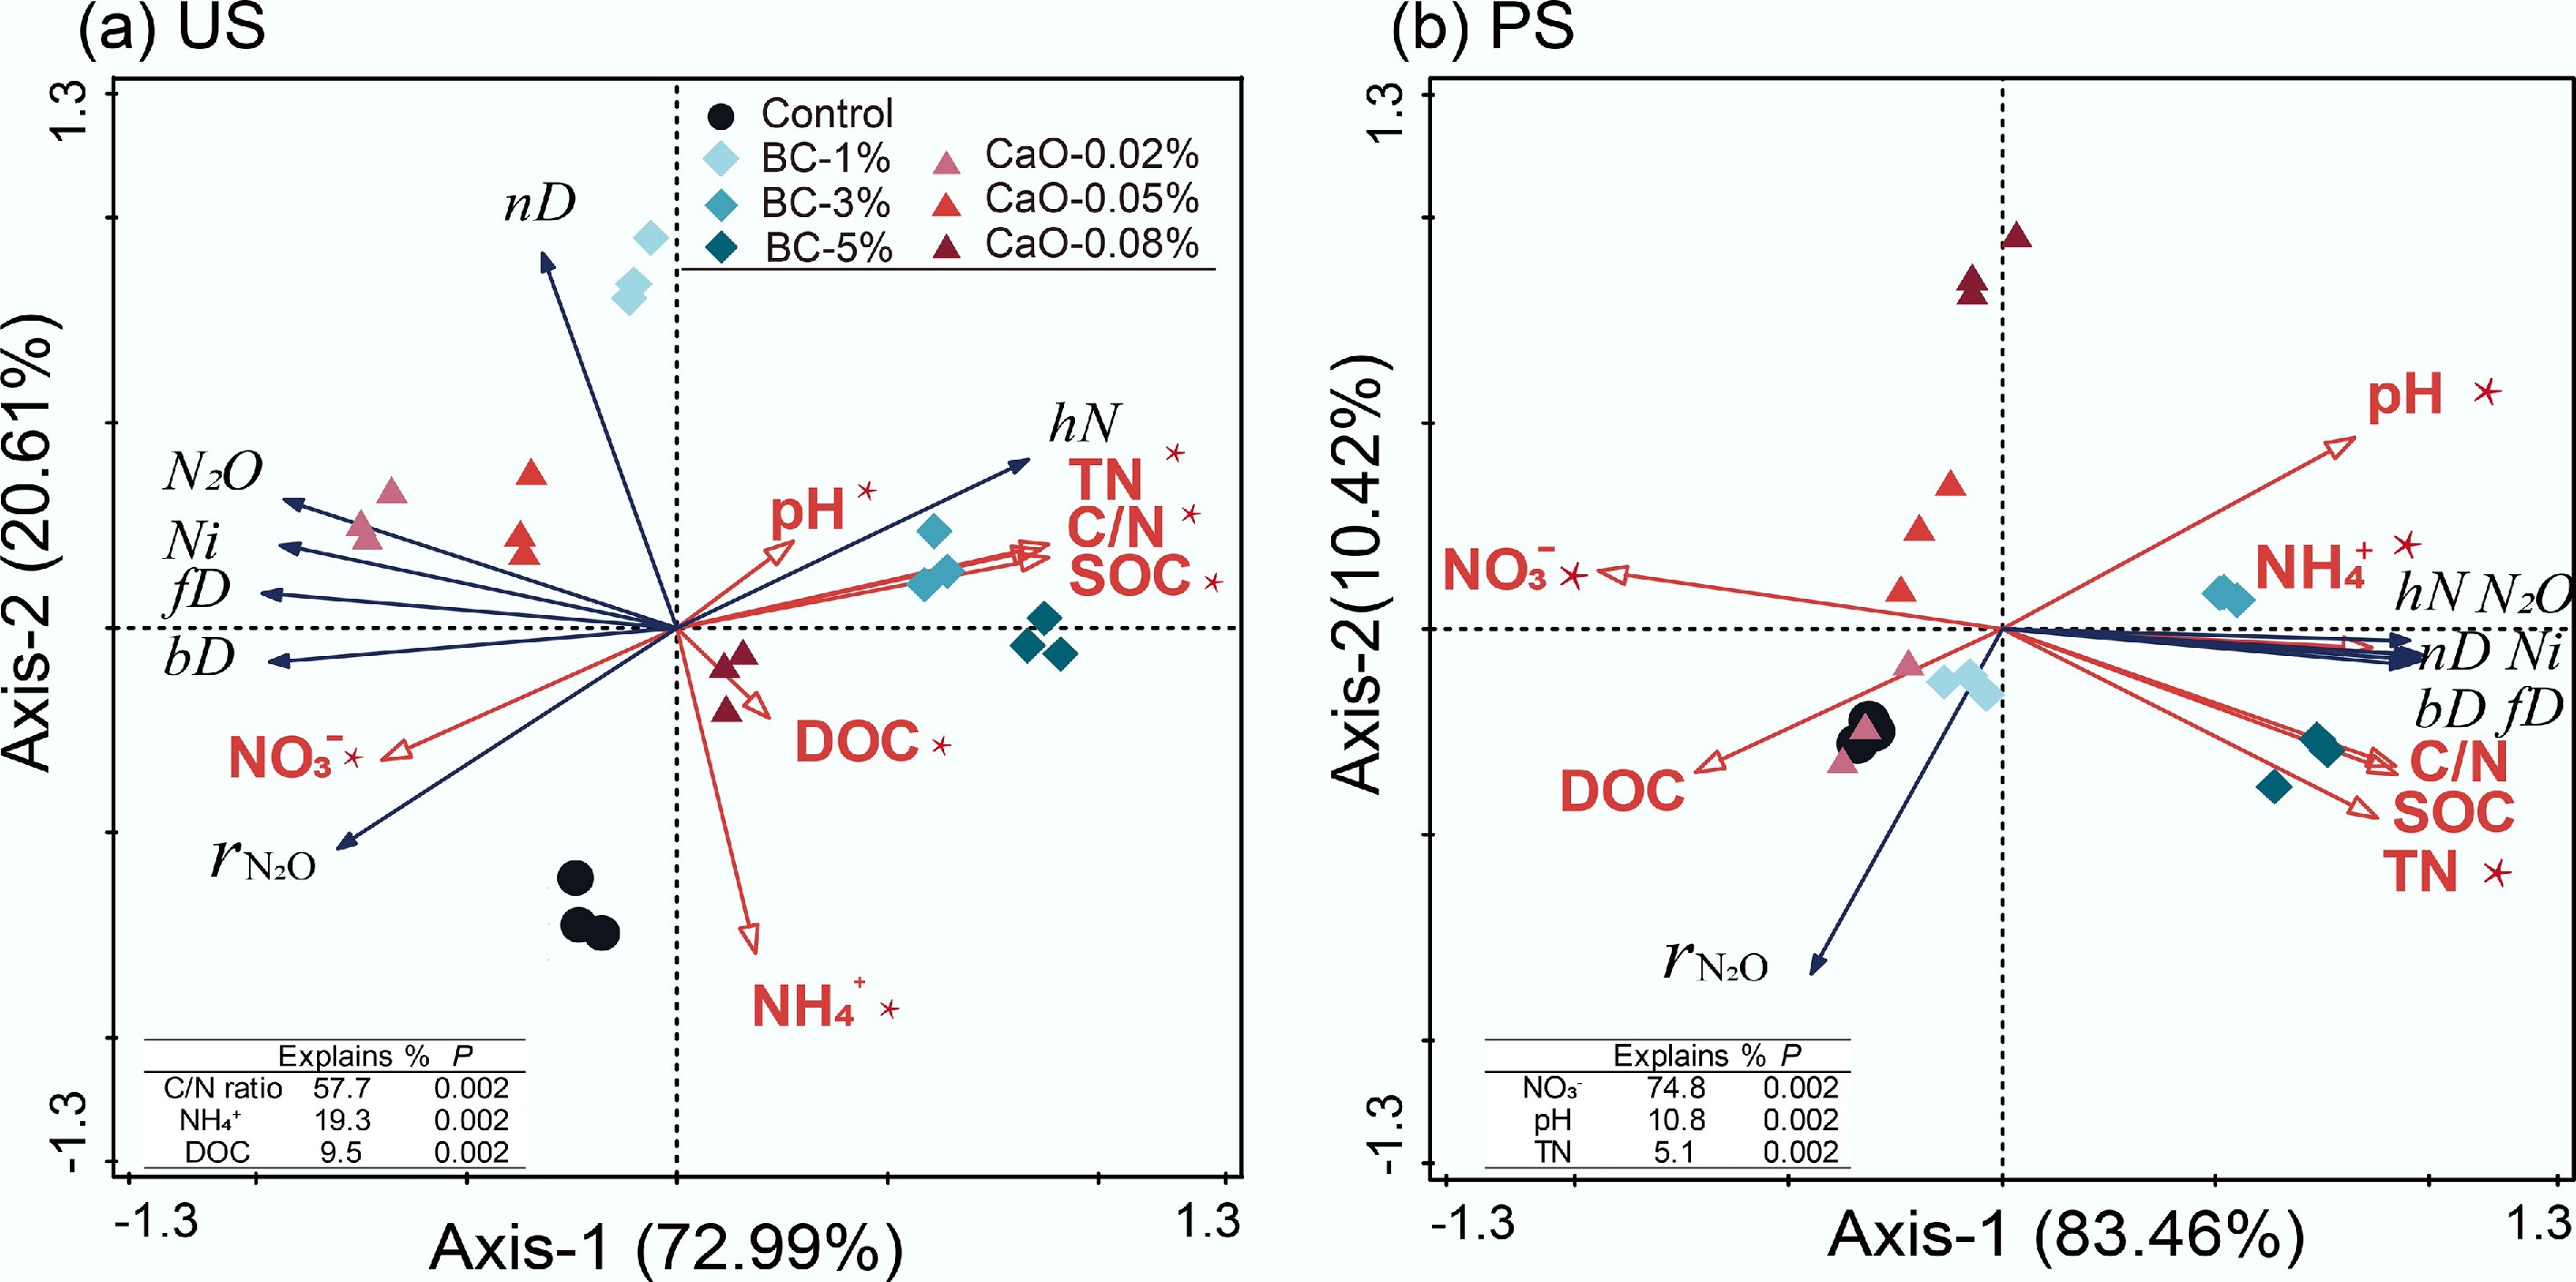
Figure 4.
Redundancy analyses (RDA) of the N2O production rate in each pathway and soil physicochemical properties. bD, bacterial denitrification; fD, fungal denitrification; nD, nitrifier denitrification; Ni, nitrification; hN, heterotrophic nitrification; BC, Biochar; CaO, lime; US, upland soil; PS, paddy soil.
-
Soil Treatment pH SOC (g C kg−1) TN (g N kg−1) DOC (mg C kg−1) C/N ratio US Control 4.87 ± 0.00 Cd 8.61 ± 0.80 Da 0.99 ± 0.00 Da 78.52 ± 2.44 Cb 8.72 ± 0.81 Da BC-1% 4.97 ± 0.04 C 13.07 ± 0.69 C 1.10 ± 0.01 C 48.80 ± 0.18 D 11.86 ± 0.49 C BC-3% 5.06 ± 0.06 B 21.52 ± 0.47 B 1.22 ± 0.03 B 91.77 ± 1.91 B 17.64 ± 0.92 B BC-5% 5.22 ± 0.01 A 31.07 ± 0.63 A 1.43 ± 0.02 A 103.15 ± 2.33 A 21.78 ± 0.58 A CaO-0.02% 5.04 ± 0.01 c 8.10 ± 0.75 a 0.97 ± 0.02 ab 92.75 ± 1.79 a 8.34 ± 1.00 a CaO-0.05% 5.29 ± 0.01 b 8.37 ± 0.54 a 0.94 ± 0.04 b 93.68 ± 0.58 a 8.88 ± 0.40 a CaO-0.08% 5.54 ± 0.04 a 7.99 ± 0.99 a 0.97 ± 0.01 ab 63.58 ± 0.60 c 8.21 ± 1.02 a PS Control 4.78 ± 0.02 Dc 13.40 ± 0.98 Da 1.53 ± 0.02 Ca 201.63 ± 3.67 Aa 8.77 ± 0.74 Da BC-1% 4.85 ± 0.02 C 17.62 ± 1.10 C 1.56 ± 0.02 C 164.60 ± 0.75 B 11.3 ± 0.68 C BC-3% 5.11 ± 0.02 B 25.38 ± 0.16 B 1.80 ± 0.02 B 142.83 ± 0.35 C 14.13 ± 0.21 B BC-5% 5.27 ± 0.04 A 35.29 ± 0.80 A 1.97 ± 0.04 A 163.10 ± 1.83 B 17.91 ± 0.39 A CaO-0.02% 4.87 ± 0.07 bc 12.94 ± 0.46 b 1.56 ± 0.02 a 171.47 ± 2.06 c 8.31 ± 0.28 a CaO-0.05% 4.97 ± 0.06 b 12.56 ± 0.24 c 1.48 ± 0.01 b 183.07 ± 1.36 b 8.46 ± 0.20 a CaO-0.08% 5.19 ± 0.05 a 11.34 ± 0.46 d 1.41 ± 0.03 c 161.73 ± 1.66 c 8.06 ± 0.50 a Data are expressed as the means ± SE (n = 3). Different capital letters indicate significant differences between BC treatments in the same soil (p < 0.05); different lowercase letters indicate significant differences between CaO treatments in the same soil (p < 0.05). SOC, soil organic carbon; TN, total nitrogen; DOC, dissolved organic carbon, C/N ratio, ratio of SOC to TN; US, upland soil; PS, paddy land soil; FS, forest land soil. Table 1.
Soil properties of two studied soils after Biochar (BC), and CaO (Quicklime) amendment
Figures
(4)
Tables
(1)