-
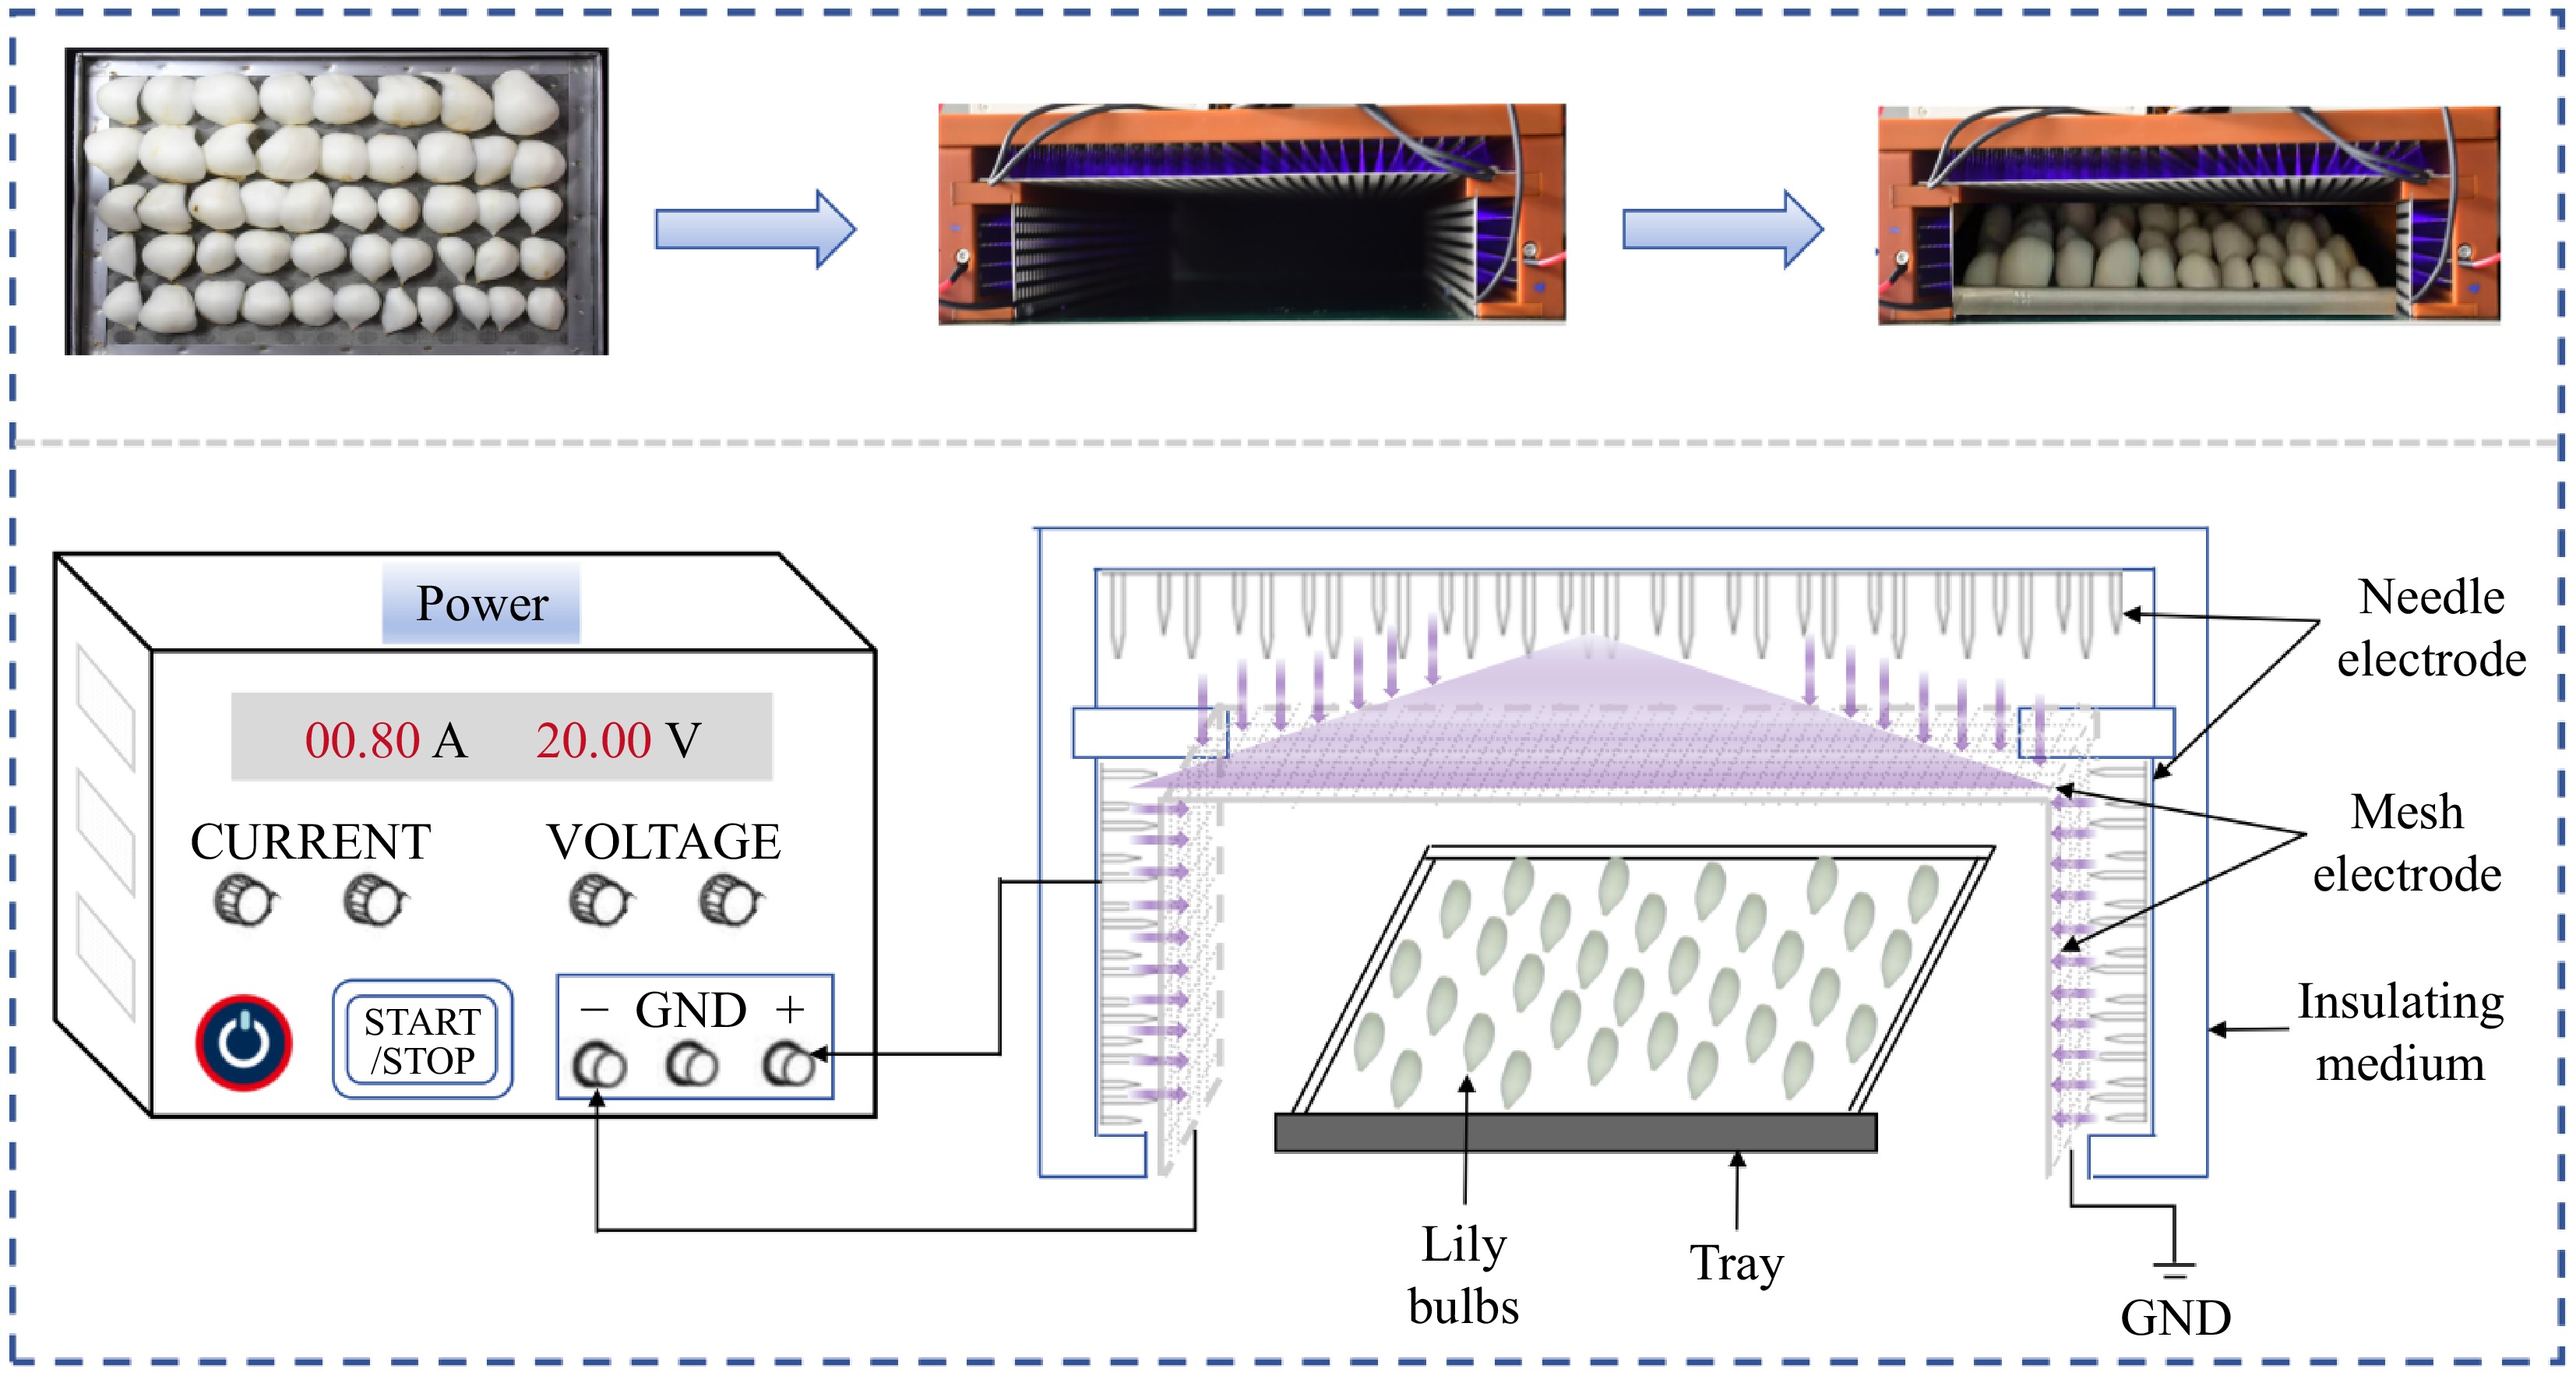
Figure 1.
Schematic diagram of CDP treating lily bulbs.
-
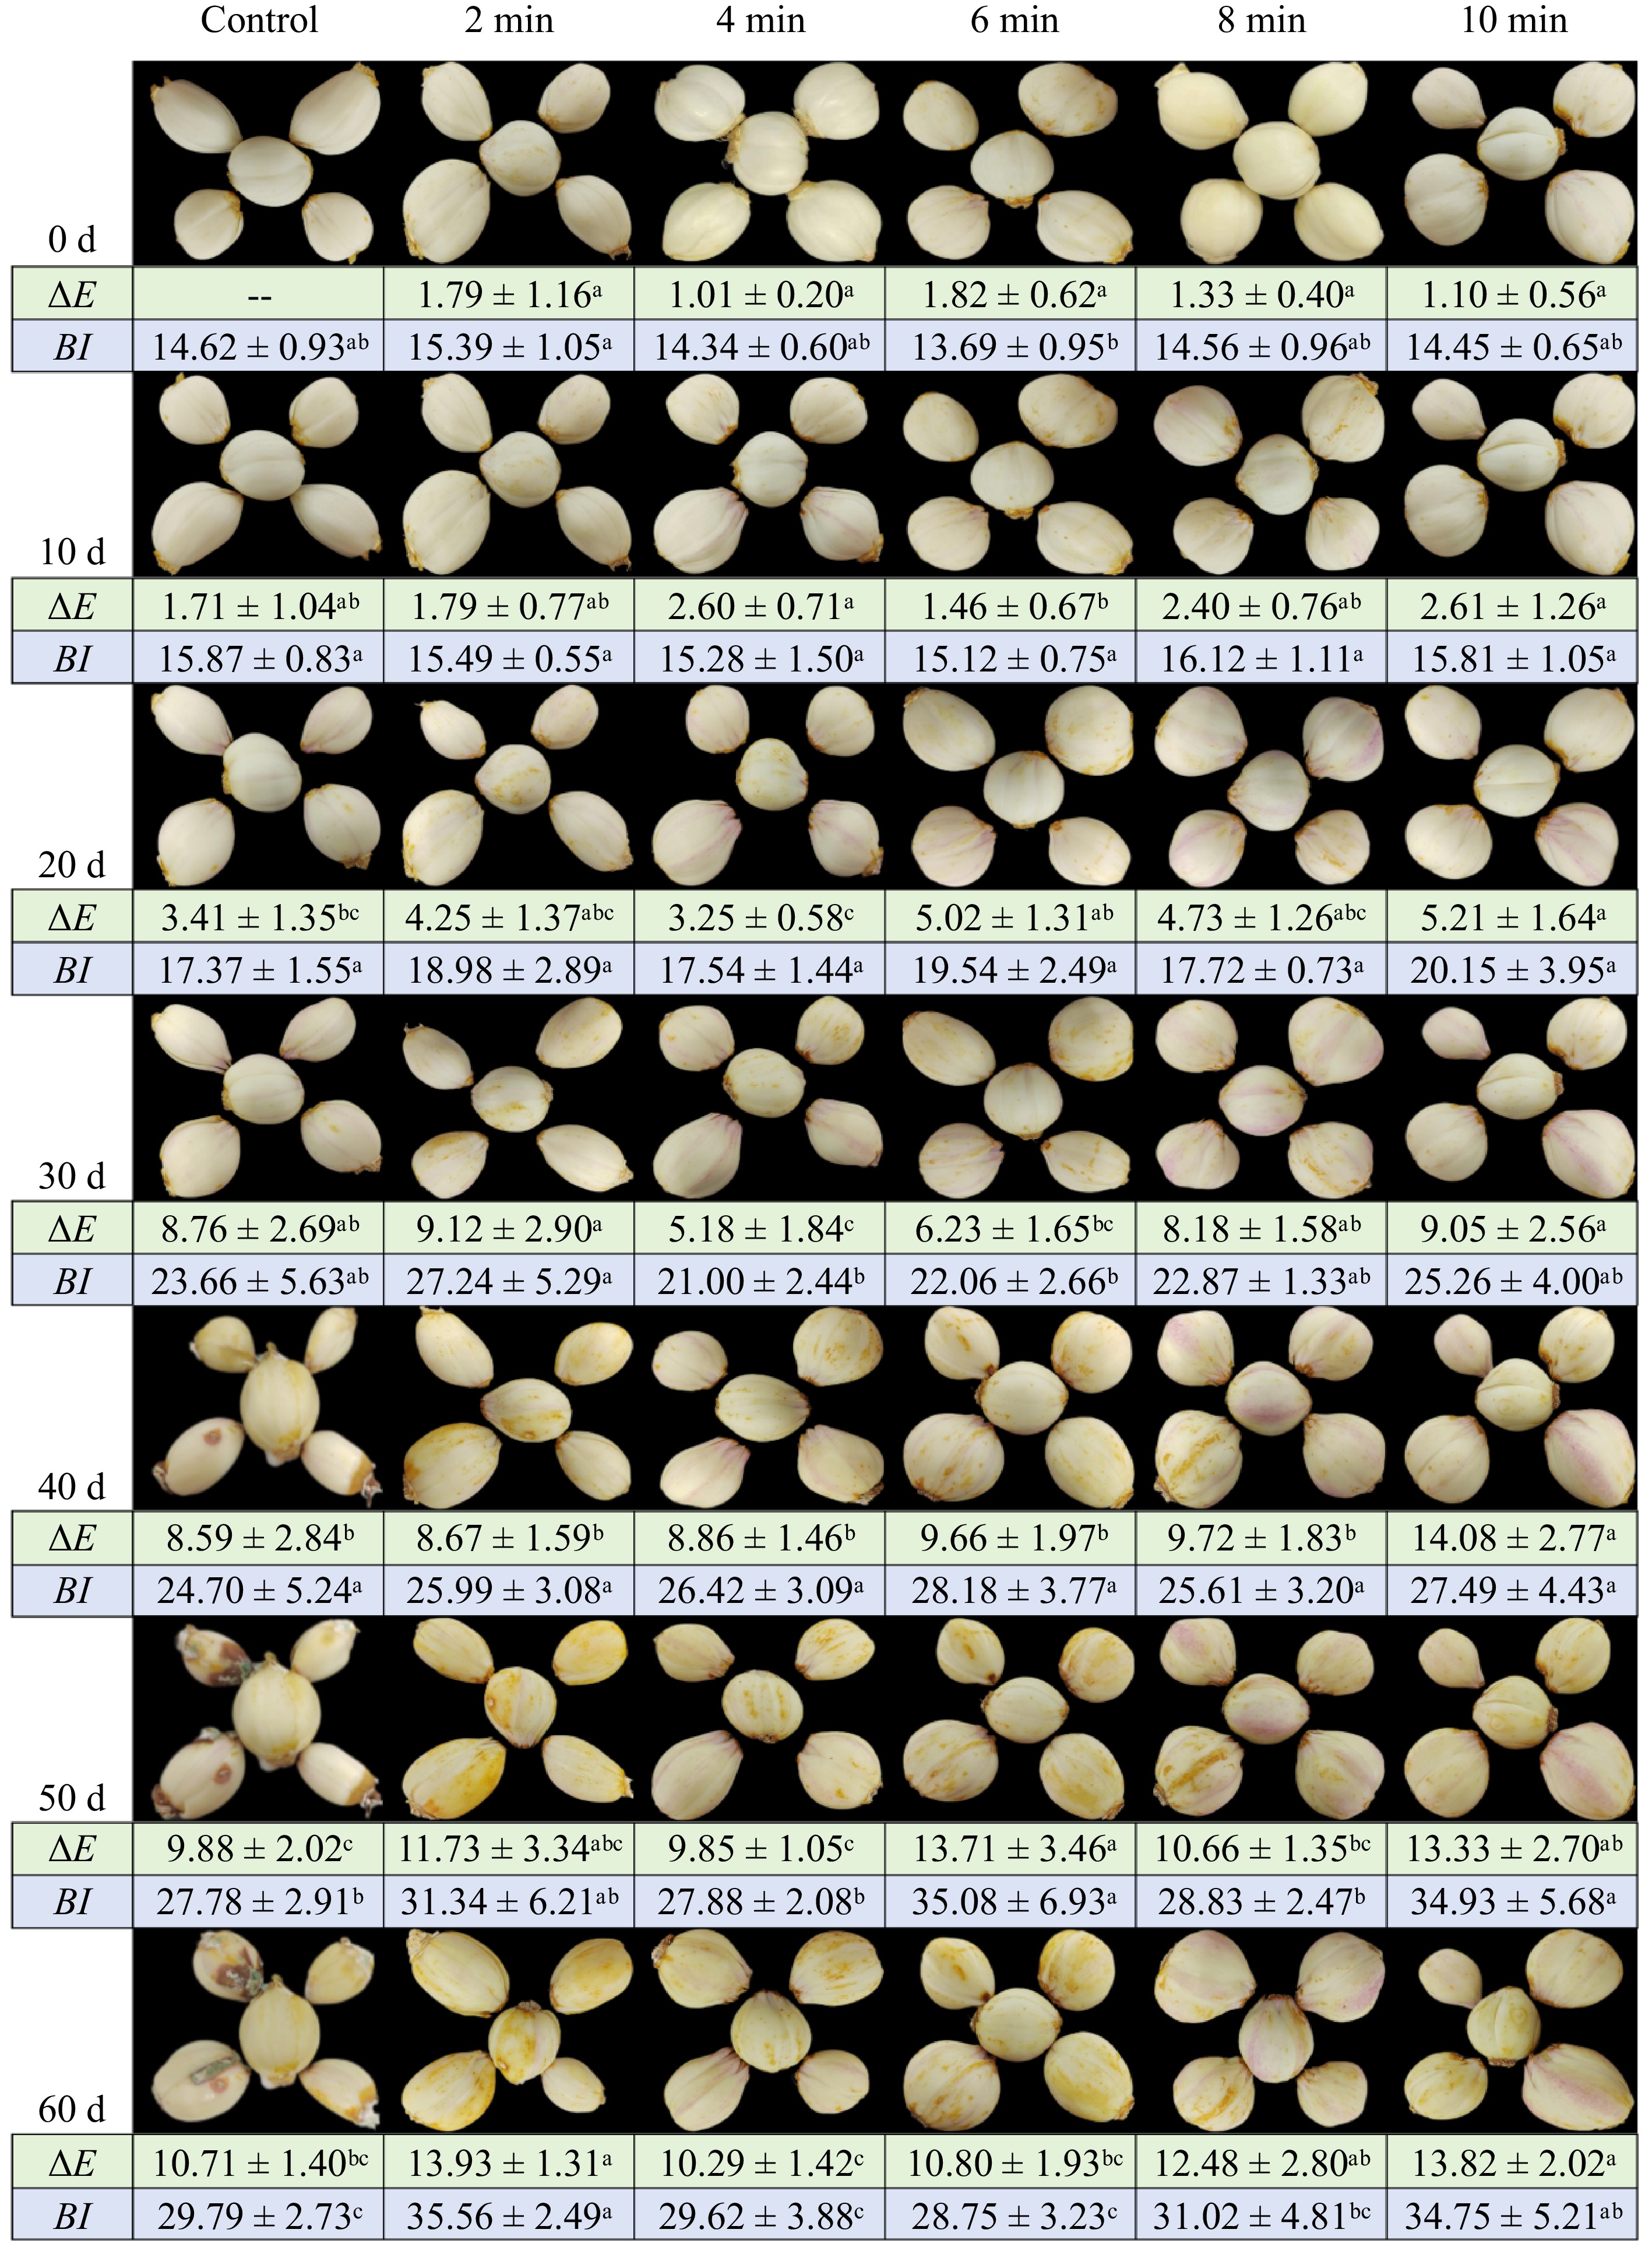
Figure 2.
The appearance and color of lily bulbs during storage under different CDP treatment times. Different lowercase letters indicate significant differences among treatments at equivalent storage durations (p < 0.05).
-
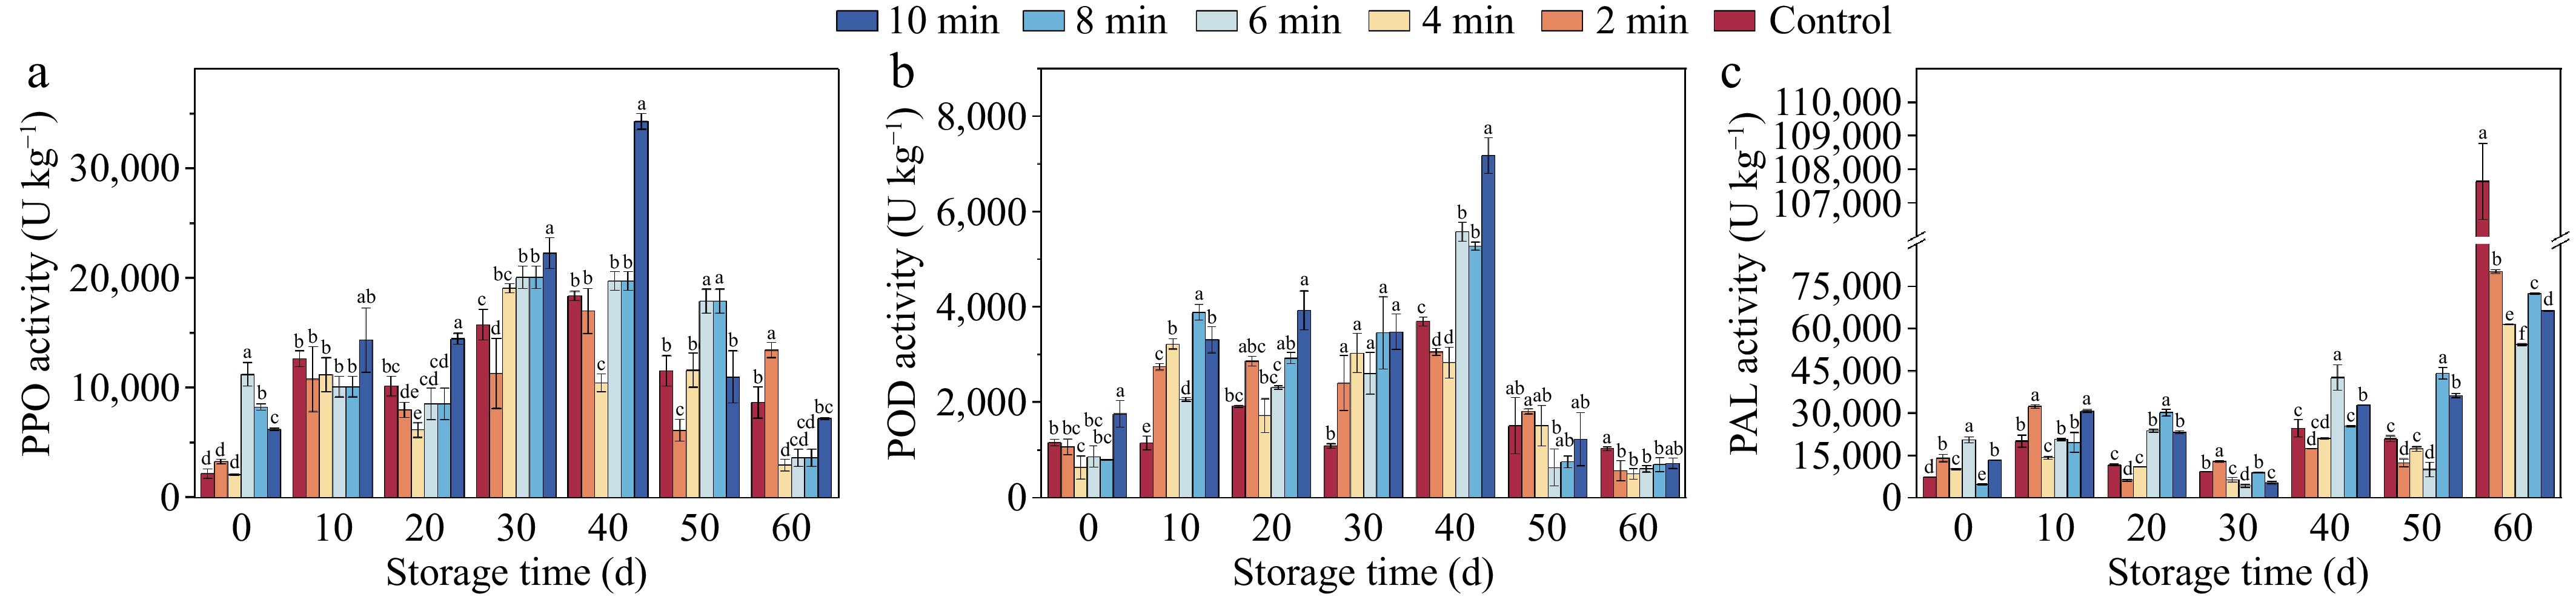
Figure 3.
Browning enzyme activities of lily bulbs during storage under different CDP treatment times. Different lowercase letters indicate significant differences among treatments at equivalent storage durations (p < 0.05). (a) The activity of polyphenol oxidase (PPO). (b) The activity of peroxidase (POD). (c) The activity of phenylalanine ammonia lyase (PAL).
-
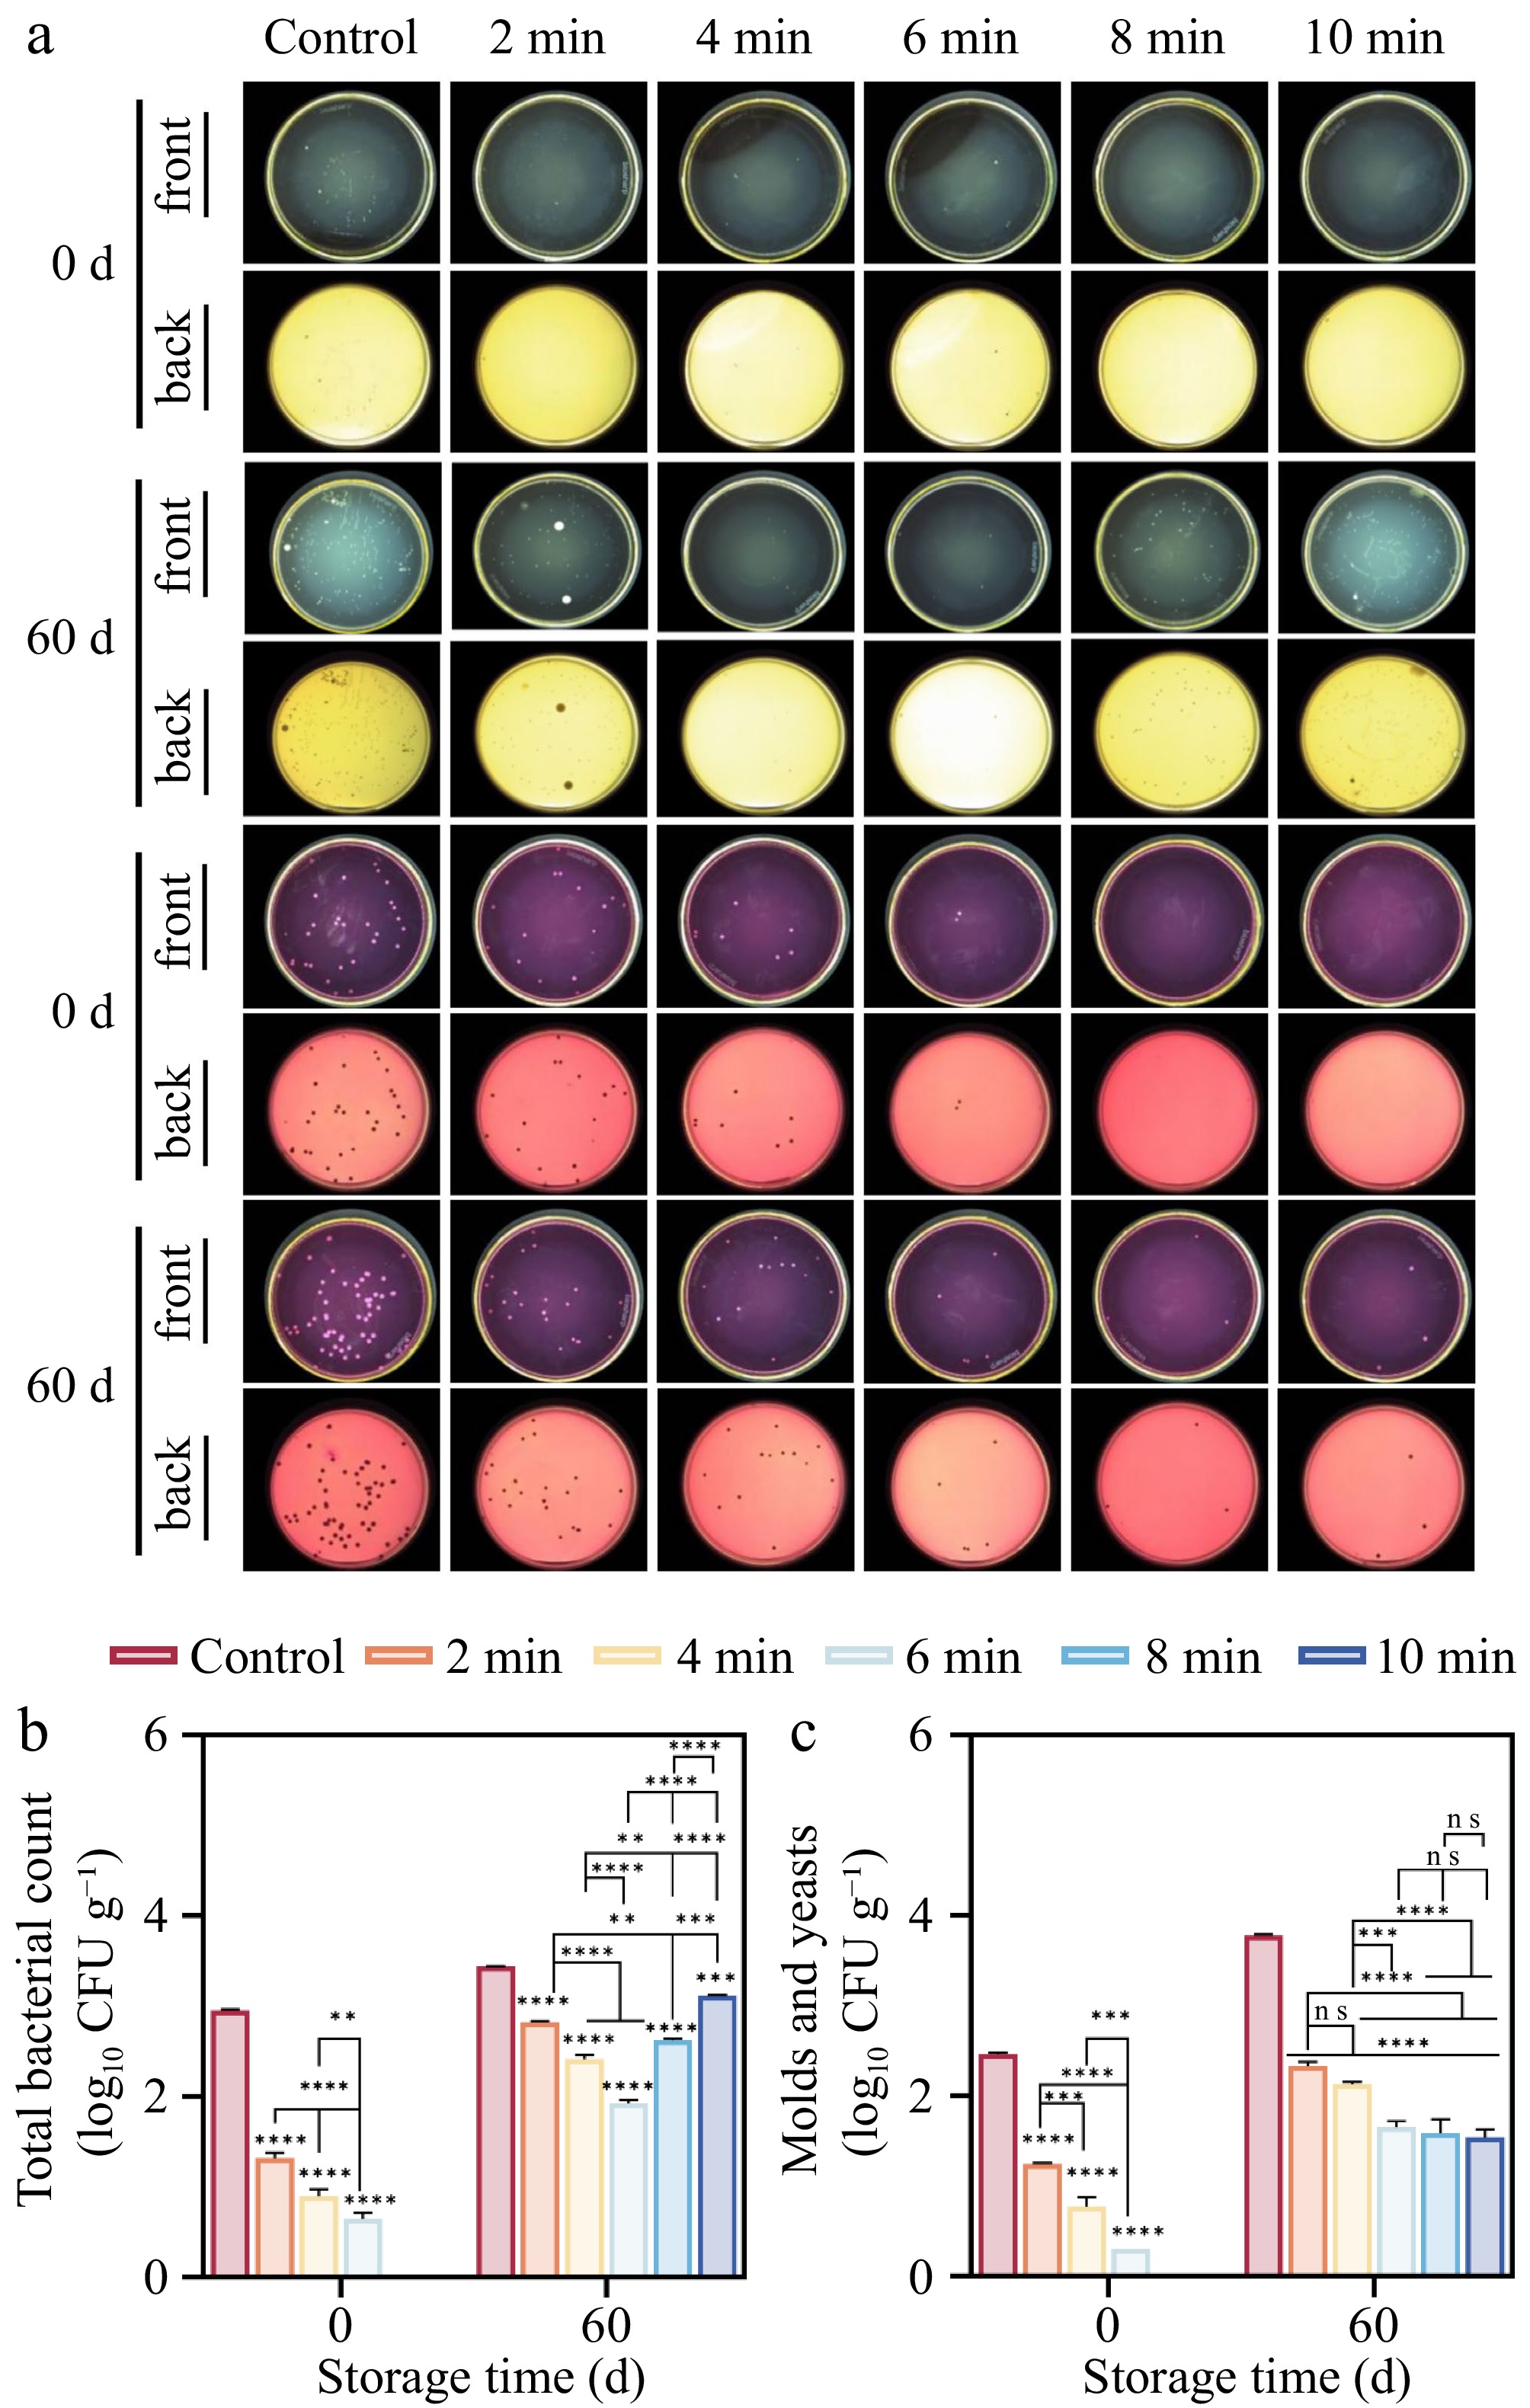
Figure 4.
Effect of CDP treatment on microorganisms of lilies during storage. (a) The growth of total bacteria, molds, and yeasts on the epidermis of lilies during storage. (b) Statistics of the growth of total bacterial colony numbers. (c) Statistics of the growth of molds and yeast colony numbers. (ns represents no significant difference between day 0 and day 60 for each treatment group; * represents the difference between day 0 and day 60 for each treatment group, p < 0.05; ** p < 0.01; *** p < 0.001; **** p < 0.0001, respectively).
-
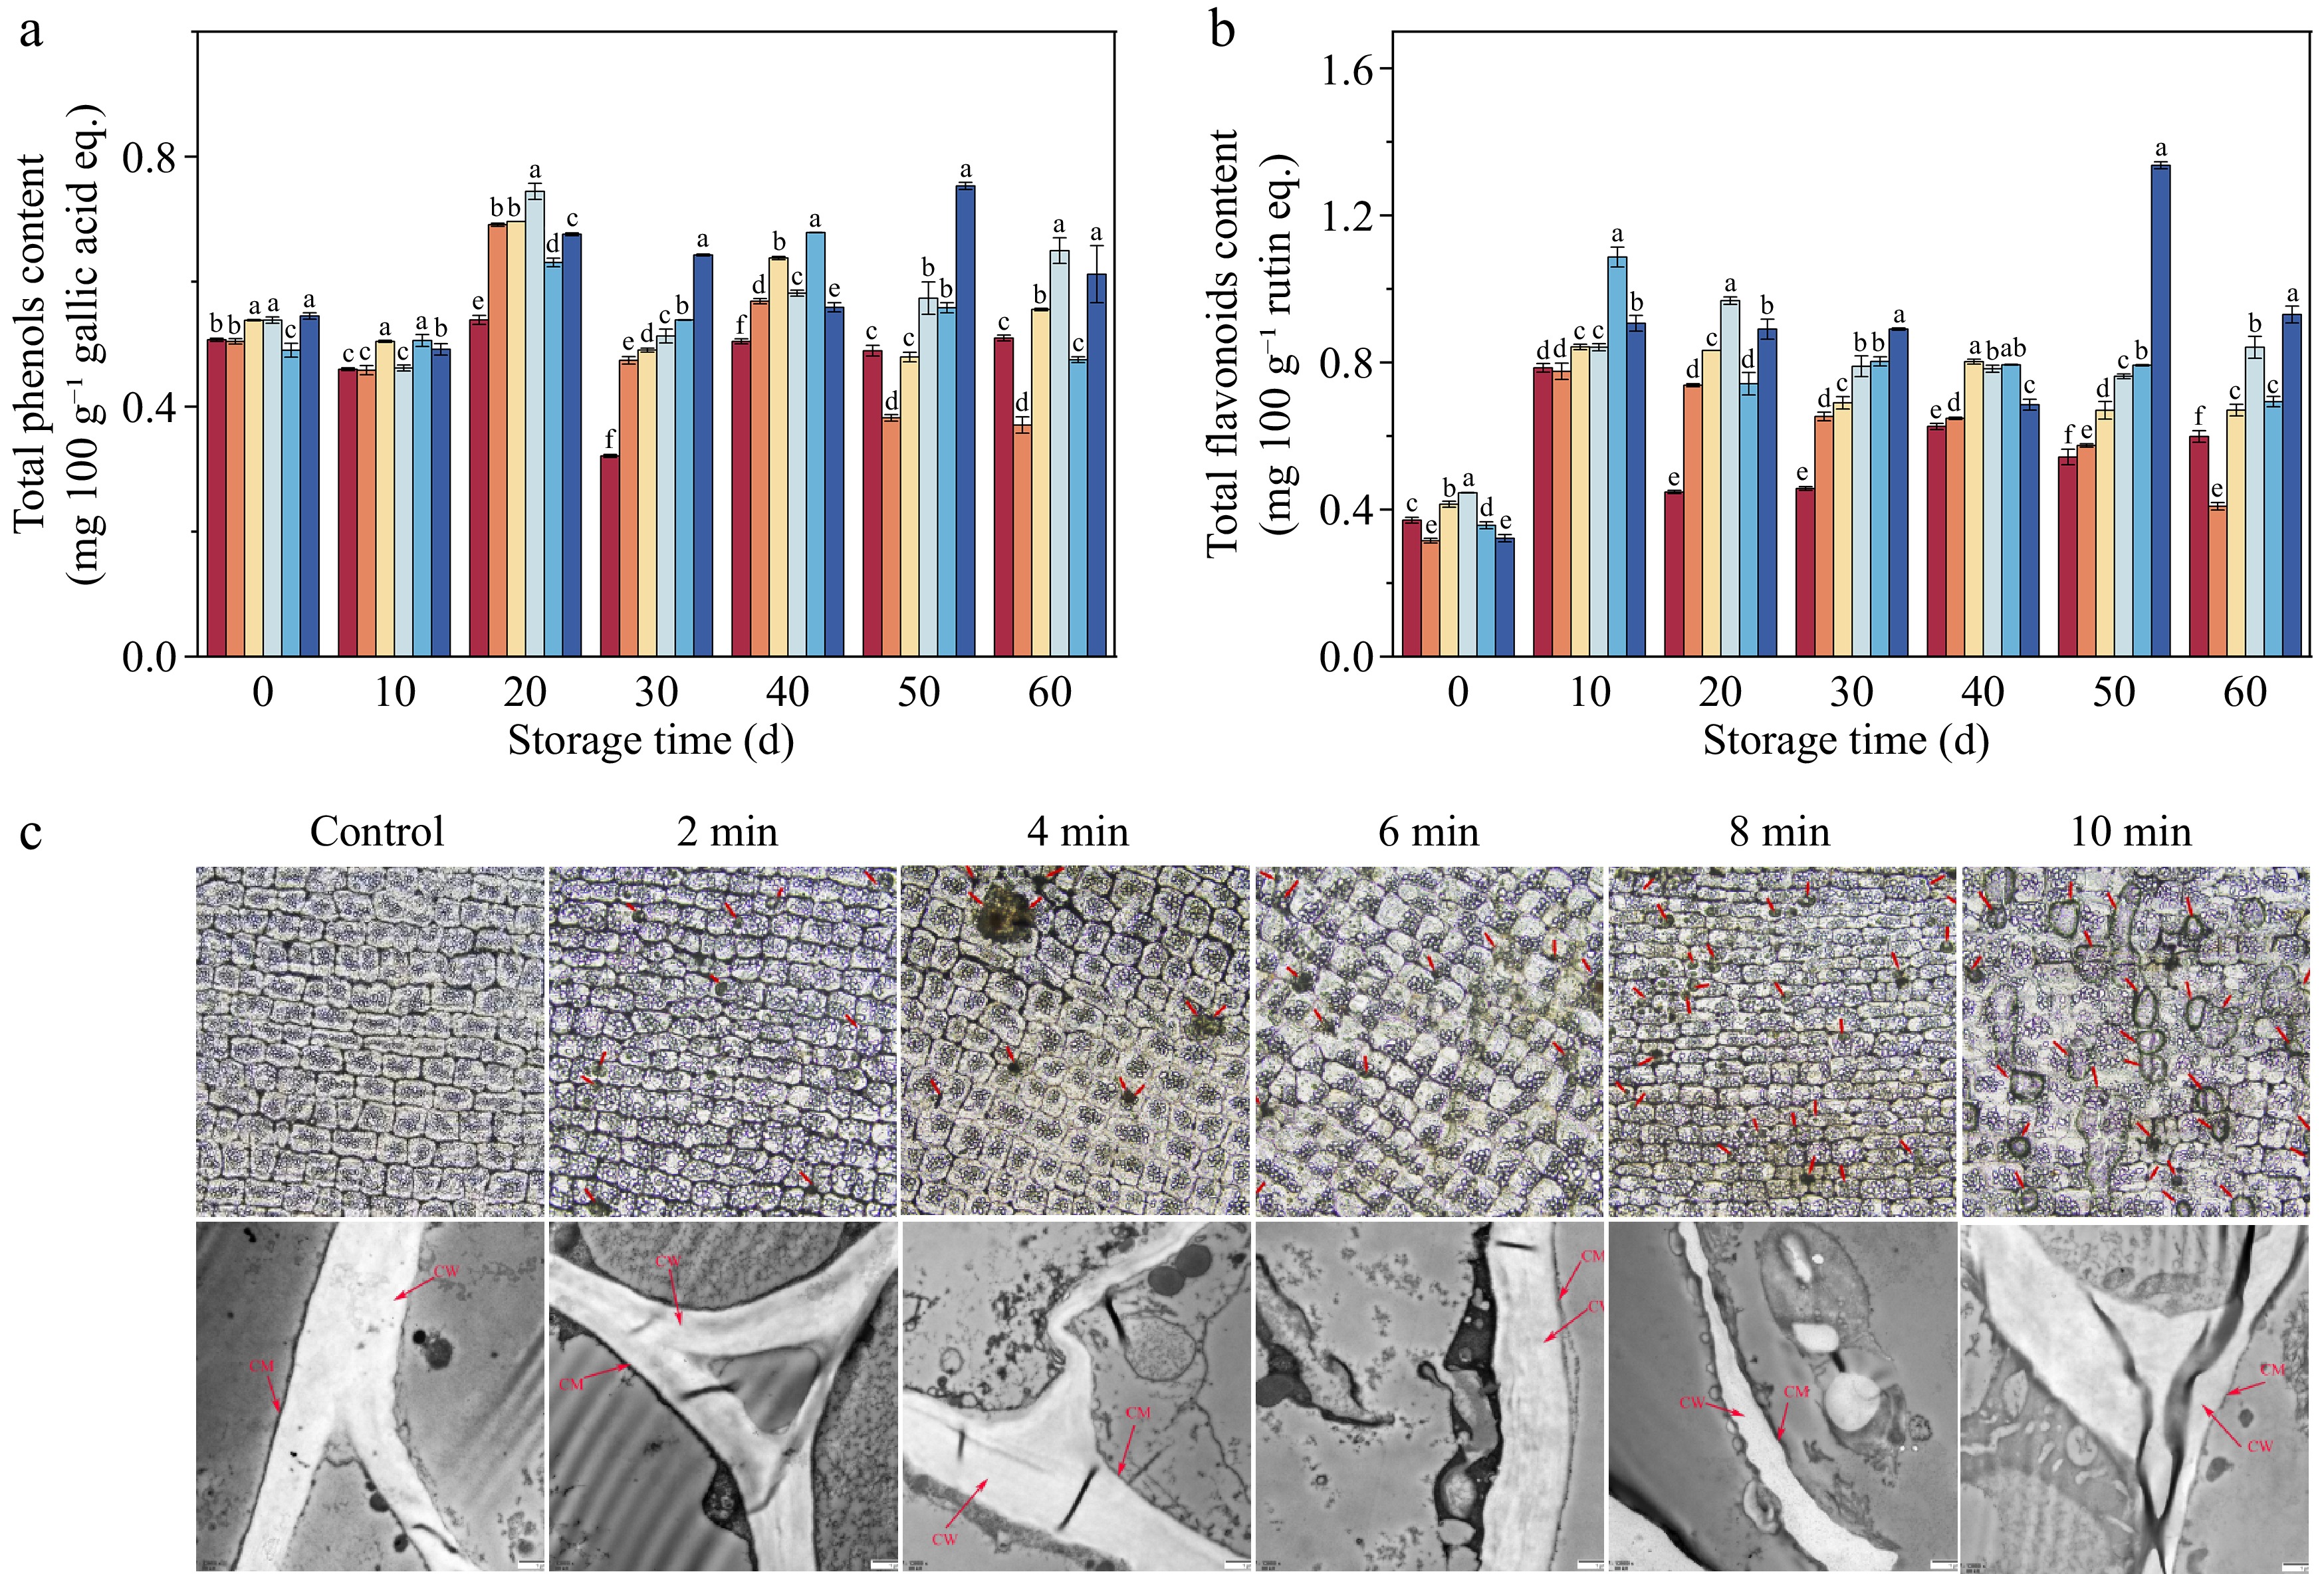
Figure 5.
The total phenolic content, total flavonoid content, and the structure of lily bulbs. (a) Total phenolic content (TPC). (b) Total flavonoid content (TFC). (c) The epidermal cell structure under different pretreatment times. Inverted fluorescence microscope (IFM) and microstructure under different pretreatment times; Transmission electron microscopy (TEM). (c) The red arrows indicate the damage to the cell membrane/wall of the lily bulbs.
-
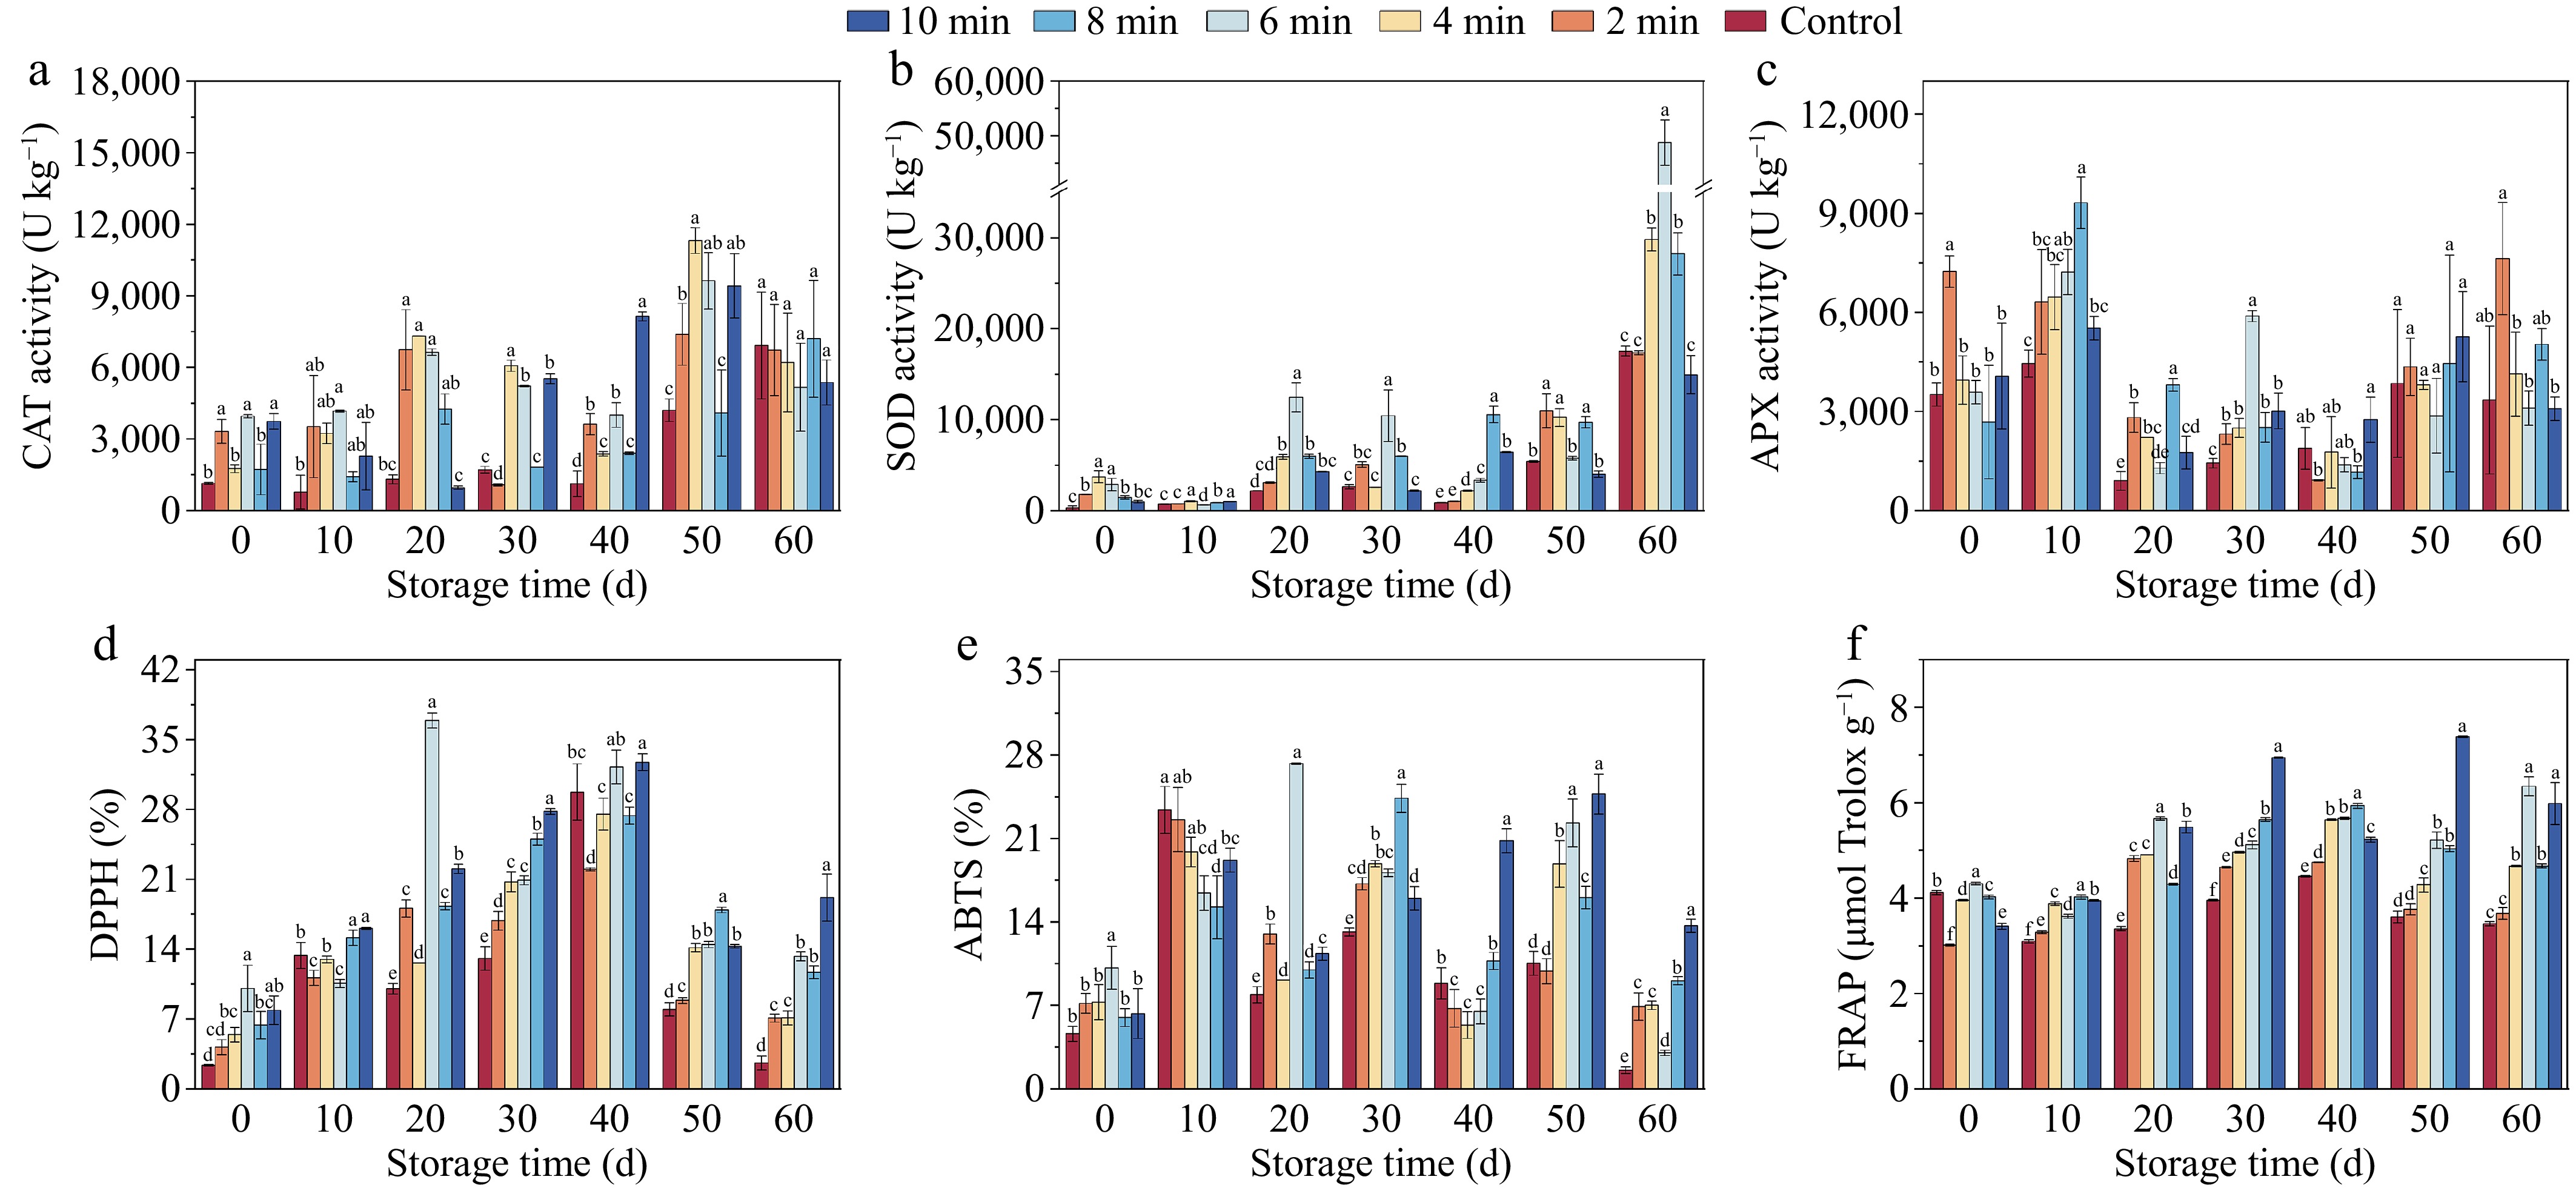
Figure 6.
The enzyme activities and antioxidant properties of lily bulbs during storage under different CDP treatment times. (a) Catalase (CAT) activity. (b) Superoxide dismutase (SOD) activity. (c) Ascorbate peroxidase (APX) activity. (d) DPPH radical scavenging activity. (e) ABTS radical scavenging activity. (f) Ferric ion-reducing antioxidant power (FRAP). Different lowercase letters indicate significant differences among treatments at equivalent storage durations (p < 0.05).
-
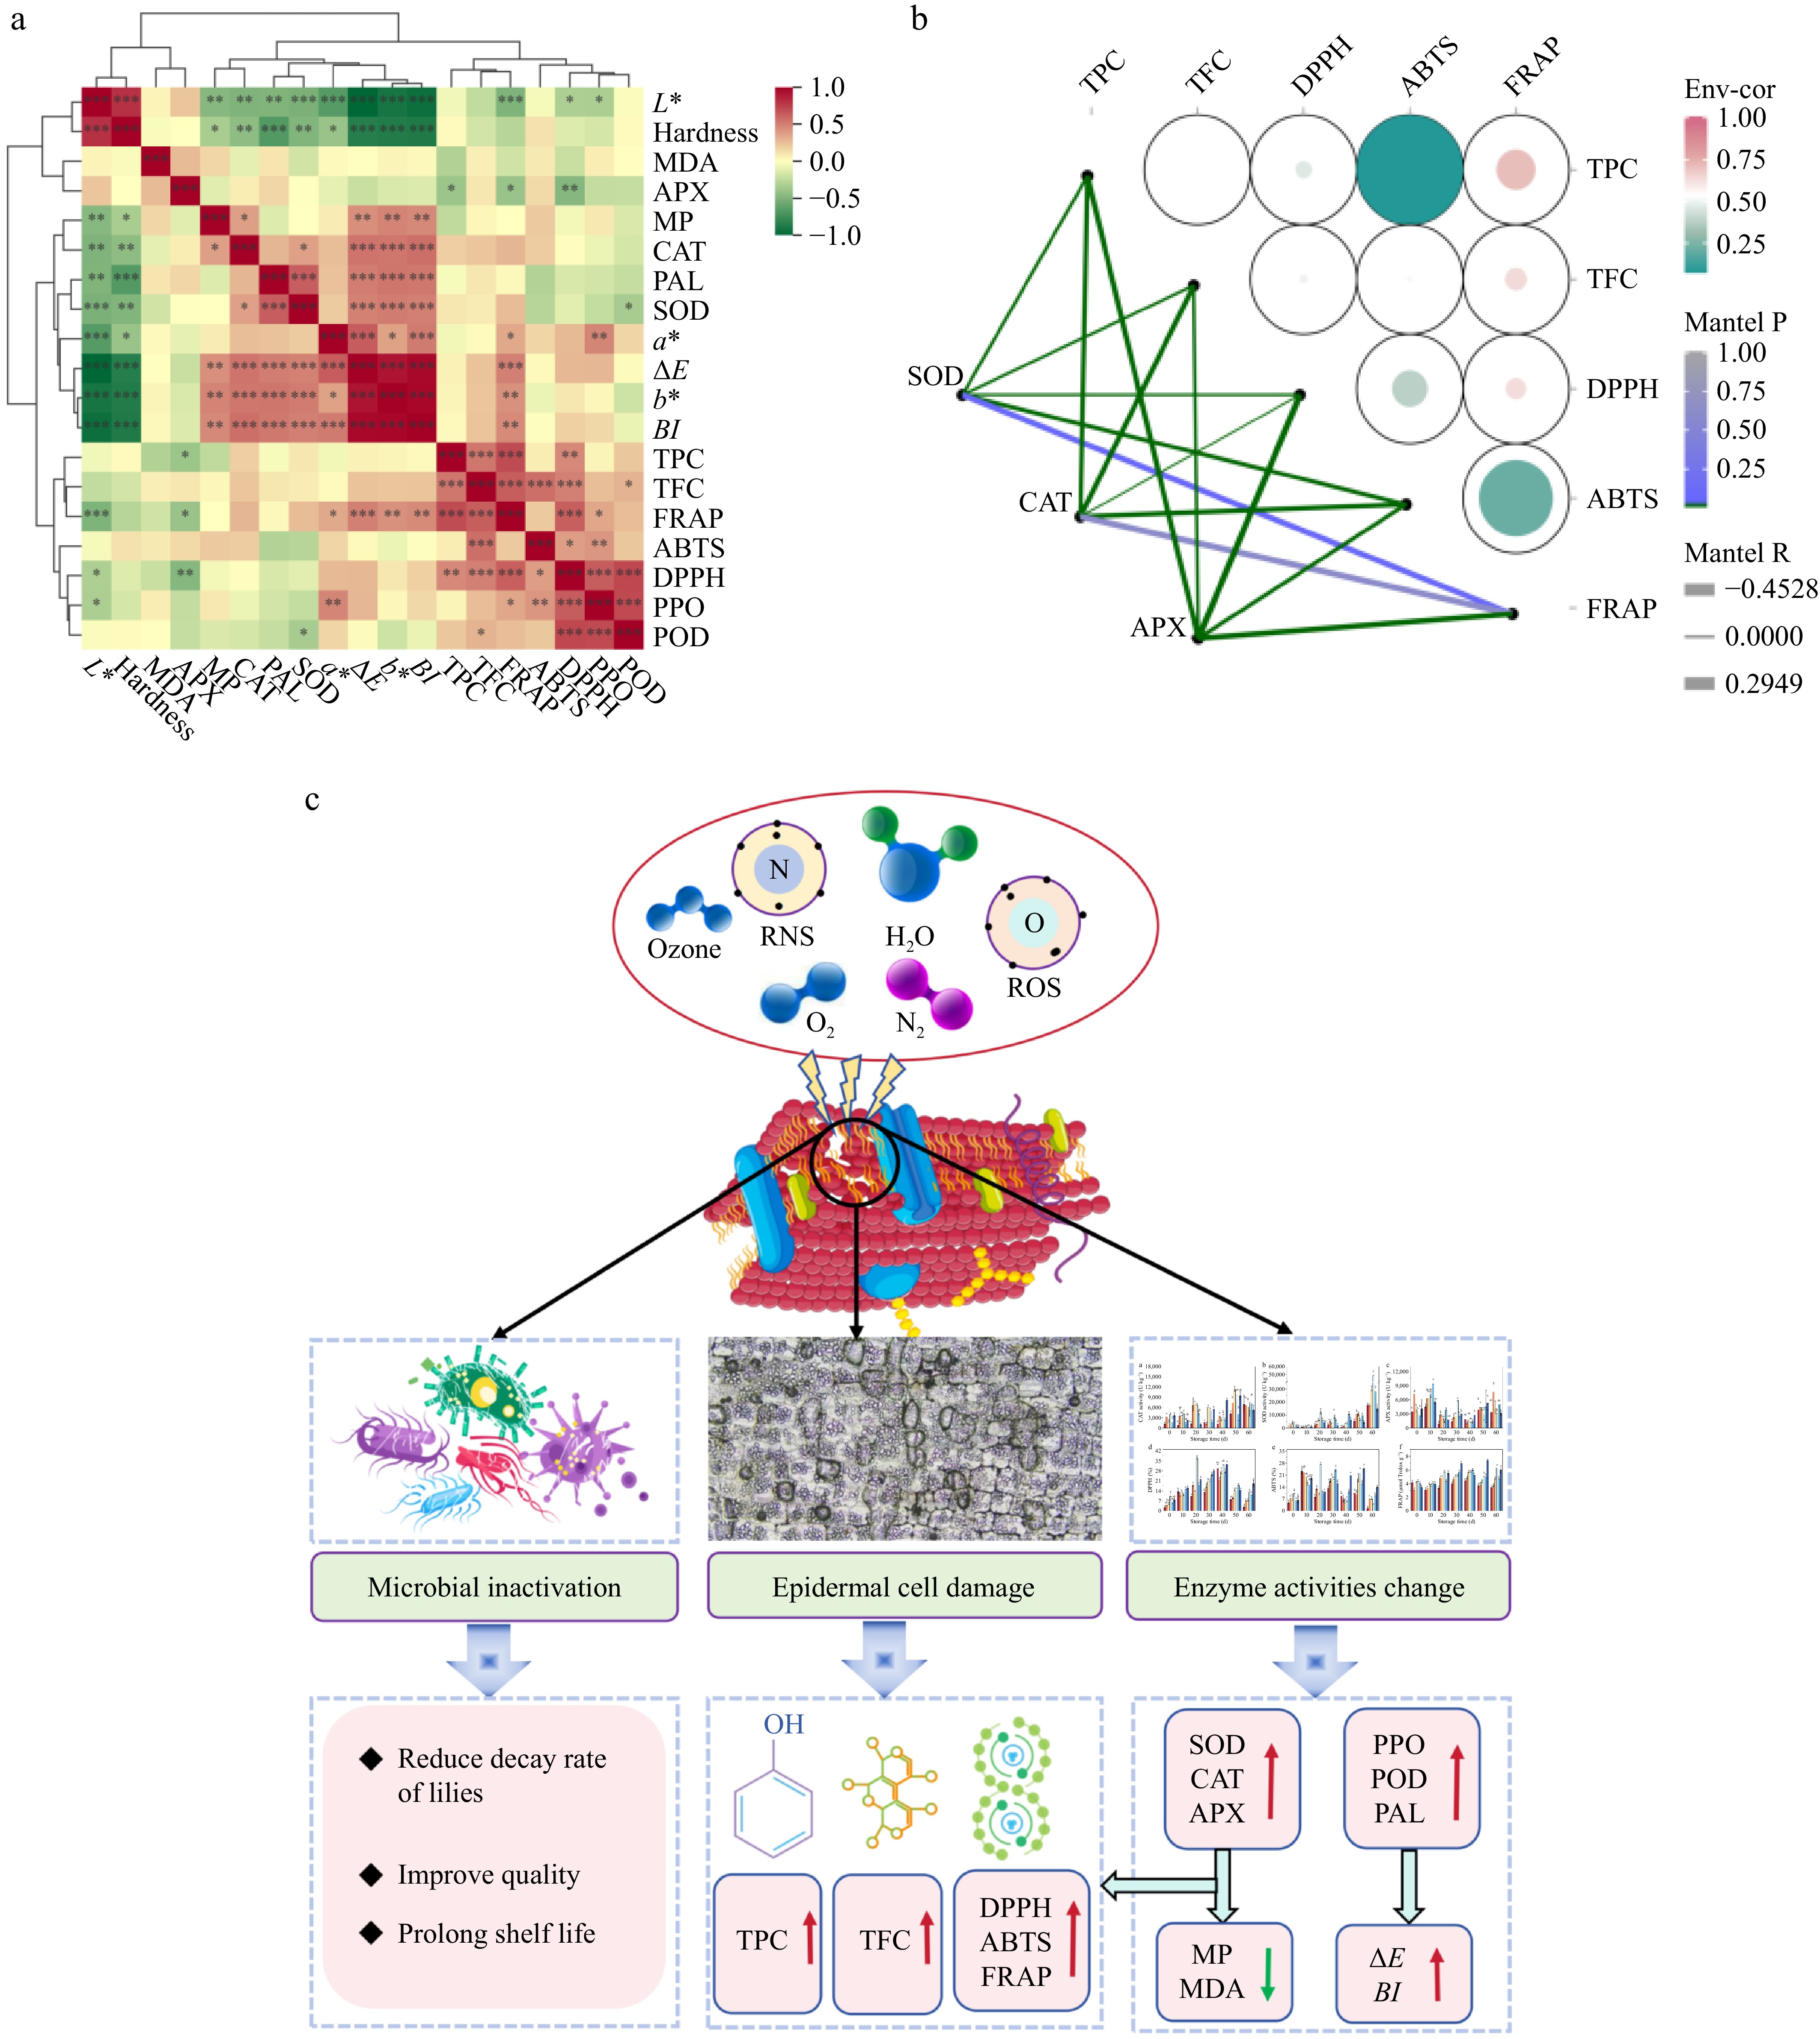
Figure 7.
The correlation between the indices of lily during storage and the potential mechanism of lily bulbs. (a) The correlation between the indices of lily during storage. (b) The correlation between CAT, SOD, APX, and antioxidant activity of lily bulbs during storage. (c) The mechanism of the variations in quality attributes of lilies during storage induced by CDP pretreatment (the red arrow symbolizes ascent or promotion, while the green arrow signifies descent or inhibition).
-
Time Control 2 min 4 min 6 min 8 min 10 min Hardness (N) 0 d 3.89 ± 0.44 3.83 ± 0.19 3.90 ± 0.41 4.02 ± 0.47 3.65 ± 0.21 3.73 ± 0.25 10 d 3.66 ± 0.11 3.65 ± 0.22 3.68 ± 0.31 3.62 ± 0.23 3.60 ± 0.22 3.53 ± 0.25 20 d 3.64 ± 0.25a 3.61 ± 0.28a 3.67 ± 0.22a 3.40 ± 0.24b 3.58 ± 0.39a 3.27 ± 0.15b 30 d 3.59 ± 0.46ab 3.48 ± 0.26ab 3.66 ± 0.13a 3.28 ± 0.40ab 3.43 ± 0.29ab 3.17 ± 0.41b 40 d 2.69 ± 0.19c 3.11 ± 0.26b 3.52 ± 0.20a 2.95 ± 0.28b 3.16 ± 0.15b 3.02 ± 0.09b 50 d 2.59 ± 0.06d 2.75 ± 0.08bc 3.36 ± 0.24a 2.93 ± 0.20bc 3.12 ± 0.17b 2.79 ± 0.21cd 60 d 2.44 ± 0.19c 1.95 ± 0.26d 3.18 ± 0.35a 2.90 ± 0.12ab 2.92 ± 0.27ab 2.71 ± 0.36bc Relative conductivity (%) 0 d 5.25 ± 0.02a 4.07 ± 0.15b 5.25 ± 0.10a 3.36 ± 0.22c 3.93 ± 0.02b 3.29 ± 0.15c 10 d 4.87 ± 0.12e 5.24 ± 0.09d 5.82 ± 0.09c 8.72 ± 0.45a 8.08 ± 0.05b 4.68 ± 0.04e 20 d 12.45 ± 0.24a 7.24 ± 0.19d 5.85 ± 0.02f 6.78 ± 0.15e 7.71 ± 0.08c 8.42 ± 0.07b 30 d 14.43 ± 0.06a 11.85 ± 0.27b 9.91 ± 0.10c 9.51 ± 0.09d 9.16 ± 0.19e 7.58 ± 0.15f 40 d 7.80 ± 0.02b 4.36 ± 0.17e 5.18 ± 0.12d 10.25 ± 0.12a 5.62 ± 0.12c 5.30 ± 0.03d 50 d 15.29 ± 0.20d 21.75 ± 0.28b 17.52 ± 0.07c 24.83 ± 0.05a 13.02 ± 0.11e 9.64 ± 0.17f 60 d 10.53 ± 0.26a 6.01 ± 0.13c 4.35 ± 0.12d 6.21 ± 0.01c 7.17 ± 0.03b 5.99 ± 0.22c MDA contents (μmol kg−1) 0 d 0.84 ± 0.03a 0.52 ± 0.02c 0.64 ± 0.01b 0.27 ± 0.01d 0.10 ± 0.01f 0.17 ± 0.02e 10 d 0.68 ± 0.06b 0.64 ± 0.02b 0.43 ± 0.02c 0.43 ± 0.03c 0.82 ± 0.04a 0.44 ± 0.05c 20 d 0.14 ± 0.03ab 0.01 ± 0.00c 0.21 ± 0.05a 0.11 ± 0.08ab 0.05 ± 0.02bc 0.05 ± 0.01bc 30 d 0.51 ± 0.02a 0.45 ± 0.02ab 0.44 ± 0.06ab 0.38 ± 0.01bc 0.51 ± 8E-4a 0.31 ± 0.05c 40 d 0.39 ± 0.07b 0.25 ± 0.03c 0.64 ± 0.01a 0.40 ± 0.02b 0.39 ± 0.05b 0.55 ± 0.01a 50 d 0.54 ± 0.01bc 0.52 ± 0.02bc 0.46 ± 0.01cd 0.40 ± 0.05d 0.58 ± 0.02b 0.66 ± 0.05a 60 d 1.10 ± 0.07a 0.11 ± 0.01c 0.13 ± 0.00c 0.30 ± 0.01b 0.26 ± 0.08b 0.22 ± 0.04bc Different lowercase letters in the same row indicate significant differences among treatments at equivalent storage durations (p < 0.05). Table 1.
The hardness, relative conductivity, and MDA content of lilies during storage under different CDP times.
Figures
(7)
Tables
(1)