-
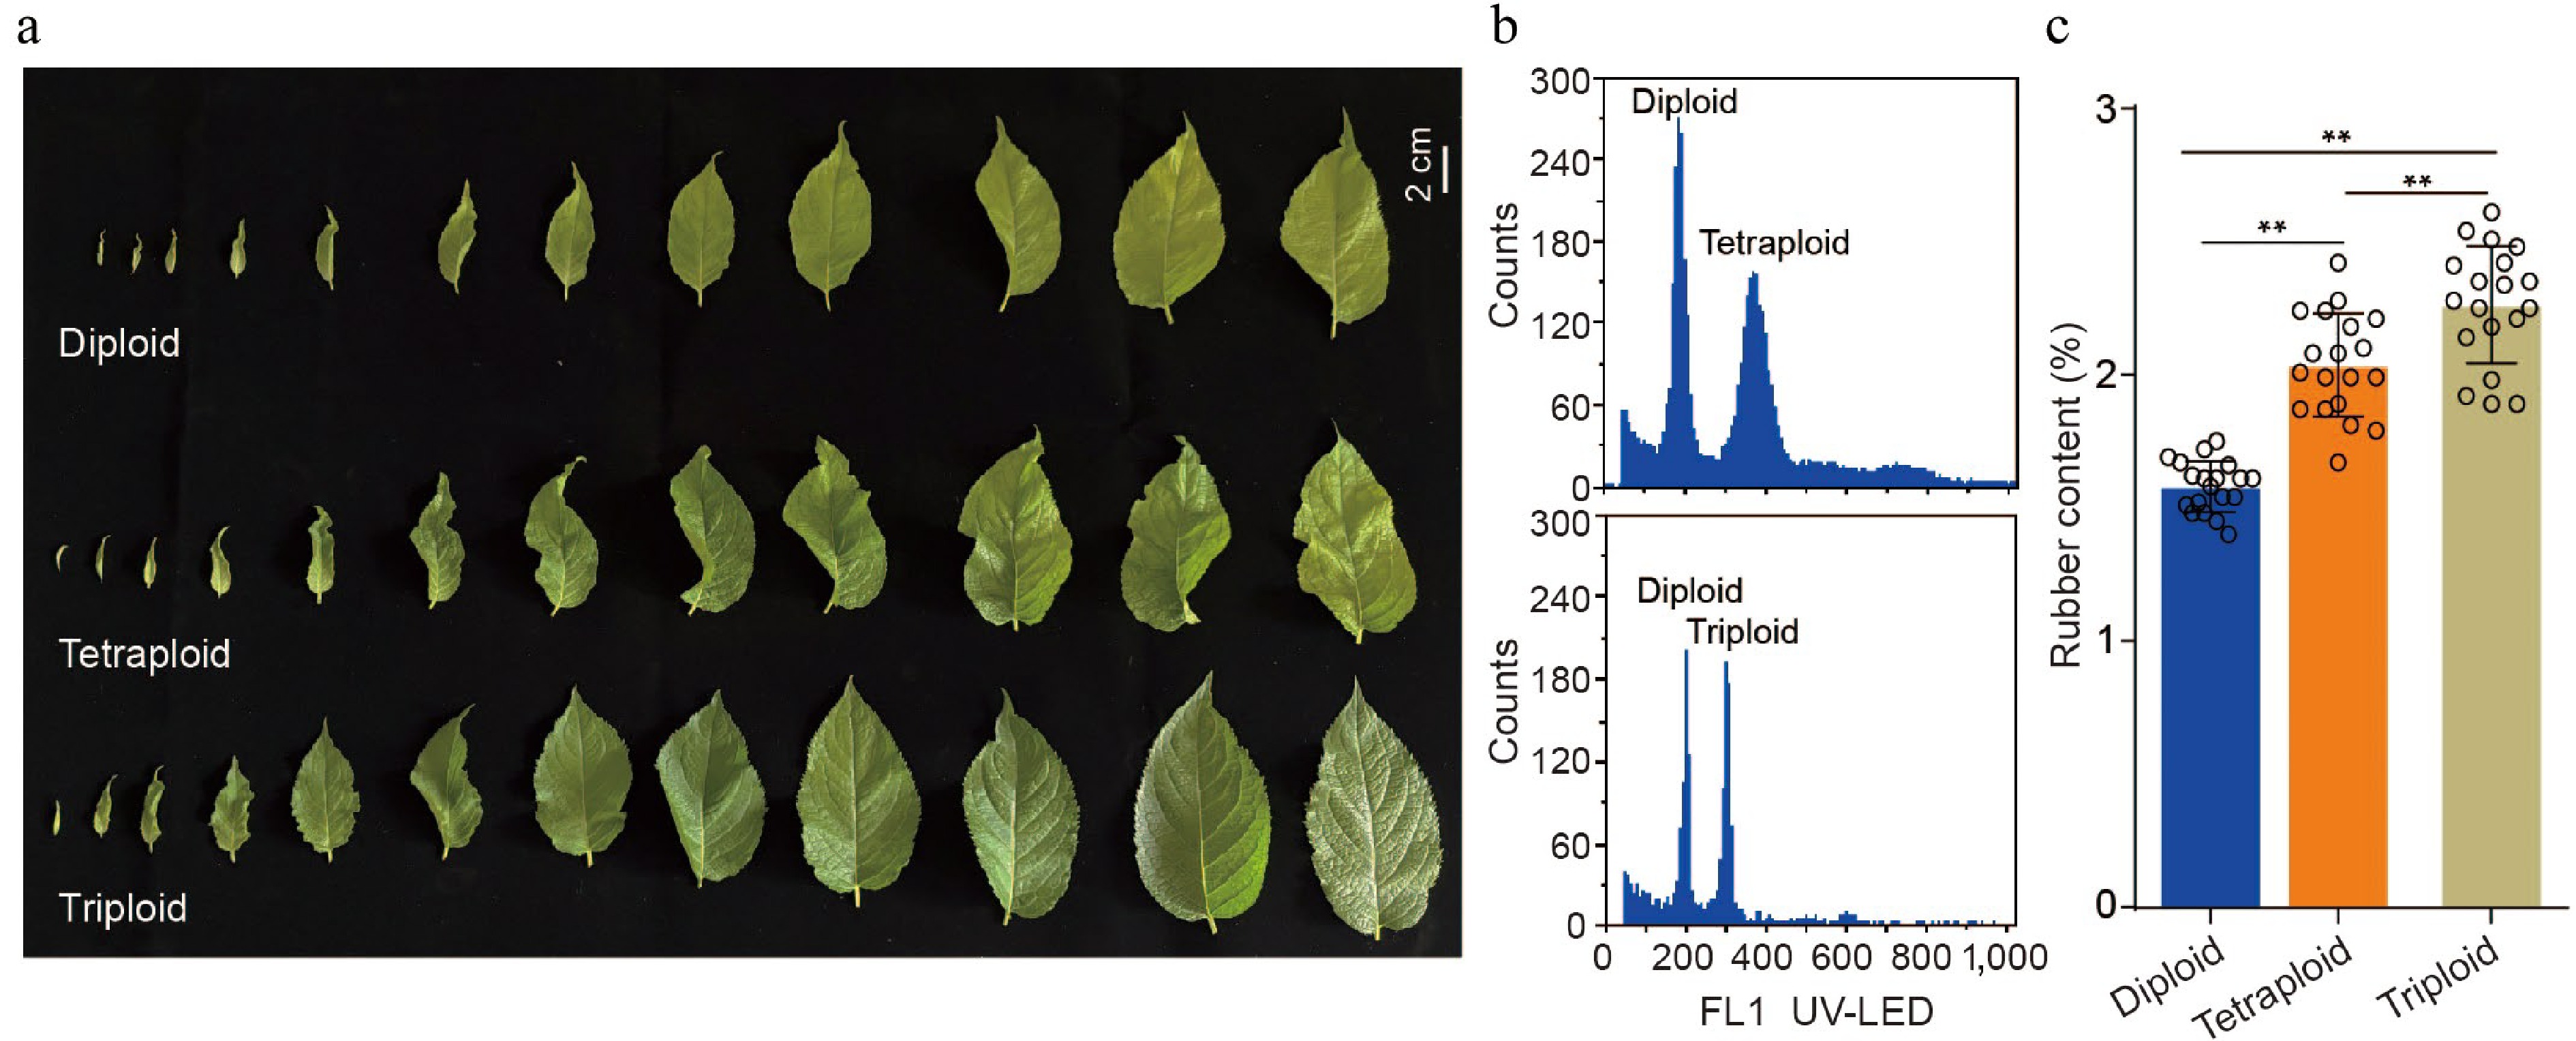
Figure 1.
Analysis of TPI content in leaves of E. ulmoides with different ploidy. (a) Phenotypes of diploid, tetraploid, and triploid leaves collected from the same position at stage S3. (b) Ploidy identification by flow cytometry. The top histogram shows a mixture of diploid and tetraploid nuclei, and the bottom shows a mixture of diploid and triploid nuclei. (c) Statistical analysis of TPI concentration in leaves with different ploidy at stage S3. All p-values were obtained by two-tailed t-tests. * p < 0.05 and ** p < 0.01 represented the highly significant and significant difference, respectively.
-
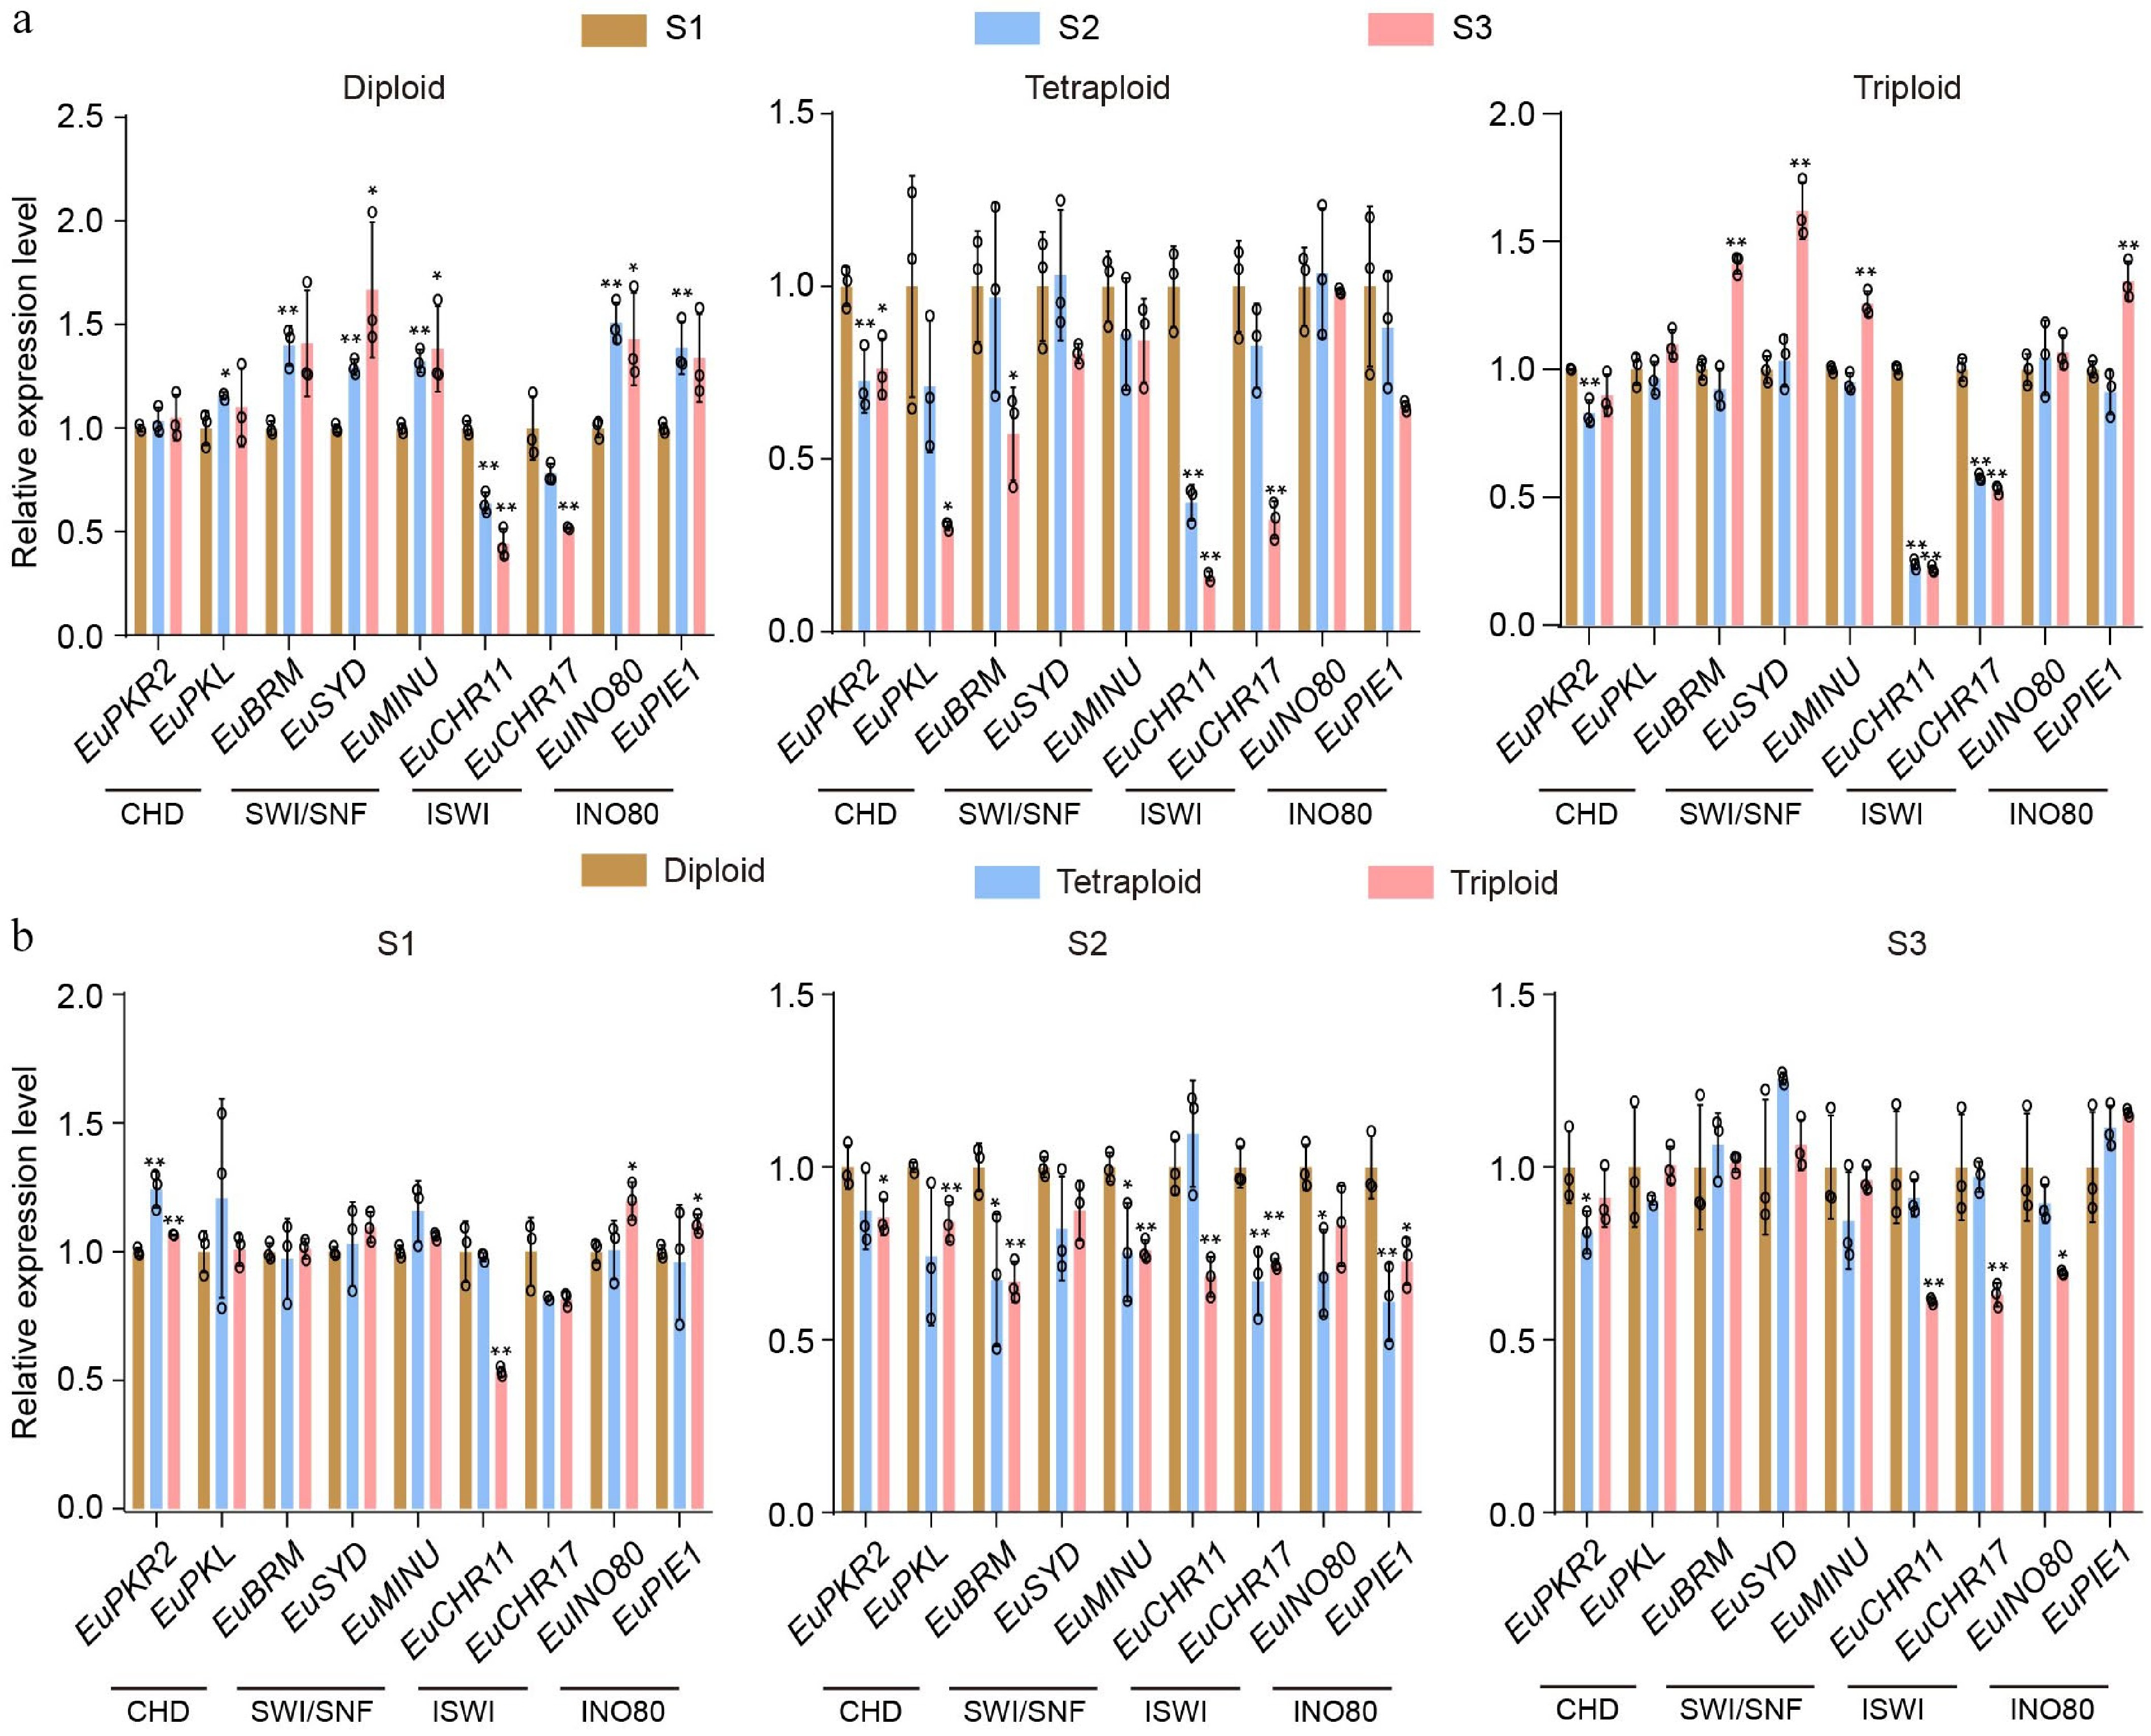
Figure 2.
Transcript profiles of chromatin-remodeling enzymes in E. ulmoides. (a) The relative expression dynamics of chromatin-remodeling enzymes across three leaf developmental stages (S1: mid-to-late April; S2: mid-to-late May; S3: mid-to-late June) in diploid, tetraploid, and triploid plants. (b) The relative expression levels of chromatin-remodeling enzymes among diploid, tetraploid, and triploid at each individual developmental stage (S1 to S3). Values are means ± SD of three biological replicates. All p-values were obtained by two-tailed t-tests. * p < 0.05, and ** p < 0.01 represented the highly significant and significant difference, respectively.
-
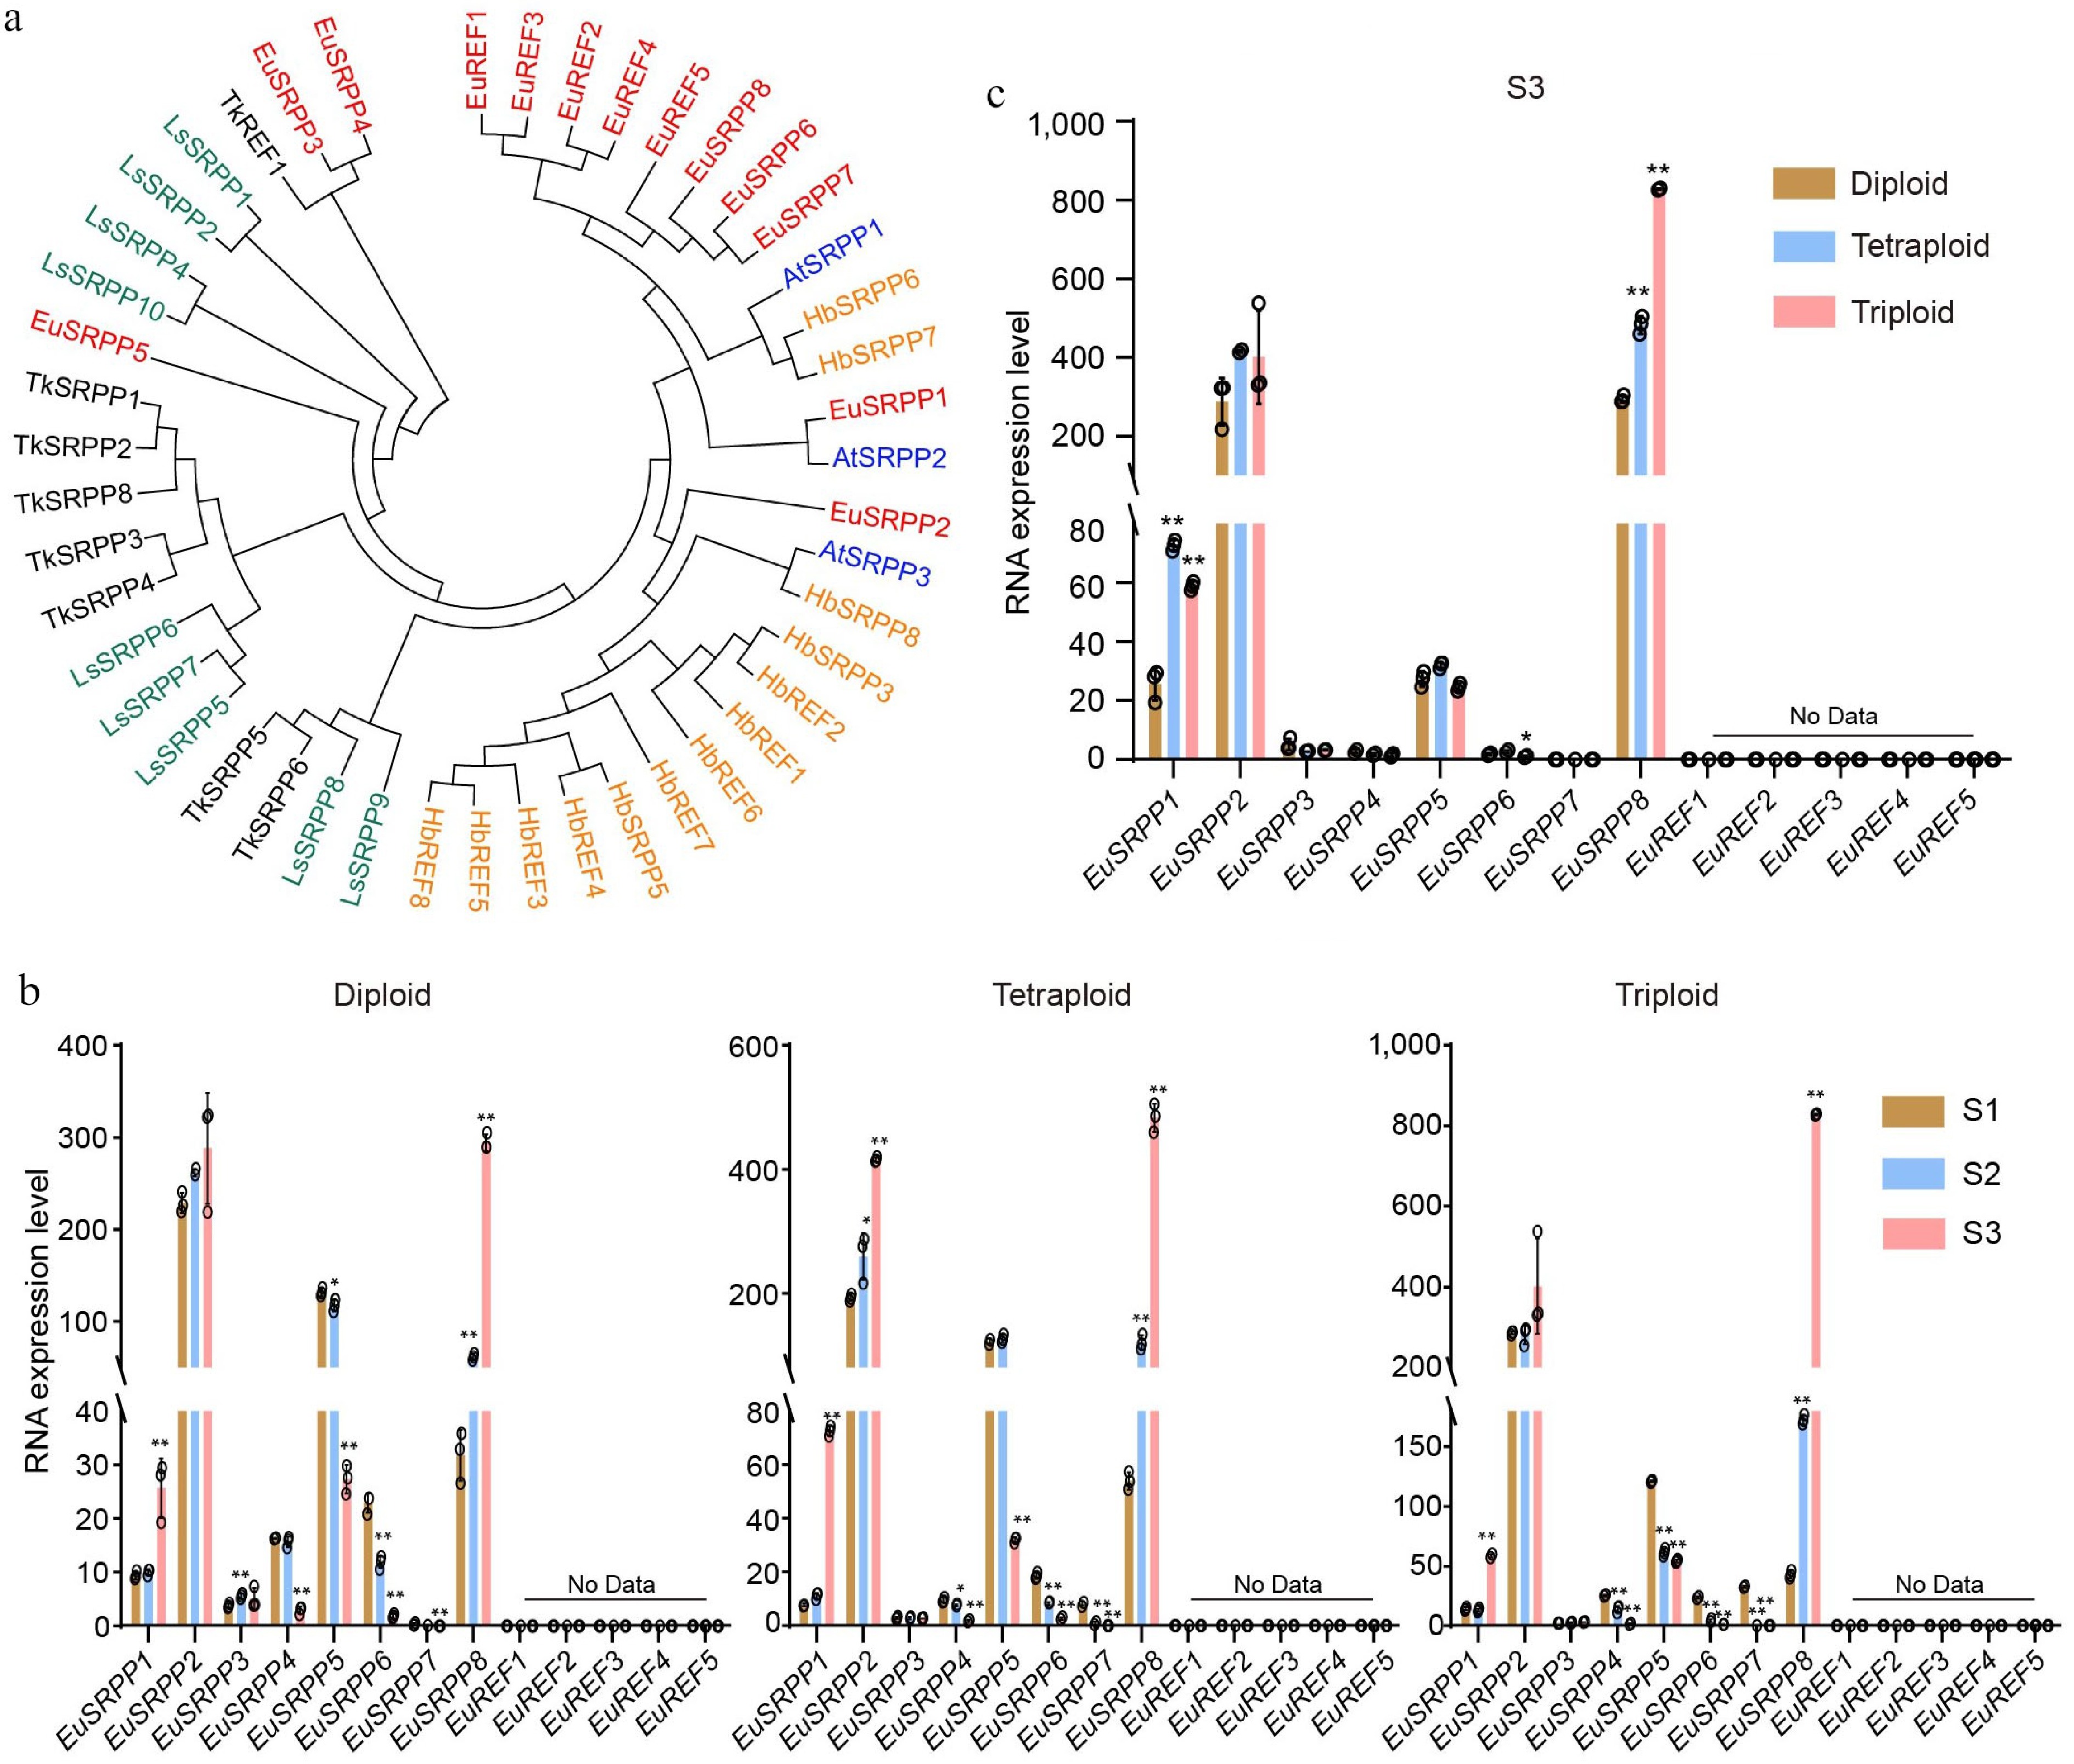
Figure 3.
Transcript profiles of the EuSRPP/REF family genes in E. ulmoides. (a) Phylogenetic relationship of SRPP/REF genes in rubber synthesis plants (Hb: Hevea brasiliensis; Ls: Lactuca serriola; Tk: Taraxacum kok-saghyz; At: Arabidopsis thaliana). (b) The relative expression dynamics of EuSRPP/REF genes across leaf developmental stages (S1: mid-to-late April; S2: mid-to-late May; S3: mid-to-late June) in diploid, tetraploid, and triploid plants. (c) The relative expression levels of EuSRPP/REF genes among diploid, tetraploid, and triploid at stage S3. Values are means ± SD of three biological replicates. All p-values were obtained by two-tailed t-tests. * p < 0.05 and ** p < 0.01 represented the highly significant and significant difference, respectively.
-
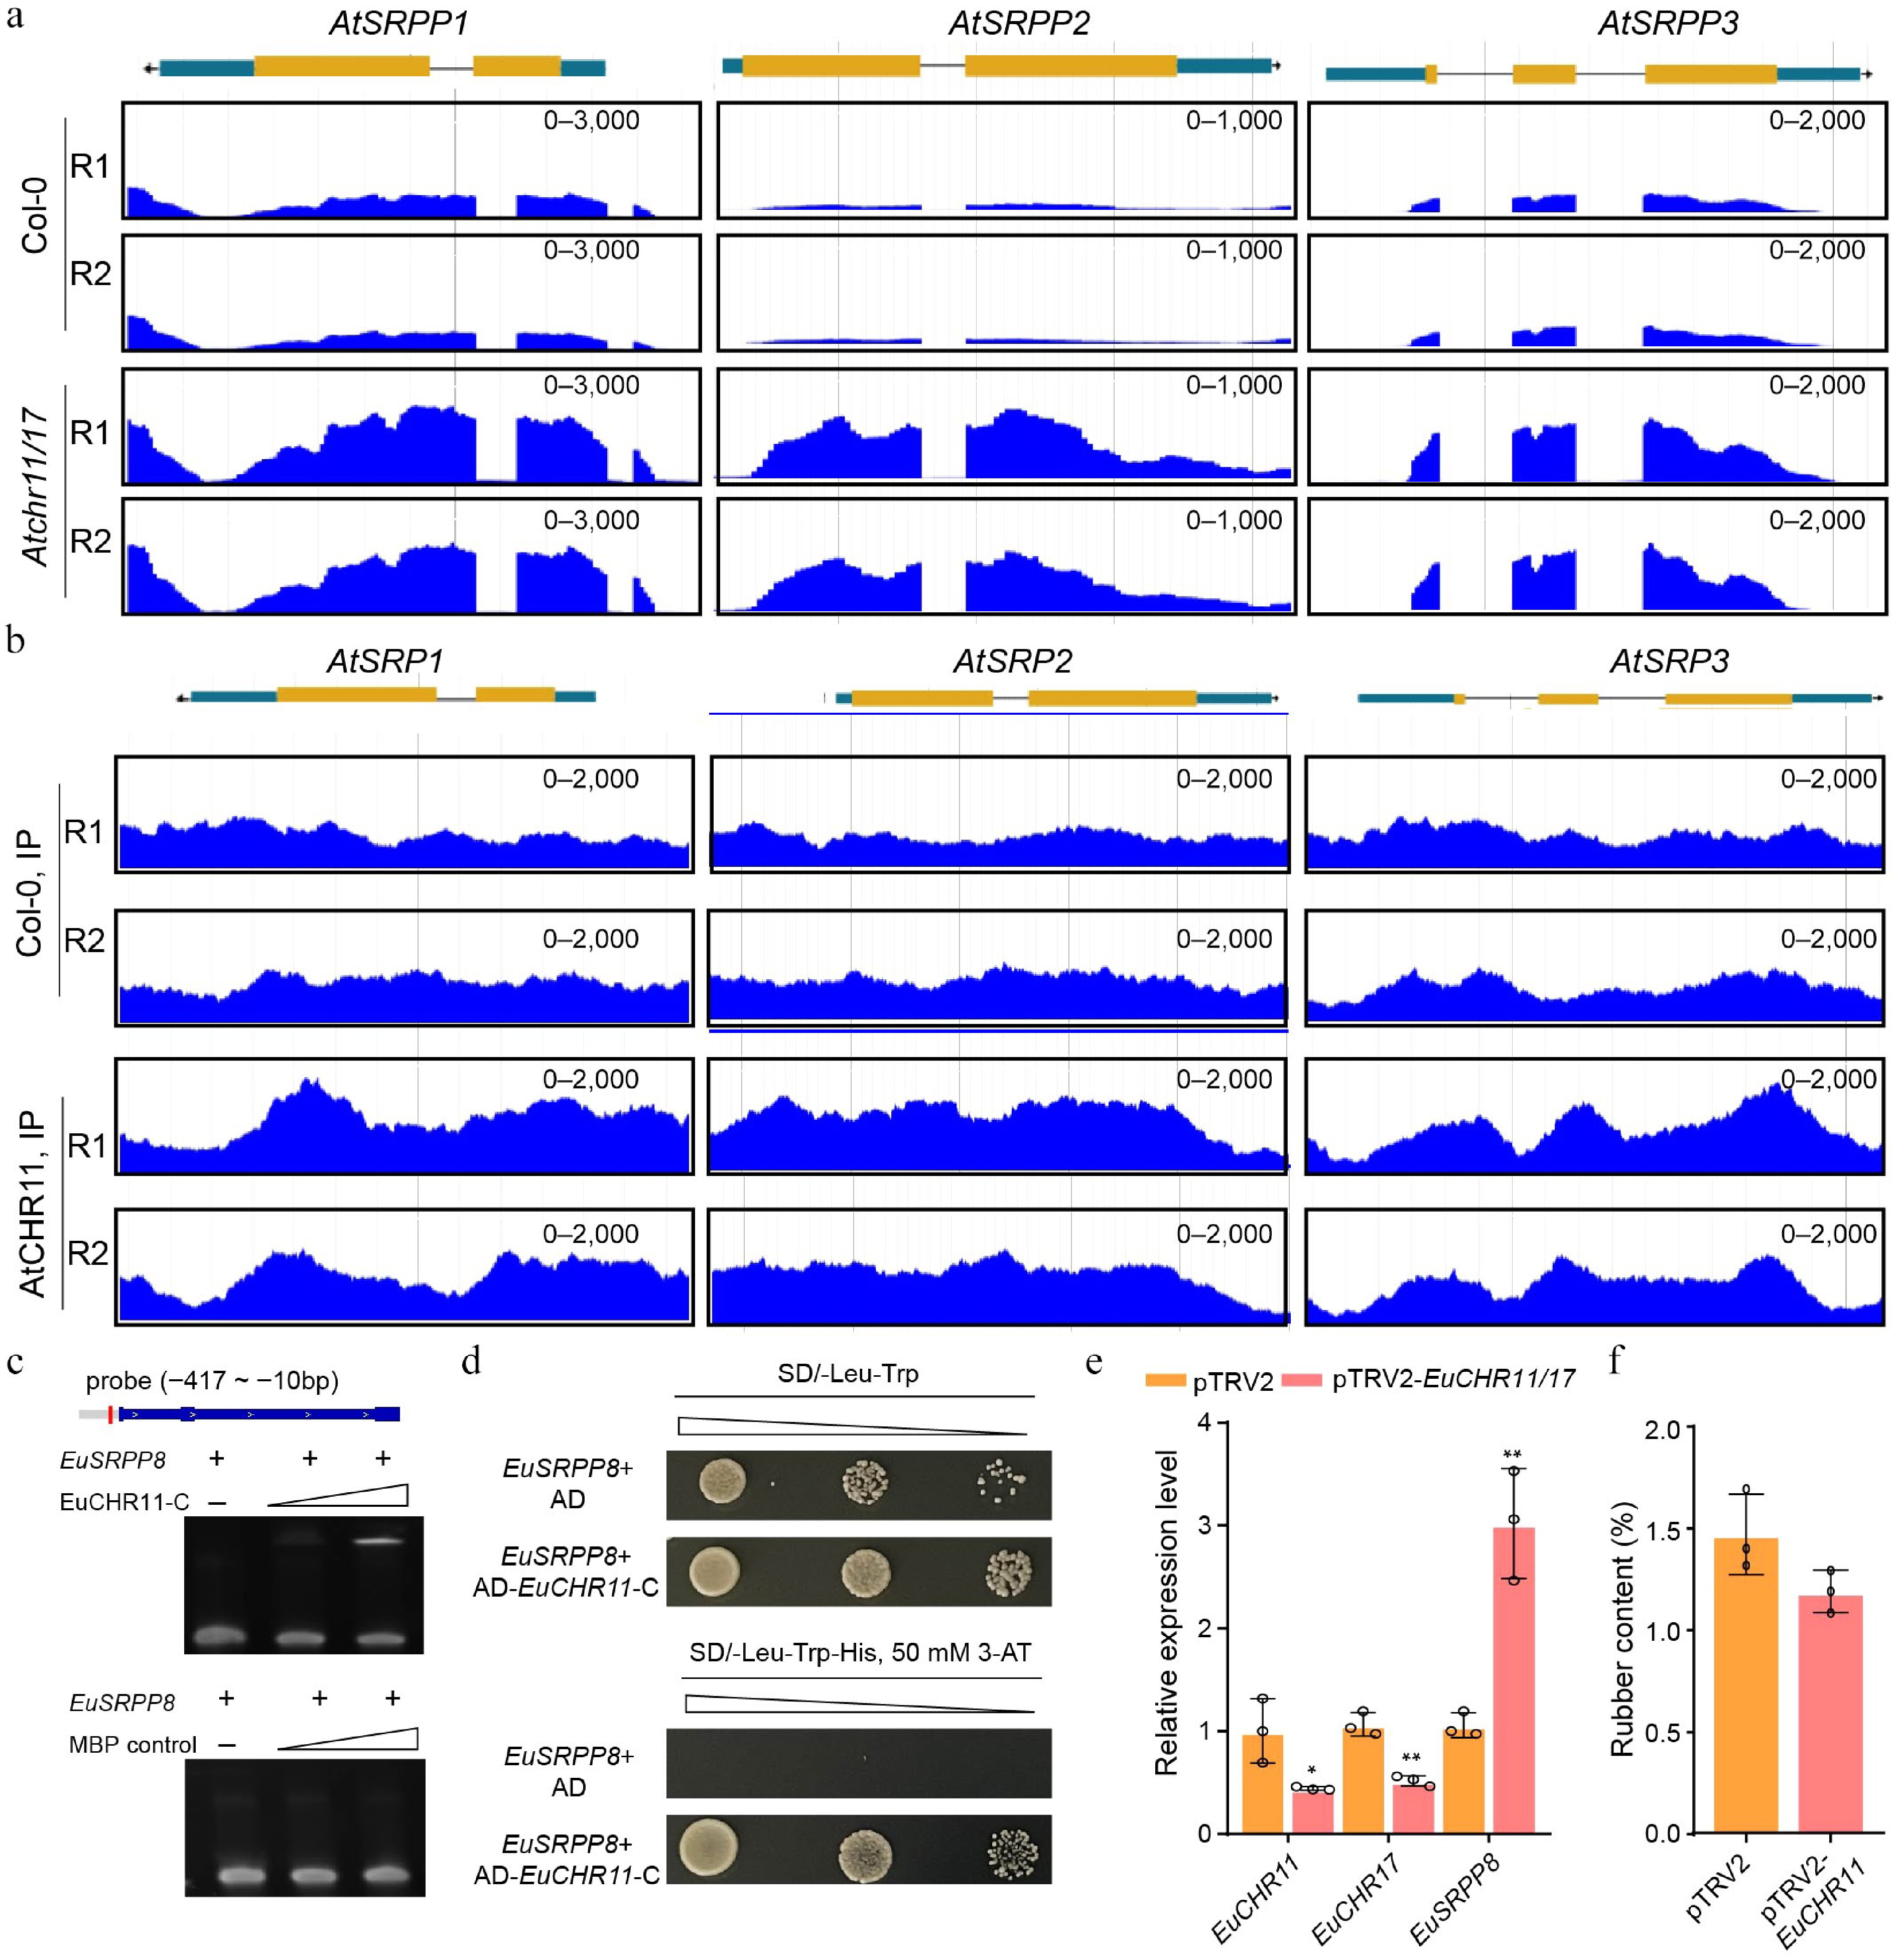
Figure 4.
CHR11 negatively regulates the expression of the SRPP family genes in Arabidopsis and E. ulmoides. (a) Genome browser view of RNA-seq signals of AtSRPP1, AtSRPP2, and AtSRPP3 in the WT and Atchr11/17 double mutant. RPKM scale is shown for each panel. Data from two biological replicates are shown. (b) Genome browser view of AtCHR11 ChIP-seq peaks at the genomic loci of AtSRPP1, AtSRPP2, and AtSRPP3. RPKM scale is shown for each panel. Two replicates are shown. (c) EMSA showing the binding of EuCHR11-C to the EuSRPP8 promoter. The empty MBP protein was used as a negative control. (d) Y1H showing the binding of EuCHR11-C to the EuSRPP8 promoter. The empty AD vector was used as a negative control. (e) The relative expression levels of EuCHR11, EuCHR17 and EuSRPP8 genes infiltrated with TRV2 or TRV2-EuCHR11/17 vector. (f) Statistical analysis of TPI concentration in leaves infiltrated with TRV2 or TRV2-EuCHR11/17 vector. Values are means ± SD of three biological replicates. All p-values were obtained by two-tailed t-tests. * p < 0.05 and ** p < 0.01 represented the highly significant and significant difference, respectively.
Figures
(4)
Tables
(0)