-
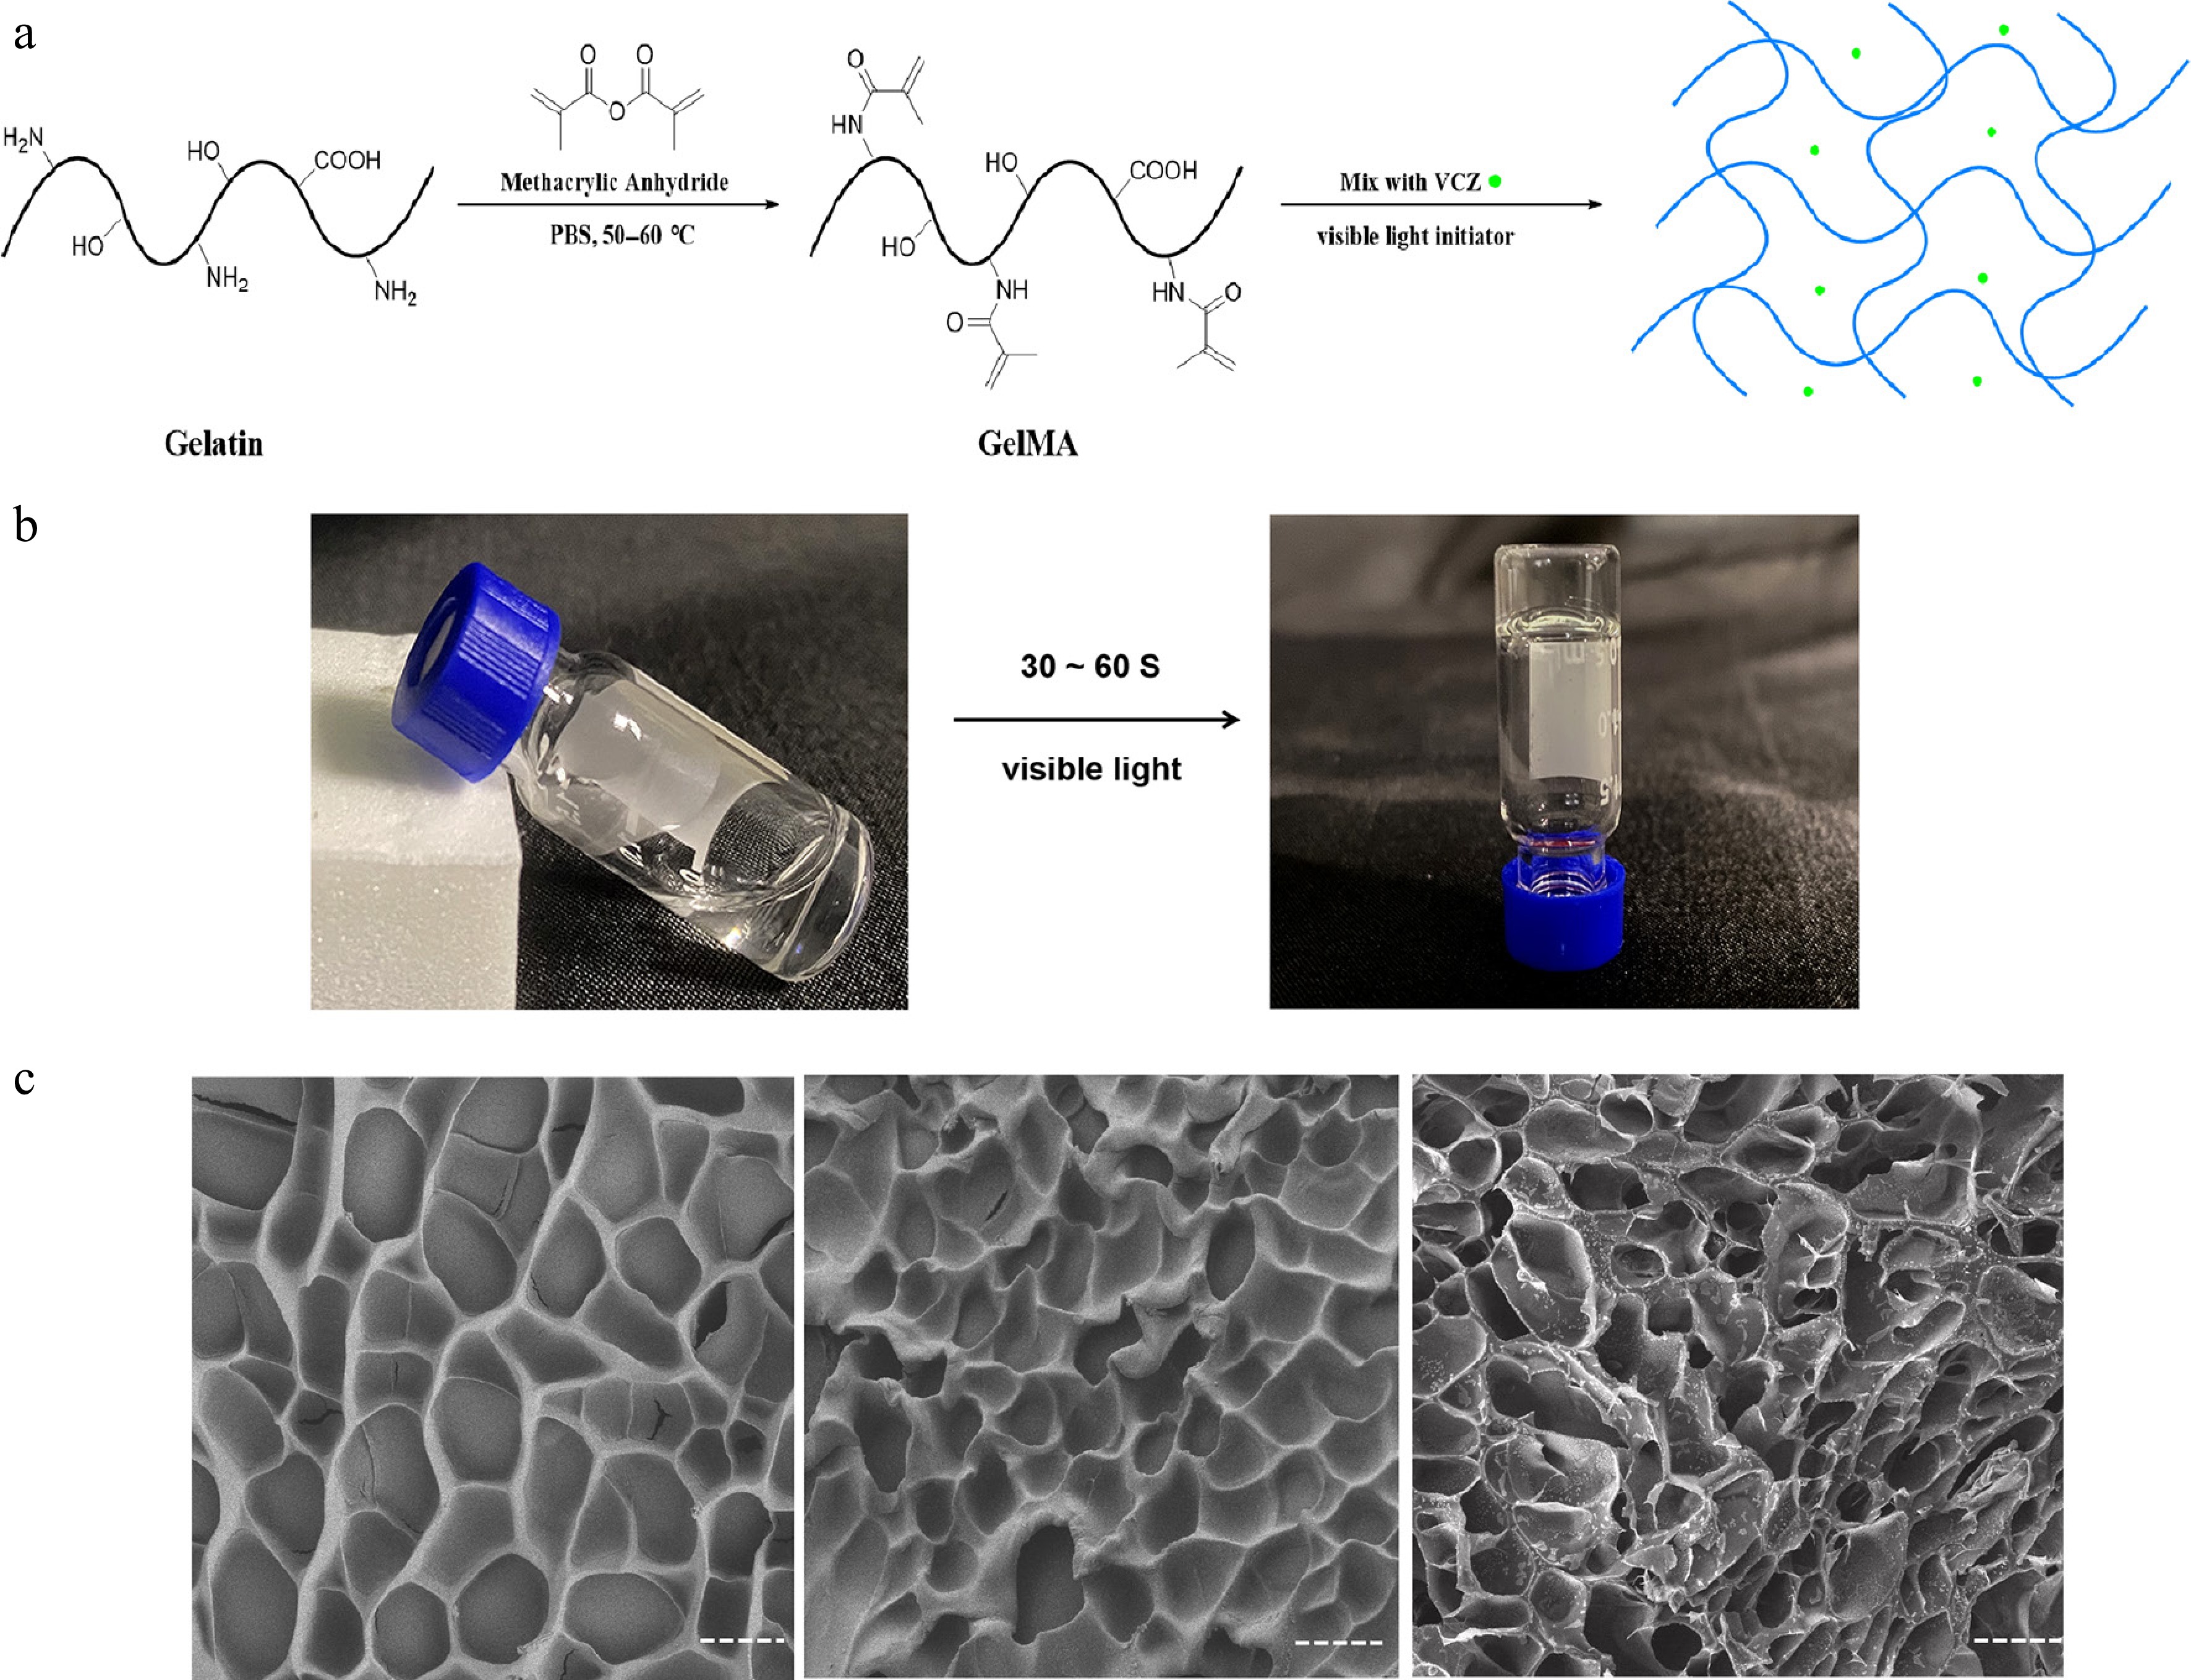
Figure 1.
The preparation and characterization of the GelMA hydrogels. (a) Schematic illustrations of the synthesis of GelMA hydrogel with VCZ. (b) Enlarged view of the GelMA hydrogel's formation. (c) SEM images of the blank hydrogels (10% and 20% GelMA) and the drug-loaded hydrogels (10% GelMA).
-
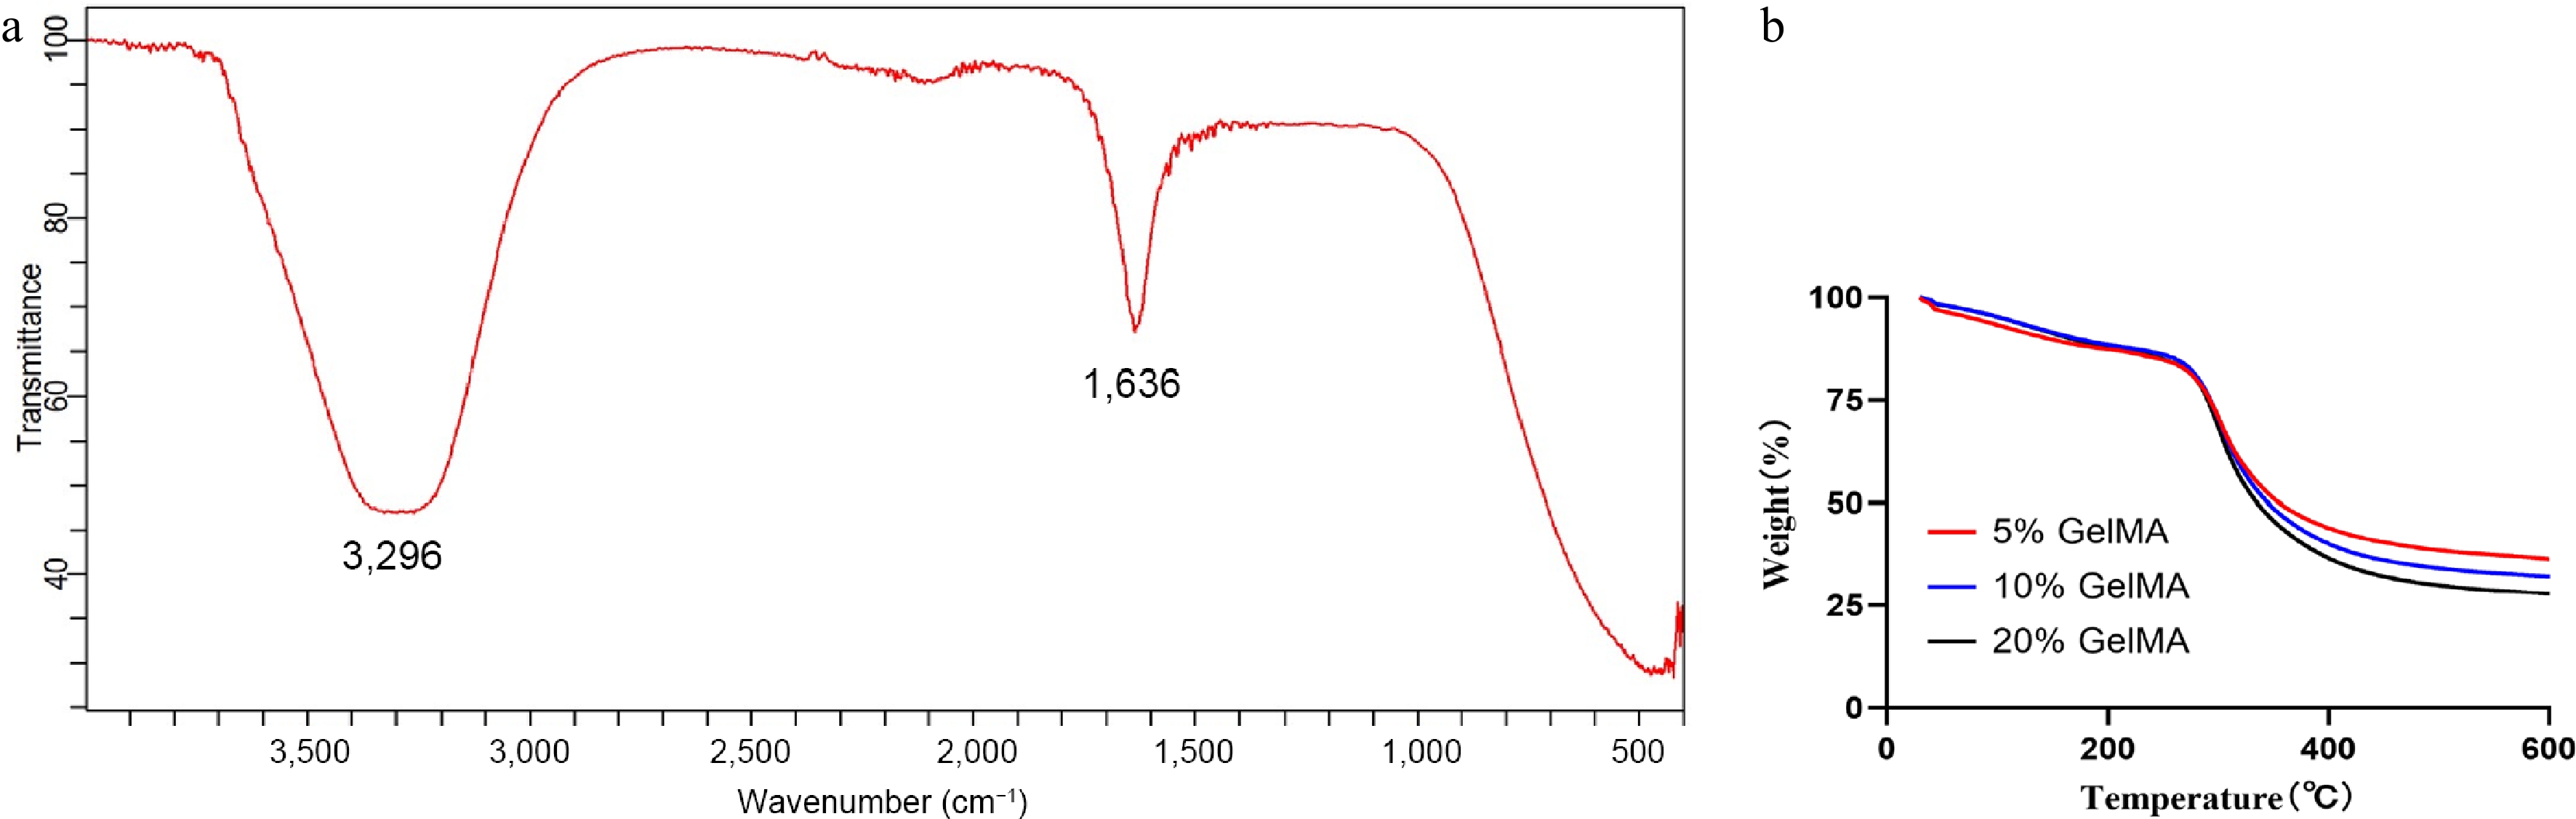
Figure 2.
Fabrication and thermogravimetric analysis of GelMA hydrogels. (a) The FTIR spectra of the GelMA hydrogels. (b) Thermogravimetric analysis of 5%, 10%, and 20% GelMA hydrogels.
-
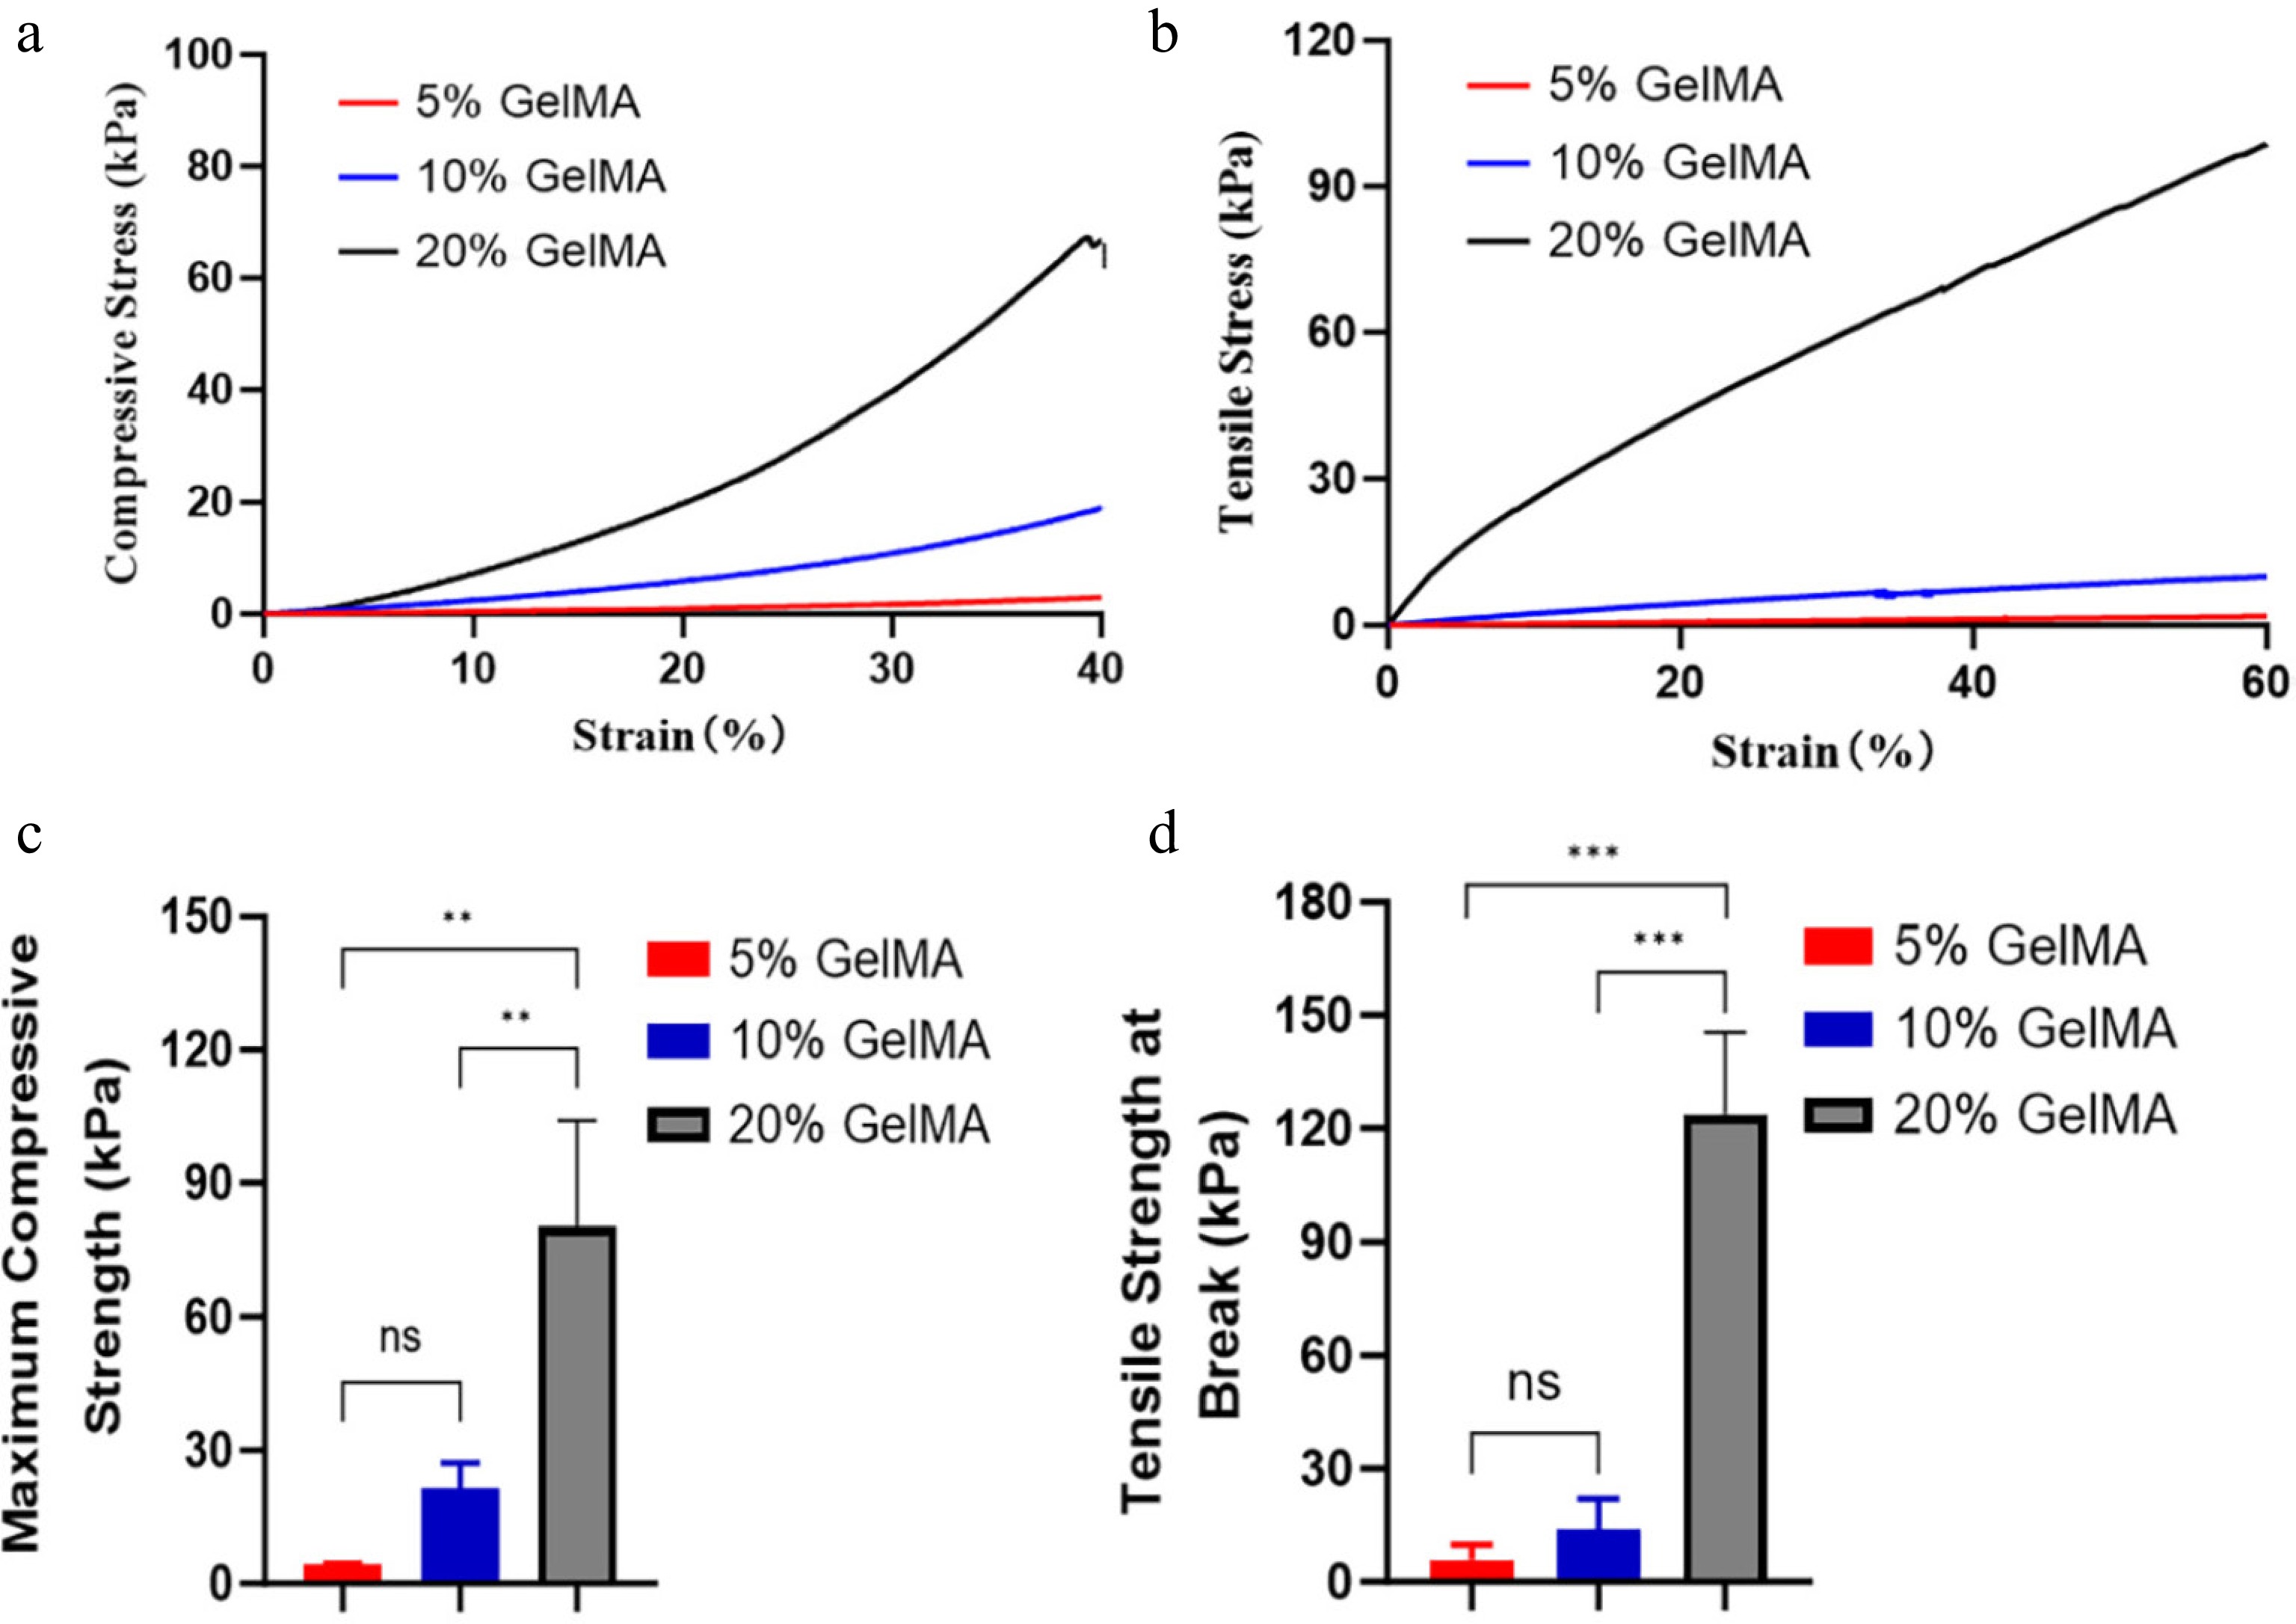
Figure 3.
The mechanical properties of GelMA hydrogels. (a) The compressive stress–strain curve of GelMA hydrogels at different concentrations. (b) The tensile stress–strain curve of GelMA hydrogels across different concentrations. (c) The maximum compressive stress among 5%, 10%, and 20% GelMA hydrogels (p > 0.05, ANOVA). (d) Tensile modulus at breaking strength of different hydrogels (p > 0.05, ANOVA). ns > 0.05, *p < 0.05, **p < 0.01, and ***p < 0.001.
-
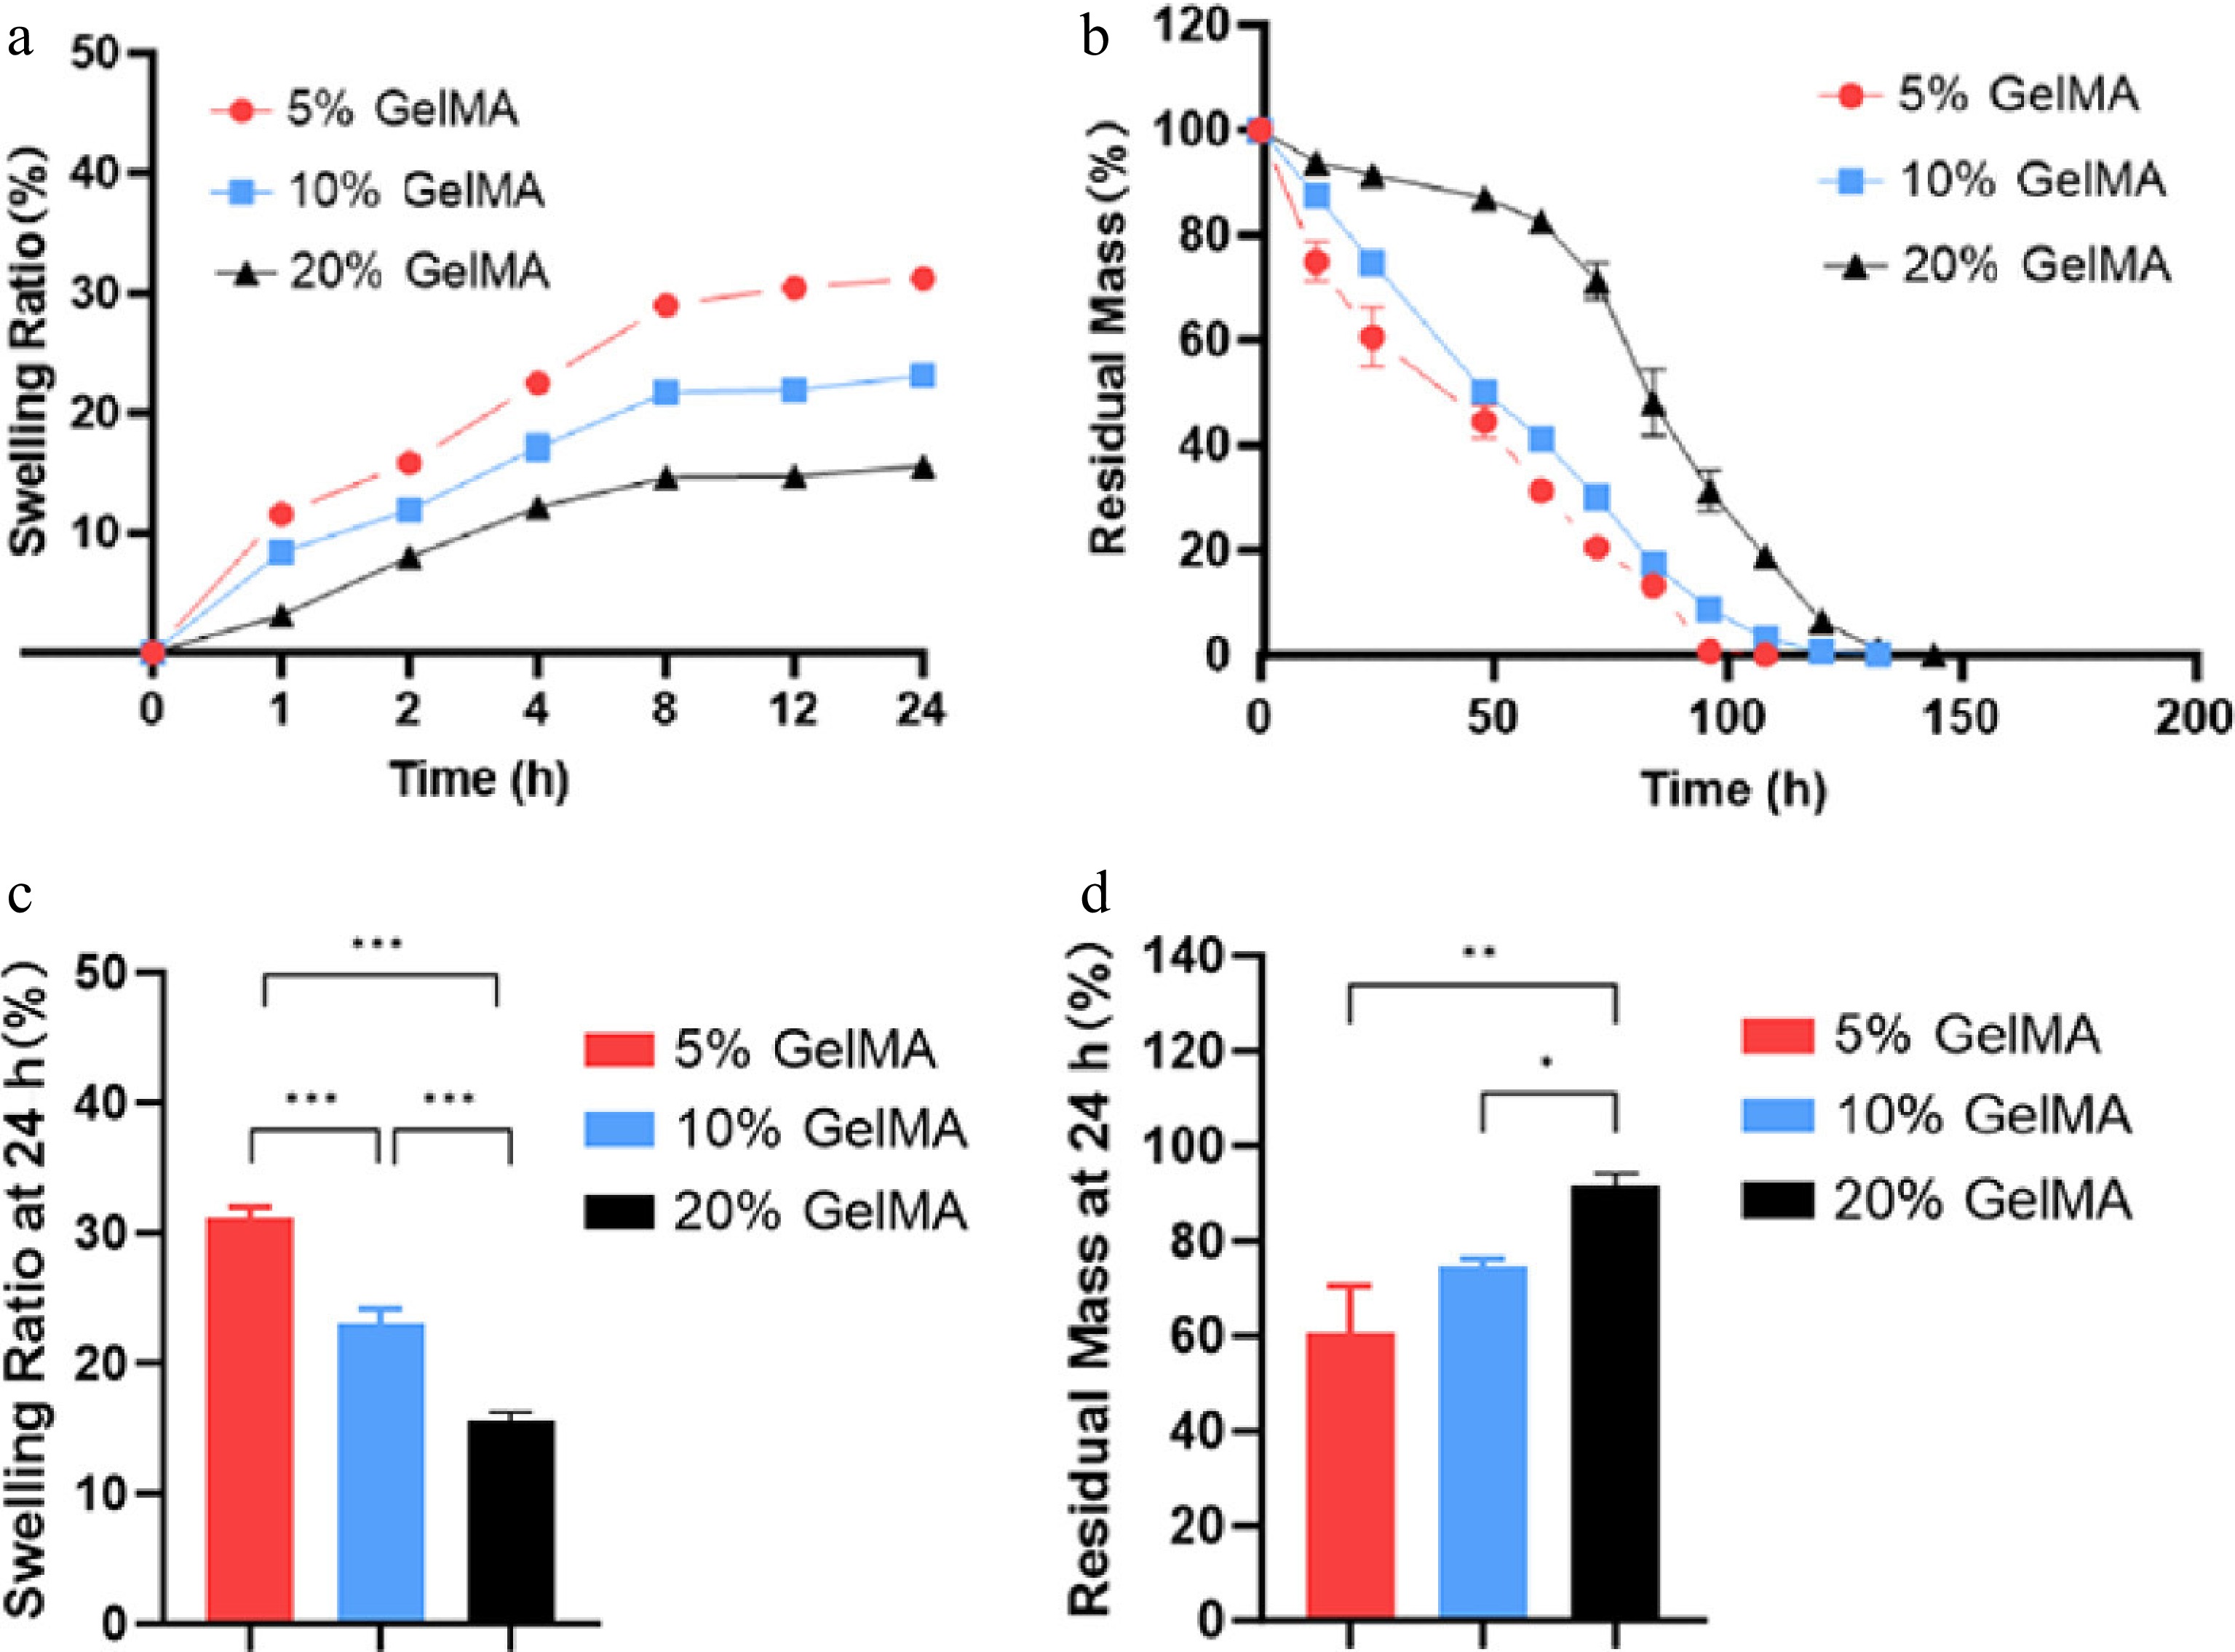
Figure 4.
The swelling and degrading characterization of GelMA hydrogels. (a) Swelling curves of the hydrogels. (b) The remaining weight curves of the GelMA hydrogels under enzymatic hydrolysis. (c) The swelling ratio of GelMA hydrogels in PBS at 24 h. (d) The residual mass rate of GelMA hydrogels at 24 h. ns > 0.05, *p < 0.05, **p < 0.01, and ***p < 0.001.
-
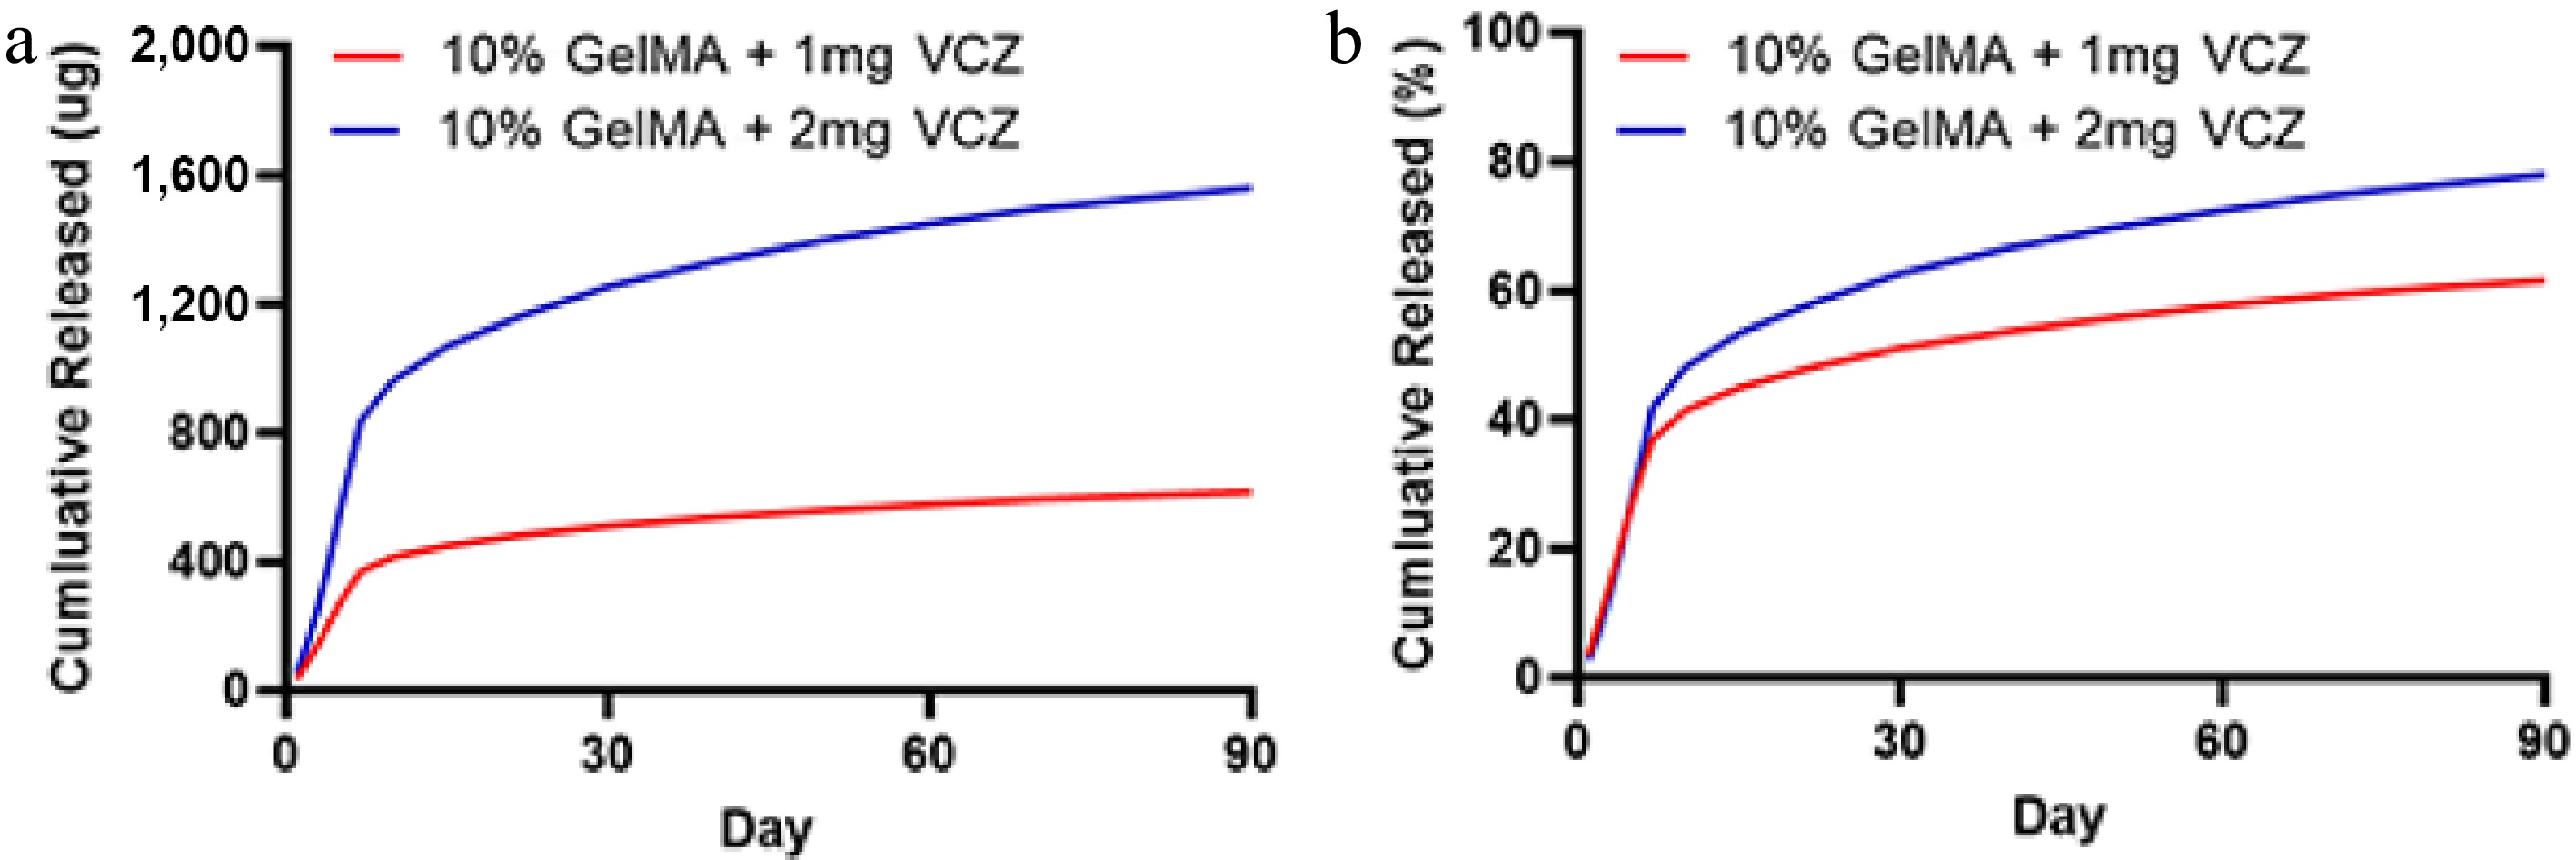
Figure 5.
The release characteristics of the GelMA hydrogels with VCZ at different concentrations after incubation in drug release media (PBS). (a) The quantification of VCZ released from 10% GelMA hydrogel loaded with 1 and 2 mg after incubation in the drug release media (PBS). (b) The cumulative release rate of VCZ of the drug-loaded hydrogels at 37 °C in PBS.
-
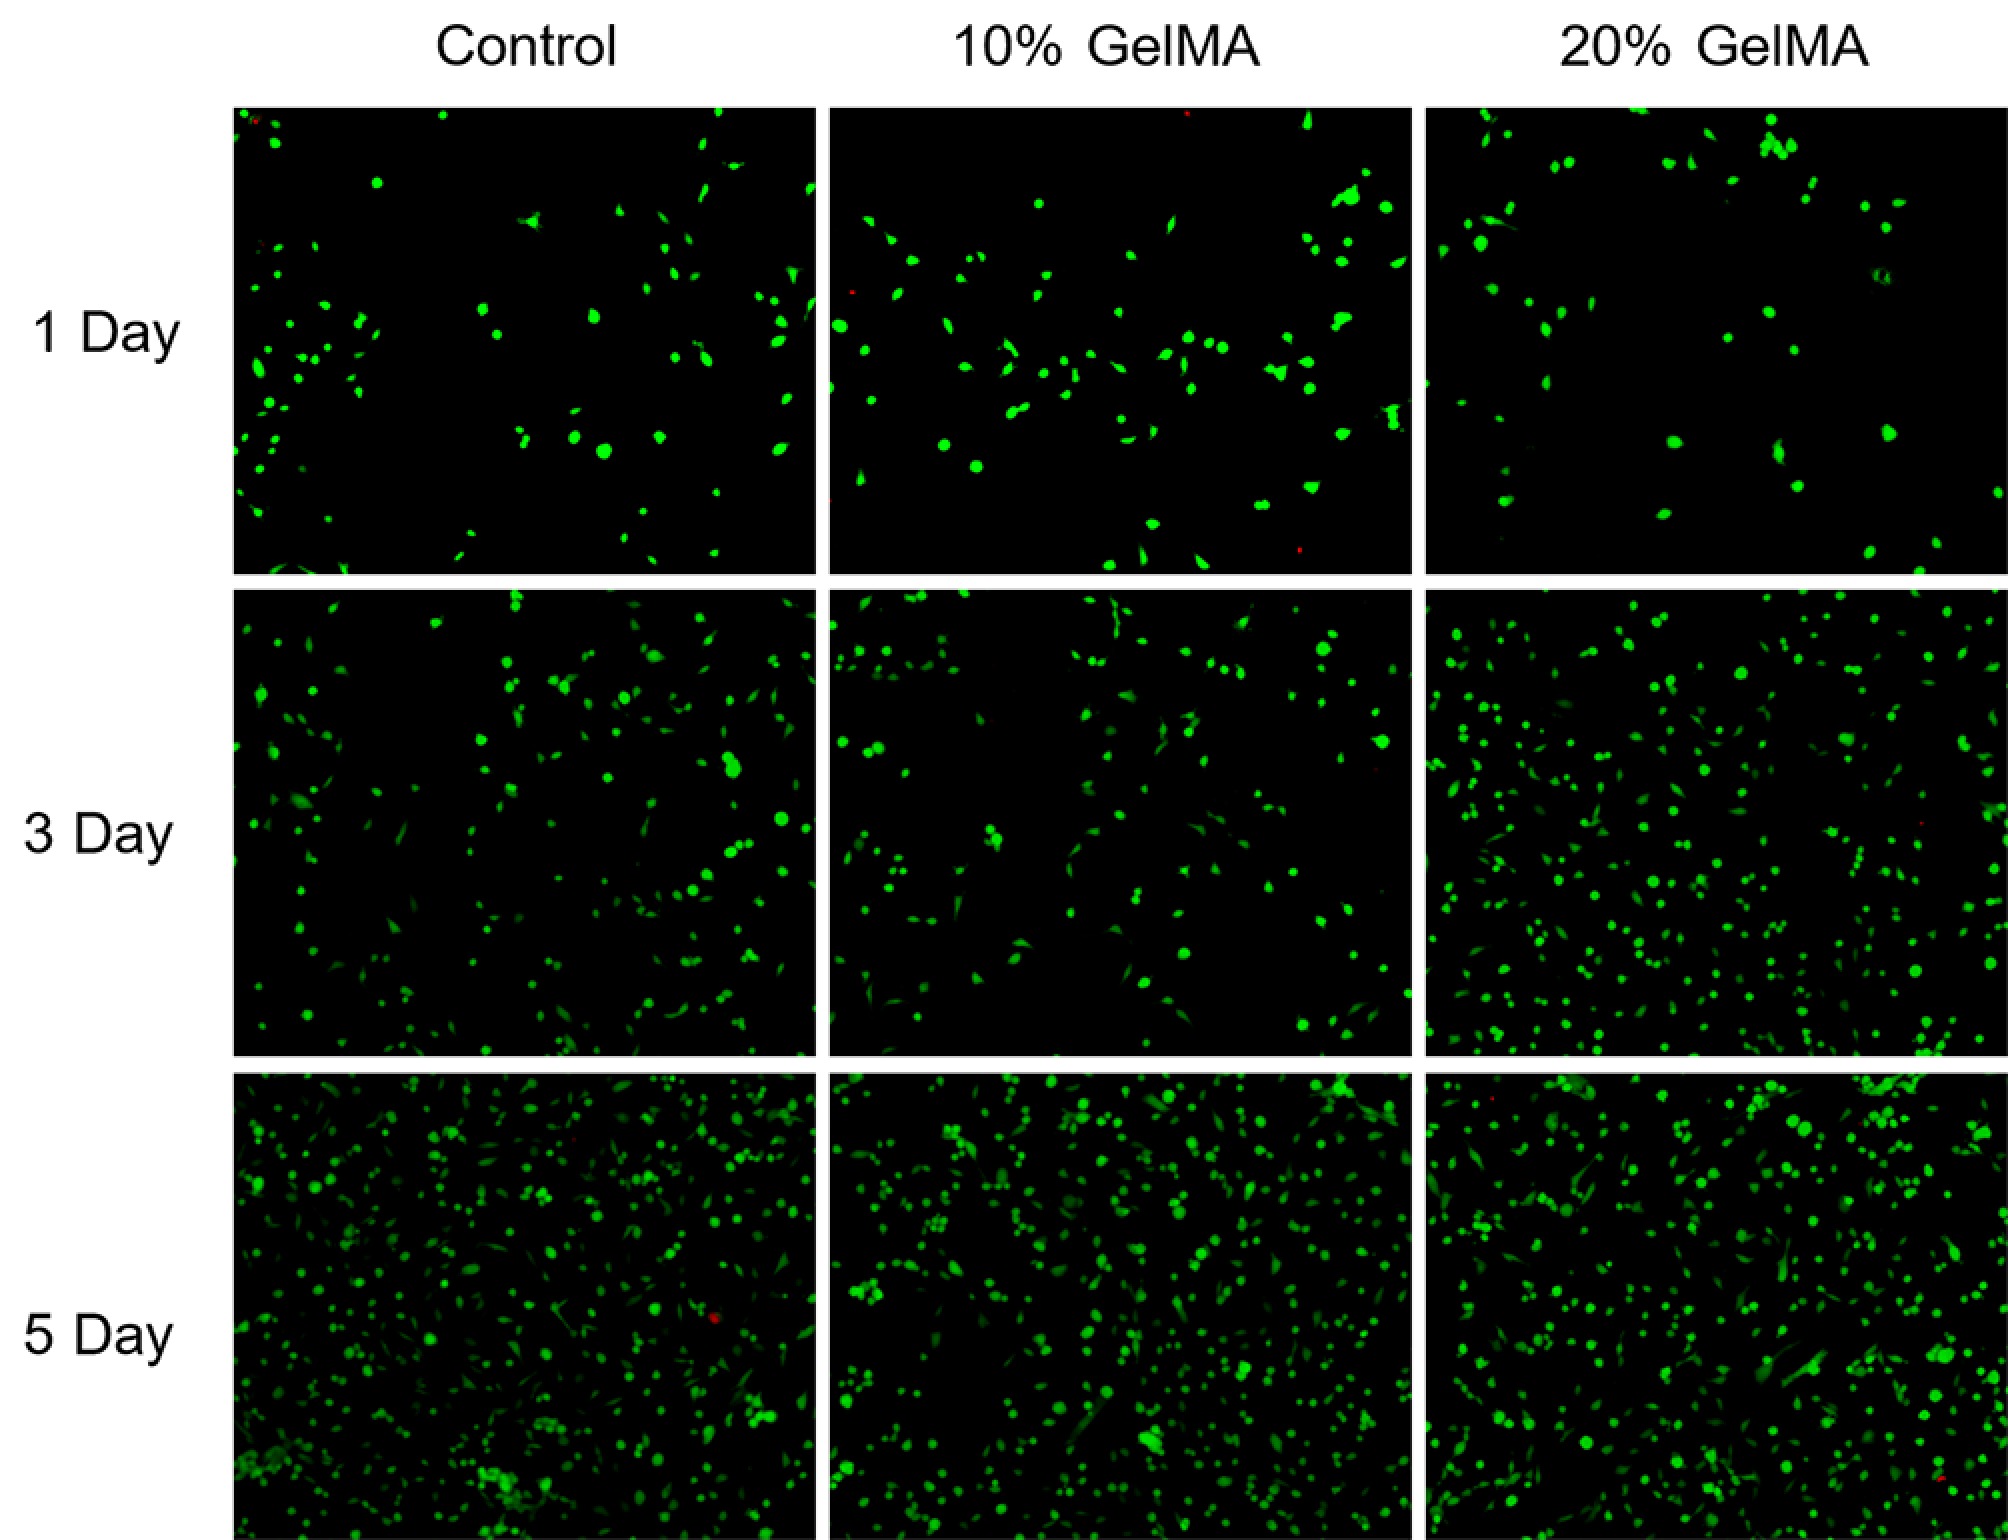
Figure 6.
The live and dead cells assay after 1, 3, and 5 days of the control, 10% GelMA, and 20% GelMA hydrogels (live HRPE cells are in green and dead HRPE cells are in red).
-
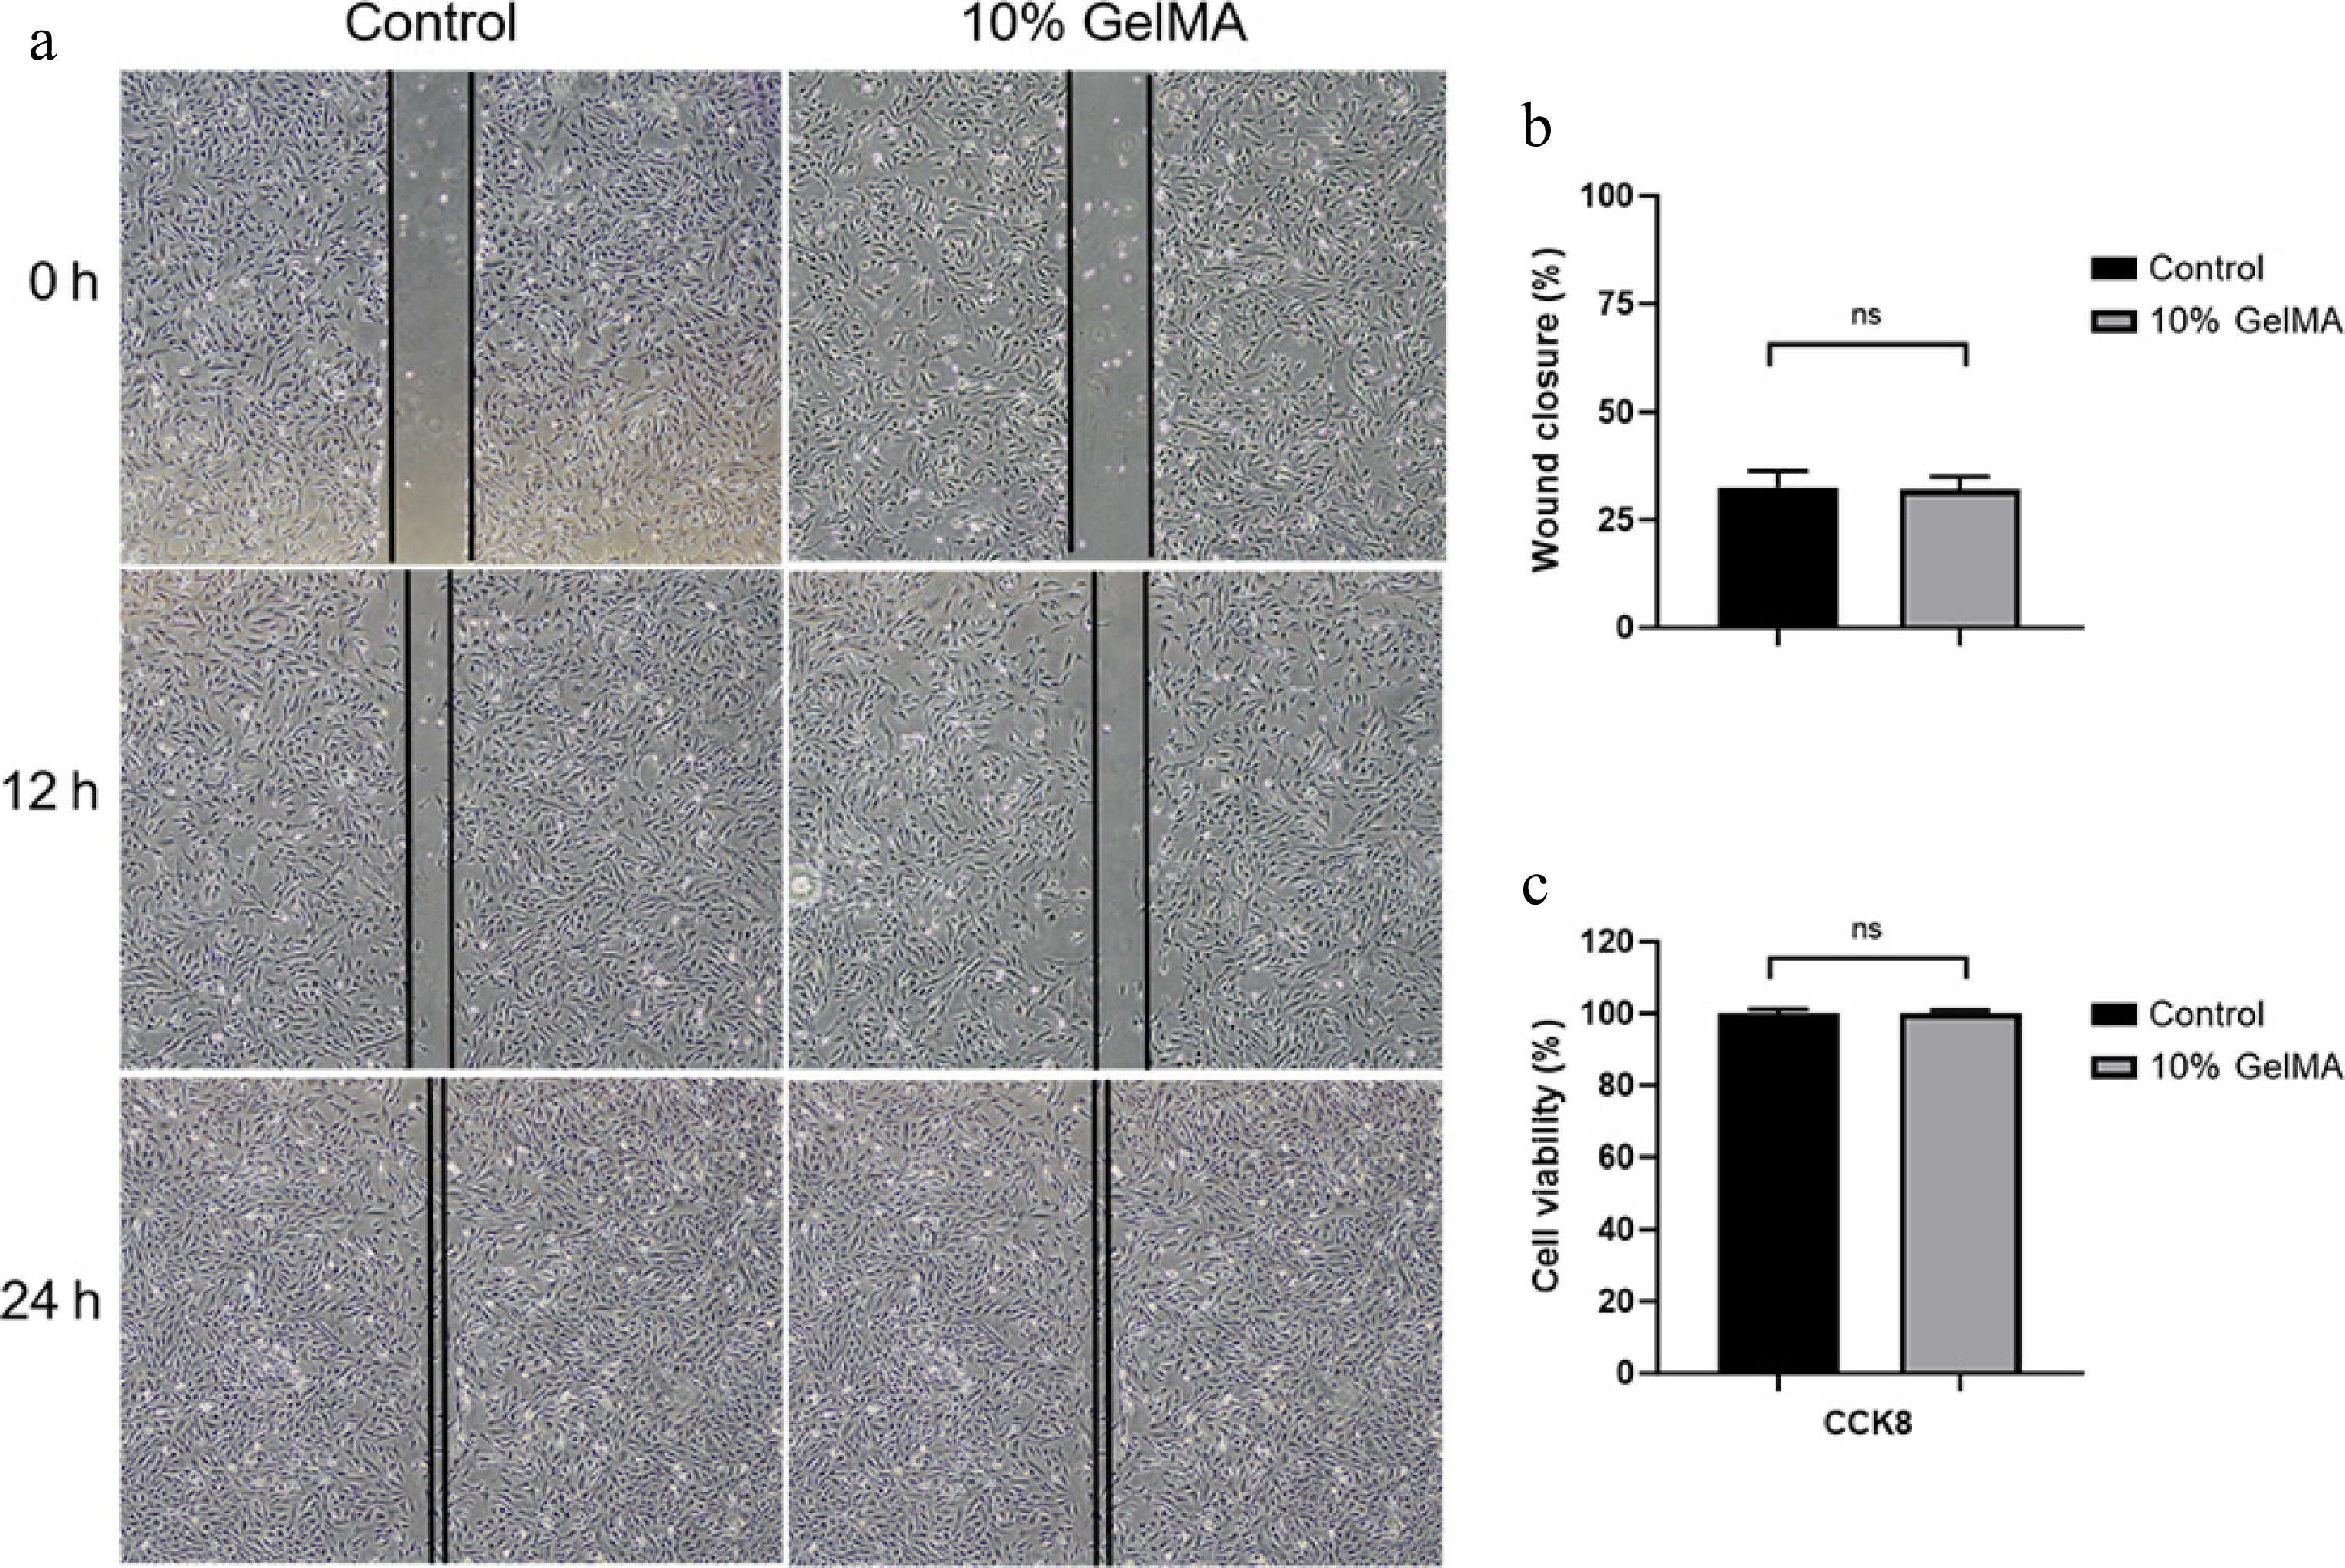
Figure 7.
Assessment of the cytocompatibility of GelMA hydrogels. (a) Microscopy images of the HRPE cell migration scratch assay at 0, 12, and 24 h. (b) The wound closure rate of cells at 12 h (p > 0.05, t-test). (c) The cell viability was assessed using the CCK8 assay (p > 0.05, t-test). ns > 0.05.
-
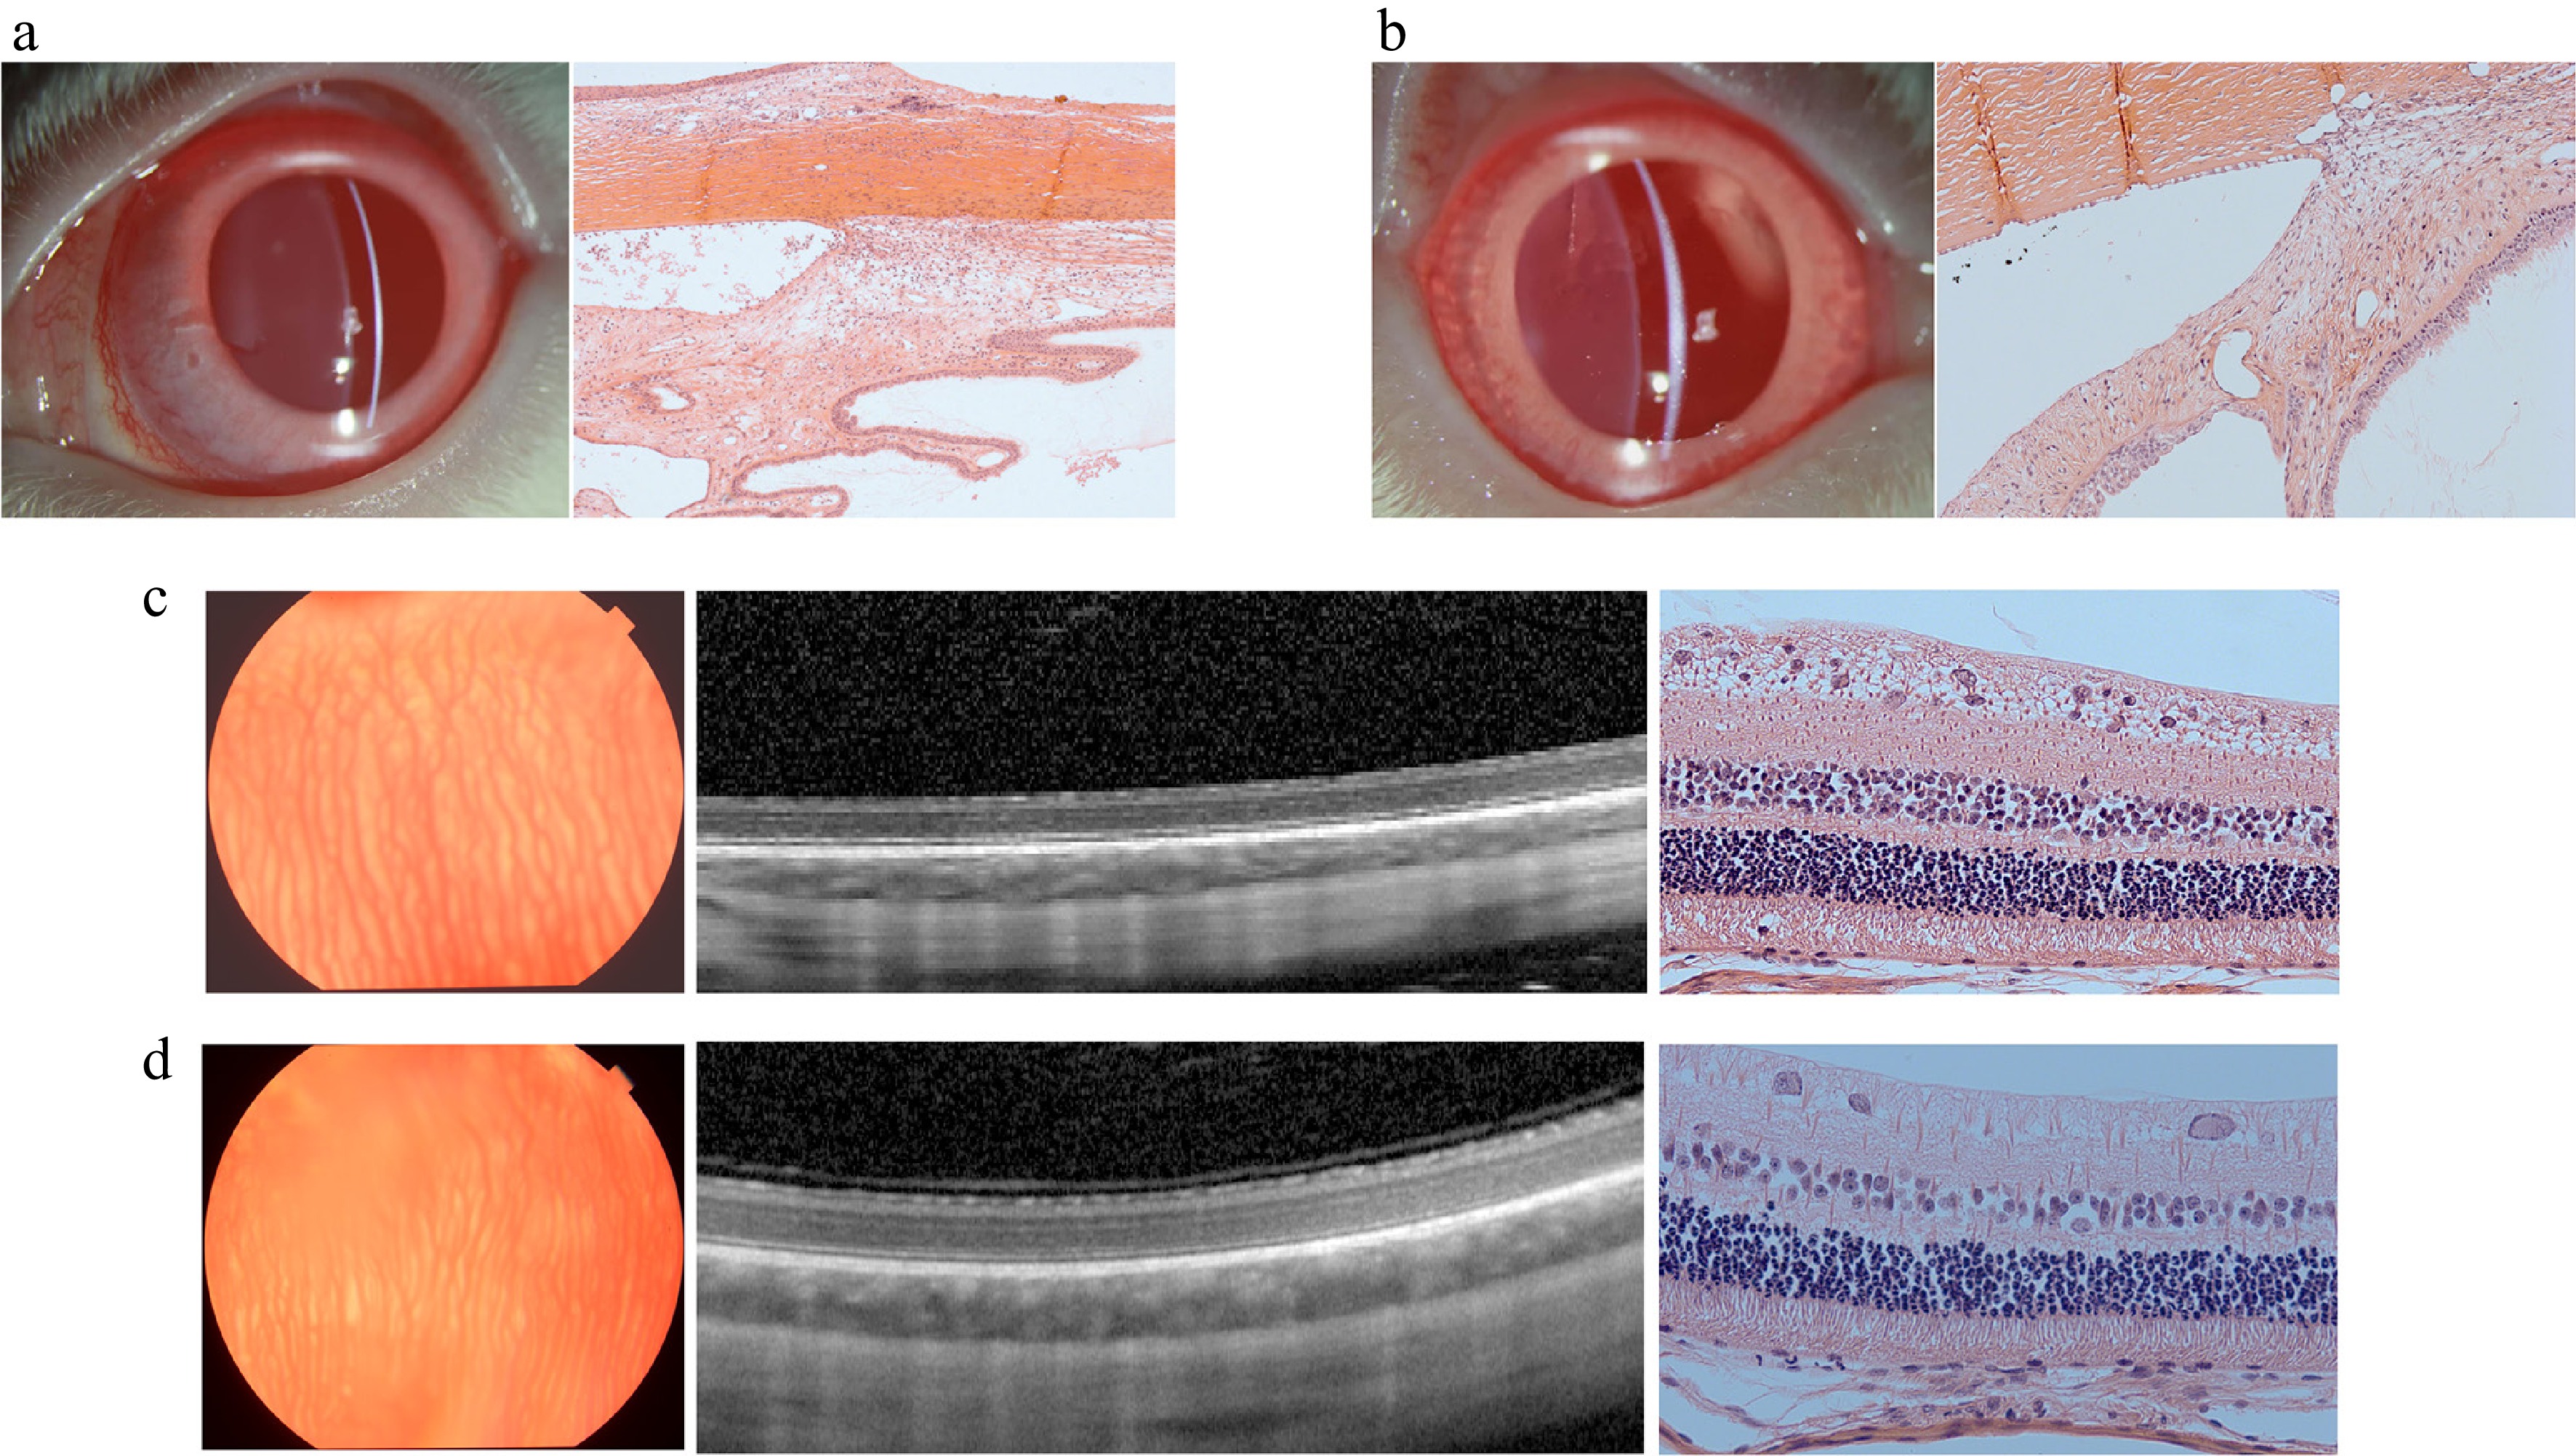
Figure 8.
Images of the biocompatibility in vivo of the control group and GelMA hydrogel group after 2 months. (a) Slit-lamp photo and H&E staining light photomicrographs of the anterior chamber angle in the control (balanced salt solution) group. (b) Slit-lamp photo and H&E staining light photomicrograph of the anterior chamber angle in the 10% GelMA group. (c) Fundus photo, OCT images, and H&E staining light photomicrograph of the retina in the control (balanced salt solution) group. (d) The fundus photo, OCT images, and H&E staining light photomicrograph of the retina in the 10% GelMA group.
Figures
(8)
Tables
(0)