-
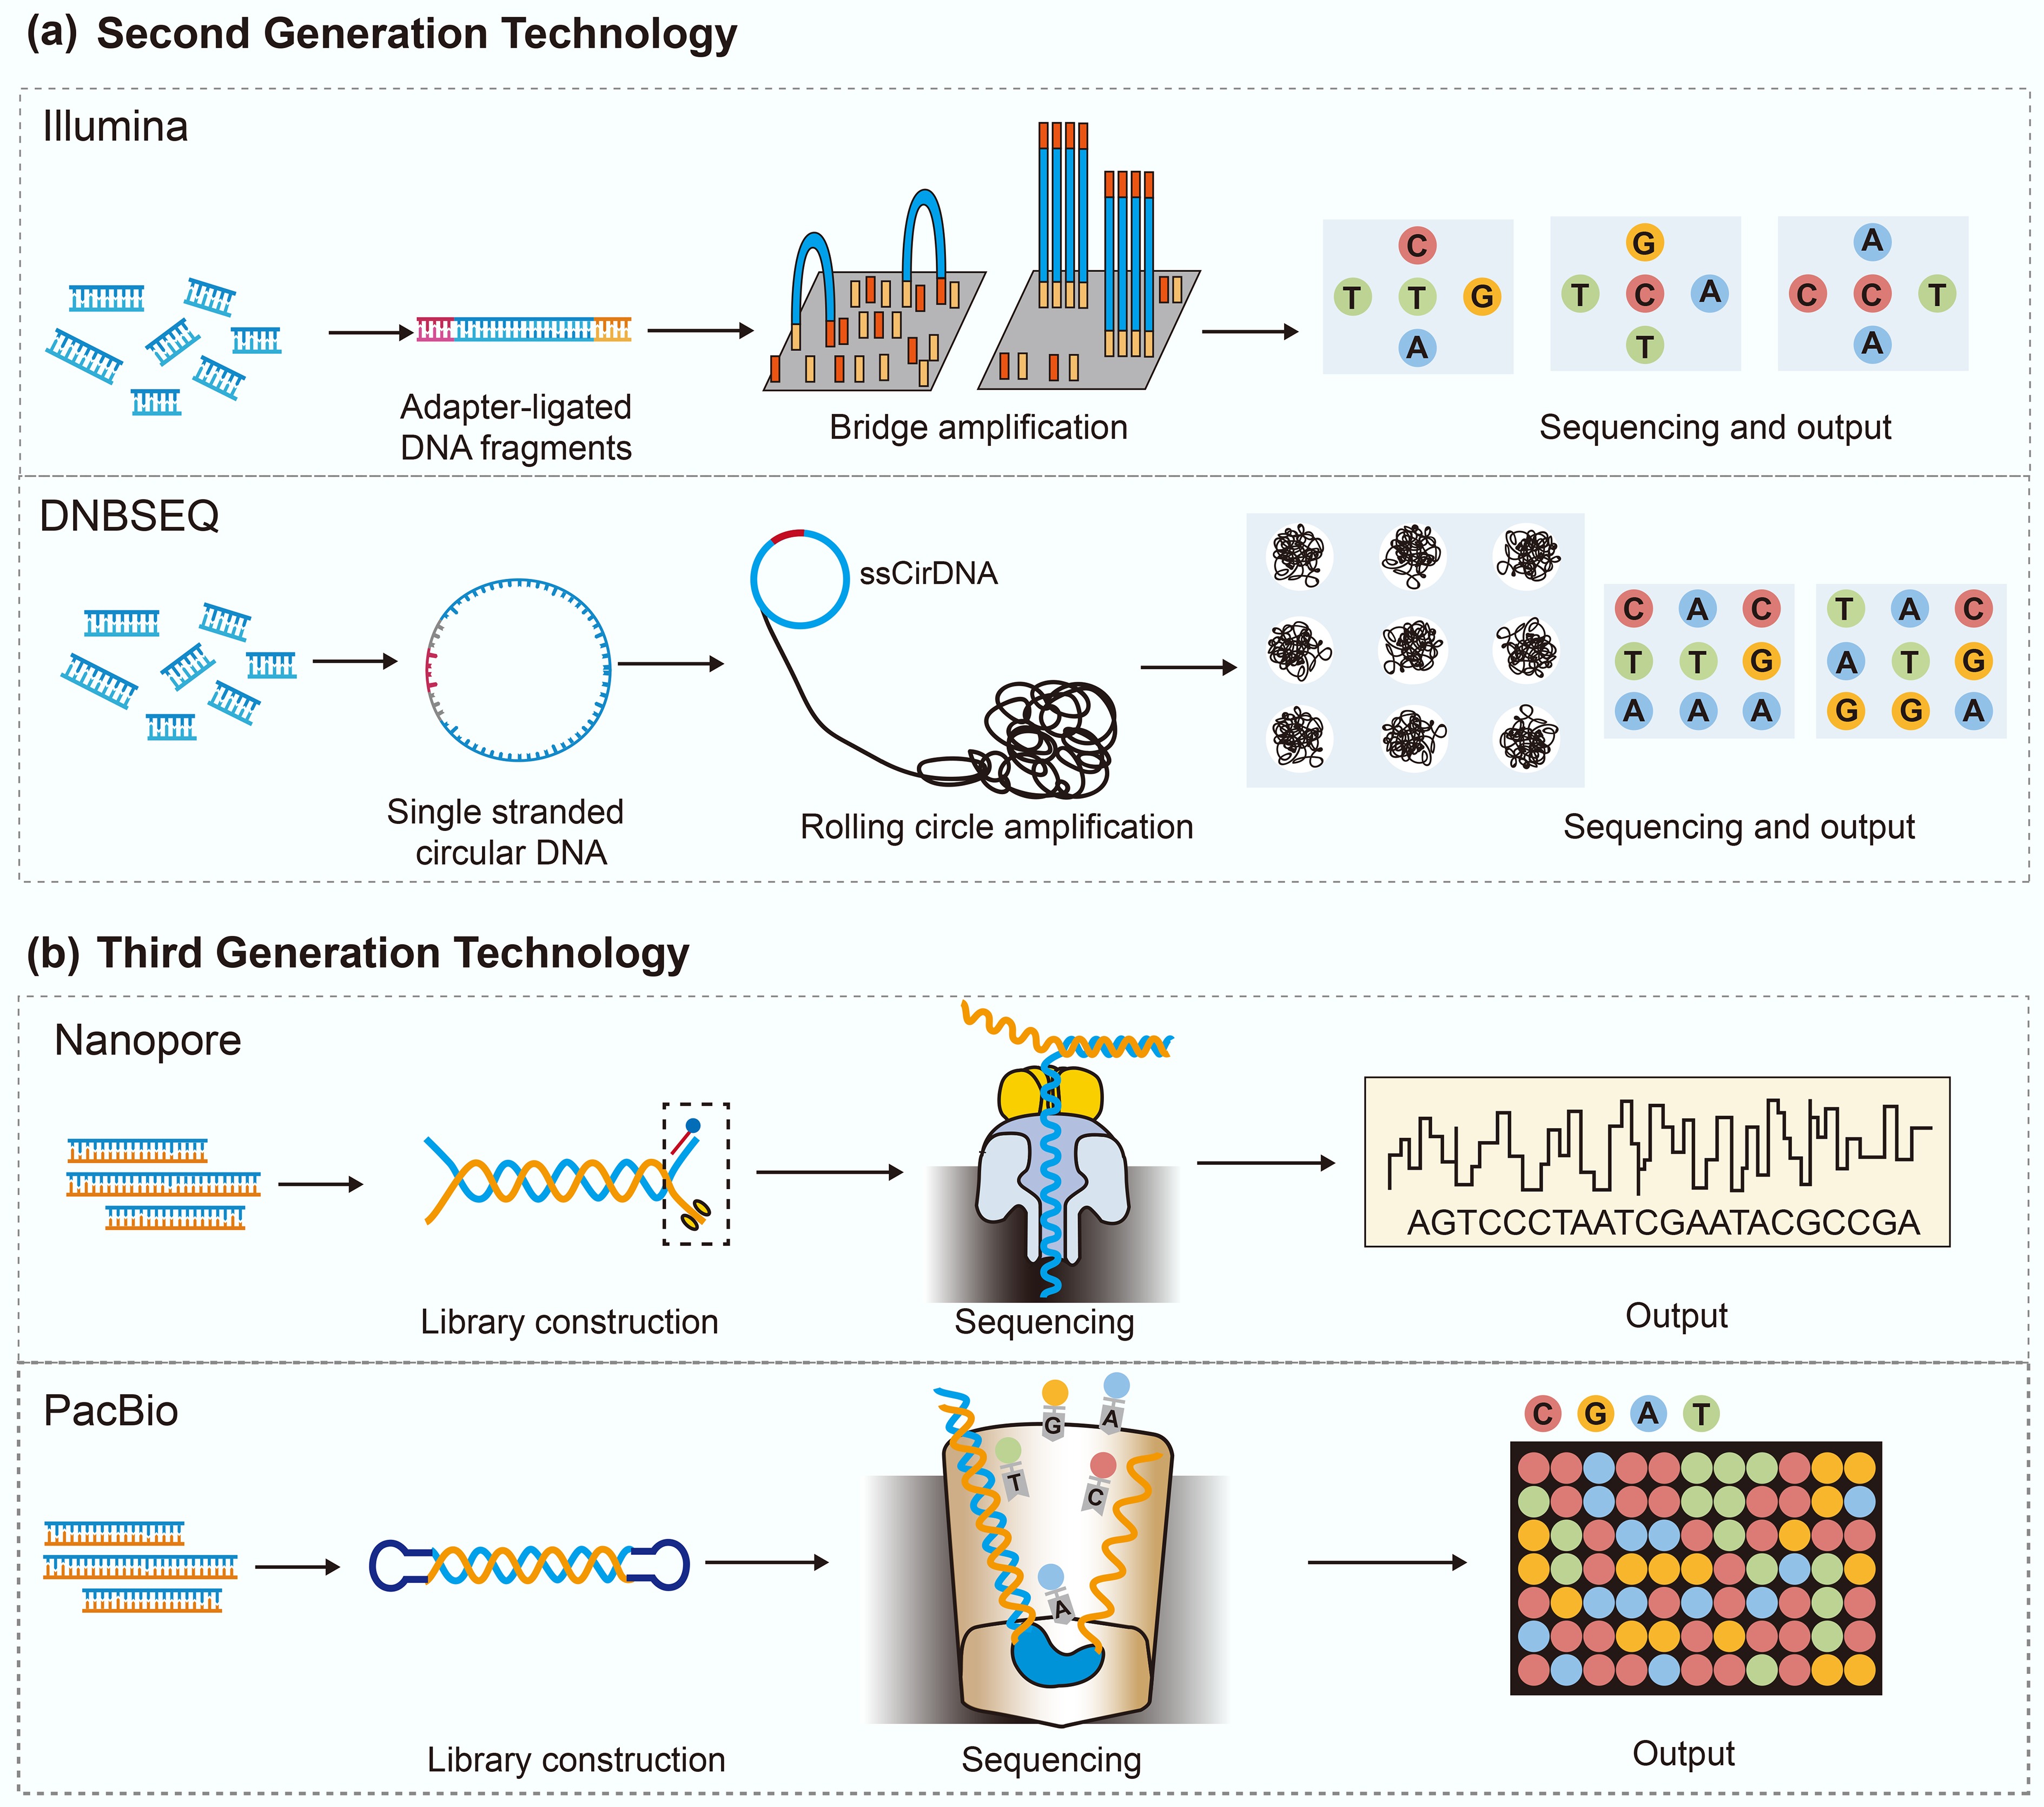
Figure 1.
The principle of second- and third-generation sequencing technologies.
-
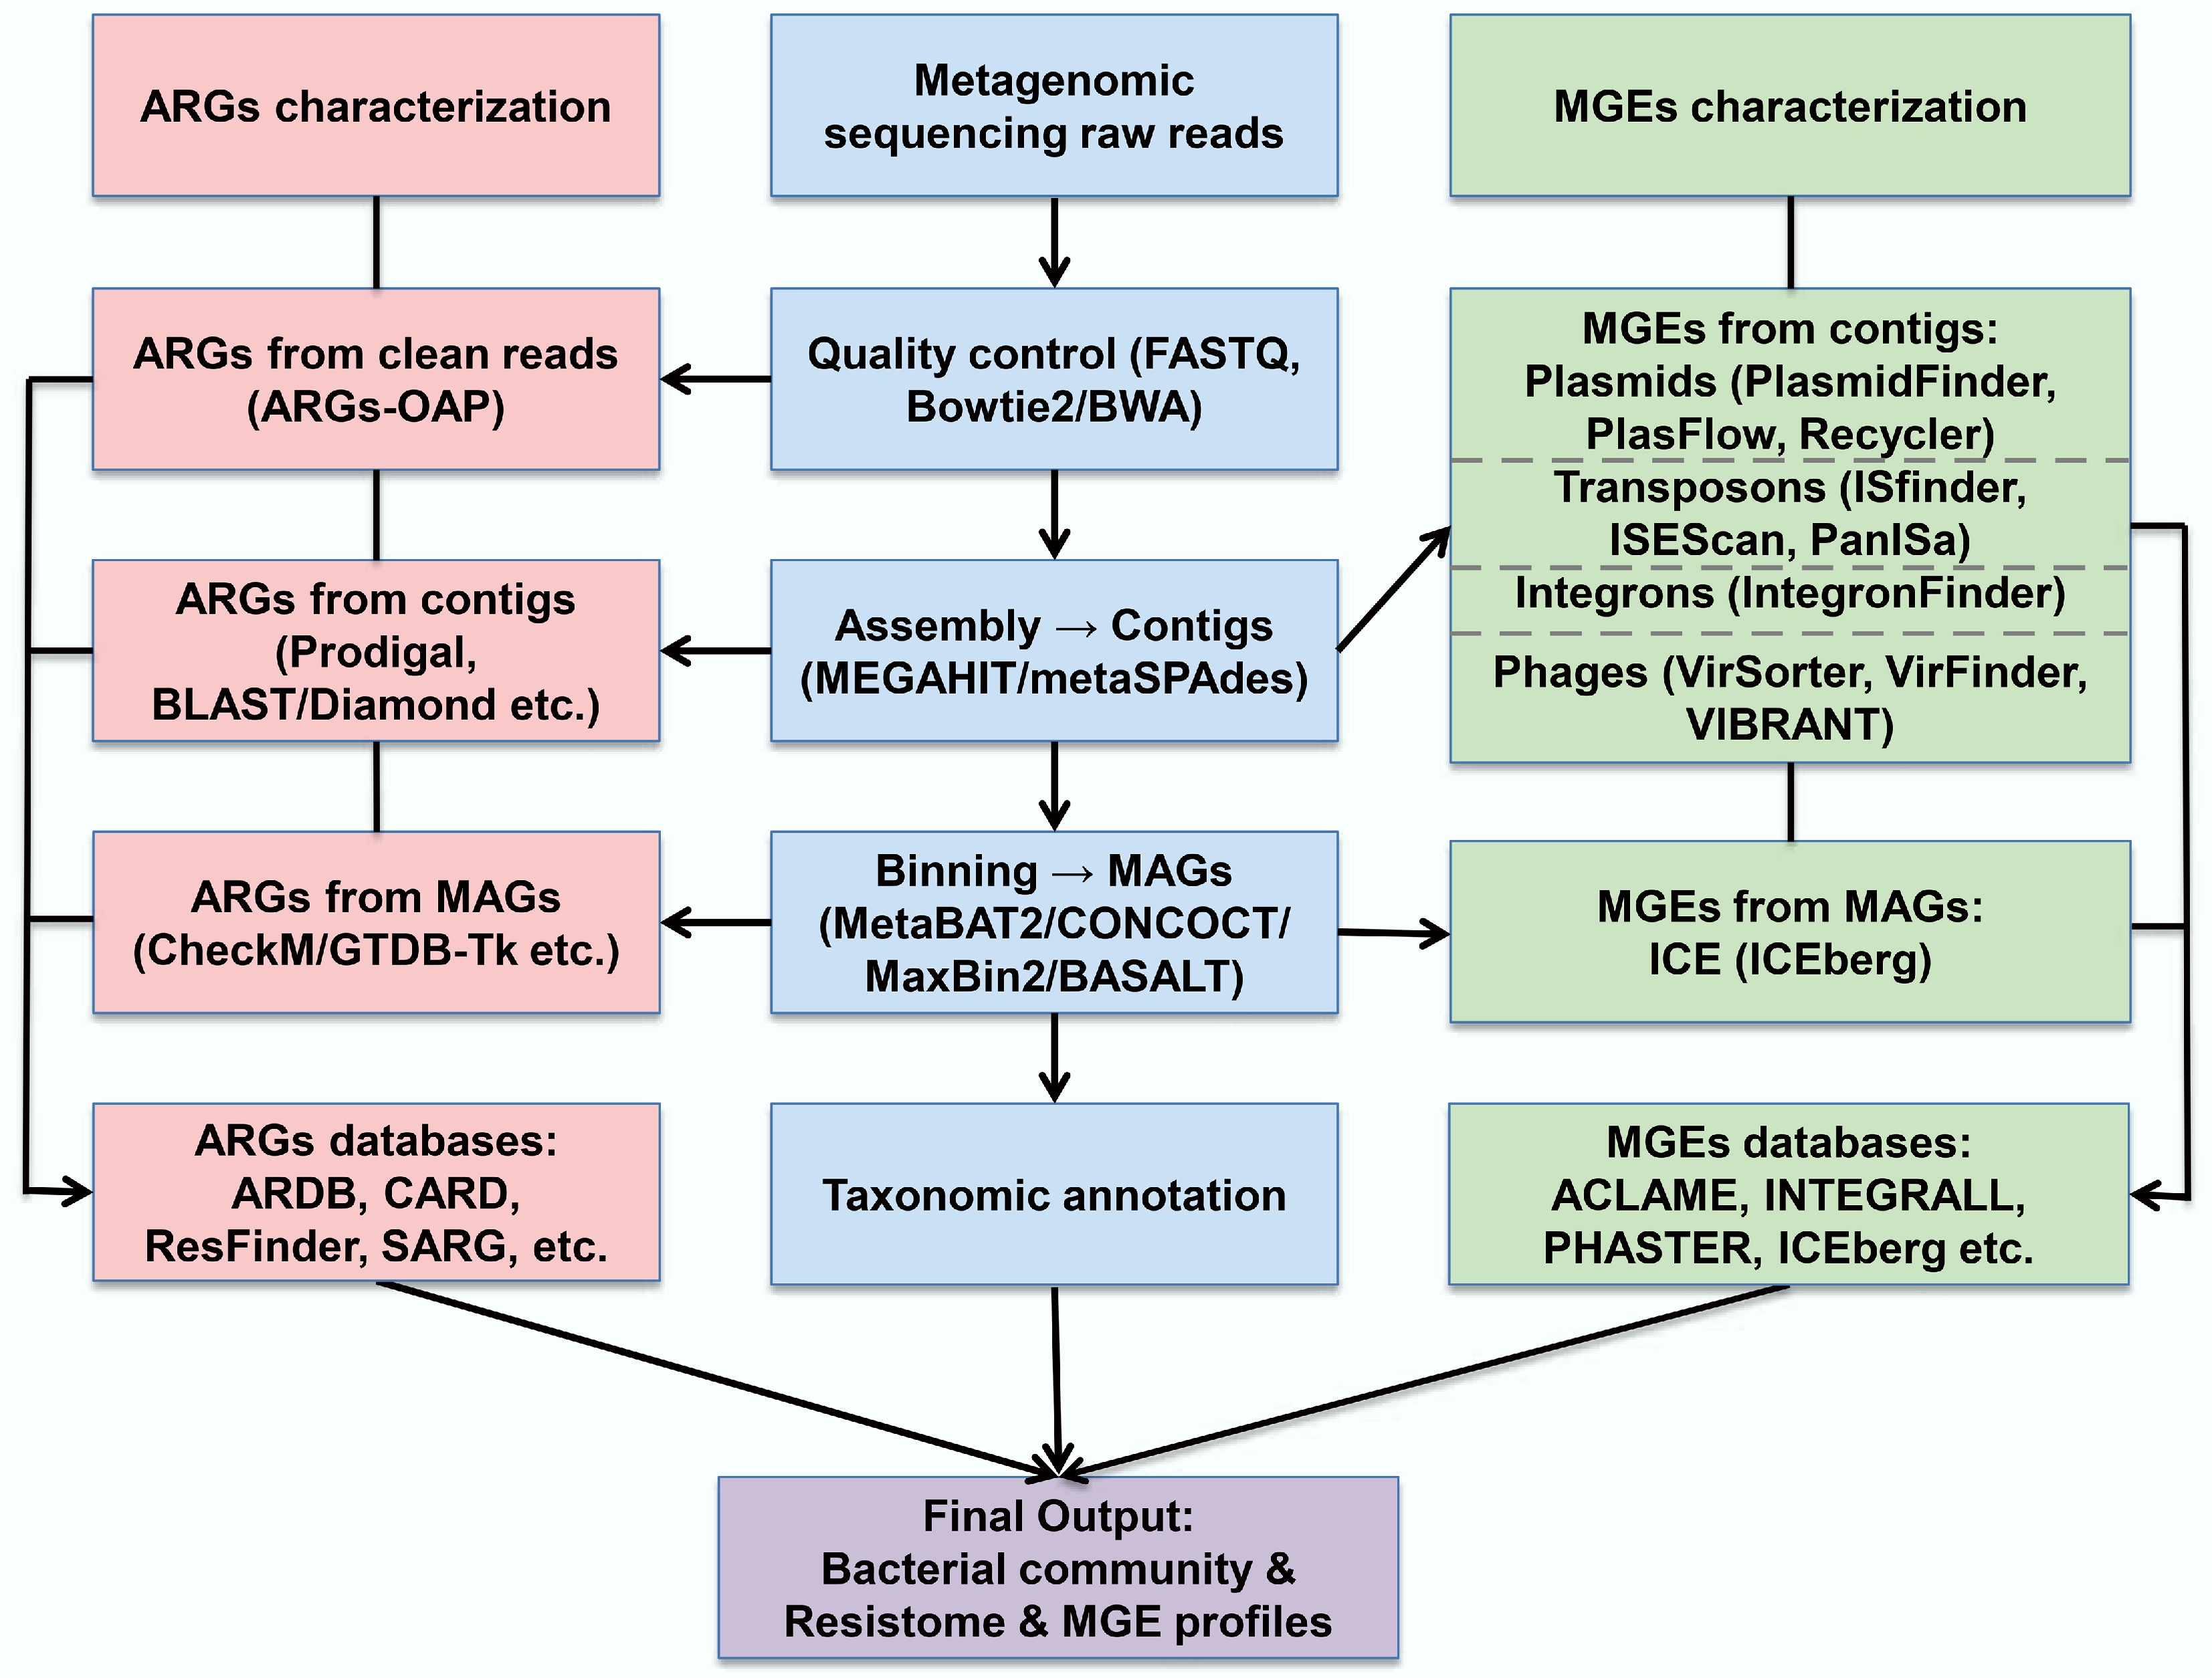
Figure 2.
Workflow for metagenomic-based identification of ARGs and MGEs.
-
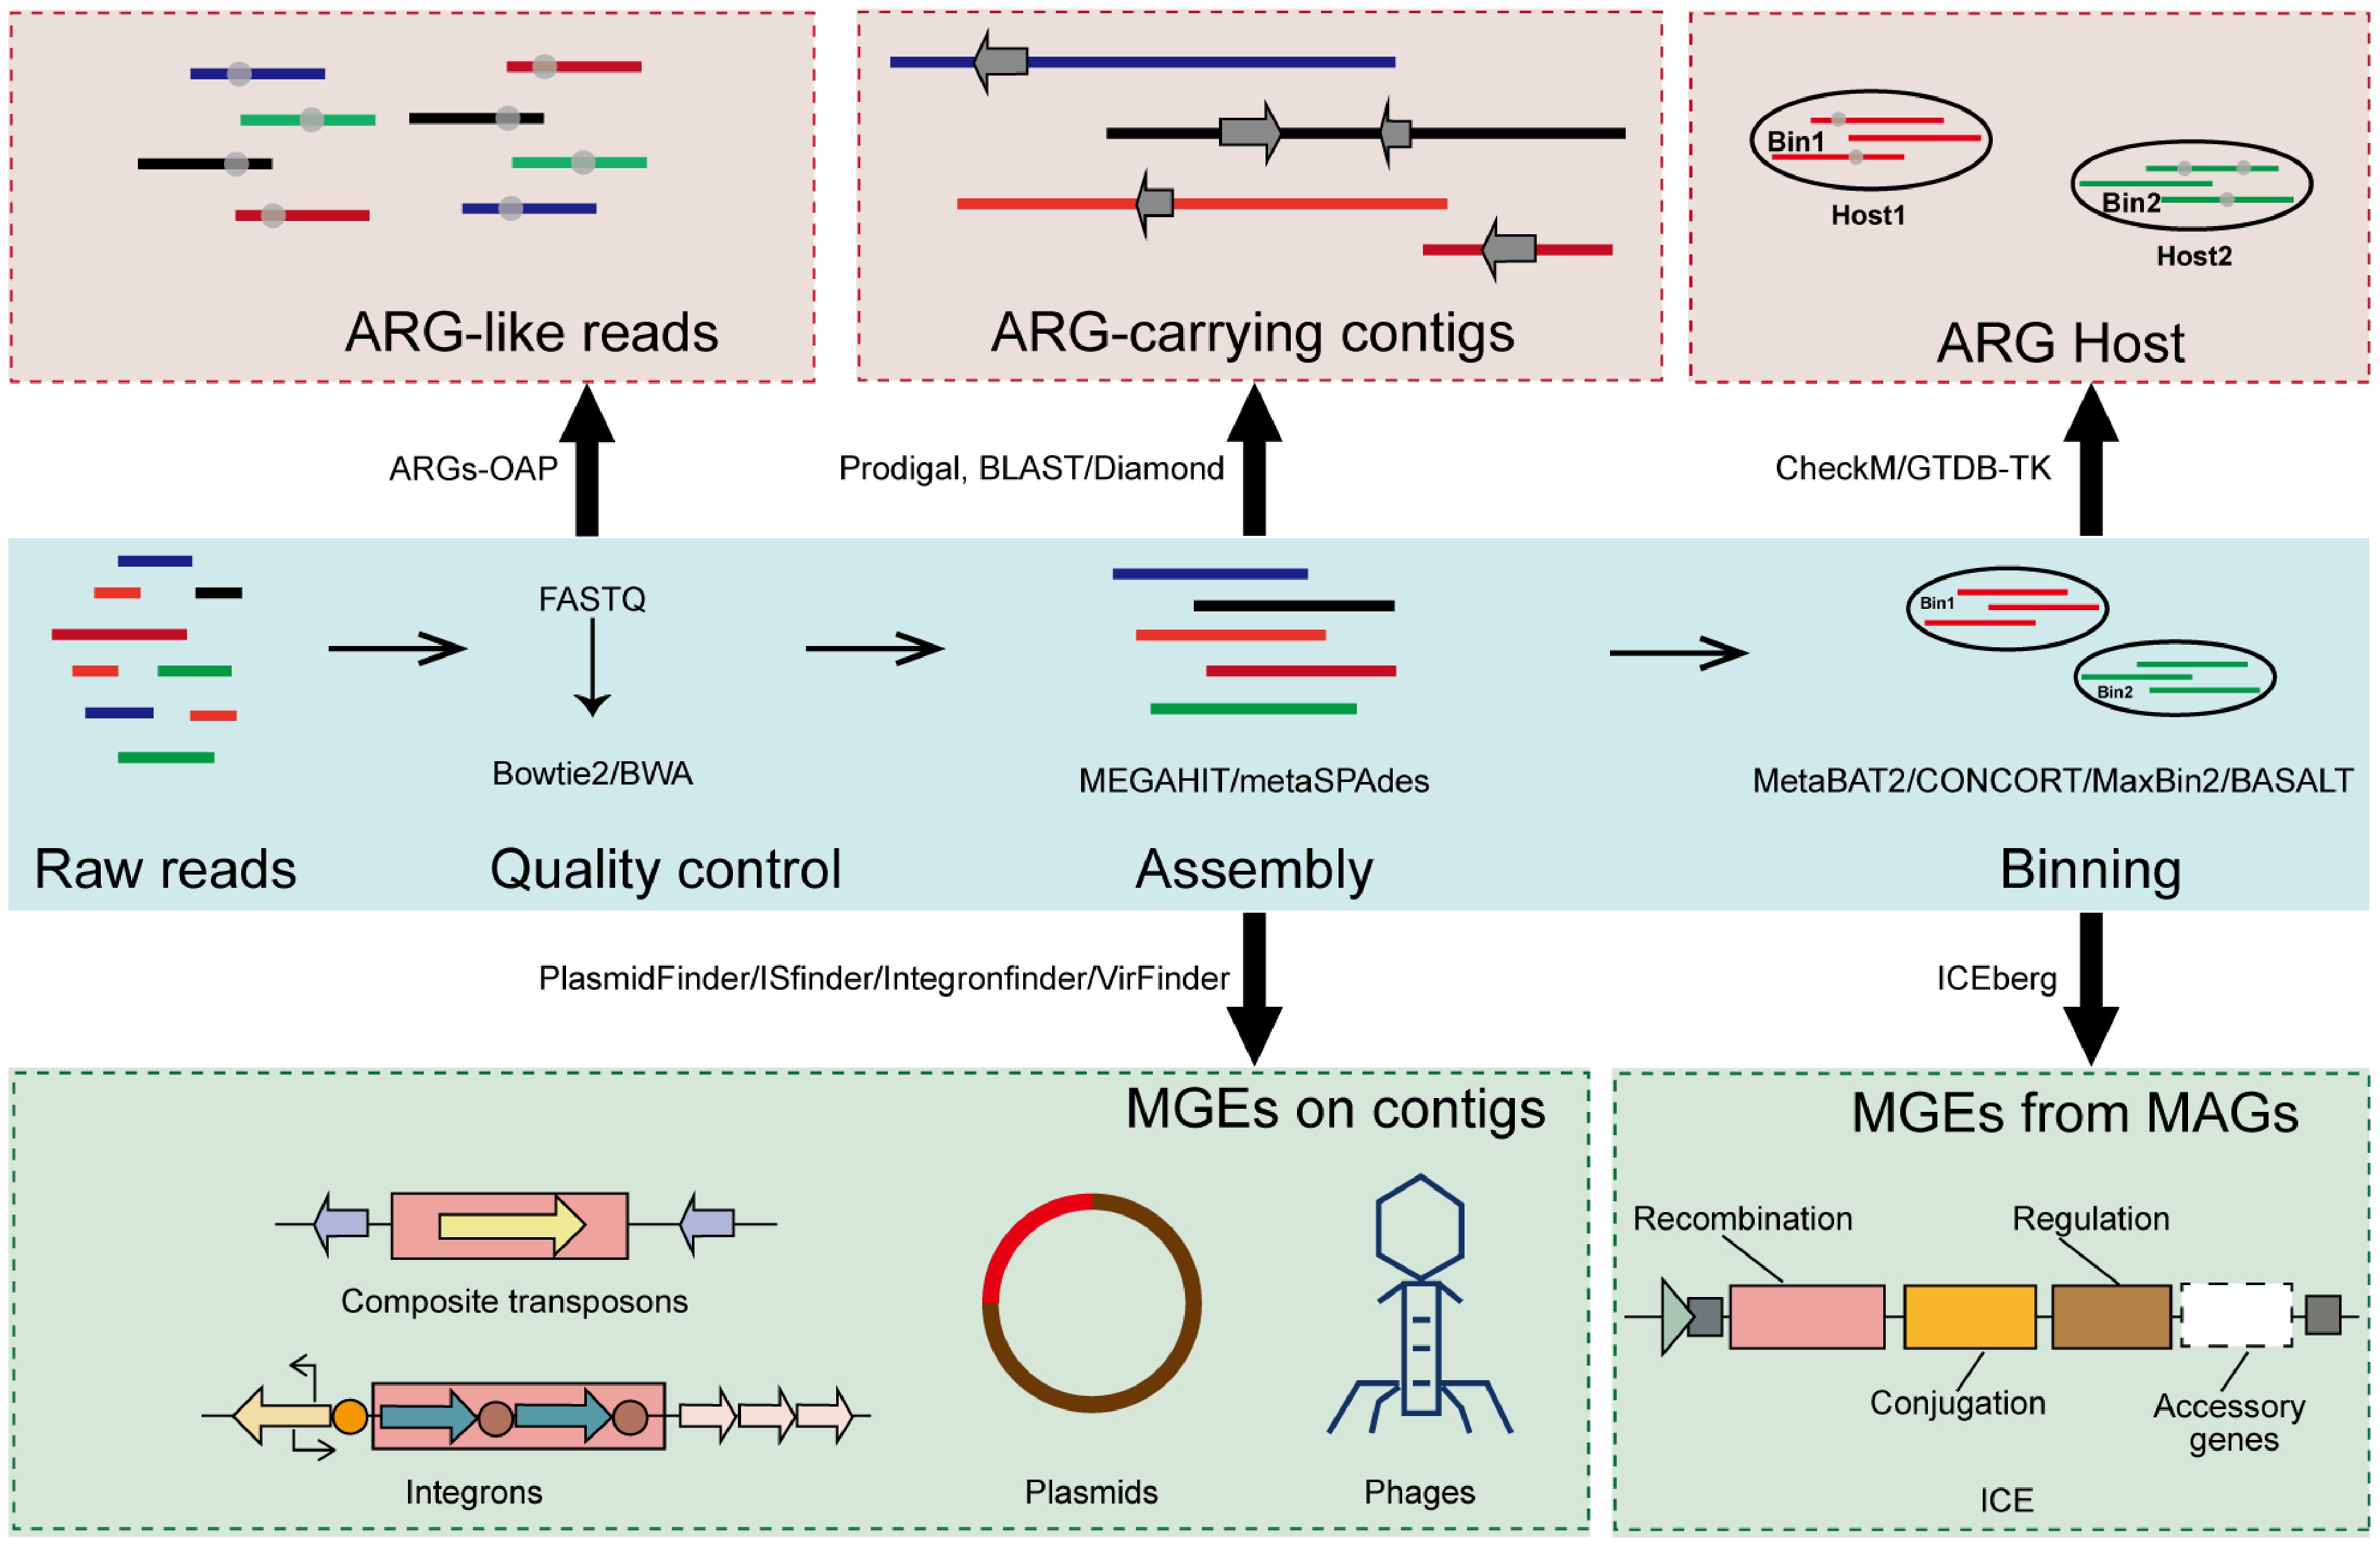
Figure 3.
Overview of the metagenomic pipeline for identifying ARGs and MGEs.
-
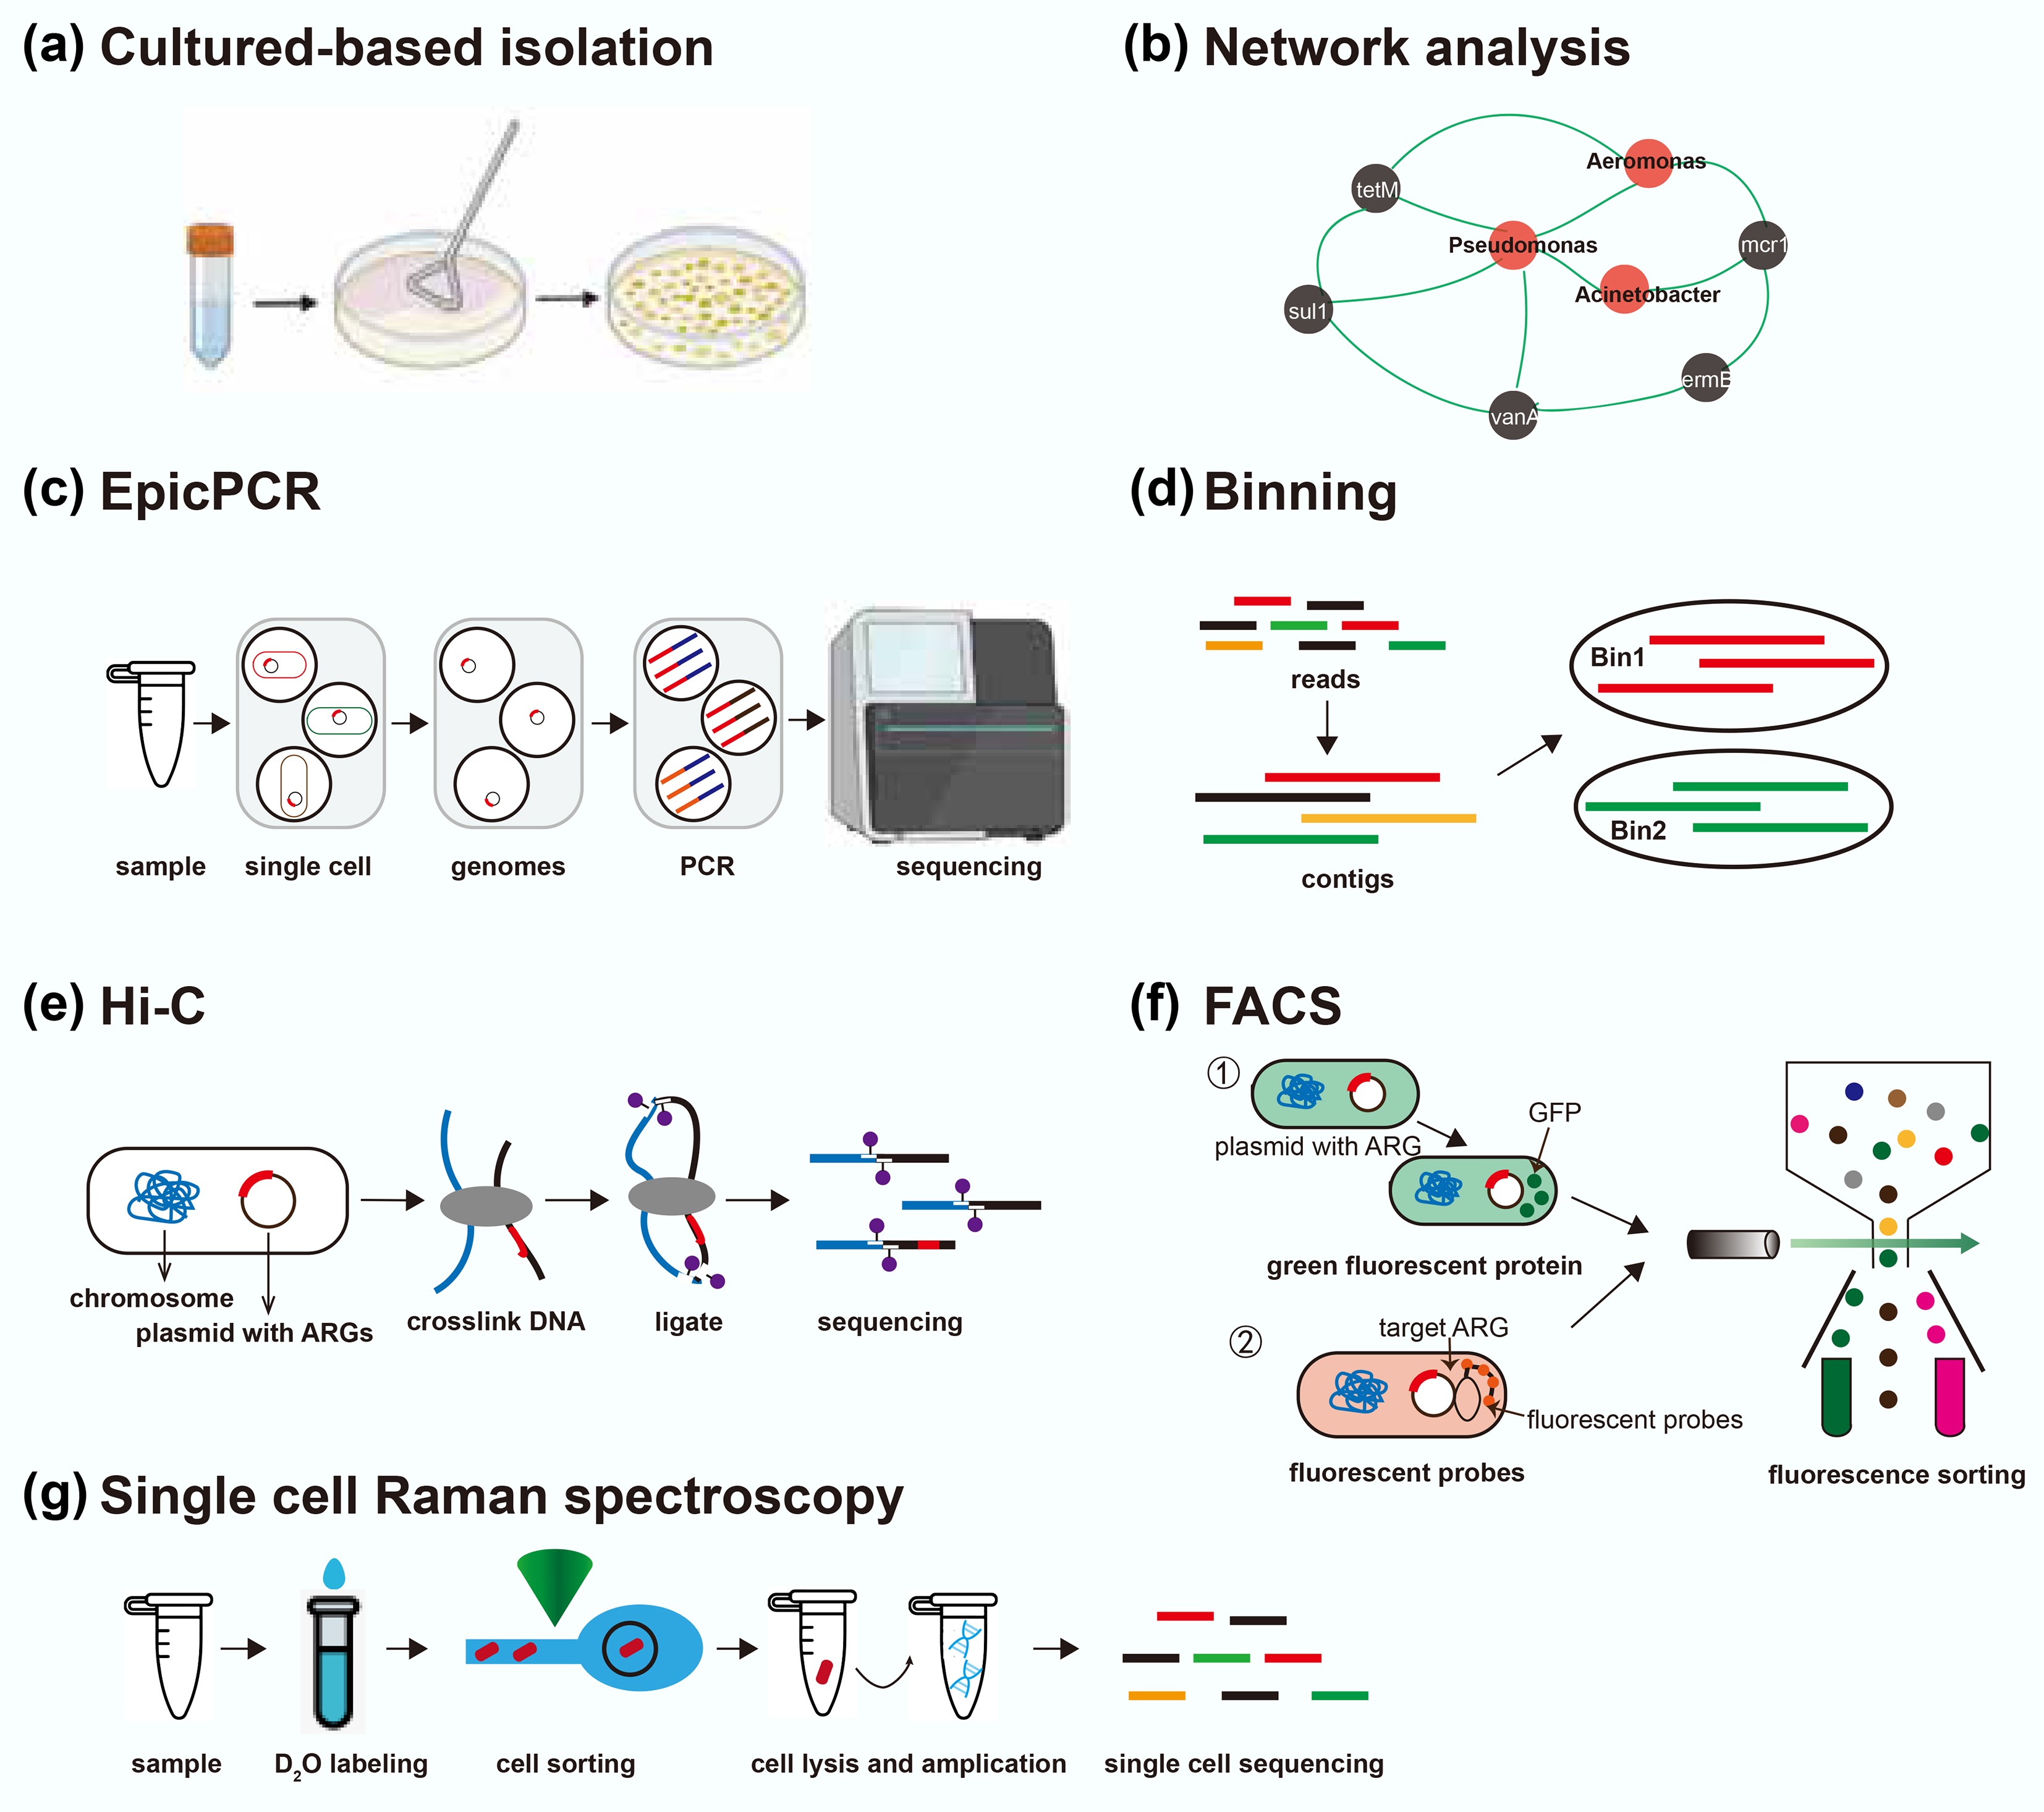
Figure 4.
Overview of current approaches for identifying hosts of ARGs. EpicPCR refers to emulsion paired isolation and concatenation PCR; Hi-C refers to high-throughput chromosome conformation capture; FACS refers to fluorescence-activated cell sorting. This figure is modified from Rice et al.[87].
-
-
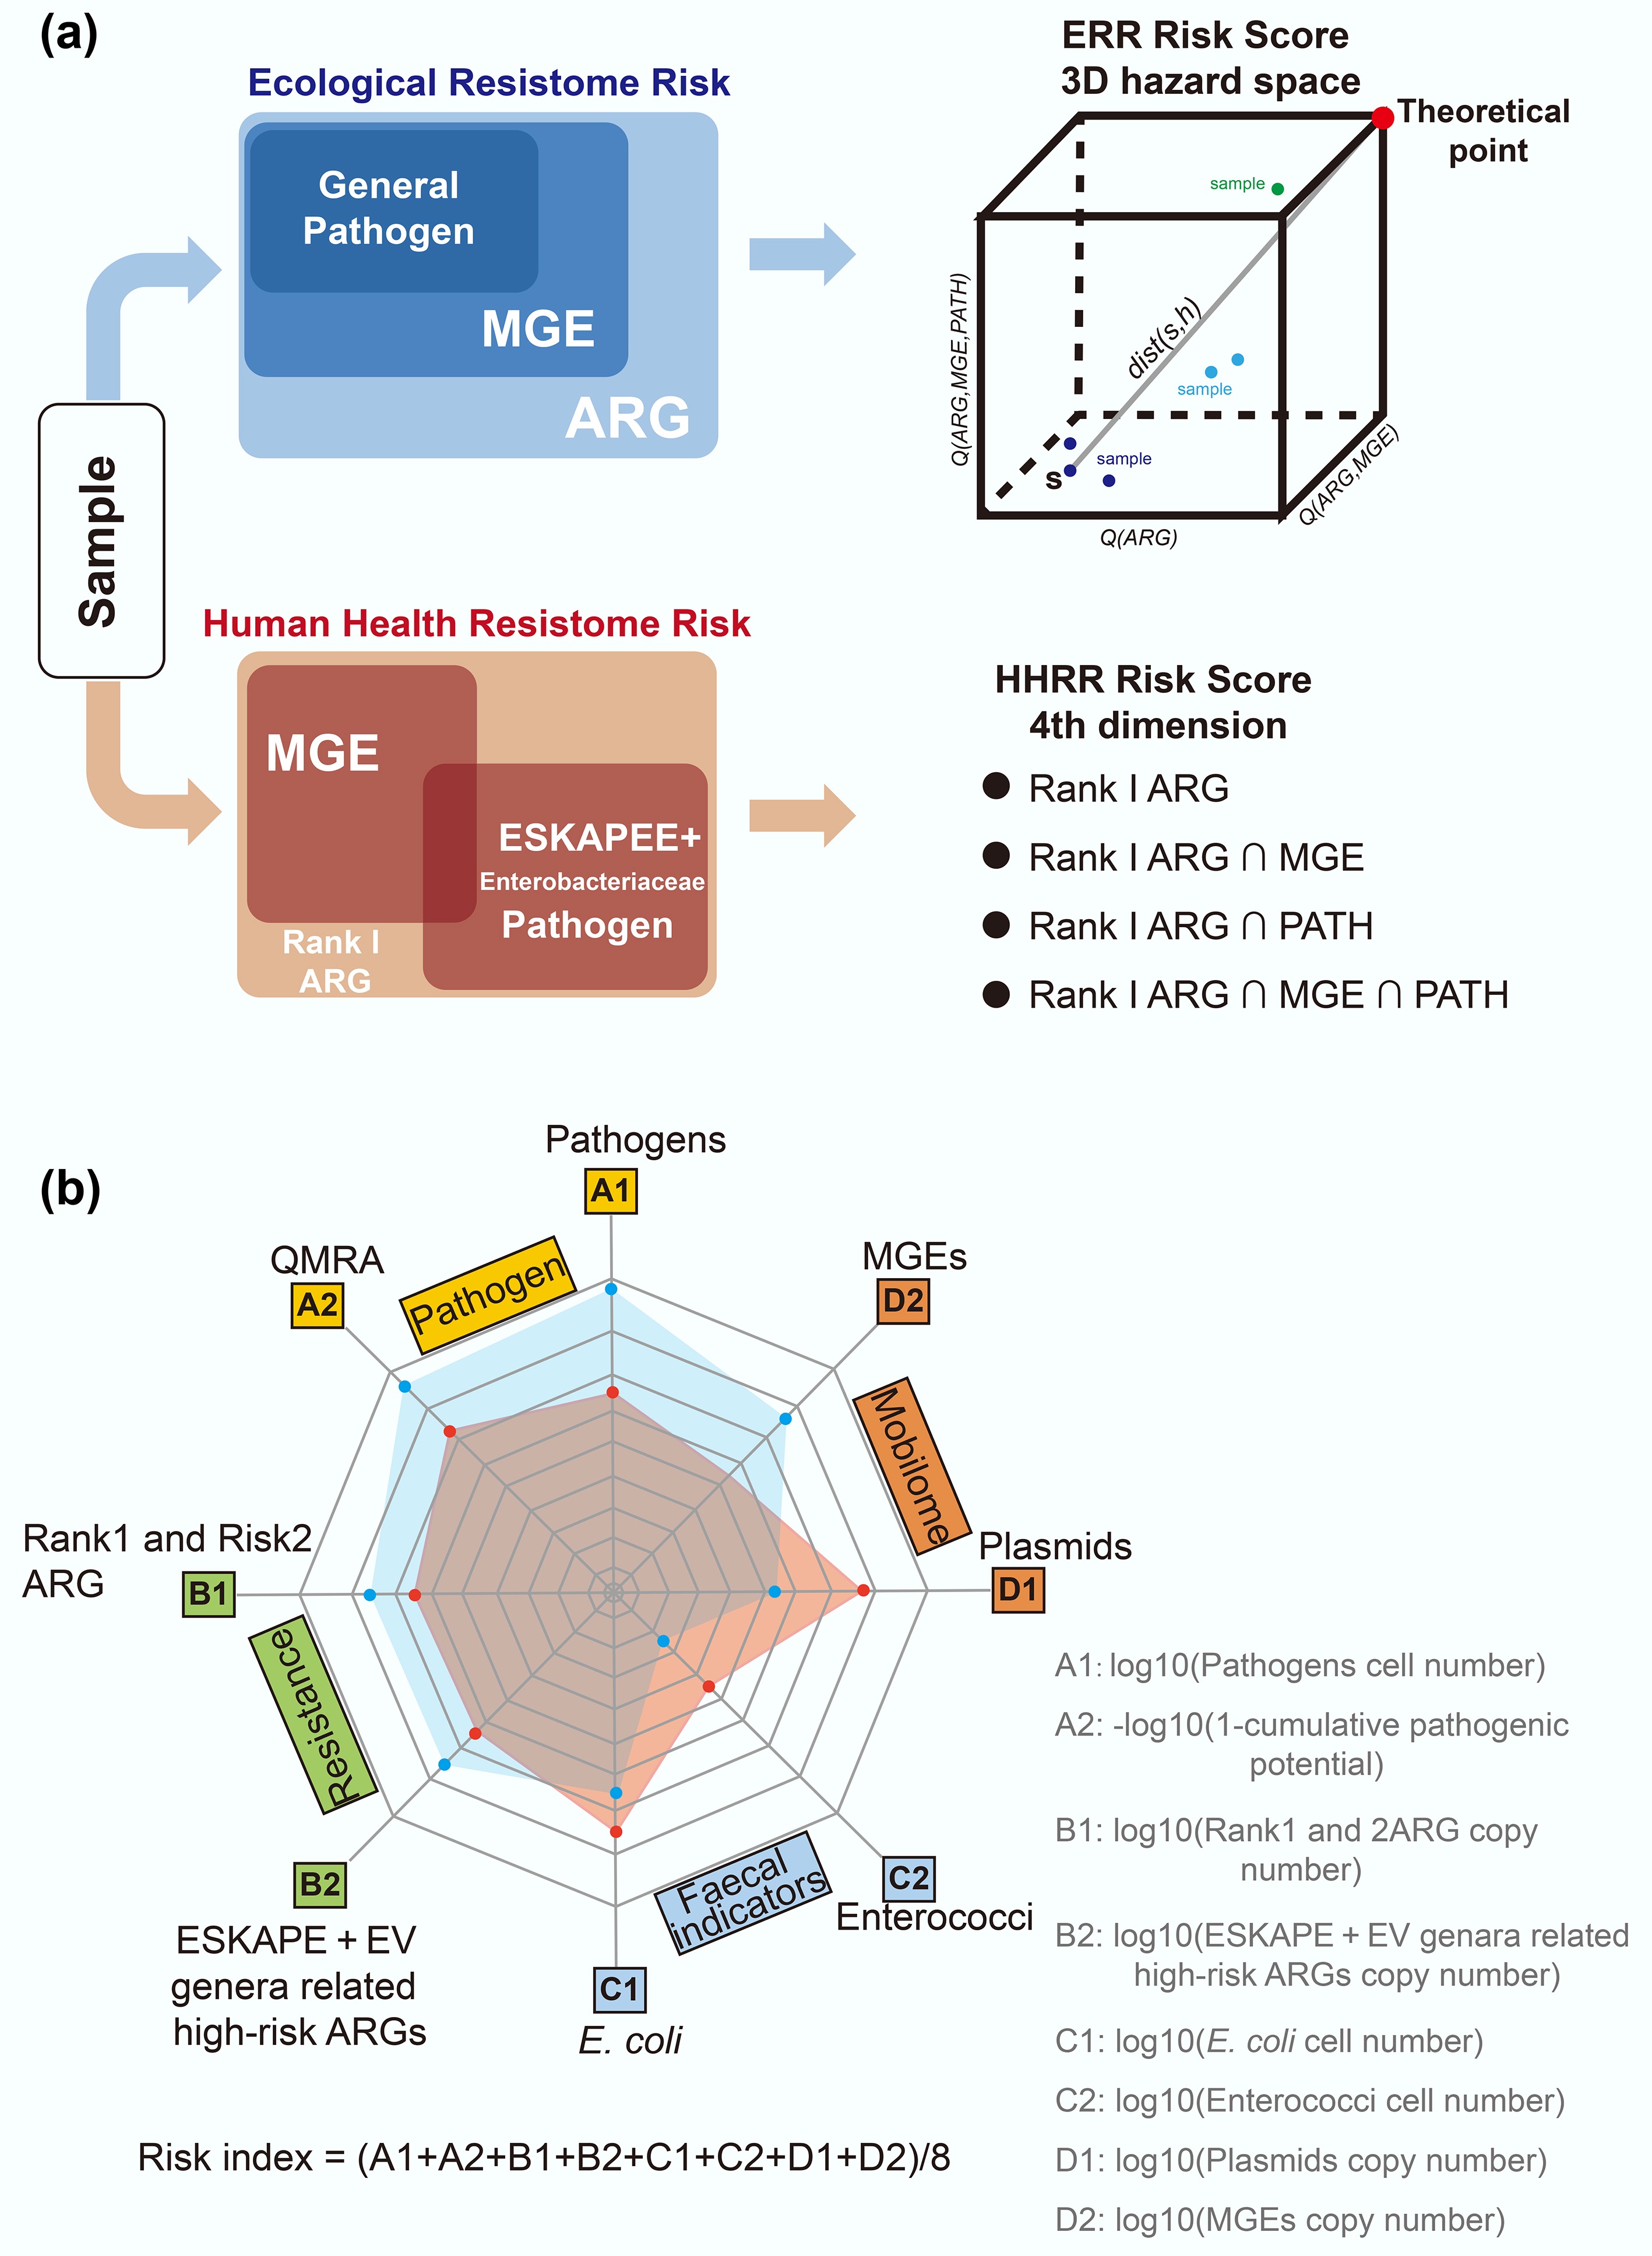
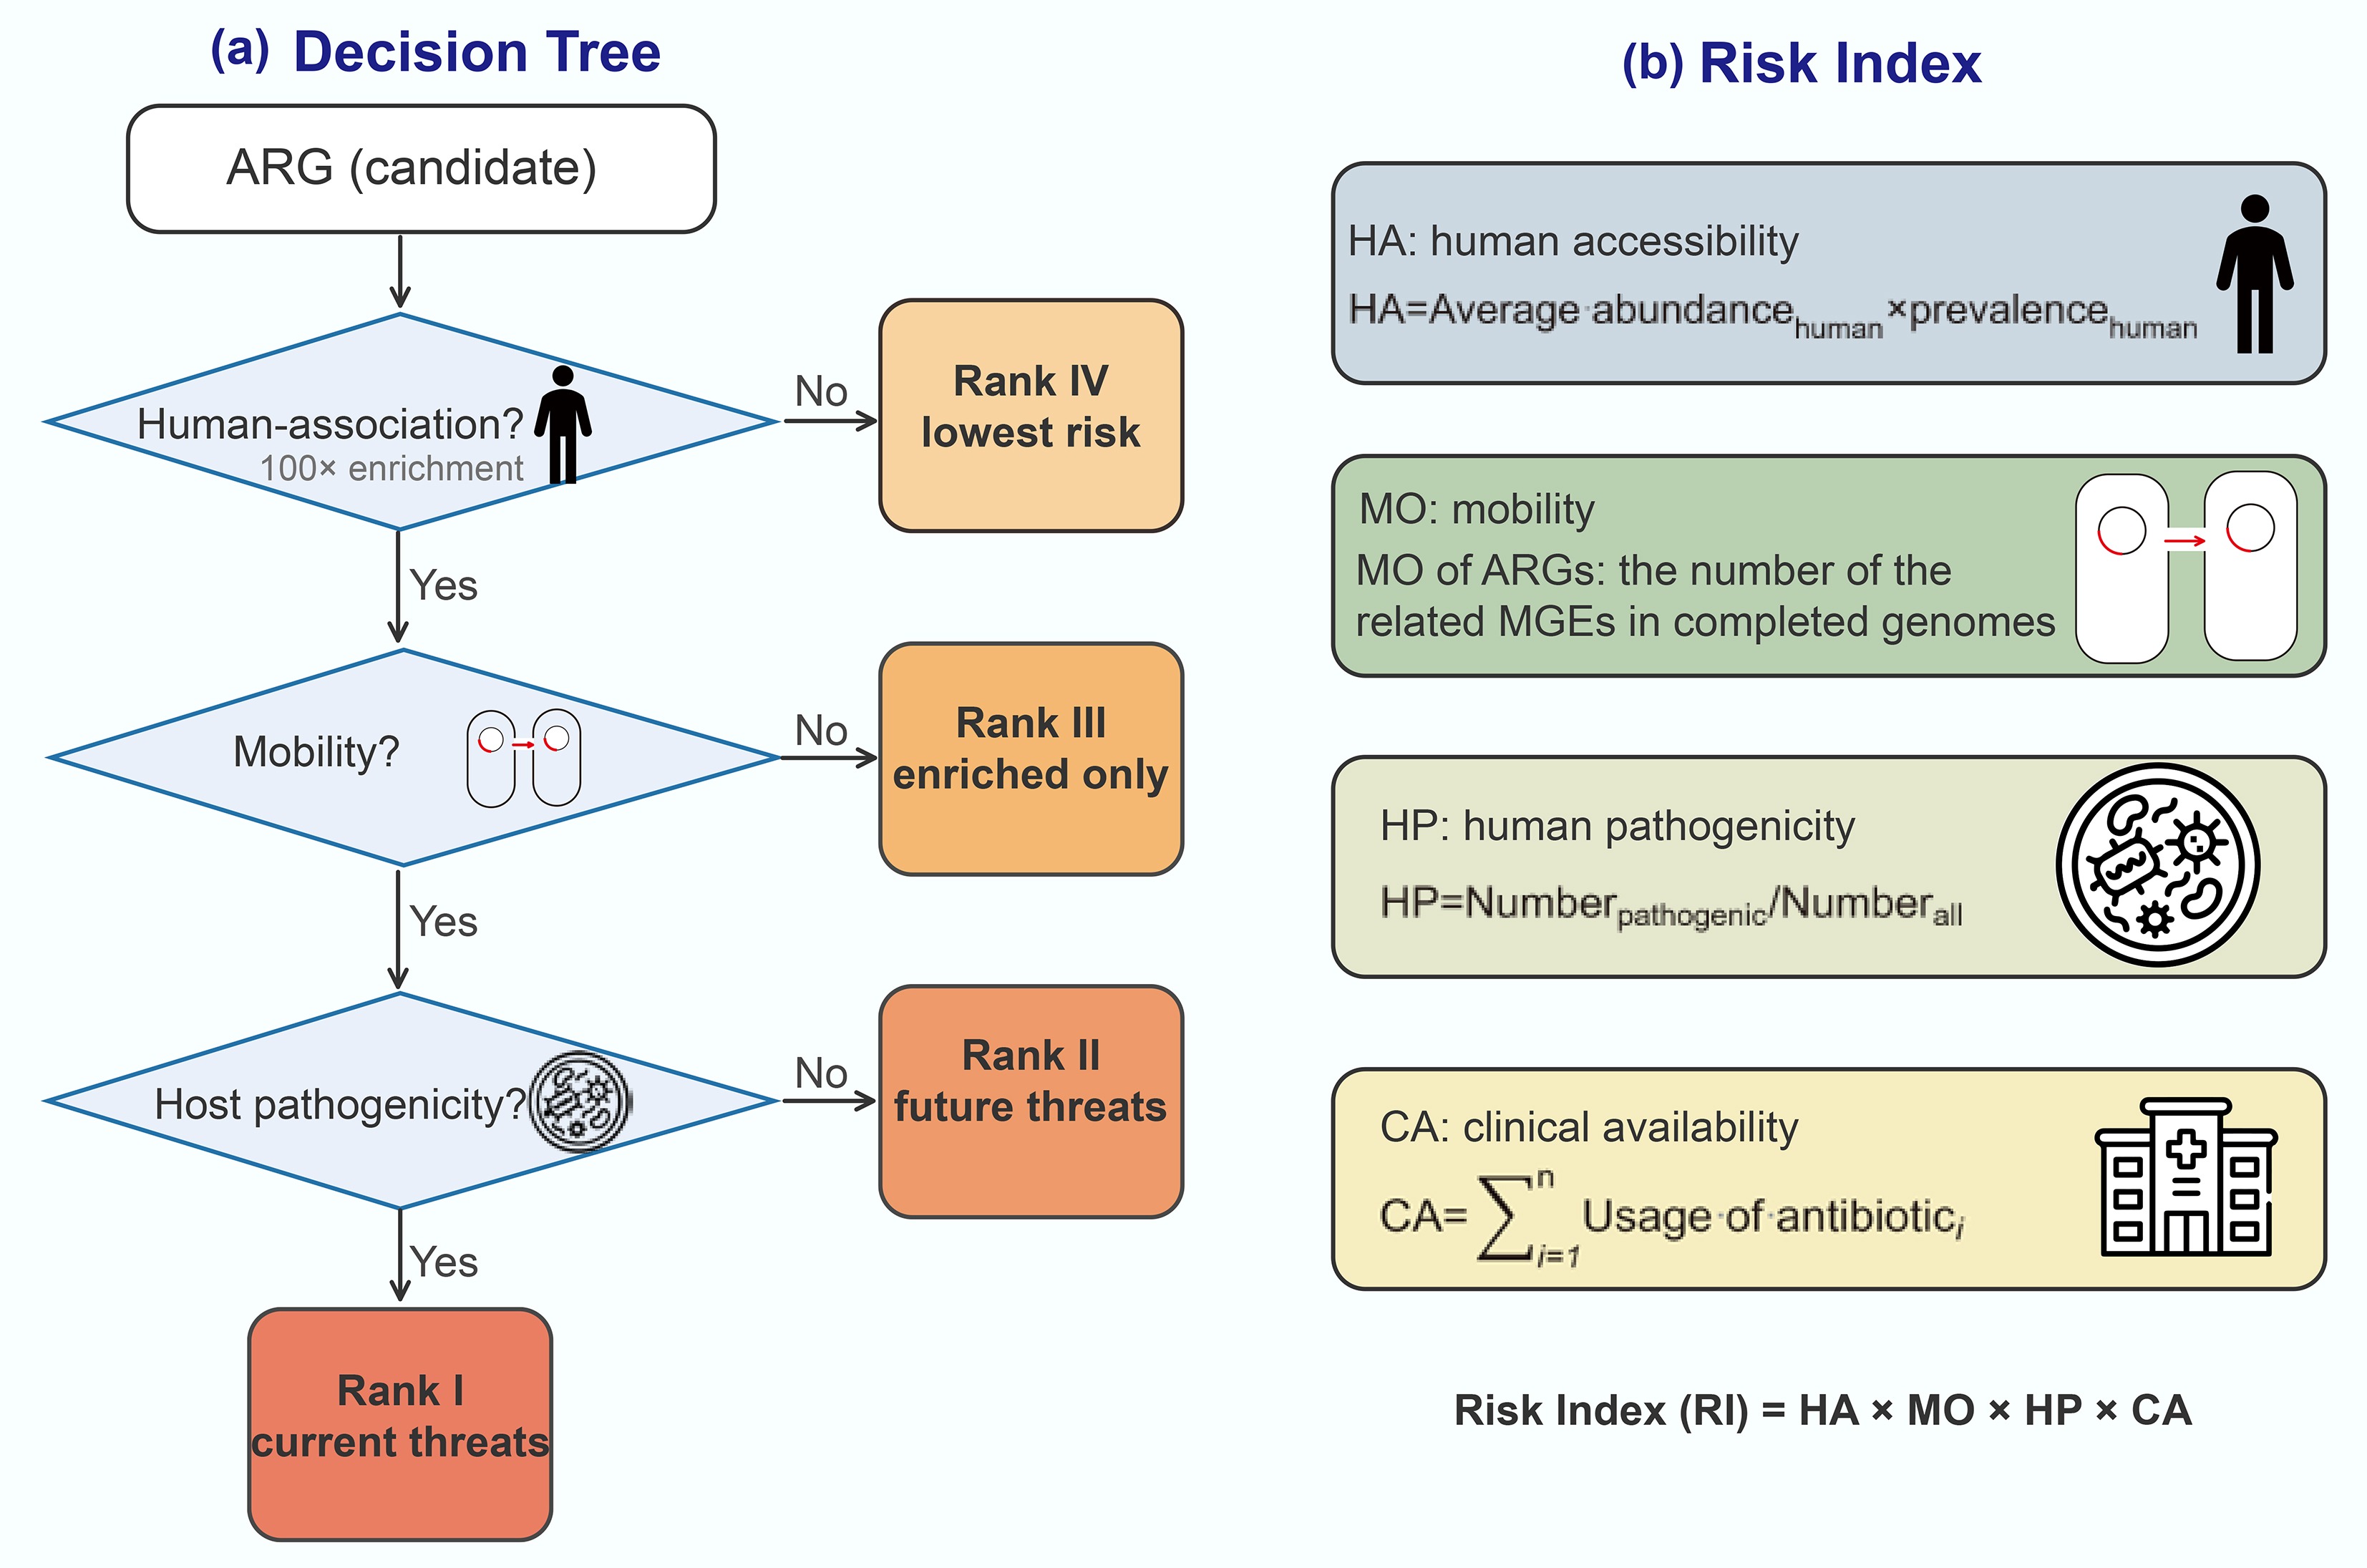
Figure 6.
Sample risk assessment framework. (a) Risk score assessment workflow based on MetaCompare 2.0[101]. (b) The risk assessment framework integrates four key components, including absolute quantification[70]. ARG refers to antibiotic resistance gene; MGE refers to mobile genetic element, PATH refers to pathogen; ESKAPE refers to Enterococcus faecium, Staphylococcus aureus, Klebsiella pneumoniae, Acinetobacter baumannii, Pseudomonas aeruginosa, and Enterobacter species; EV refers to Escherichia coli and Vibrio.
-
Sequencing Technology Platform Read length Bias PCR-free Real-time sequencing Base modification detection Accuracy Cost Second generation Illumina ~150 to 300 bp PCR-related bias No No No > 99.9% Low DNBSEQ ~150 to 300 bp PCR-related bias No No No > 99.9% Low Third generation PacBio SMRT Tens of kb Low bias due to single-molecule sequencing Yes No Yes > 99.9% High ONT Nanopore Tens of kb Signal fluctuations Yes Yes Yes > 99.75% High Table 1.
Comparison of commonly used sequencing platforms
-
Method Principle Advantages Limitations Culture-based isolation Selective cultivation of resistant bacteria on antibiotic-containing media High specificity; linking genotype to phenotype; preservation of native genomic and mobile context Most bacteria unculturable; labor-intensive, and biased toward fast-growing strains Network analysis Statistical correlation of ARG abundance with microbial taxa abundance across samples Culture-independent; predicting large-scale candidate associations Indirect; spurious correlations;
low-abundance taxa introduce noise; no physical linkageEpicPCR Droplet encapsulation of single cells; fusion PCR linking the ARG fragment with the 16S rRNA gene Culture-independent; direct gene-host linkage PCR bias; primer limitations; multi-cell droplets cause false positives; Binning Short reads are first assembled into contigs, which are then clustered into MAGs Culture-independent; providing genomic context; linking ARGs to host genomes ARG regions fragmentation; assembly bias; mis-binning; inability to link plasmids to host genomes Hi-C Cross-linking DNA in cells; proximity ligation yields read pairs linking contigs from the same cell Culture-independent; physical linkage capture; linking ARG-carrying plasmid to host genomes; no prior targeting Complex pretreatment; specialized bioinformatics; variable cross-linking efficiency; high sequencing-depth requirements FACS Flow cytometric sorting of fluorescently labeled bacteria Culture-independent; isolation of target cells with high purity; support for conjugation studies Requires fluorescent labeling; low throughput Single cell Raman spectroscopy Isotopic probing (D2O) identifies metabolically active ARB via Raman spectral shifts Culture-independent; label-free operation; identify active ARB Low throughput; low accessibility of single-cell Raman platforms EpicPCR refers to emulsion paired isolation and concatenation PCR; Hi-C refers to high-throughput chromosome conformation capture; FACS refers to fluorescence-activated cell sorting. Table 2.
Comparison of primary methods for identifying the hosts of ARGs and MGEs
Figures
(6)
Tables
(2)