-
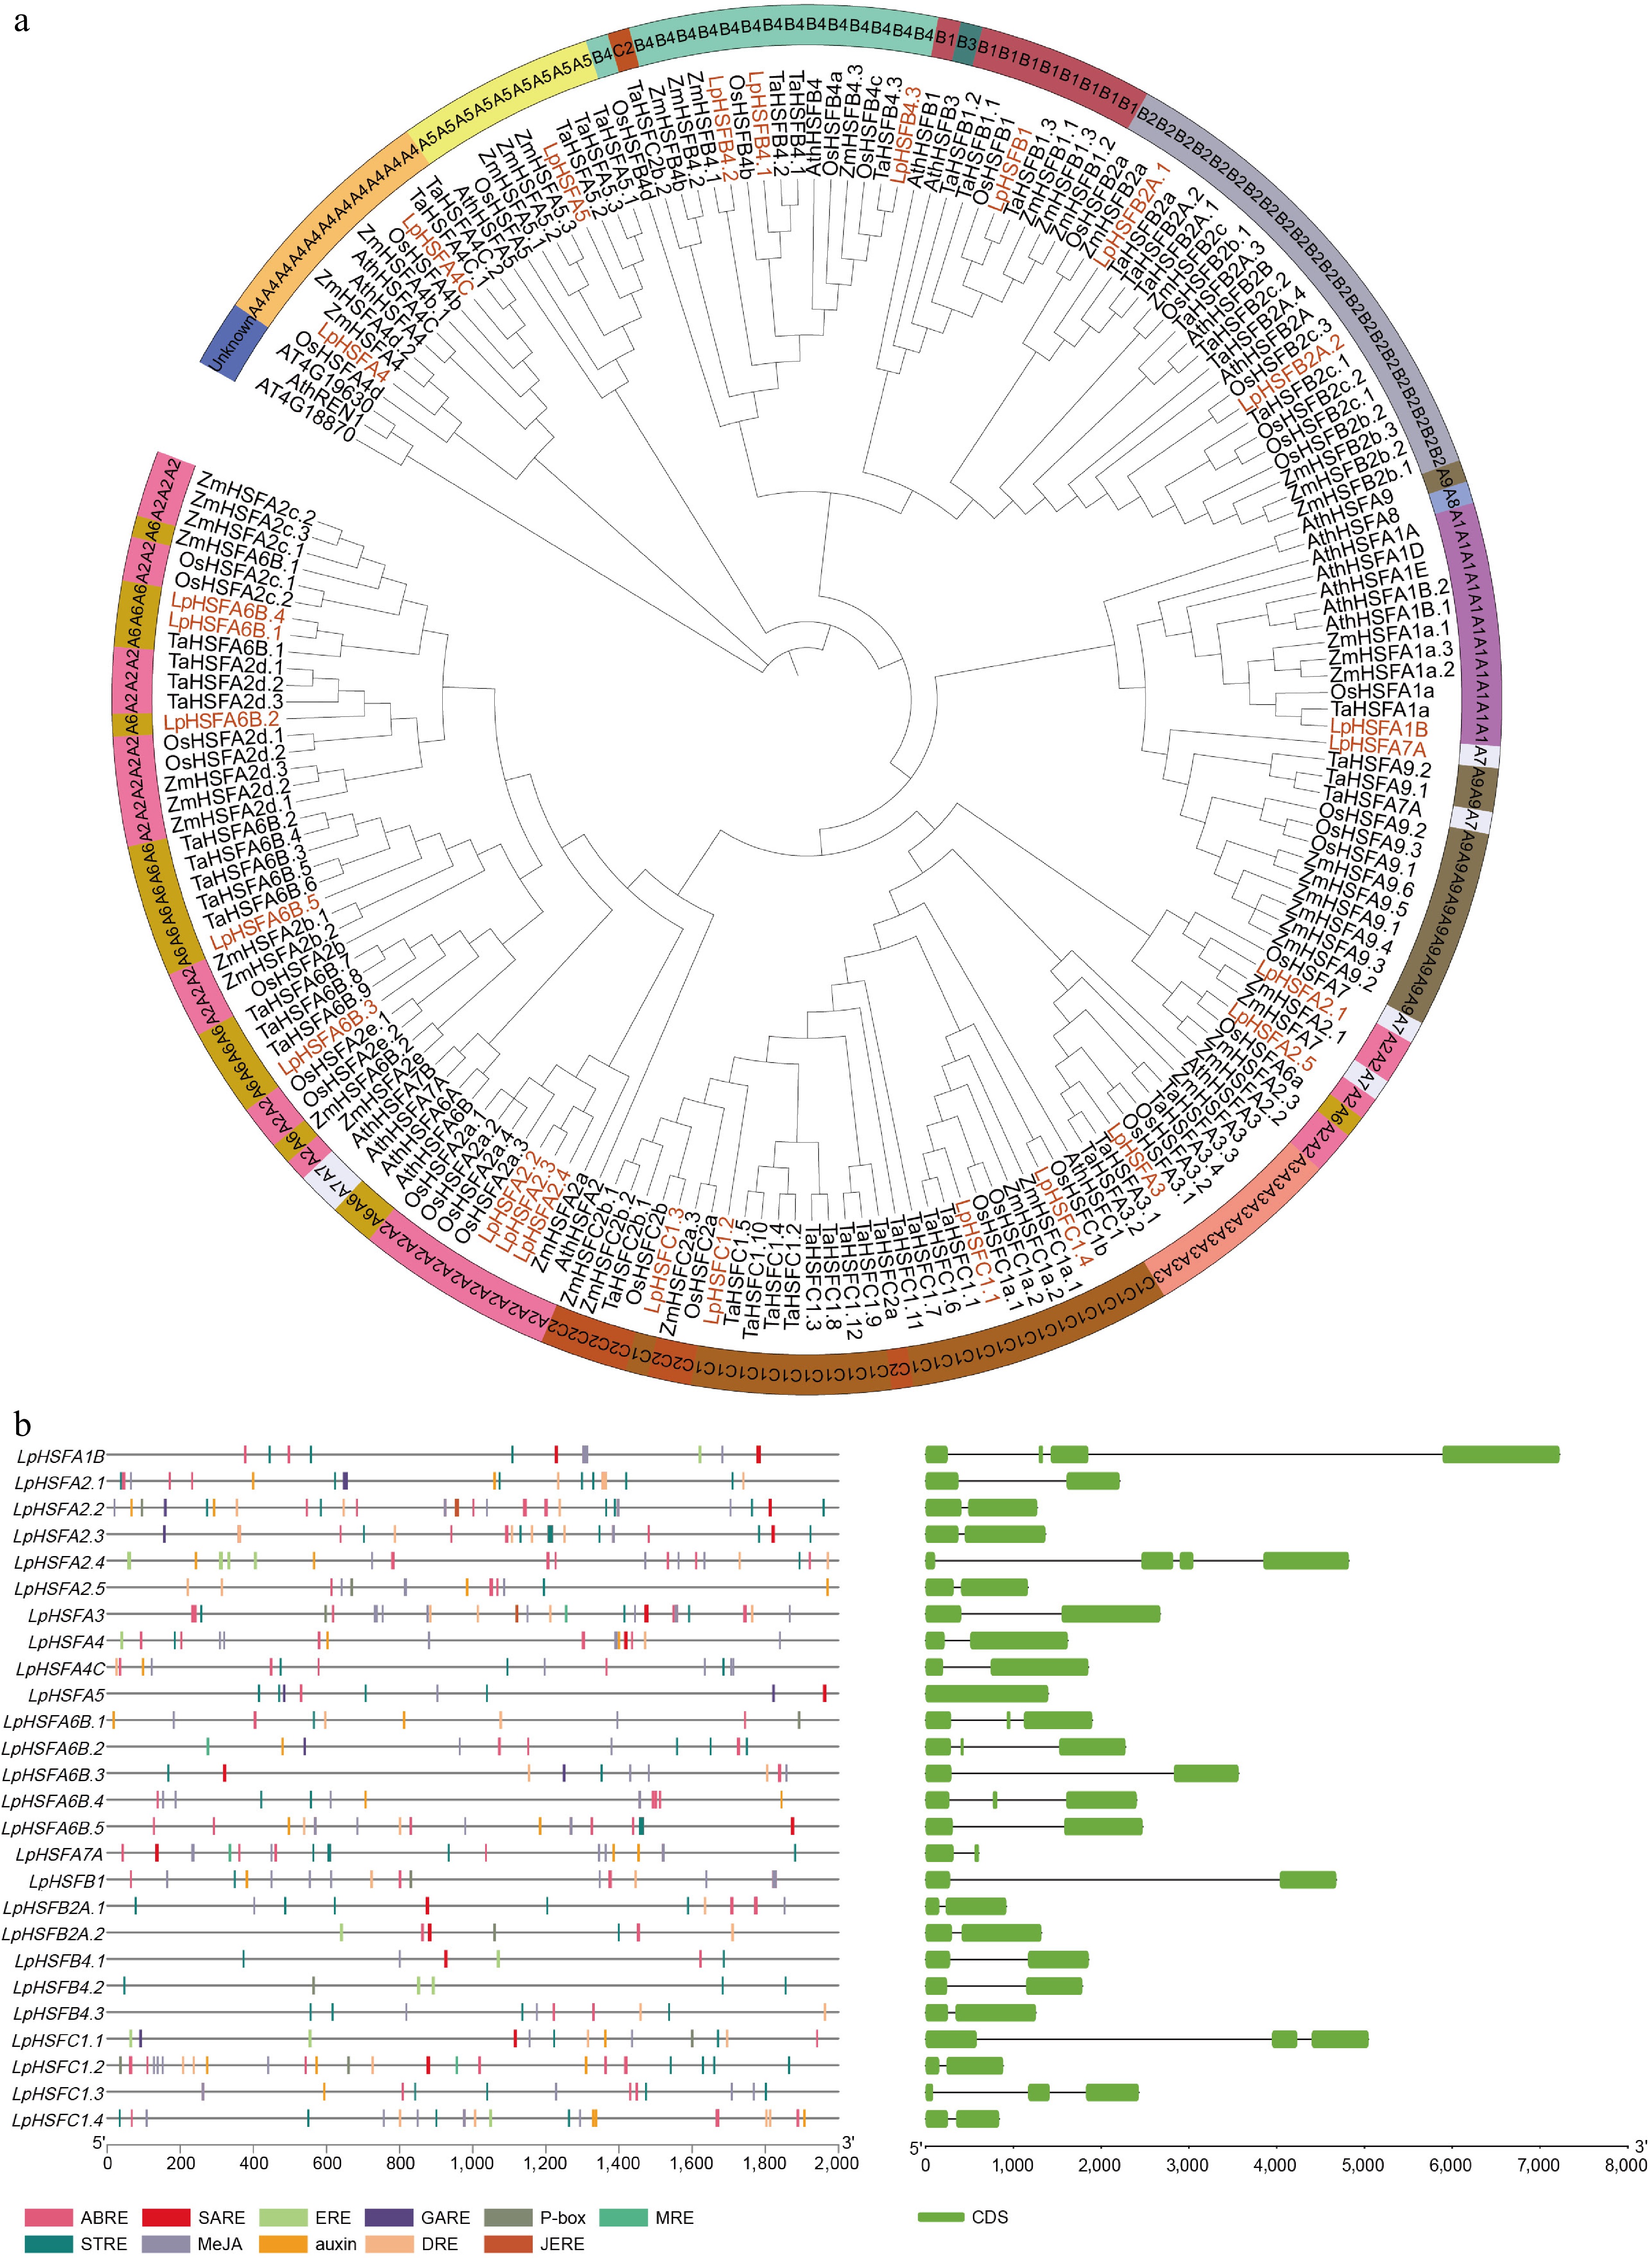
Figure 1.
(a) Unrooted phylogenetic tree representing relationships among the HSF proteins of Lolium perenne, Oryza sativa, Triticum aestivum, Zea mays, and Arabidopsis thaliana. The genes in Lolium perenne are marked in orange, while those in Oryza sativa, Triticum aestivum, Zea mays, and Arabidopsis thaliana are marked in black. For the identification of subgroup A, the following color scheme was applied: A1 (mediumorchid), A2 (hotpink), A3 (lightsalmon), A4 (lightorange), A5 (khaki), A6 (goldenrod), A7 (aliceblue), A8 (skyblue), and A9 (olivedrab). In subgroup B, B1, B2, B3, and B4 were assigned the colors indianred, bluegray, slategray, and aquamarine, respectively. Within subgroup C, C1 was colored dark_goldenrod, and C2 was designated chocolate. Non-grouped members were uniformly colored slate_blue. (b) The cis-acting elements of the LpHSFs promoter region from perennial ryegrass, and gene structures of LpHSFs from perennial ryegrass in which the exons region is indicated by green boxes.
-
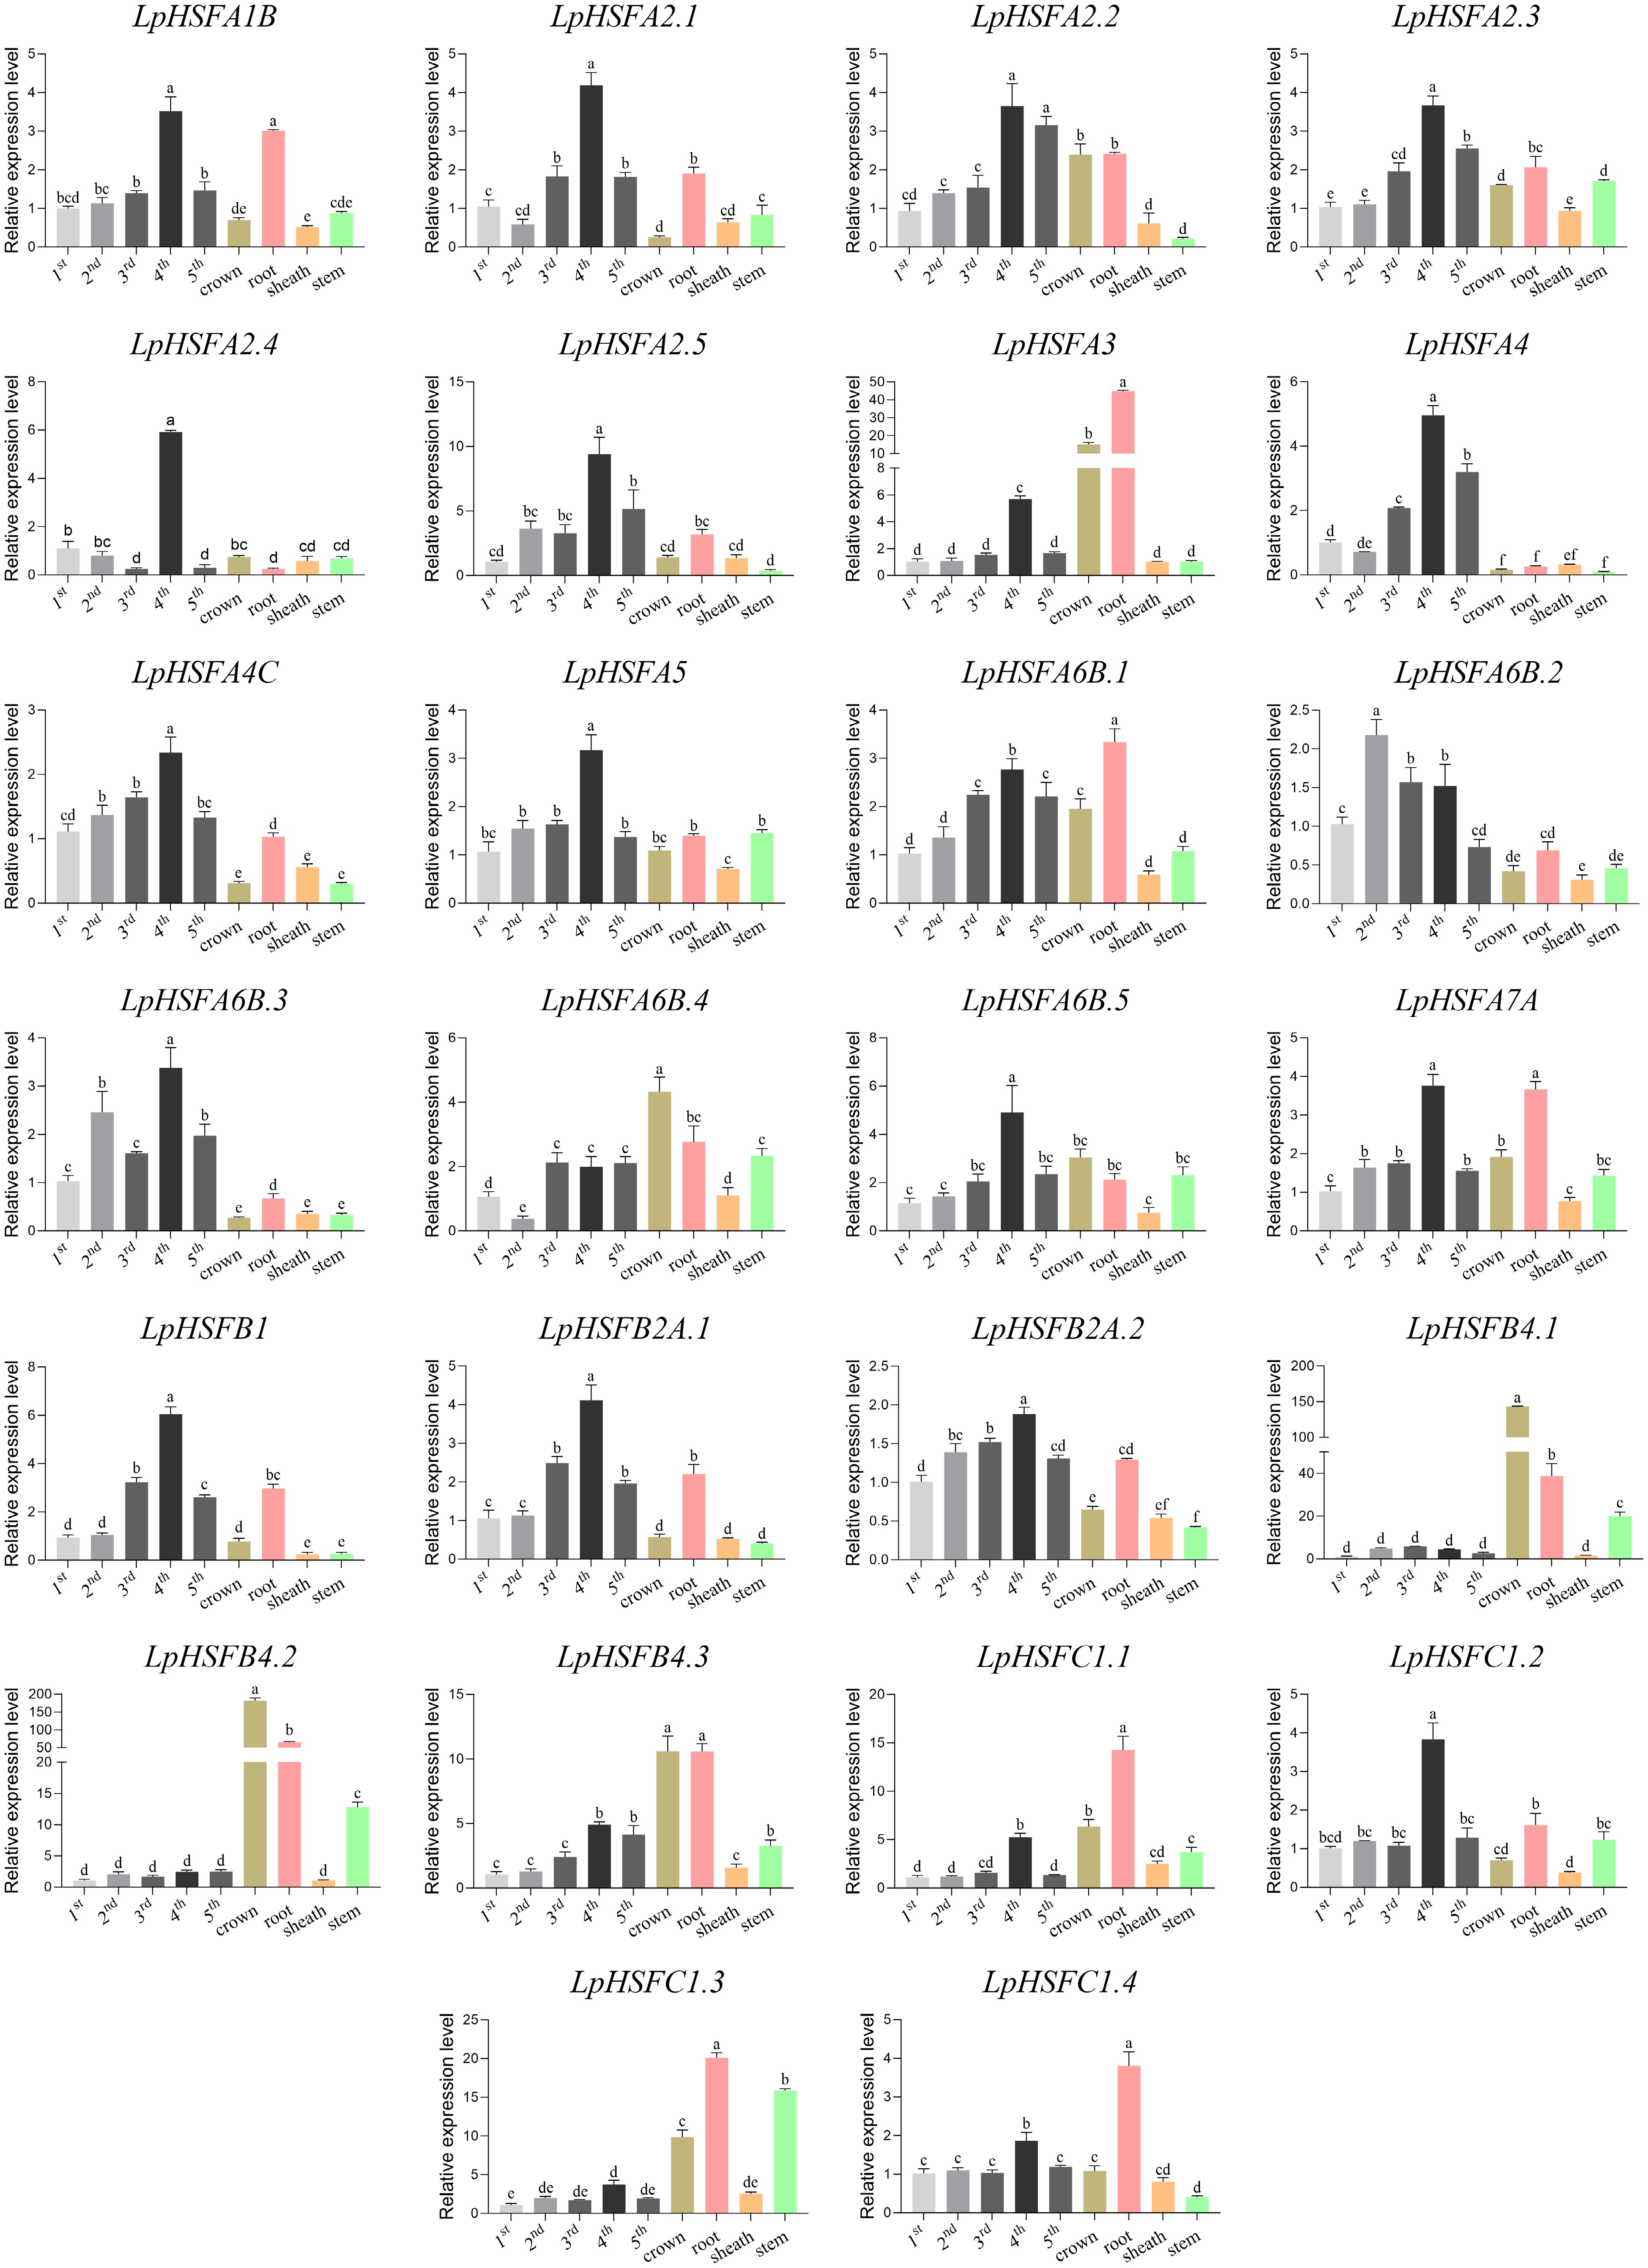
Figure 2.
Expression patterns of LpHSF in different tissues. The statistical significance was determined using Fisher's protected least significant difference (LSD) test (p < 0.05).
-
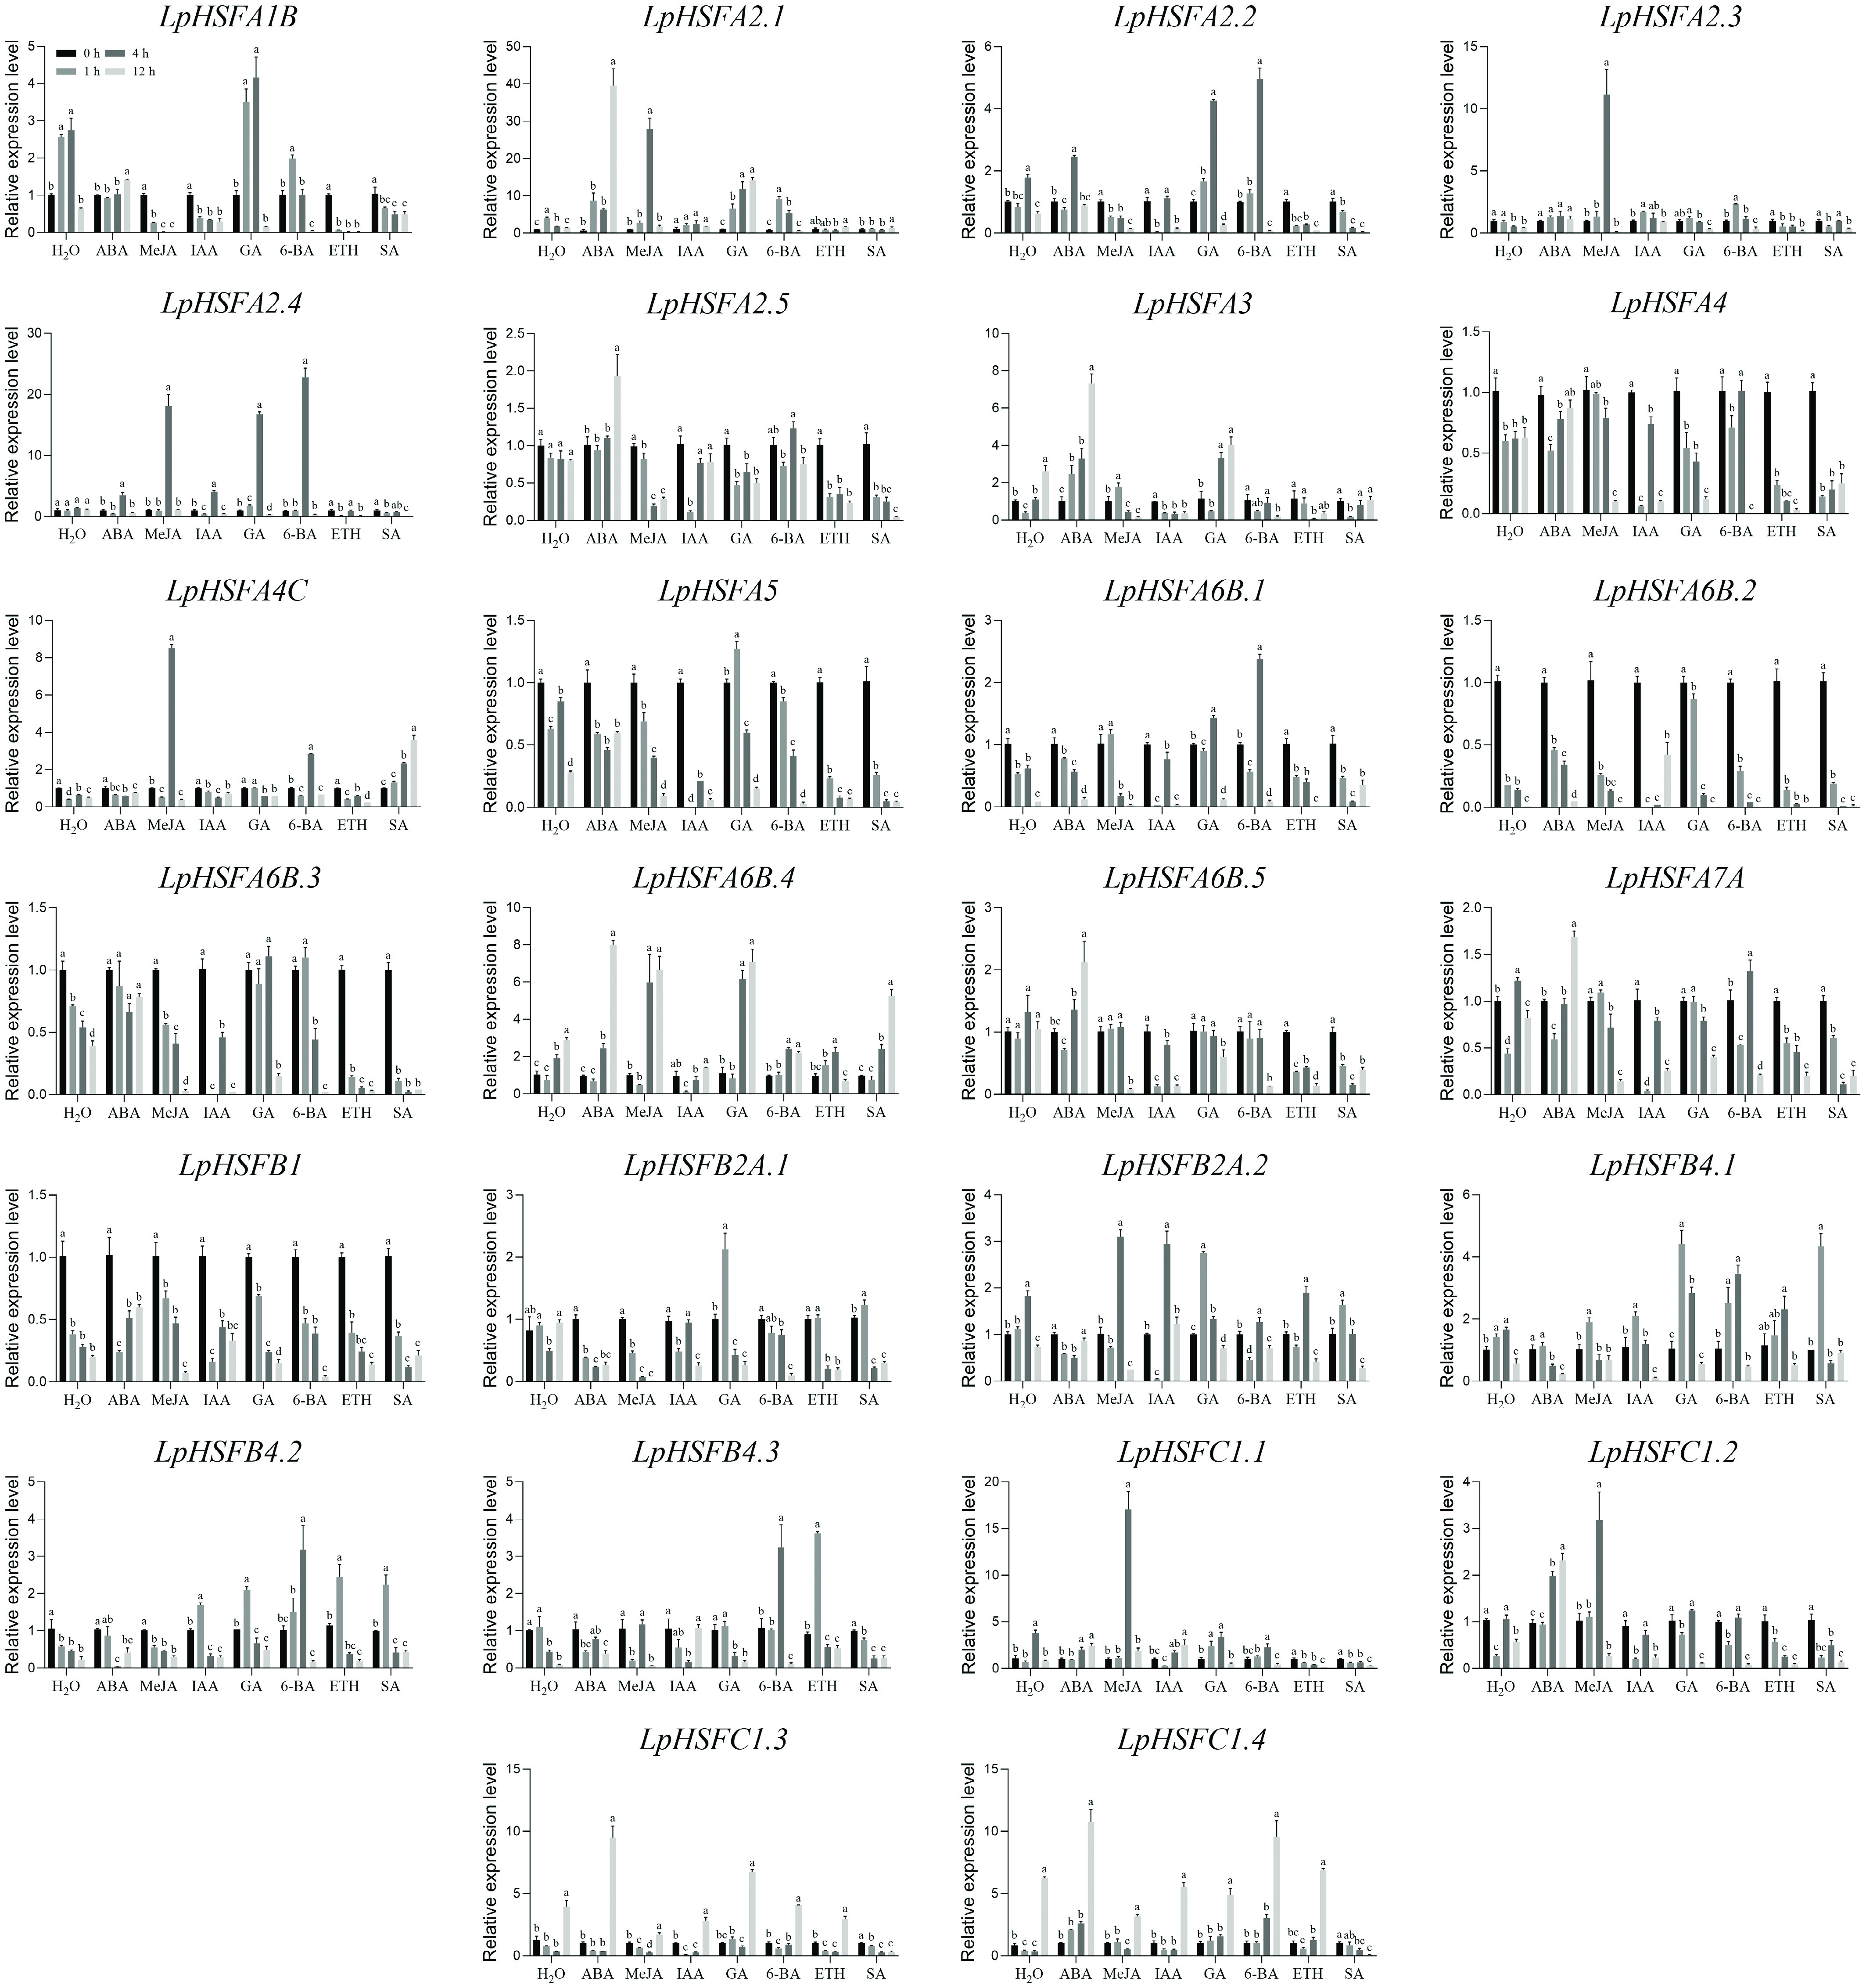
Figure 3.
Expression profiles of 26 LpHSF genes in response to ABA, MeJA, IAA, GA, 6-BA, ETH, and SA treatments. The vertical bars indicate standard error. The statistical significance was determined using Fisher's protected least significant difference (LSD) test (p < 0.05).
-
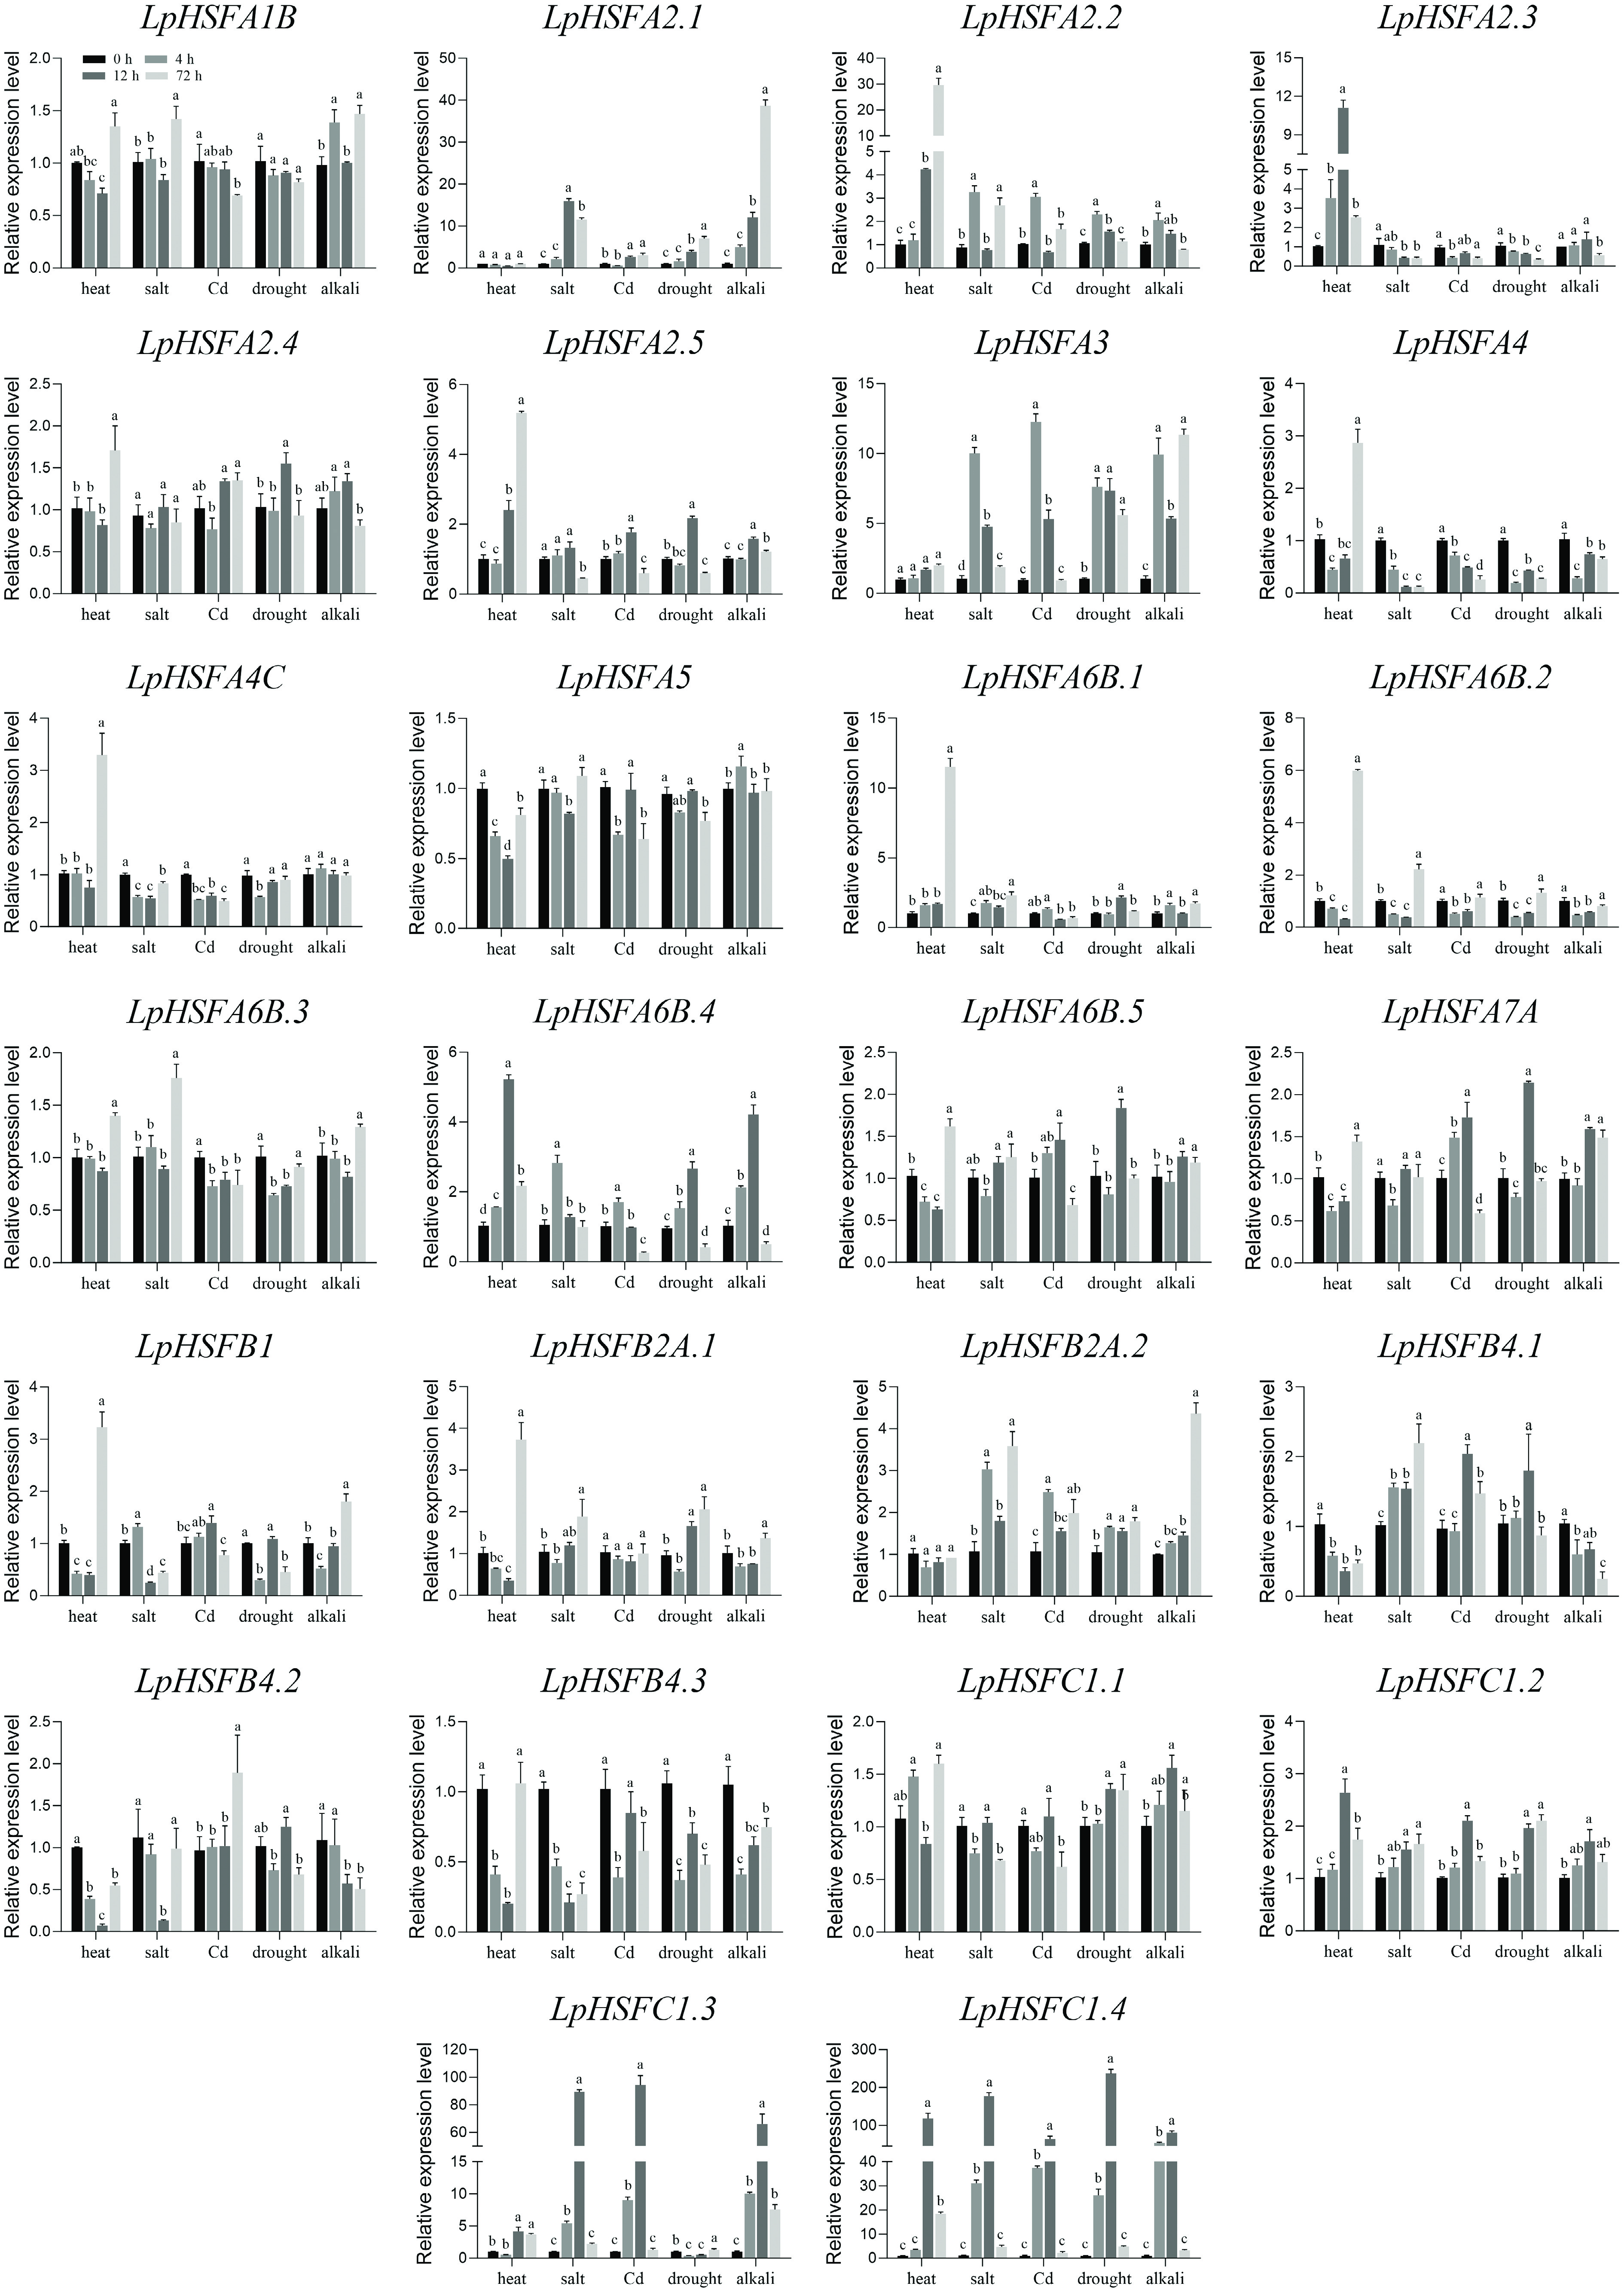
Figure 4.
Expression profiles of 26 LpHSF genes under heat, salt, Cd, drought, and alkali stress. The vertical bars indicate standard error. The statistical significance was determined using Fisher's protected least significant difference (LSD) test (p < 0.05).
-

Figure 5.
The expression profiles of the LpHSF gene family in perennial ryegrass under different abiotic stresses and hormone induction, and different tissues.
Figures
(5)
Tables
(0)